
Limosilactobacillus reuteri Fermented Brown Rice: A Product with Enhanced Bioactive Compounds and Antioxidant Potential

 ,
,  ,
, 
Abstract
:1. Introduction
2. Materials and Methods
2.1. Rice Samples
2.2. Chemicals
2.3. Microorganisms
2.4. Sample Preparation
2.4.1. Brown Rice Fermentation
2.4.2. Preparation of Extracts
2.5. Determination of Total Phenolic Content (TPC)
2.6. Determination of Total Flavonoid Content (TFC)
2.7. Determination of Antioxidant Activities of BR
2.7.1. DPPH Radical Scavenging Activity
2.7.2. ABTS Radical Scavenging Activity
2.7.3. Ferric Reducing Antioxidant Power (FRAP)
2.8. Identification of BR Bioactive Compounds Using UHPLC-Q-TOF-MS/MS
2.9. Cell Viability Assay
2.10. Cellular Antioxidant Activity (CAA)
2.11. Statistical Analysis
3. Results and Discussion
3.1. TPC and TFC
3.2. Antioxidant Assay (DPPH, ABTS, FRAP)
3.3. Untargeted Metabolomics Using UHPLC Q-TOF-MS/MS in Brown Rice Samples
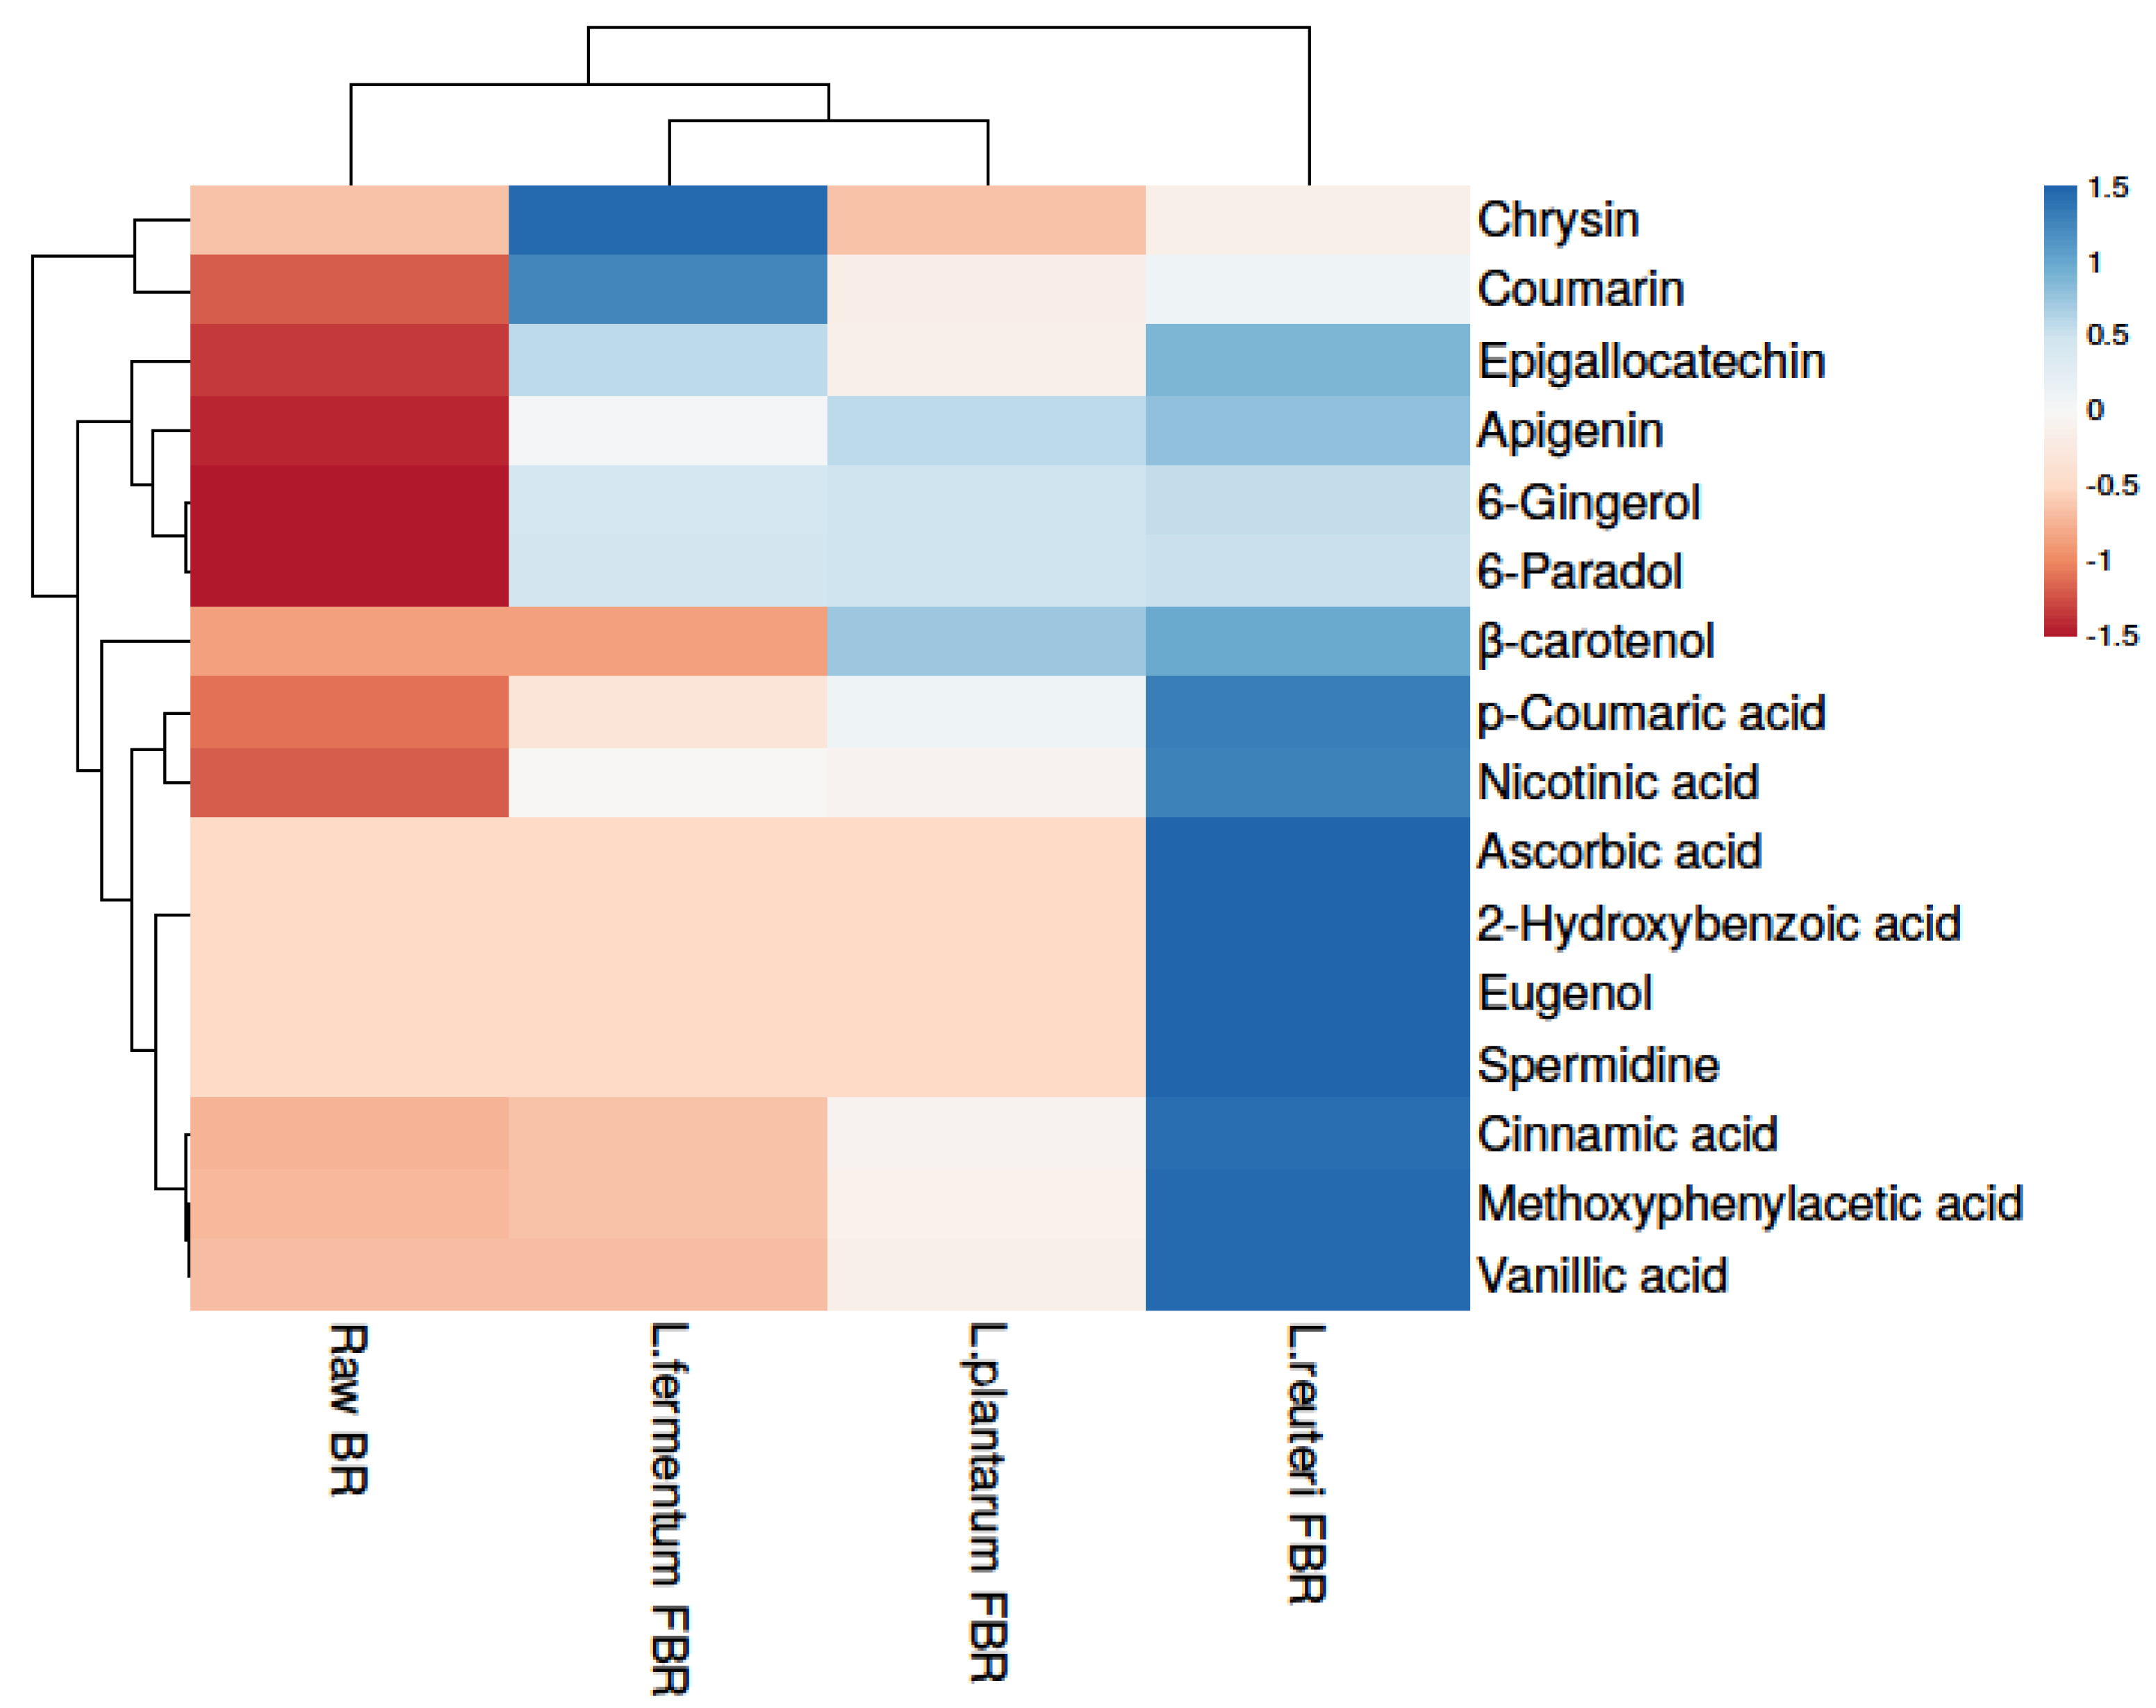
3.3.1. Phenolic Compounds
3.3.2. Levels of Amino Acid in Brown Rice
3.3.3. Level of Fatty Acid in Brown Rice Samples
3.4. Cell Viability Assay and Cellular Antioxidant Activity (CAA)
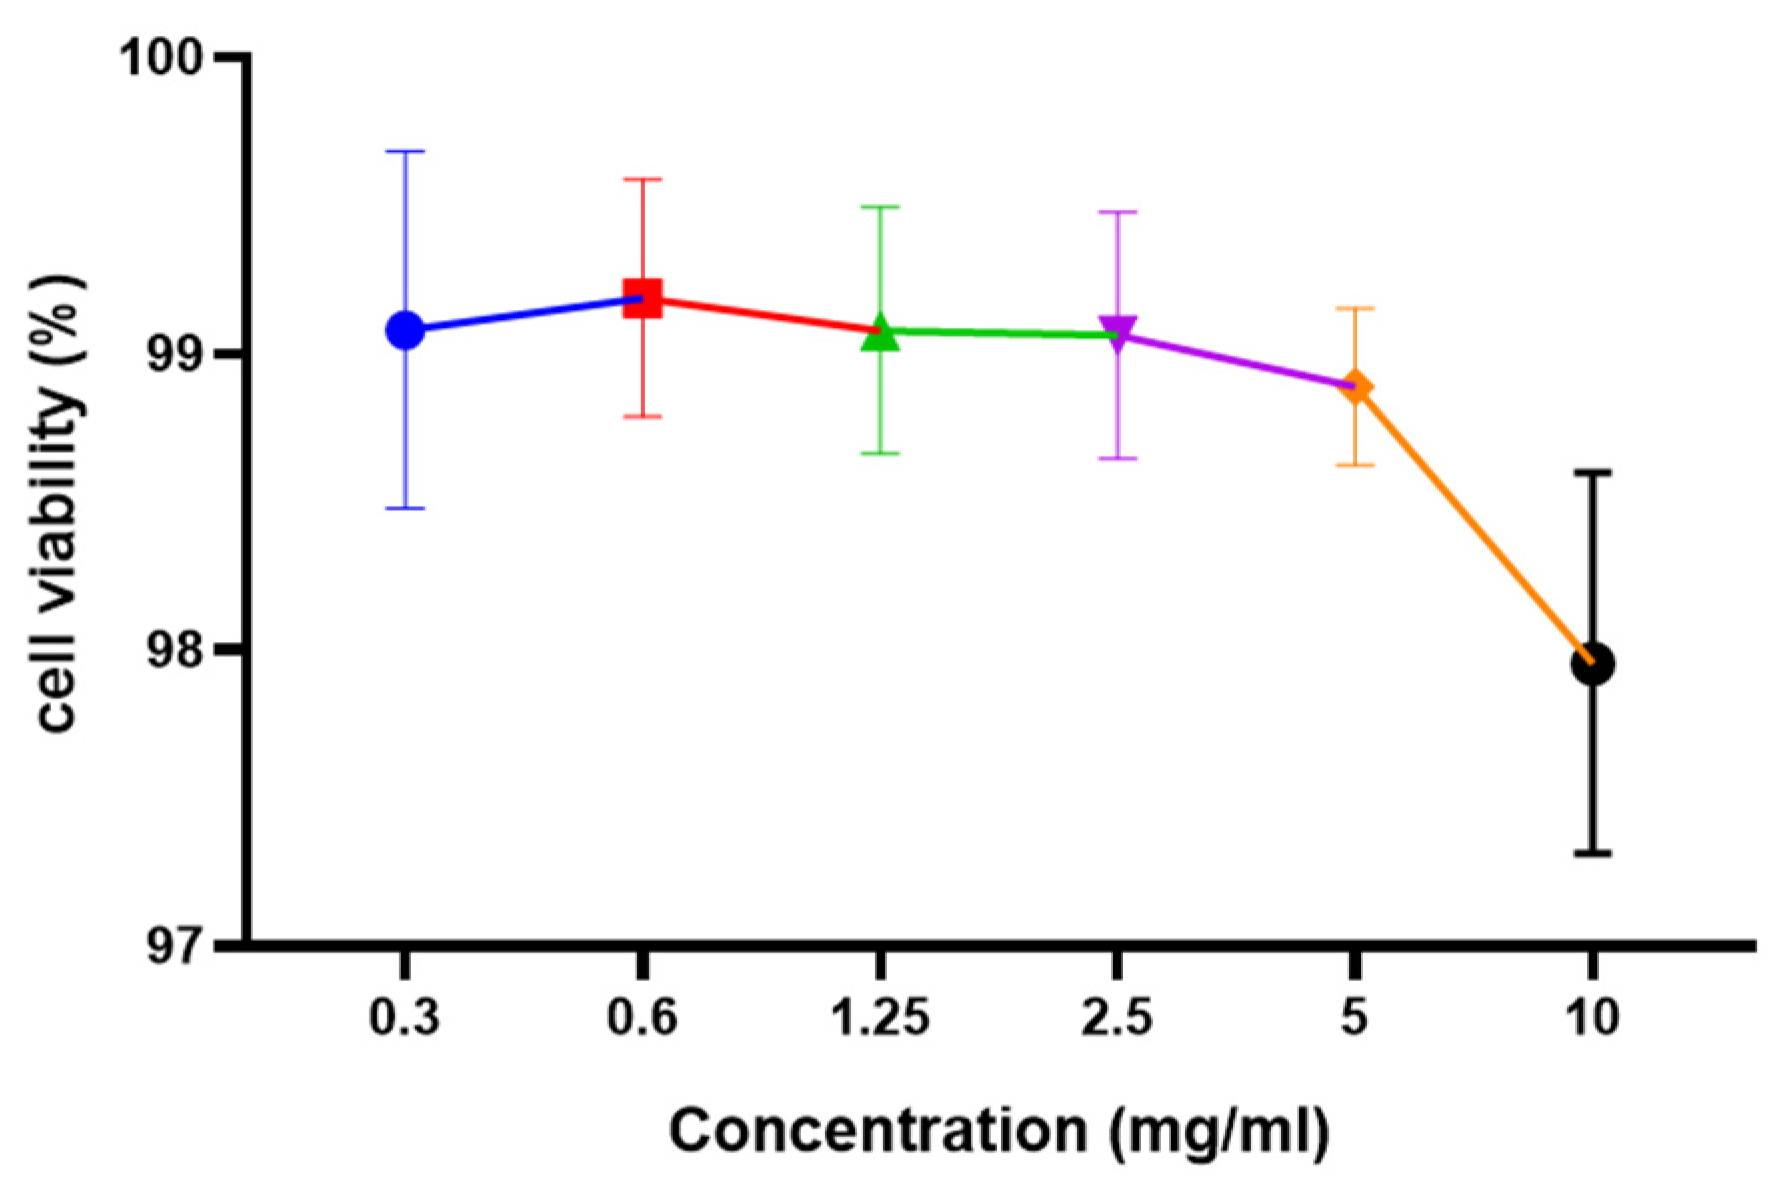
3.4.1. Cell Viability Assay
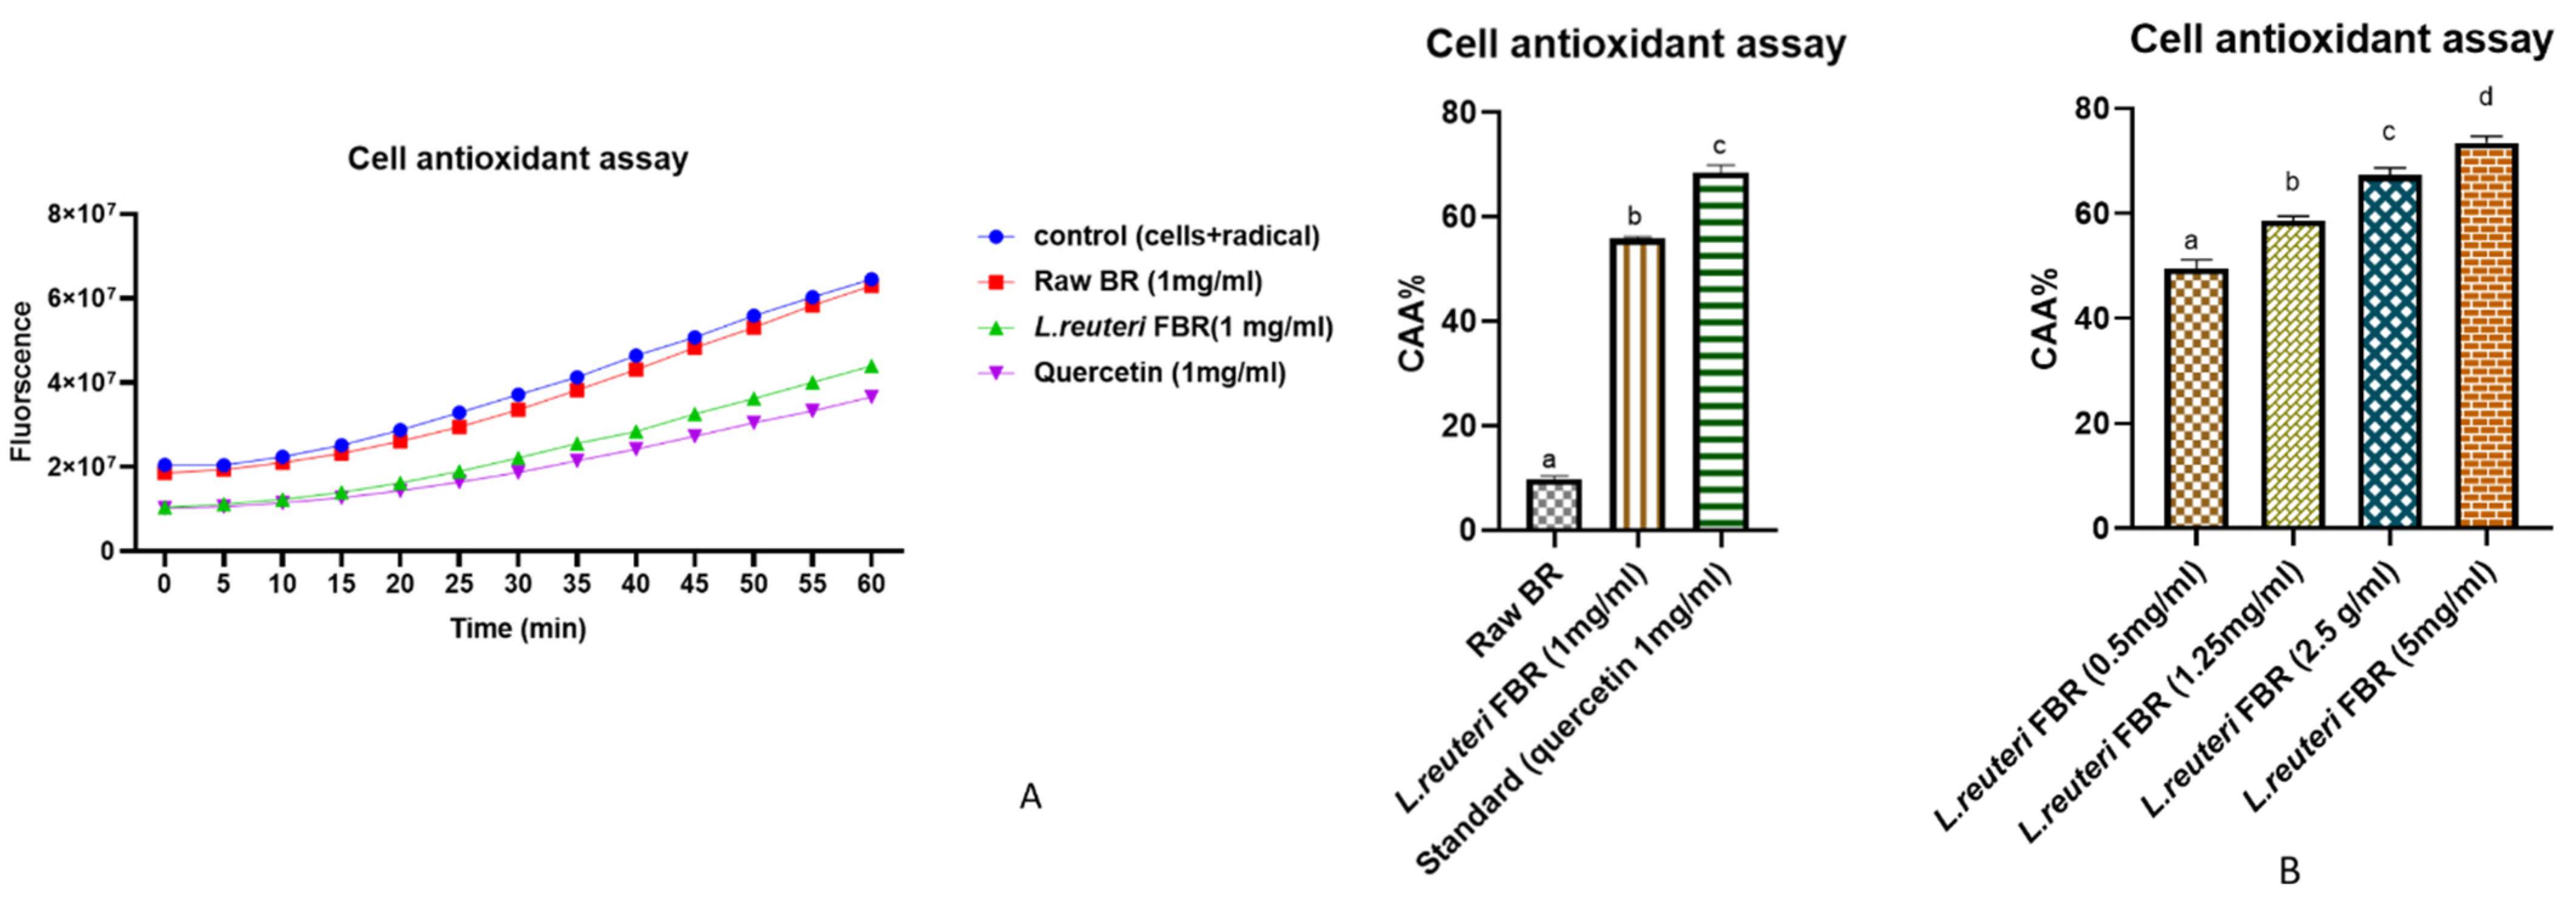
3.4.2. Cellular Antioxidant Activity (CAA)
4. Conclusions
Author Contributions
Funding
Institutional Review Board Statement
Informed Consent Statement
Data Availability Statement
Conflicts of Interest
Abbreviations
| BR | Raw brown rice |
| FBR | Fermented brown rice |
| ROS | Reactive oxygen species |
| GABA | Gamma-aminobutyric acid |
References
- Poljsak, B.; Šuput, D.; Milisav, I. Achieving the Balance between ROS and Antioxidants: When to Use the Synthetic Antioxidants. Oxidative Med. Cell. Longev. 2013, 2013, 1–11. [Google Scholar] [CrossRef]
- Tyagi, A.; Yeon, S.-J.; Daliri, E.; Chen, X.; Chelliah, R.; Oh, D.-H. Untargeted Metabolomics of Korean Fermented Brown Rice Using UHPLC Q-TOF MS/MS Reveal an Abundance of Potential Dietary Antioxidative and Stress-Reducing Compounds. Antioxidants 2021, 10, 626. [Google Scholar] [CrossRef] [PubMed]
- Tyagi, A.; Daliri, E.B.-M.; Ofosu, F.K.; Yeon, S.-J.; Oh, D.-H. Food-Derived Opioid Peptides in Human Health: A Review. Int. J. Mol. Sci. 2020, 21, 8825. [Google Scholar] [CrossRef]
- Sack, M.N.; Fyhrquist, F.Y.; Saijonmaa, O.J.; Fuster, V.; Kovacic, J.C. Basic biology of oxidative stress and the cardiovascular system: Part 1 of a 3-part series. J. Am. Coll. Cardiol. 2017, 70, 196–211. [Google Scholar] [CrossRef]
- Wang, Y.; Wu, Y.; Wang, Y.; Xu, H.; Mei, X.; Yu, D.; Wang, Y.; Li, W. Antioxidant Properties of Probiotic Bacteria. Nutrients 2017, 9, 521. [Google Scholar] [CrossRef]
- Callcott, E.; Blanchard, C.; Oli, P.; Santhakumar, A.B. Pigmented Rice-Derived Phenolic Compounds Reduce Biomarkers of Oxidative Stress and Inflammation in Human Umbilical Vein Endothelial Cells. Mol. Nutr. Food Res. 2018, 62, e1800840. [Google Scholar] [CrossRef]
- Shabbir, U.; Arshad, M.; Sameen, A.; Oh, D.-H. Crosstalk between Gut and Brain in Alzheimer’s Disease: The Role of Gut Microbiota Modulation Strategies. Nutrients 2021, 13, 690. [Google Scholar] [CrossRef]
- Okarter, N.; Liu, R.H. Health Benefits of Whole Grain Phytochemicals. Crit. Rev. Food Sci. Nutr. 2010, 50, 193–208. [Google Scholar] [CrossRef]
- Imam, M.U.; Musa, S.N.A.; Azmi, N.H.; Ismail, M. Effects of White Rice, Brown Rice and Germinated Brown Rice on Antioxidant Status of Type 2 Diabetic Rats. Int. J. Mol. Sci. 2012, 13, 12952–12969. [Google Scholar] [CrossRef] [PubMed]
- Pang, Y.; Ahmed, S.; Xu, Y.; Beta, T.; Zhu, Z.; Shao, Y.; Bao, J. Bound phenolic compounds and antioxidant properties of whole grain and bran of white, red and black rice. Food Chem. 2018, 240, 212–221. [Google Scholar] [CrossRef] [PubMed]
- Sandhu, K.S.; Punia, S. Enhancement of bioactive compounds in barley cultivars by solid substrate fermentation. J. Food Meas. Charact. 2017, 11, 1355–1361. [Google Scholar] [CrossRef]
- Salar, R.K.; Purewal, S.S.; Sandhu, K.S. Fermented pearl millet (Pennisetum glaucum) with in vitro DNA damage protection activity, bioactive compounds and antioxidant potential. Food Res. Int. 2017, 100, 204–210. [Google Scholar] [CrossRef]
- Salar, R.K.; Purewal, S.S. Improvement of DNA damage protection and antioxidant activity of biotransformed pearl millet (Pennisetum glaucum) cultivar PUSA-415 using Aspergillus oryzae MTCC 3107. Biocatal. Agric. Biotechnol. 2016, 8, 221–227. [Google Scholar] [CrossRef]
- Pradeep, P.; Sreerama, Y.N. Soluble and bound phenolics of two different millet genera and their milled fractions: Comparative evaluation of antioxidant properties and inhibitory effects on starch hydrolysing enzyme activities. J. Funct. Foods 2017, 35, 682–693. [Google Scholar] [CrossRef]
- Chang, X.; Ye, Y.; Pan, J.; Lin, Z.; Qiu, J.; Guo, X.; Lu, Y. Comparative assessment of phytochemical profiles and antioxidant activities in selected five varieties of wampee (Clausena lansium) fruits. Int. J. Food Sci. Technol. 2018, 53, 2680–2686. [Google Scholar] [CrossRef]
- Xiang, J.; Zhang, M.; Apea-Bah, F.B.; Beta, T. Hydroxycinnamic acid amide (HCAA) derivatives, flavonoid C-glycosides, phenolic acids and antioxidant properties of foxtail millet. Food Chem. 2019, 295, 214–223. [Google Scholar] [CrossRef]
- Zeng, Z.; Hu, X.; McClements, D.J.; Luo, S.; Liu, C.; Gong, E.S.; Huang, K. Hydrothermal stability of phenolic extracts of brown rice. Food Chem. 2019, 271, 114–121. [Google Scholar] [CrossRef]
- Daliri, E.B.-M.; Ofosu, F.K.; Chelliah, R.; Kim, J.-H.; Kim, J.-R.; Yoo, D.; Oh, D.-H. Untargeted Metabolomics of Fermented Rice Using UHPLC Q-TOF MS/MS Reveals an Abundance of Potential Antihypertensive Compounds. Foods 2020, 9, 1007. [Google Scholar] [CrossRef]
- Ti, H.; Guo, J.; Zhang, R.; Wei, Z.; Liu, L.; Bai, Y.; Zhang, M. Phenolic profiles and antioxidant activity in four tissue fractions of whole brown rice. RSC Adv. 2015, 5, 101507–101518. [Google Scholar] [CrossRef]
- Metsalu, T.; Vilo, J. ClustVis: A web tool for visualizing clustering of multivariate data using Principal Component Analysis and heatmap. Nucleic Acids Res. 2015, 43, W566–W570. [Google Scholar] [CrossRef] [PubMed]
- Ilowefah, M.; Bakar, J.; Ghazali, H.M.; Muhammad, K. Enhancement of Nutritional and Antioxidant Properties of Brown Rice Flour Through Solid-State Yeast Fermentation. Cereal Chem. J. 2017, 94, 519–523. [Google Scholar] [CrossRef]
- Gong, E.S.; Liu, C.; Li, B.; Zhou, W.; Chen, H.; Li, T.; Wu, J.; Zeng, Z.; Wang, Y.; Si, X.; et al. Phytochemical profiles of rice and their cellular antioxidant activity against ABAP induced oxidative stress in human hepatocellular carcinoma HepG2 cells. Food Chem. 2020, 318, 126484. [Google Scholar] [CrossRef]
- Huang, S.-H.; Ng, L.-T. Quantification of polyphenolic content and bioactive constituents of some commercial rice varieties in Taiwan. J. Food Compos. Anal. 2012, 26, 122–127. [Google Scholar] [CrossRef]
- Gong, E.S.; Luo, S.J.; Li, T.; Liu, C.M.; Zhang, G.W.; Chen, J.; Zeng, Z.C.; Liu, R.H. Phytochemical profiles and antioxidant activity of brown rice varieties. Food Chem. 2017, 227, 432–443. [Google Scholar] [CrossRef] [PubMed]
- Ghasemzadeh, A.; Jaafar, H.Z.E.; Juraimi, A.S.; Tayebi-Meigooni, A. Comparative Evaluation of Different Extraction Techniques and Solvents for the Assay of Phytochemicals and Antioxidant Activity of Hashemi Rice Bran. Molecules 2015, 20, 10822–10838. [Google Scholar] [CrossRef] [PubMed] [Green Version]
- Lin, C.-C. Antioxidant properties and antibacterial activity of fermented Monascus purpureus extracts. Food Biosci. 2019; 35, 100605. [Google Scholar]
- Rao, S.; Santhakumar, A.B.; Chinkwo, K.; Snell, P.; Oli, P.; Blanchard, C. Rice phenolic compounds and their response to variability in growing conditions. Cereal Chem. J. 2020, 97, 1045–1055. [Google Scholar] [CrossRef]
- Dai, T.; Chen, J.; McClements, D.J.; Hu, P.; Ye, X.; Liu, C.; Li, T. Protein–polyphenol interactions enhance the antioxidant capacity of phenolics: Analysis of rice glutelin–procyanidin dimer interactions. Food Funct. 2019, 10, 765–774. [Google Scholar] [CrossRef]
- Janarny, G.; Gunathilake, K. Changes in rice bran bioactives, their bioactivity, bioaccessibility and bioavailability with solid-state fermentation by Rhizopus oryzae. Biocatal. Agric. Biotechnol. 2020, 23, 101510. [Google Scholar] [CrossRef]
- Zeki, E.; KÖSE, S.B.E.; GARLI, S.; ŞAHİNDOKUYUCU, F.K. The Antioxidant Effect of p-Coumaric Acid Against Toluene-Induced Oxidative Stress in Rats. Kahramanmaraş Sütçü İmam Üniversitesi Tarım ve Doğa Dergisi 2021, 24, 473–478. [Google Scholar]
- El-Beltagi, H.S.; Mohamed, H.I.; Sofy, M.R. Role of Ascorbic acid, Glutathione and Proline Applied as Singly or in Sequence Combination in Improving Chickpea Plant through Physiological Change and Antioxidant Defense under Different Levels of Irrigation Intervals. Molecules 2020, 25, 1702. [Google Scholar] [CrossRef] [Green Version]
- Anlar, H.G. Chapter 23-Cinnamic Acid as a Dietary Antioxidant in Diabetes Treatment, 2nd ed.; Preedy, V.R., Ed.; Academic Press: Cambridge, MA, USA, 2020; pp. 235–243. [Google Scholar]
- Ahmadi, N.; Safari, S.; Mirazi, N.; Karimi, S.A.; Komaki, A. Effects of vanillic acid on Aβ1-40-induced oxidative stress and learning and memory deficit in male rats. Brain Res. Bull. 2021, 170, 264–273. [Google Scholar] [CrossRef]
- Adebo, O.A.; Njobeh, P.B.; Adebiyi, J.A.; Gbashi, S.; Phoku, J.Z.; Kayitesi, E. Fermented Pulse-Based Food Products in Developing Nations as Functional Foods and Ingredients. In Functional Food-Improve Health through Adequate Food; InTechOpen: London, UK, 2017; pp. 77–109. [Google Scholar]
- Gao, Y.; Guo, X.; Liu, Y.; Zhang, M.; Zhang, R.; Abbasi, A.M.; You, L.; Li, T.; Liu, R.H. Comparative assessment of phytochemical profile, antioxidant capacity and anti-proliferative activity in different varieties of brown rice (Oryza sativa L.). LWT 2018, 96, 19–25. [Google Scholar] [CrossRef]
- Girard-Lalancette, K.; Pichette, A.; Legault, J. Sensitive cell-based assay using DCFH oxidation for the determination of pro- and antioxidant properties of compounds and mixtures: Analysis of fruit and vegetable juices. Food Chem. 2009, 115, 720–726. [Google Scholar] [CrossRef]
- Chen, P.X.; Zhang, H.; Marcone, M.F.; Pauls, K.P.; Liu, R.; Tang, Y.; Zhang, B.; Renaud, J.B.; Tsao, R. Anti-inflammatory effects of phenolic-rich cranberry bean ( Phaseolus vulgaris L.) extracts and enhanced cellular antioxidant enzyme activities in Caco-2 cells. J. Funct. Foods 2017, 38, 675–685. [Google Scholar] [CrossRef]
- Grauzdytė, D.; Pukalskas, A.; Viranaicken, W.; El Kalamouni, C.; Venskutonis, P.R. Protective effects of Phyllanthus phillyreifolius extracts against hydrogen peroxide induced oxidative stress in HEK293 cells. PLoS ONE 2018, 13, e0207672. [Google Scholar] [CrossRef] [Green Version]
- Kellett, M.E.; Greenspan, P.; Pegg, R.B. Modification of the cellular antioxidant activity (CAA) assay to study phenolic antioxidants in a Caco-2 cell line. Food Chem. 2018, 244, 359–363. [Google Scholar] [CrossRef]


| S.NO | Sample | DPPH (mg Trolox Equiv./100 g, DW) | ABTS (mg Trolox Equiv./100 g, DW) | FRAP (mg Trolox Equiv./100 g, DW) | TPC (mg Gallic Acid Equiv./100 g, DW) | TFC (mg Catechin Equiv./100 g, DW) |
|---|---|---|---|---|---|---|
| 1 | Raw BR | 17.342 ± 0.44 d | 19.86 ± 0.86 d | 18.01 ± 0.74 d | 16.08 ± 0.49 d | 13.42 ± 0.80 d |
| 2 | L. fermentum FBR | 90.93 ± 0.74 c | 92.10 ± 0.81 c | 99.59 ± 1.60 b | 75.00 ± 0.01 c | 54.77 ± 1.02 c |
| 3 | L. reuteri FBR | 121.19 ± 1.0 a | 145.80 ± 0.99 a | 171.89 ± 0.71 a | 108.86 ± 0.63 a | 86.79 ± 0.83 a |
| 4 | L. plantarum FBR | 95.03 ± 0.81 b | 97.73 ± 0.47 b | 104.31 ± 0.48 b | 96.87 ± 0.94 b | 66.28 ± 0.71 b |
| S. No | Sample Name | Retention Time (min) | Peak Area | Adduct/Charge | Precursor Mass | Found at Mass | Molecular Formula | Tentative Phenolic Compound |
|---|---|---|---|---|---|---|---|---|
| 1 | Raw BR | Nd | Nd | [M − H]− | Nd | Nd | C25H36O | Beta-carotenol |
| L. plantarum FBR | 45.56 | 4.53 × 10⁵ | [M − H]− | 353.268 | 353.187 | |||
| L. fermentum FBR | Nd | Nd | [M − H]− | Nd | Nd | |||
| L. reuteri FBR | 45.45 | 5.19 × 10⁵ | [M − H]− | 353.268 | 353.284 | |||
| 2 | Raw BR | Nd | Nd | [M + H]+ | Nd | Nd | C10H12O2 | Eugenol |
| L. plantarum FBR | Nd | Nd | [M + H]+ | Nd | Nd | |||
| L. fermentum FBR | Nd | Nd | [M + H]+ | Nd | Nd | |||
| L. reuteri FBR | 20.81 | 2.24 × 10⁵ | [M + H]+ | 179.107 | 179.1067 | |||
| 3 | Raw BR | 33.80 | 2.20 × 10⁵ | [M − H]− | 293.177 | 293.1761 | C17H26O4 | 6-Gingerol |
| L. plantarum FBR | 33.80 | 2.08 × 10⁶ | [M − H]− | 293.177 | 293.176 | |||
| L. fermentum FBR | 33.81 | 2.03 × 10⁶ | [M − H]− | 293.177 | 293.1761 | |||
| L. reuteri FBR | 33.80 | 2.13 × 10⁶ | [M − H]− | 293.177 | 293.1762 | |||
| 4 | Raw BR | Nd | Nd | [M + H]+ | Nd | Nd | C15H10O4 | Chrysin |
| L. plantarum FBR | Nd | Nd | [M + H]+ | Nd | Nd | |||
| L. fermentum FBR | 14.78 | 4.09 × 10⁵ | [M + H]+ | 253.052 | 253.0524 | |||
| L. reuteri FBR | 14.81 | 1.01 × 10⁵ | [M + H]+ | 253.052 | 253.0527 | |||
| 5 | Raw BR | Nd | Nd | [M + H]+ | Nd | Nd | C16H8N2O5 | Apigenin |
| L. plantarum FBR | 14.79 | 4.68 × 10⁵ | [M + H]+ | 269.047 | 269.0457 | |||
| L. fermentum FBR | 14.78 | 3.38 × 10⁵ | [M + H]+ | 269.047 | 269.0457 | |||
| L. reuteri FBR | 14.78 | 5.15 × 10⁵ | [M + H]+ | 269.047 | 269.0458 | |||
| 6 | Raw BR | Nd | Nd | [M + H]+ | Nd | Nd | C9H6O2 | Coumarin |
| L. plantarum FBR | 1.92 | 1.24 × 10⁵ | [M + H]+ | 147.044 | 147.0444 | |||
| L. fermentum FBR | 1.87 | 2.94 × 10⁵ | [M + H]+ | 147.044 | 147.0447 | |||
| L. reuteri FBR | 1.90 | 1.55 × 10⁵ | [M + H]+ | 147.044 | 147.0445 | |||
| 7 | Raw BR | Nd | Nd | [M + H]+ | Nd | Nd | C15H14O7 | Epigallocatechin |
| L. plantarum FBR | 12.26 | 7.44 × 10⁵ | [M + H]+ | 305.071 | 305.067 | |||
| L. fermentum FBR | 12.28 | 1.20 × 10⁶ | [M + H]+ | 305.071 | 305.067 | |||
| L. reuteri FBR | 12.28 | 1.38 × 10⁶ | [M + H]+ | 305.071 | 305.067 | |||
| 8 | Raw BR | Nd | Nd | [M + H]+ | Nd | Nd | C7H19N3 | Spermidine |
| L. plantarum FBR | Nd | Nd | [M + H]+ | Nd | Nd | |||
| L. fermentum FBR | Nd | Nd | [M + H]+ | Nd | Nd | |||
| L. reuteri FBR | 0.96 | 8.75 × 10⁵ | [M + H]+ | 188.176 | 188.1761 | |||
| 9 | Raw BR | 38.06 | 3.21 × 10⁴ | [M − H]− | 277.182 | 277.1812 | C17H26O3 | 6-Paradol |
| L. plantarum FBR | 38.06 | 4.38 × 10⁵ | [M − H]− | 277.182 | 277.1812 | |||
| L. fermentum FBR | 38.08 | 4.33 × 10⁵ | [M − H]− | 277.182 | 277.1813 | |||
| L. reuteri FBR | 38.06 | 4.42 × 10⁵ | [M − H]− | 277.182 | 277.1812 | |||
| 10 | Raw BR | Nd | Nd | [M − H]− | Nd | Nd | C9H8O2 | Cinnamic acid |
| L. plantarum FBR | 4.01 | 3.26 × 10⁵ | [M − H]− | 147.046 | 147.0455 | |||
| L. fermentum FBR | 4.03 | 4.46 × 10⁴ | [M − H]− | 147.046 | 147.0456 | |||
| L. reuteri FBR | 3.98 | 1.09 × 10⁶ | [M − H]− | 147.046 | 147.0454 | |||
| 11 | Raw BR | Nd | Nd | [M + NH4]+ | Nd | Nd | C9H8O3 | p-Coumaric acid |
| L. plantarum FBR | 1.86 | 1.06 × 10⁶ | [M + NH4]+ | 182.081 | 182.0813 | |||
| L. fermentum FBR | 1.92 | 6.90 × 10⁵ | [M + NH4]+ | 182.081 | 182.0813 | |||
| L. reuteri FBR | 1.87 | 2.13 × 10⁶ | [M + NH4]+ | 182.081 | 182.0812 | |||
| 12 | Raw BR | Nd | Nd | [M − H]− | Nd | Nd | C9H10O3 | Methoxyphenylacetic acid |
| L. plantarum FBR | 15.28 | 5.20 × 10⁶ | [M − H]− | 165.057 | 165.0558 | |||
| L. fermentum FBR | 15.29 | 4.09 × 10⁵ | [M − H]− | 165.057 | 165.056 | |||
| L. reuteri FBR | 15.27 | 1.92 × 10⁷ | [M − H]− | 165.057 | 165.0557 | |||
| 13 | Raw BR | Nd | Nd | [M − H]− | Nd | Nd | C7H6O3 | Sesamol/2-Hydroxybenzoic acid |
| L. plantarum FBR | Nd | Nd | [M − H]− | Nd | Nd | |||
| L. fermentum FBR | Nd | Nd | [M − H]− | Nd | Nd | |||
| L. reuteri FBR | 19.63 | 3.24 × 10⁵ | [M − H]− | 137.025 | 137.0249 | |||
| 14 | Raw BR | Nd | Nd | [M − H]− | Nd | Nd | C8H8O | Vanillic acid |
| L. plantarum FBR | 15.28 | 3.18 × 10⁵ | [M − H]− | 119.051 | 119.0504 | |||
| L. fermentum FBR | Nd | Nd | [M − H]− | Nd | Nd | |||
| L. reuteri FBR | 15.27 | 1.27 × 10⁶ | [M − H]− | 119.051 | 119.0504 | |||
| 15 | Raw BR | Nd | Nd | Nd | Nd | Nd | C6H8O6 | Ascorbic acid (Vitamin C) |
| L. plantarum FBR | Nd | Nd | Nd | Nd | Nd | |||
| L. fermentum FBR | Nd | Nd | Nd | Nd | Nd | |||
| L. reuteri FBR | 1.02 | 3.05 × 10³ | [M + H]+ | 209.009 | 209.0107 |
| S. No | Sample Name | Retention Time (Min) | Peak Area | Adduct/ Charge | Precursor Mass | Found at Mass | Formula Finder Result | Amino Acid | |
|---|---|---|---|---|---|---|---|---|---|
| 1 | Raw BR | 1.00 | 1.52 × 10³ | [M + H]+ | 156.077 | 156.077 | C6H9N3O2 | Histidine | |
| L. plantarum FBR | 1.00 | 7.31 × 10⁵ | [M + H]+ | 156.077 | 156.077 | ||||
| L. fermentum FBR | 1.02 | 6.33 × 10⁵ | [M + H]+ | 156.077 | 156.0771 | ||||
| L. reuteri FBR | 1.02 | 7.45 × 10⁵ | [M + H]+ | 156.077 | 156.0771 | ||||
| 2 | Raw BR | ND | ND | [M − H]− | ND | ND | C6H14N2O2 | Lysine | |
| L. plantarum FBR | 1.02 | 9.16 × 10⁵ | [M − H]− | 145.099 | 145.0982 | ||||
| L. fermentum FBR | 1.02 | 2.17 × 10⁵ | [M − H]− | 145.099 | 145.0984 | ||||
| L. reuteri FBR | 1.02 | 1.40 × 10⁶ | [M − H]− | 145.099 | 145.0983 | ||||
| 3 | Raw BR | ND | ND | [M + H]+ | ND | ND | C5H11NO3S | Methionine | |
| L. plantarum FBR | 1.17 | 5.66 × 10⁵ | [M + H]+ | 166.053 | 166.0536 | ||||
| L. fermentum FBR | 1.17 | 5.33 × 10⁵ | [M + H]+ | 166.053 | 166.0537 | ||||
| L. reuteri FBR | 1.18 | 8.41 × 10⁵ | [M + H]+ | 166.053 | 166.0536 | ||||
| 4 | Raw BR | 1.17 | 2.56 × 10² | [M − H]− | 146.047 | 146.0457 | C5H9NO4 | Glutamic acid | |
| L. plantarum FBR | 1.47 | 3.18 × 10⁵ | [M − H]− | 146.047 | 146.046 | ||||
| L. fermentum FBR | 1.47 | 4.58 × 10⁴ | [M − H]− | 146.047 | 146.046 | ||||
| L. reuteri FBR | 1.47 | 2.65 × 10⁶ | [M − H]− | 146.047 | 146.0458 | ||||
| 5 | Raw BR | ND | ND | [M + H]− | ND | ND | C4H9NO2 | Gamma-aminobutyric acid | |
| L. plantarum FBR | 1.16 | 1.38 × 10⁵ | [M − H]− | 102.057 | 102.056 | ||||
| L. fermentum FBR | 1.16 | 2.76 × 10⁴ | [M − H]− | 102.057 | 102.0563 | ||||
| L. reuteri FBR | 1.16 | 1.28 × 10⁶ | [M − H]− | 102.057 | 102.0561 | ||||
| 6 | Raw BR | ND | ND | [M + H]+ | ND | ND | C6H14N4O2 | Arginine | |
| L. plantarum FBR | 1.11 | 2.81 × 10⁶ | [M + H]+ | 175.118 | 175.1183 | ||||
| L. fermentum FBR | 1.14 | 9.09 × 10⁵ | [M + H]+ | 175.118 | 175.1194 | ||||
| L. reuteri FBR | 1.11 | 4.99 × 10⁶ | [M + H]+ | 175.118 | 175.1184 | ||||
| 7 | Raw BR | ND | ND | [M − H]− | ND | ND | C5H11NO2 | Valine | |
| L. plantarum FBR | 1.49 | 6.15 × 10⁵ | [M − H]− | 116.073 | 116.0717 | ||||
| L. fermentum FBR | 1.50 | 1.37 × 10⁵ | [M − H]− | 116.073 | 116.0718 | ||||
| L. reuteri FBR | 1.45 | 7.61 × 10⁵ | [M − H]− | 116.073 | 116.0719 | ||||
| 8 | Raw BR | 1.14 | 1.19 × 10³ | [M − H]− | 132.031 | 132.0307 | C4H7NO4 | Aspartic acid | |
| L. plantarum FBR | 1.15 | 7.26 × 10⁴ | [M − H]− | 132.031 | 132.0303 | ||||
| L. fermentum FBR | 1.15 | 8.76 × 10³ | [M − H]− | 132.031 | 132.0305 | ||||
| L. reuteri FBR | 1.12 | 4.89 × 10⁵ | [M − H]− | 132.031 | 132.0302 | ||||
| 9 | Raw BR | ND | ND | [M − H]− | ND | ND | C9H11NO2 | Phenylalanine | |
| L. plantarum FBR | 4.01 | 2.26 × 10⁶ | [M − H]− | 164.072 | 164.0718 | ||||
| L. fermentum FBR | 4.03 | 3.50 × 10⁵ | [M − H]− | 164.072 | 164.072 | ||||
| L. reuteri FBR | 3.98 | 7.21 × 10⁶ | [M − H]− | 164.072 | 164.0718 | ||||
| 10 | Raw BR | ND | ND | [M − H]− | ND | ND | C5H12N2O2 | Ornithine | |
| L. plantarum FBR | 1.01 | 1.53 × 10⁵ | [M − H]− | 131.084 | 131.0827 | ||||
| L. fermentum FBR | 1.01 | 6.67 × 10⁴ | [M − H]− | 131.084 | 131.0828 | ||||
| L. reuteri FBR | 1.01 | 5.35 × 10⁵ | [M − H]− | 131.084 | 131.0827 | ||||
| 11 | Raw BR | 1.12 | 3.31 × 10² | [M − H]− | 104.036 | 104.0353 | C3H7NO3 | Serine | |
| L. plantarum FBR | 1.12 | 3.06 × 10⁵ | [M − H]− | 104.036 | 104.0353 | ||||
| L. fermentum FBR | 1.13 | 4.70 × 10⁴ | [M − H]− | 104.036 | 104.0356 | ||||
| L. reuteri FBR | 1.12 | 5.73 × 10⁵ | [M − H]− | 104.036 | 104.0353 | ||||
| 12 | Raw BR | ND | ND | [M − H]− | ND | ND | C6H13NO2 | Leucine | |
| L. plantarum FBR | 2.46 | 1.95 × 10⁶ | [M − H]− | 130.088 | 130.0874 | ||||
| L. fermentum FBR | 2.48 | 3.24 × 10⁵ | [M − H]− | 130.088 | 130.0875 | ||||
| L. reuteri FBR | 2.41 | 6.63 × 10⁶ | [M − H]− | 130.088 | 130.0875 | ||||
| 13 | Raw BR | ND | ND | [M − H]− | ND | ND | C5H10N2O3 | Glutamine | |
| L. plantarum FBR | ND | ND | [M − H]− | ND | ND | ||||
| L. fermentum FBR | ND | ND | [M − H]− | ND | ND | ||||
| L. reuteri FBR | 1.10 | 1.62 × 10⁴ | [M − H]− | 145.063 | 145.0619 | ||||
| 14 | Raw BR | ND | ND | [M − H]− | ND | ND | C9H11NO3 | Tyrosine | |
| L. plantarum FBR | 1.98 | 3.38 × 10⁵ | [M − H]− | 180.068 | 180.0667 | ||||
| L. fermentum FBR | ND | ND | [M − H]− | ND | ND | ||||
| L. reuteri FBR | 1.89 | 4.08 × 10⁵ | [M − H]− | 180.068 | 180.0667 | ||||
| 15 | Raw BR | ND | ND | [M − H]− | ND | ND | C4H9NO3 | Threonine | |
| L. plantarum FBR | ND | ND | [M − H]− | ND | ND | ||||
| L. fermentum FBR | ND | ND | [M − H]− | ND | ND | ||||
| L. reuteri FBR | 1.14 | 1.14 × 10⁵ | [M − H]− | 118.052 | 118.051 | ||||
| 16 | Raw BR | ND | ND | [M − H]− | ND | ND | C4H8N2O3 | Asparagine | |
| L. plantarum FBR | 1.10 | 6.8 × 10⁴ | [M − H]− | 131.047 | 131.0462 | ||||
| L. fermentum FBR | 1.13 | 3.41 × 10⁴ | [M − H]− | 131.047 | 131.0464 | ||||
| L. reuteri FBR | 1.13 | 3.01 × 10⁵ | [M − H]− | 131.047 | 131.0461 | ||||
| 17 | Raw BR | ND | ND | [M − H]− | ND | ND | C11H12N2O2 | Tryptophan | |
| L. plantarum FBR | 7.64 | 6.19 × 10⁵ | [M − H]− | 203.084 | 203.0829 | ||||
| L. fermentum FBR | 7.66 | 7.77 × 10⁴ | [M − H]− | 203.084 | 203.0832 | ||||
| L. reuteri FBR | 7.61 | 2.78 × 10⁶ | [M − H]− | 203.084 | 203.0829 | ||||
| 18 | Raw BR | ND | ND | [M + H]+ | ND | ND | C5H9NO2 | Proline | |
| L. plantarum FBR | ND | ND | [M + H]+ | ND | ND | ||||
| L. fermentum FBR | ND | ND | [M + H]+ | ND | ND | ||||
| L. reuteri FBR | 0.86 | 7.90 × 10⁵ | [M +H]+ | 116.07 | 116.0704 | ||||
| S. No | Sample Name | Retention Time | Peak Area | Adduct/Charge | Precursor Mass | Found at Mass | Formula Finder Result | Fatty Acid |
|---|---|---|---|---|---|---|---|---|
| 1 | Raw BR | 39.97 | 1.91 × 10² | [M − H]− | 255.234 | 255.2331 | C16H32O2 | Palmitic Acid |
| L. plantarum FBR | 1.94 | 5.15 × 10³ | [M − H]− | 255.234 | 255.2331 | |||
| L. fermentum FBR | 28.03 | 4.28 × 10³ | [M − H]− | 255.234 | 255.2332 | |||
| L. reuteri FBR | 23.73 | 1.53 × 10⁴ | [M − H]− | 255.234 | 255.2332 | |||
| 2 | Raw BR | ND | ND | [M + H]+ | ND | ND | C5H10O2 | Valeric acid |
| L. plantarum FBR | ND | ND | [M + H]+ | ND | ND | |||
| L. fermentum FBR | ND | ND | [M + H]+ | ND | ND | |||
| L. reuteri FBR | 22.88 | 1.02 × 10³ | [M + H]+ | 185.066 | 185.0663 | |||
| 3 | Raw BR | 46.24 | 5.29 × 10³ | [M − H]− | 279.234 | 279.2332 | C18H32O2 | Linoleic Acid |
| L. plantarum FBR | 46.26 | 6.56 × 10⁵ | [M − H]− | 279.234 | 279.2332 | |||
| L. fermentum FBR | 46.24 | 6.16 × 10⁵ | [M − H]− | 279.234 | 279.2334 | |||
| L. reuteri FBR | 46.25 | 6.64 × 10⁵ | [M − H]− | 279.234 | 279.2334 | |||
| 4 | Raw BR | 47.28 | 1.45 × 10⁵ | [M + H]+ | 271.264 | 271.2637 | C17H34O2 | Heptadecanoic acid |
| L. plantarum FBR | 47.28 | 1.44 × 10⁶ | [M + H]+ | 271.264 | 271.2636 | |||
| L. fermentum FBR | 47.26 | 1.44 × 10⁶ | [M + H]+ | 271.264 | 271.2637 | |||
| L. reuteri FBR | 47.27 | 1.45 × 10⁶ | [M + H]+ | 271.264 | 271.2638 | |||
| 5 | Raw BR | 27.69 | 5.28 × 10³ | [M − H]− | 283.265 | 283.2644 | C18H36O2 | Stearic acid |
| L. plantarum FBR | 49.10 | 1.23 × 10⁶ | [M − H]− | 283.265 | 283.2645 | |||
| L. fermentum FBR | 49.09 | 1.20 × 10⁶ | [M − H]− | 283.265 | 283.2644 | |||
| L. reuteri FBR | 49.10 | 1.24 × 10⁶ | [M − H]− | 283.265 | 283.2645 | |||
| 6 | Raw BR | 34.57 | 3.18 × 10⁴ | [M − H]− | 243.161 | 243.1605 | C13H24O4 | Tridecanedioic acid |
| L. plantarum FBR | 34.58 | 2.98 × 10⁵ | [M − H]− | 243.161 | 243.1606 | |||
| L. fermentum FBR | 34.58 | 2.90 × 10⁵ | [M − H]− | 243.161 | 243.1604 | |||
| L. reuteri FBR | 34.57 | 3.01 × 10⁵ | [M − H]− | 243.161 | 243.1605 | |||
| 7 | Raw BR | ND | ND | [M + H]+ | ND | ND | C12H20O3 | Traumatin |
| L. plantarum FBR | 32.80 | 2.64 × 10⁵ | [M + H]+ | 213.149 | 213.1491 | |||
| L. fermentum FBR | 32.82 | 4.26 × 10⁵ | [M + H]+ | 213.149 | 213.1492 | |||
| L. reuteri FBR | 32.82 | 5.20 × 10⁵ | [M + H]+ | 213.149 | 213.1492 | |||
| 8 | Raw BR | ND | ND | [M − H]− | ND | ND | C18H32O5 | Octadecadienoic acid/Corchorifatty acid F |
| L. plantarum FBR | ND | ND | [M − H]− | ND | ND | |||
| L. fermentum FBR | ND | ND | [M − H]− | ND | ND | |||
| L. reuteri FBR | 30.87 | 4.08 × 10⁵ | [M − H]− | 327.219 | 327.2181 | |||
| 9 | Raw BR | ND | ND | [M − H]− | ND | ND | C6H12O4 | Mevalonic Acid |
| L. plantarum FBR | 3.49 | 7.39 × 10⁴ | [M − H]− | 147.067 | 147.0667 | |||
| L. fermentum FBR | ND | ND | [M − H]− | ND | ND | |||
| L. reuteri FBR | 3.47 | 3.13 × 10⁵ | [M − H]− | 147.067 | 147.0667 | |||
| 10 | Raw BR | 22.59 | 3.99 × 10⁴ | [M − H]− | 187.099 | 187.0979 | C9H16O4 | Azelaic Acid |
| L. plantarum FBR | 22.50 | 2.77 × 10⁵ | [M − H]− | 187.099 | 187.0979 | |||
| L. fermentum FBR | 22.61 | 6.12 × 10⁴ | [M − H]− | 187.099 | 187.0978 | |||
| L. reuteri FBR | 22.50 | 6.25 × 10⁵ | [M − H]− | 187.099 | 187.0979 | |||
| 11 | Raw BR | ND | ND | [M − H]− | ND | ND | C9H18O3 | 9-Hydroxynonanoic acid |
| L. plantarum FBR | 23.49 | 3.10 × 10⁴ | [M − H]− | 173.119 | 173.1187 | |||
| L. fermentum FBR | 23.50 | 3.49 × 10³ | [M − H]− | 173.119 | 173.1188 | |||
| L. reuteri FBR | 23.48 | 1.39 × 10⁵ | [M − H]− | 173.119 | 173.1186 | |||
| 12 | Raw BR | 39.06 | 2.45 × 10³ | [M − H]− | 313.24 | 313.2389 | C18H34O4 | Octadecanedioic acid |
| L. plantarum FBR | 39.07 | 3.52 × 10⁵ | [M − H]− | 313.24 | 313.2388 | |||
| L. fermentum FBR | 39.06 | 3.22 × 10⁵ | [M − H]− | 313.24 | 313.2389 | |||
| L. reuteri FBR | 39.06 | 3.83 × 10⁵ | [M − H]− | 313.24 | 313.2386 | |||
| 13 | Raw BR | ND | ND | [M − H]− | ND | ND | C18H34O5 | Pinellic acid |
| L. plantarum FBR | 33.48 | 3.12 × 10⁵ | [M − H]− | 329.234 | 329.2337 | |||
| L. fermentum FBR | 33.48 | 3.54 × 10⁴ | [M − H]− | 329.234 | 329.2339 | |||
| L. reuteri FBR | 32.82 | 7.37 × 10⁶ | [M − H]− | 329.234 | 329.2331 |
Publisher’s Note: MDPI stays neutral with regard to jurisdictional claims in published maps and institutional affiliations. |
© 2021 by the authors. Licensee MDPI, Basel, Switzerland. This article is an open access article distributed under the terms and conditions of the Creative Commons Attribution (CC BY) license (https://creativecommons.org/licenses/by/4.0/).
Share and Cite
Tyagi, A.; Shabbir, U.; Chelliah, R.; Daliri, E.B.-M.; Chen, X.; Oh, D.-H. Limosilactobacillus reuteri Fermented Brown Rice: A Product with Enhanced Bioactive Compounds and Antioxidant Potential. Antioxidants 2021, 10, 1077. https://doi.org/10.3390/antiox10071077
Tyagi A, Shabbir U, Chelliah R, Daliri EB-M, Chen X, Oh D-H. Limosilactobacillus reuteri Fermented Brown Rice: A Product with Enhanced Bioactive Compounds and Antioxidant Potential. Antioxidants. 2021; 10(7):1077. https://doi.org/10.3390/antiox10071077
Chicago/Turabian StyleTyagi, Akanksha, Umair Shabbir, Ramachandran Chelliah, Eric Banan-Mwine Daliri, Xiuqin Chen, and Deog-Hwan Oh. 2021. "Limosilactobacillus reuteri Fermented Brown Rice: A Product with Enhanced Bioactive Compounds and Antioxidant Potential" Antioxidants 10, no. 7: 1077. https://doi.org/10.3390/antiox10071077
APA StyleTyagi, A., Shabbir, U., Chelliah, R., Daliri, E. B.-M., Chen, X., & Oh, D.-H. (2021). Limosilactobacillus reuteri Fermented Brown Rice: A Product with Enhanced Bioactive Compounds and Antioxidant Potential. Antioxidants, 10(7), 1077. https://doi.org/10.3390/antiox10071077