
8-Week Supplementation of 2S-Hesperidin Modulates Antioxidant and Inflammatory Status after Exercise until Exhaustion in Amateur Cyclists

 ,
, 
 and
and 
Abstract
1. Introduction
2. Methodology
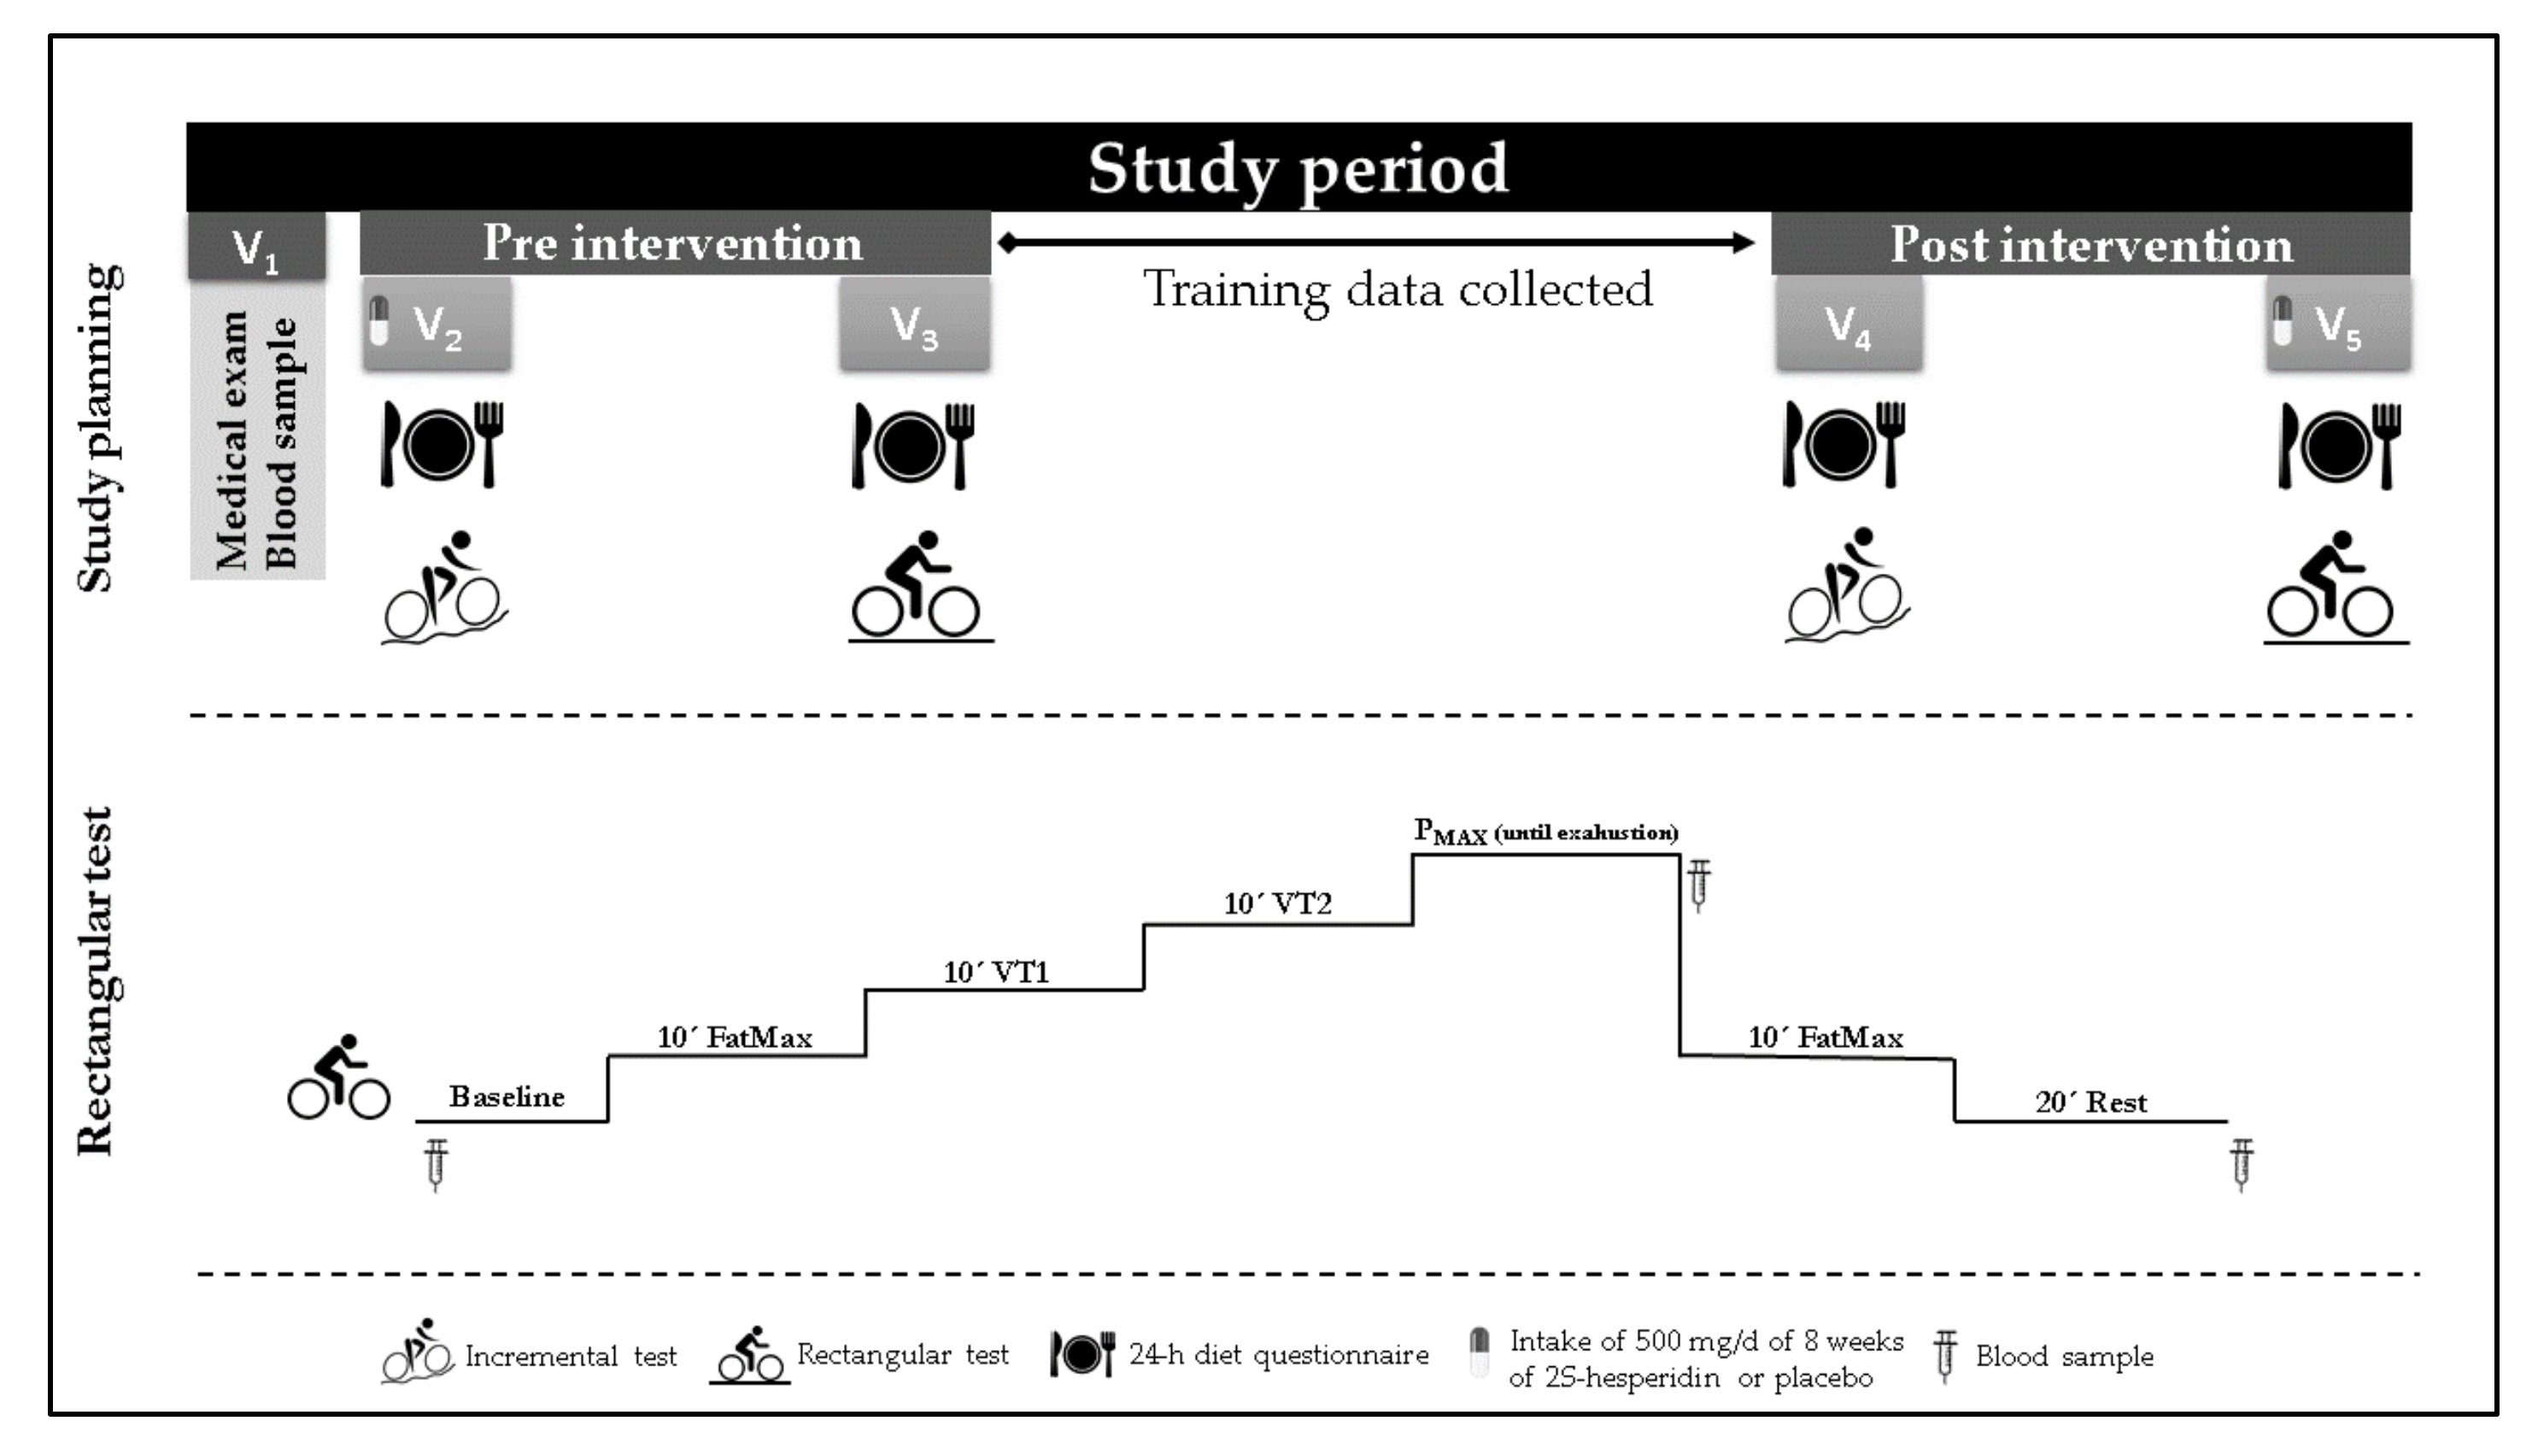
2.1. Study Design
2.2. Participants
2.3. Procedures
2.4. Testing
2.4.1. Medical Exam
2.4.2. Maximal Test
2.4.3. Rectangular Test
2.4.4. Blood Samples
2.4.5. Urine Samples
2.5. Antioxidant and Inflammatory State Markers
2.5.1. TBARS (Lipoperoxidation Biomarker)
2.5.2. Catalase (CAT)
2.5.3. Superoxide Dismutase (SOD)
2.5.4. Glutathione Reduced (GSH) and Oxidized (GSSG)
2.5.5. Hemoxygenase 1 (HO1)
2.5.6. Measurement of Cytokines IL6, TNFα and MCP1
2.5.7. C reactive Protein (CRP)
2.6. Statistical Analyses
3. Results
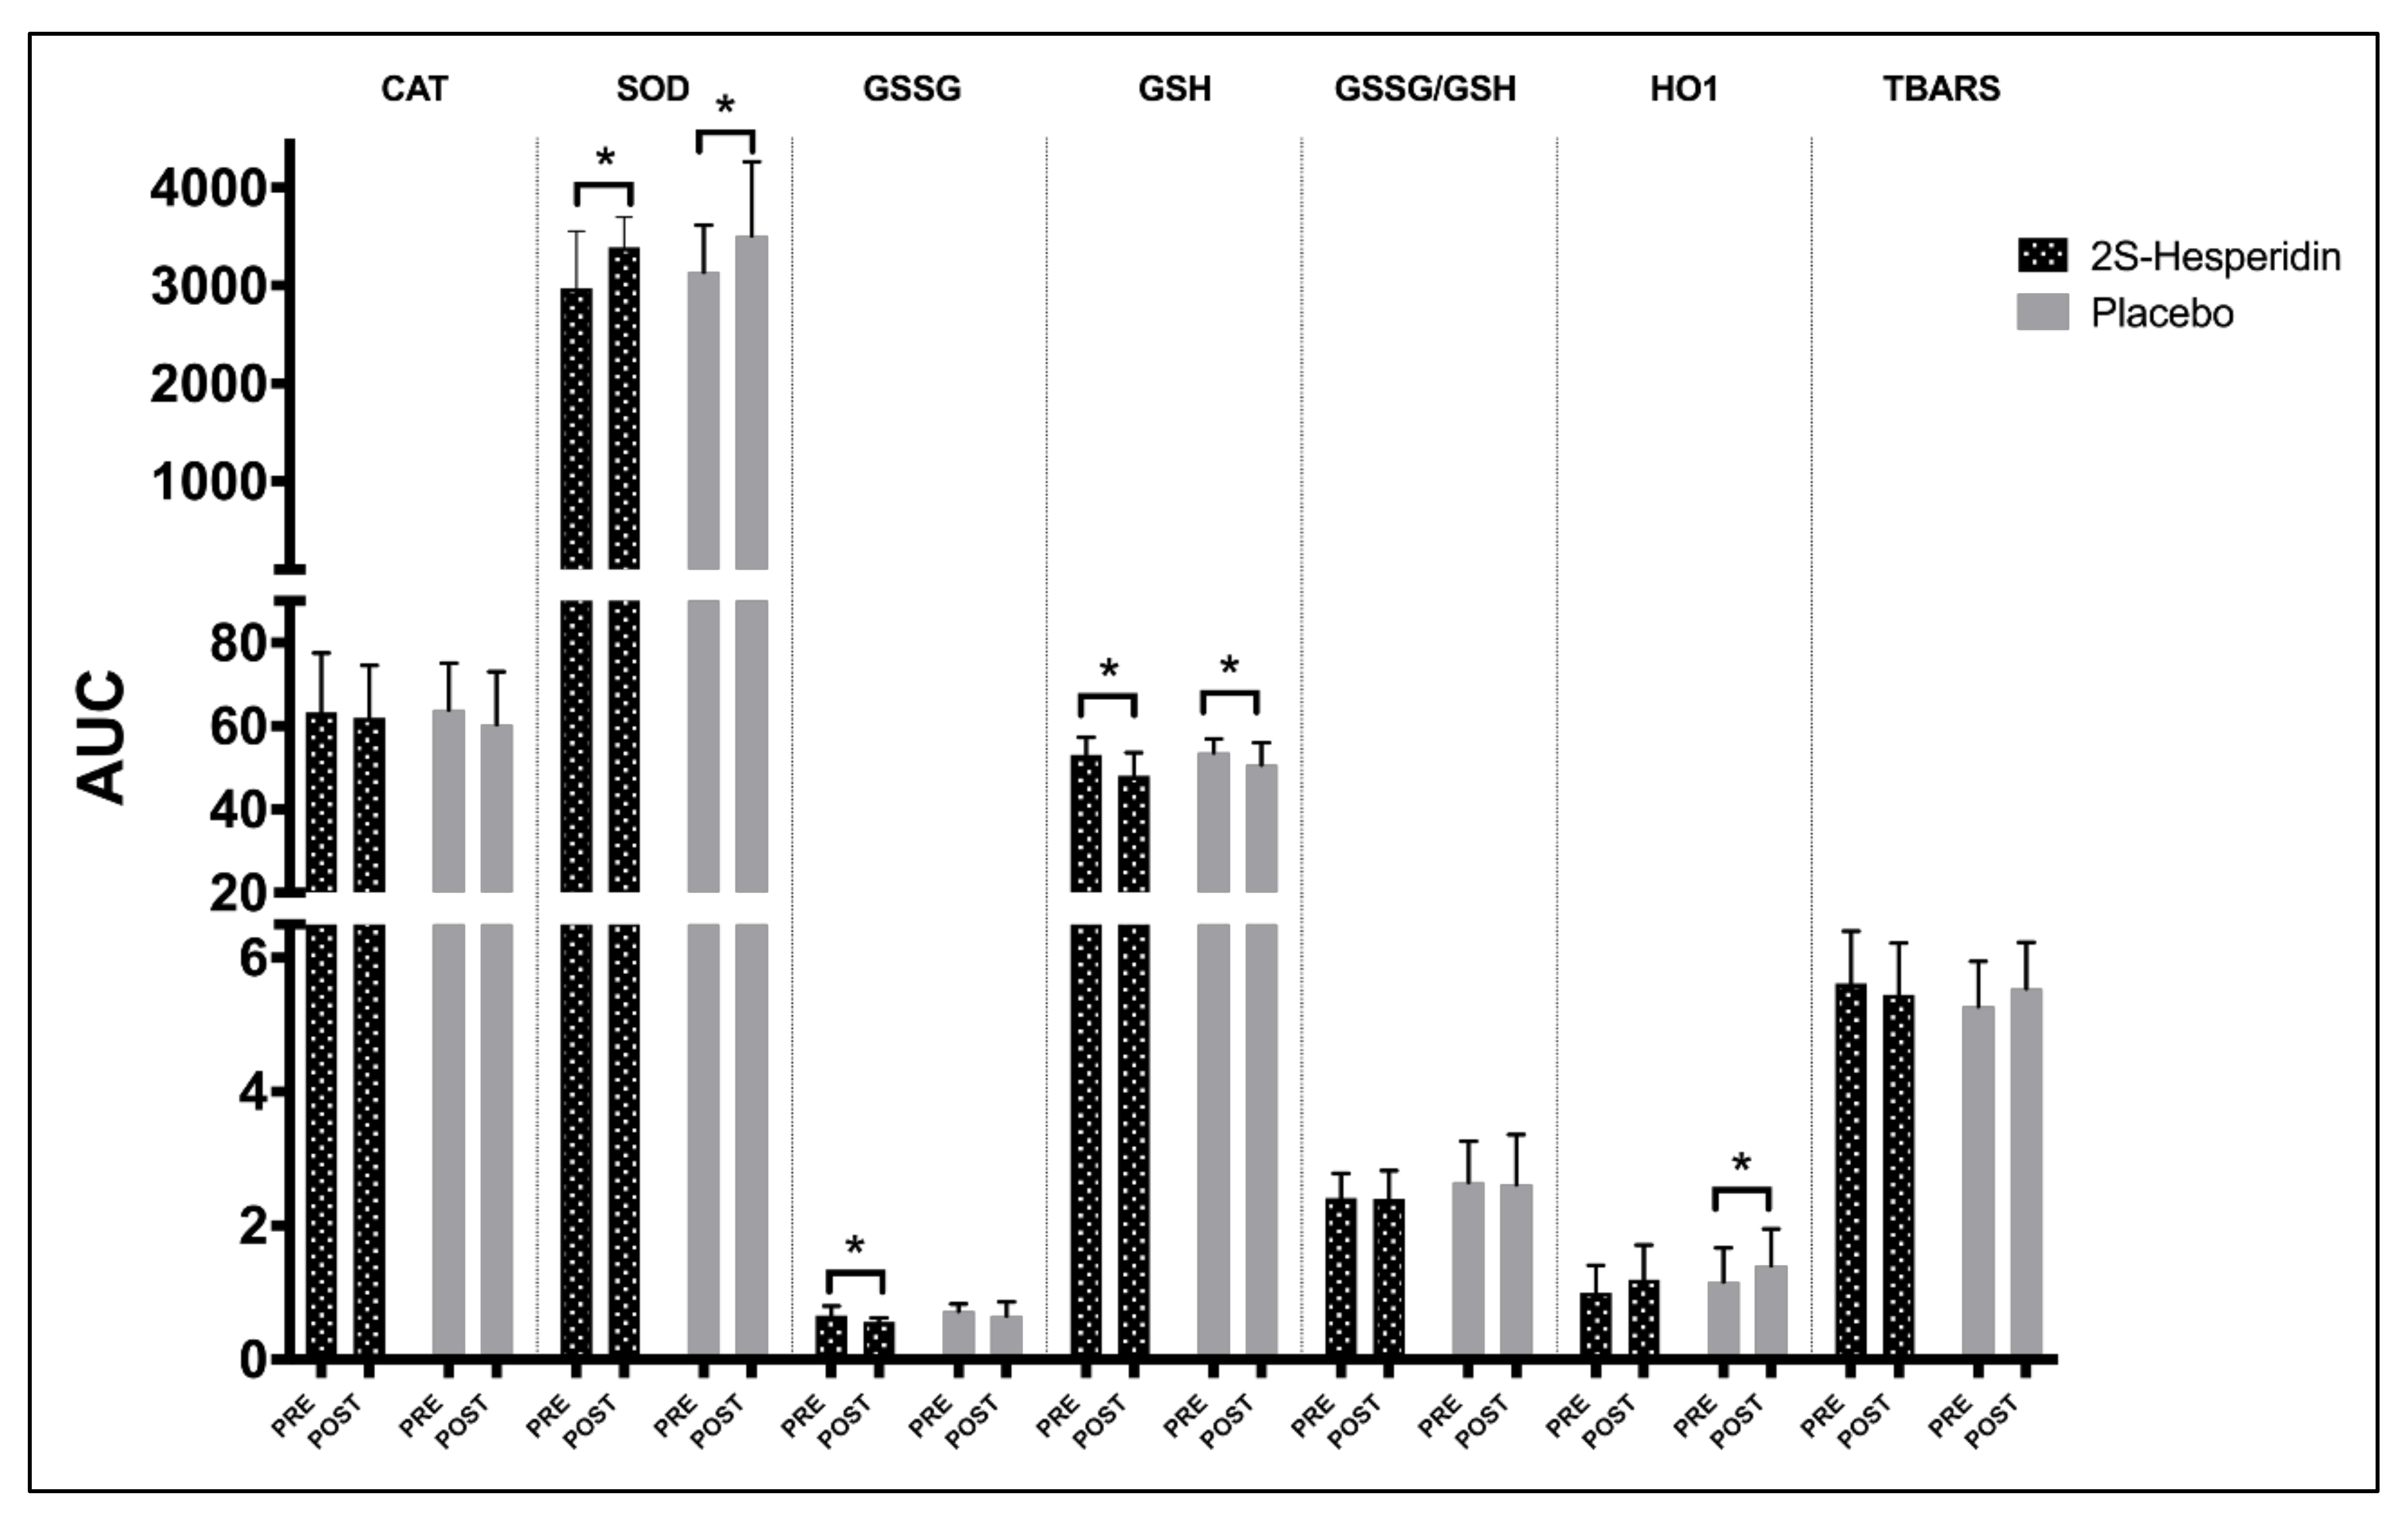
3.1. Biomarkers of Antioxidants and Oxidants Endogenous
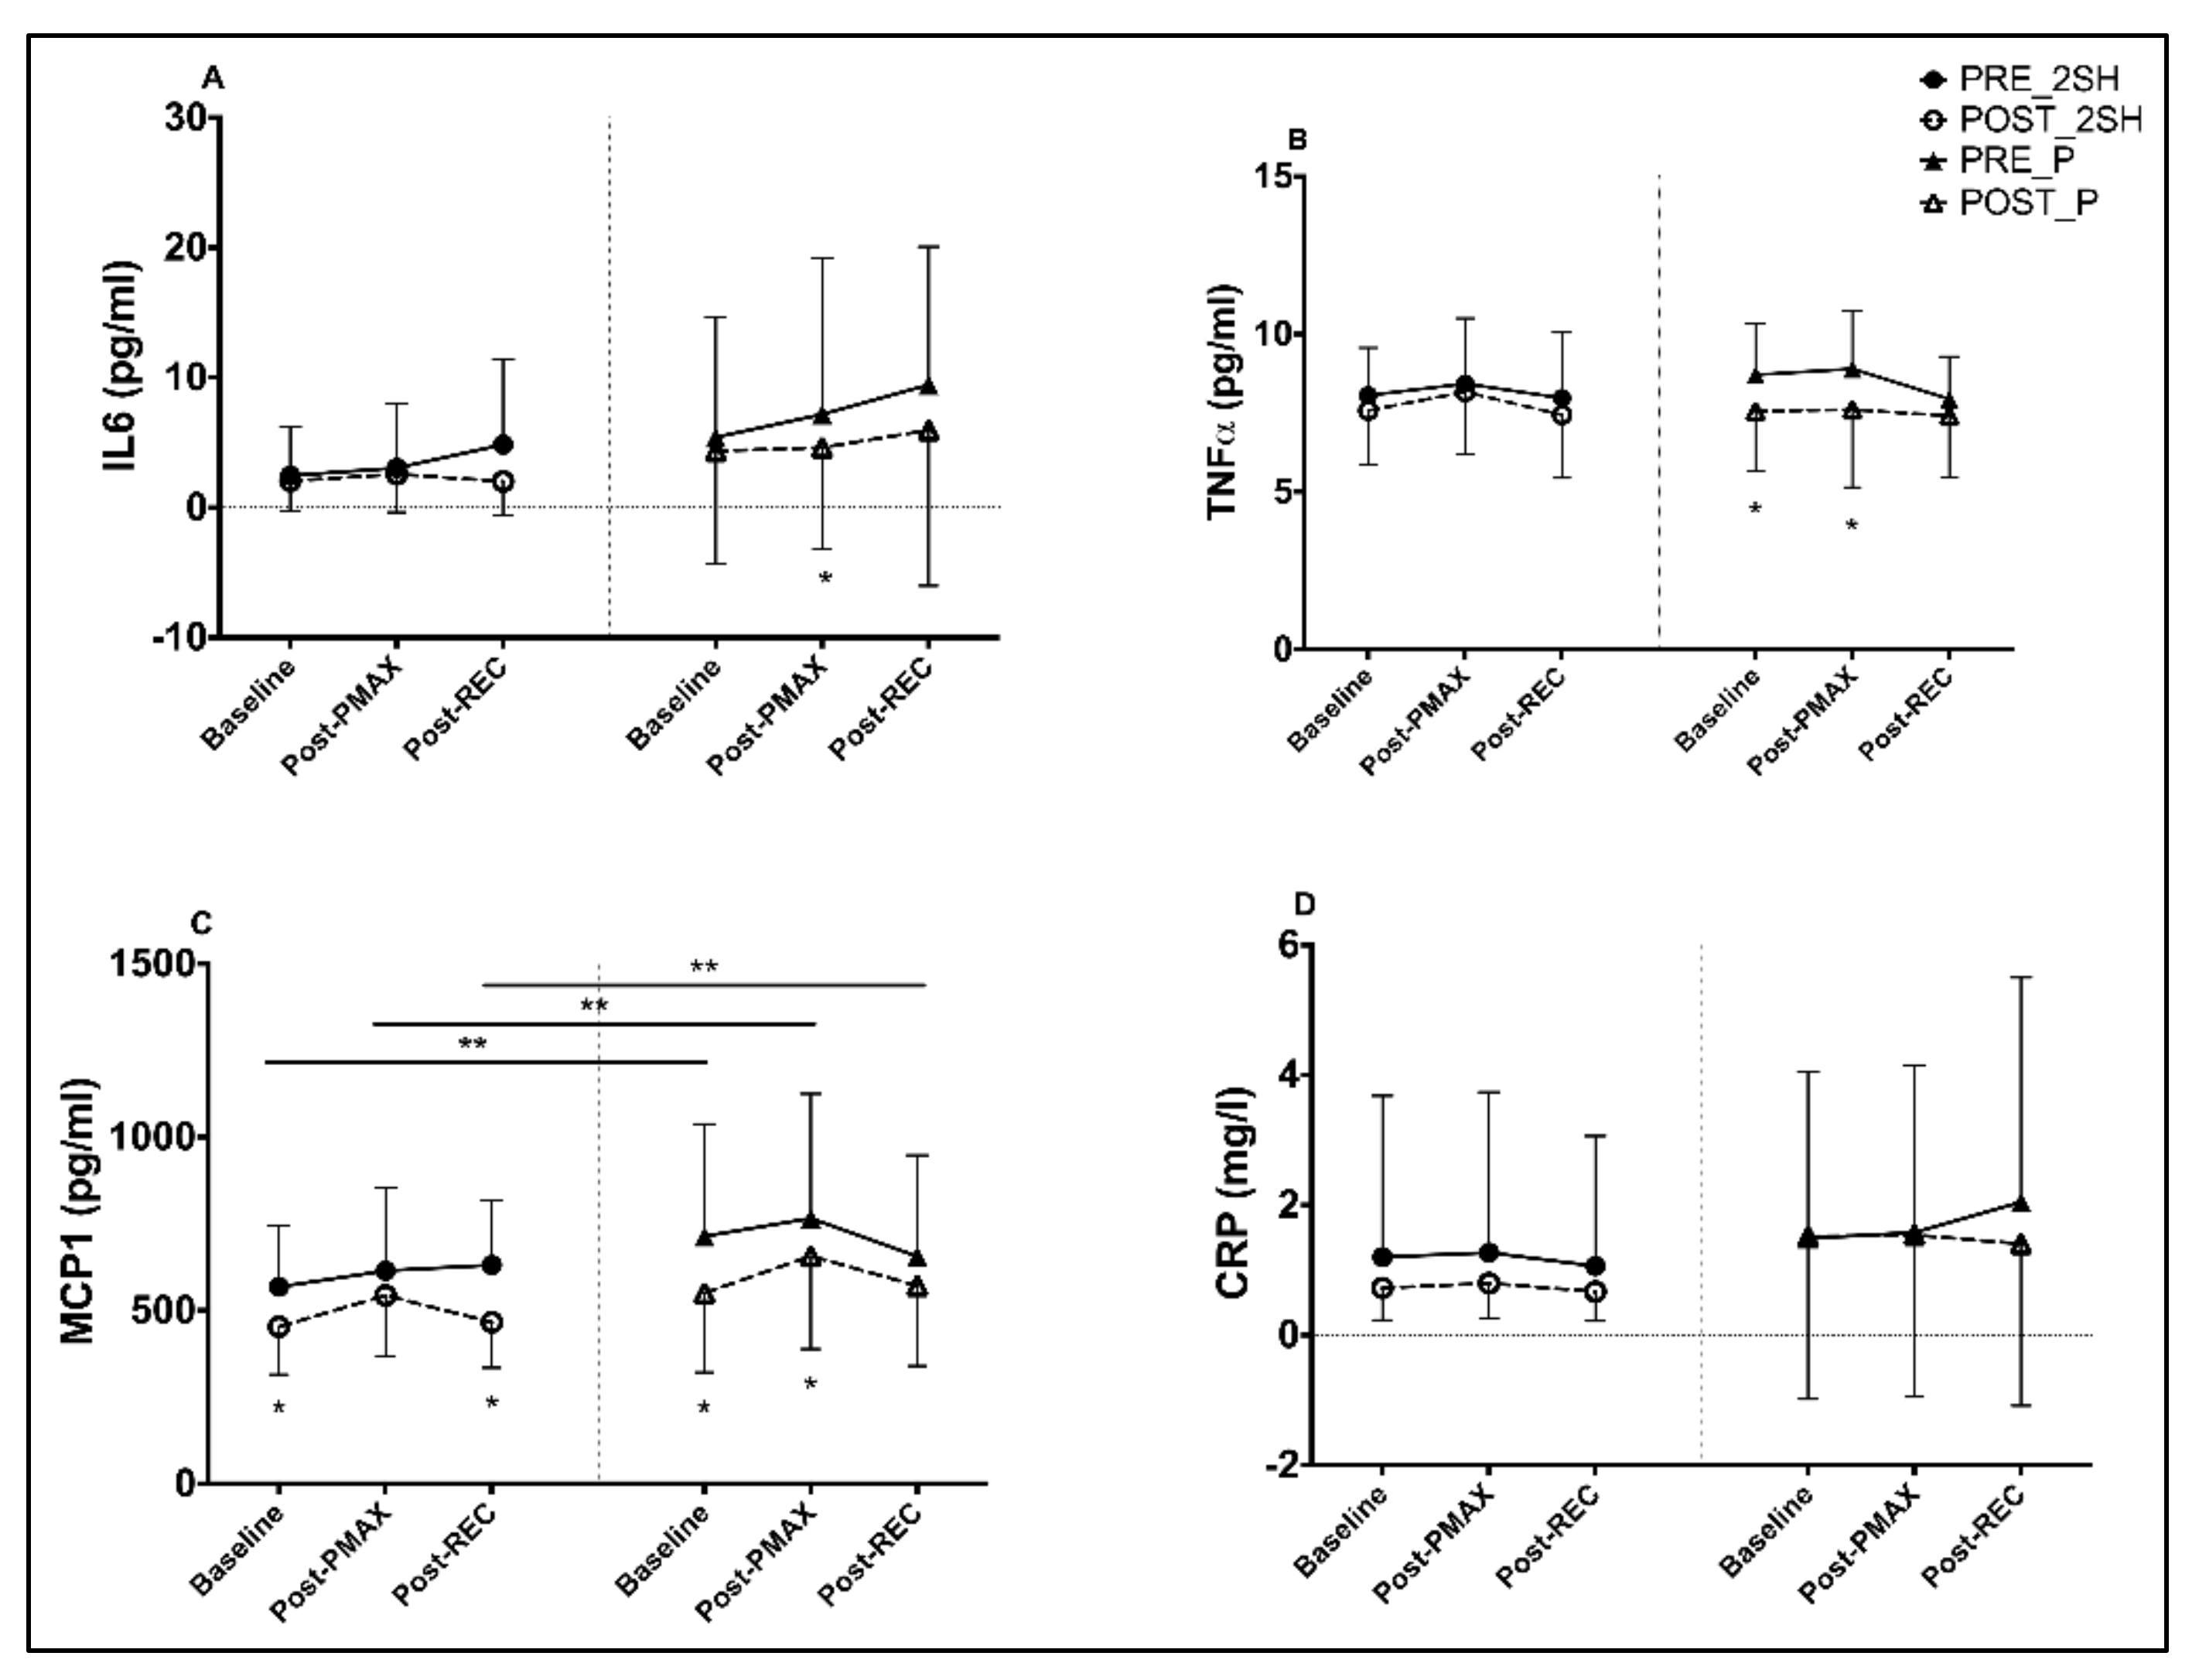
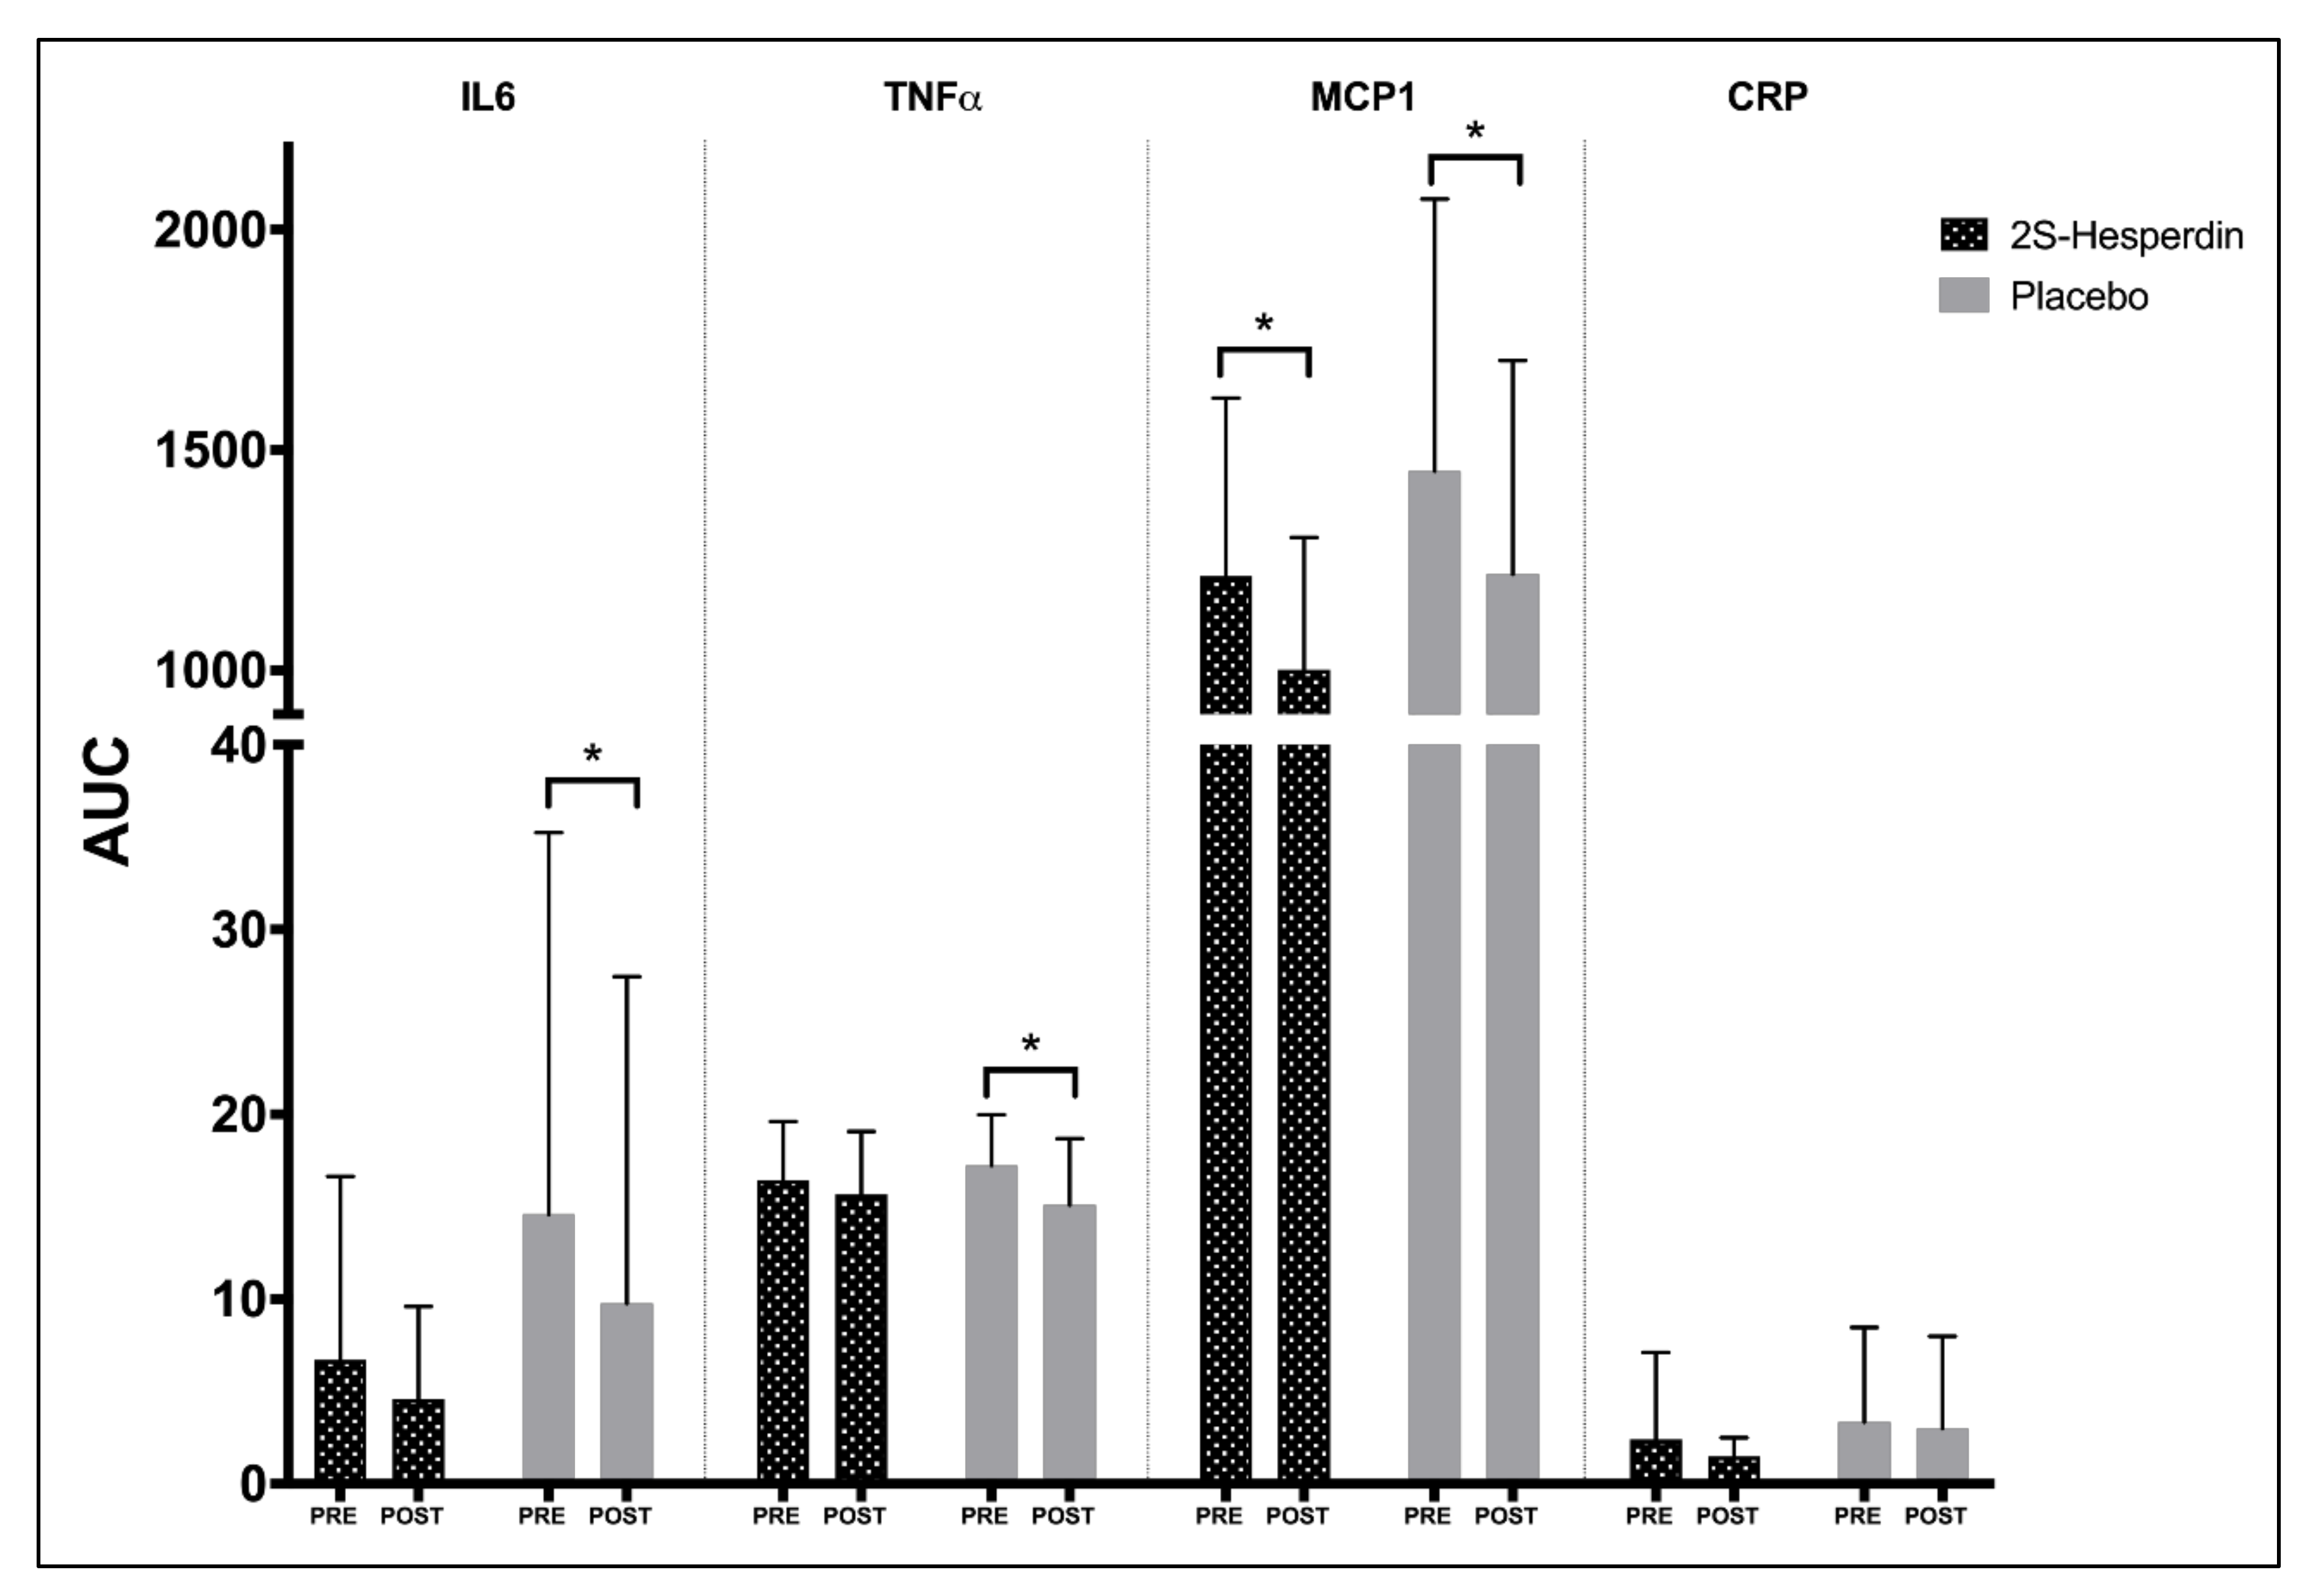
3.2. Inflammatory Biomarkers
3.3. Hesperidin Metabolites Urine
4. Discussion
4.1. Changes in Endogenous Antioxidant Markers
4.2. Changes in Inflammatory Markers
5. Conclusions
Supplementary Materials
Author Contributions
Funding
Institutional Review Board Statement
Informed Consent Statement
Data Availability Statement
Acknowledgments
Conflicts of Interest
References
- Xiao, J. Dietary flavonoid aglycones and their glycosides: Which show better biological significance? Crit. Rev. Food Sci. Nutr. 2017, 57, 1874–1905. [Google Scholar] [CrossRef] [PubMed]
- Asztemborska, M.; Zukowski, J. Determination of diastereomerization barrier of some flavanones by high-performance liquid chromatography methods. J. Chromatogr. A 2006, 1134, 95–100. [Google Scholar] [CrossRef]
- Mas-Capdevila, A.; Teichenne, J.; Domenech-Coca, C.; Caimari, A.; Del Bas, J.M.; Escoté, X.; Crescenti, A. Effect of Hesperidin on Cardiovascular Disease Risk Factors: The Role of Intestinal Microbiota on Hesperidin Bioavailability. Nutrients 2020, 12, 1488. [Google Scholar] [CrossRef] [PubMed]
- Parhiz, H.; Roohbakhsh, A.; Soltani, F.; Rezaee, R.; Iranshahi, M. Antioxidant and anti-inflammatory properties of the citrus flavonoids hesperidin and hesperetin: An updated review of their molecular mechanisms and experimental models. Phytother. Res. 2015, 29, 323–331. [Google Scholar] [CrossRef]
- Barreca, D.; Gattuso, G.; Bellocco, E.; Calderaro, A.; Trombetta, D.; Smeriglio, A.; Lagana, G.; Daglia, M.; Meneghini, S.; Nabavi, S.M. Flavanones: Citrus phytochemical with health-promoting properties. Biofactors 2017, 43, 495–506. [Google Scholar] [CrossRef]
- Milenkovic, D.; Deval, C.; Dubray, C.; Mazur, A.; Morand, C. Hesperidin displays relevant role in the nutrigenomic effect of orange juice on blood leukocytes in human volunteers: A randomized controlled cross-over study. PLoS ONE 2011, 6, e26669. [Google Scholar] [CrossRef] [PubMed]
- Martínez-Noguera, F.J.; Marín-Pagán, C.; Carlos-Vivas, J.; Alcaraz, P.E. Effects of 8 Weeks of 2S-Hesperidin Supplementation on Performance in Amateur Cyclists. Nutrients 2020, 12, 3911. [Google Scholar] [CrossRef]
- Kawabata, K.; Yoshioka, Y.; Terao, J. Role of intestinal microbiota in the bioavailability and physiological functions of dietary polyphenols. Molecules 2019, 24, 370. [Google Scholar] [CrossRef] [PubMed]
- Martinez-Noguera, F.J.; Marin-Pagan, C.; Carlos-Vivas, J.; Rubio-Arias, J.A.; Alcaraz, P.E. Acute Effects of Hesperidin in Oxidant/Antioxidant State Markers and Performance in Amateur Cyclists. Nutrients 2019, 11, 1898. [Google Scholar] [CrossRef] [PubMed]
- Estruel-Amades, S.; Massot-Cladera, M.; Garcia-Cerdà, P.; Pérez-Cano, F.J.; Franch, À.; Castell, M.; Camps-Bossacoma, M. Protective effect of hesperidin on the oxidative stress induced by an exhausting exercise in intensively trained rats. Nutrients 2019, 11, 783. [Google Scholar] [CrossRef] [PubMed]
- Biesemann, N.; Ried, J.S.; Ding-Pfennigdorff, D.; Dietrich, A.; Rudolph, C.; Hahn, S.; Hennerici, W.; Asbrand, C.; Leeuw, T.; Strübing, C. High throughput screening of mitochondrial bioenergetics in human differentiated myotubes identifies novel enhancers of muscle performance in aged mice. Sci. Rep. 2018, 8, 9408. [Google Scholar] [CrossRef] [PubMed]
- Sadowska-Krępa, E.; Kłapcińska, B.; Podgórski, T.; Szade, B.; Tyl, K.; Hadzik, A. Effects of supplementation with acai (Euterpe oleracea Mart.) berry-based juice blend on the blood antioxidant defence capacity and lipid profile in junior hurdlers. A pilot study. Biol. Sport 2015, 32, 161–168. [Google Scholar] [CrossRef] [PubMed]
- Martínez-Noguera, F.J.; Alcaraz, P.E.; Ortolano-Ríos, R.; Dufour, S.P.; Marín-Pagán, C. Differences between Professional and Amateur Cyclists in Endogenous Antioxidant System Profile. Antioxidants 2021, 10, 282. [Google Scholar] [CrossRef] [PubMed]
- Gomez-Cabrera, M.-C.; Borrás, C.; Pallardó, F.V.; Sastre, J.; Ji, L.L.; Viña, J. Decreasing xanthine oxidase-mediated oxidative stress prevents useful cellular adaptations to exercise in rats. J. Physiol. 2005, 567, 113–120. [Google Scholar] [CrossRef] [PubMed]
- Bentley, D.J.; Ackerman, J.; Clifford, T.; Slattery, K.S. Acute and Chronic Effects of Antioxidant Supplementation on Exercise Performance. In Antioxidants in Sport Nutrition; Lamprecht, M., Ed.; CRC Press/Taylor & Francis(c) 2015 by Taylor & Francis Group, LLC: Boca Raton, FL, USA, 2015. [Google Scholar]
- Merry, T.L.; Ristow, M. Do antioxidant supplements interfere with skeletal muscle adaptation to exercise training? J. Physiol. 2016, 594, 5135–5147. [Google Scholar] [CrossRef] [PubMed]
- Watson, T.A.; MacDonald-Wicks, L.K.; Garg, M.L. Oxidative stress and antioxidants in athletes undertaking regular exercise training. Int. J. Sport Nutr. Exerc. Metab. 2005, 15, 131–146. [Google Scholar] [CrossRef]
- Palazzetti, S.; Richard, M.J.; Favier, A.; Margaritis, I. Overloaded training increases exercise-induced oxidative stress and damage. Can. J. Appl. Physiol. 2003, 28, 588–604. [Google Scholar] [CrossRef] [PubMed]
- World Medical Association. WMA Declaration of Helsinki-Ethical principles for medical research involving human subjects. JAMA 2013, 310, 2191–2194. [Google Scholar] [CrossRef]
- Wasserman, K.; Beaver, W.L.; Whipp, B.J. Gas exchange theory and the lactic acidosis (anaerobic) threshold. Circulation 1990, 81, 14–30. [Google Scholar]
- Schisterman, E.F.; Faraggi, D.; Browne, R.; Freudenheim, J.; Dorn, J.; Muti, P.; Armstrong, D.; Reiser, B.; Trevisan, M. TBARS and cardiovascular disease in a population-based sample. J. Cardiovasc. Risk 2001, 8, 219–225. [Google Scholar] [CrossRef] [PubMed]
- Lykkesfeldt, J. Determination of malondialdehyde as dithiobarbituric acid adduct in biological samples by HPLC with fluorescence detection: Comparison with ultraviolet-visible spectrophotometry. Clin. Chem. 2001, 47, 1725–1727. [Google Scholar] [CrossRef] [PubMed]
- Aebi, H. Catalase in vitro. Methods Enzymol. 1984, 105, 121–126. [Google Scholar] [PubMed]
- Randox Laboratories Ltd. Radicales Libres; Randox Laboratories Ltd.: Crumlin, UK, 1996; pp. 1–166. [Google Scholar]
- Akerboom, T.P.; Sies, H. Assay of glutathione, glutathione disulfide, and glutathione mixed disulfides in biological samples. Methods Enzymol. 1981, 77, 373–382. [Google Scholar] [CrossRef]
- Asensi, M.; Sastre, J.; Pallardo, F.V.; Estrela, J.M.; Vina, J. Determination of oxidized glutathione in blood: High-performance liquid chromatography. Methods Enzymol. 1994, 234, 367–371. [Google Scholar] [CrossRef] [PubMed]
- Cohen, J. Statistical Power Analysis for the Social Sciences; Laurence Erlbaum Associates: Hillsdale, MI, USA, 1988. [Google Scholar]
- Urso, M.L.; Clarkson, P.M. Oxidative stress, exercise, and antioxidant supplementation. Toxicology 2003, 189, 41–54. [Google Scholar] [CrossRef]
- Tiidus, P.M.; Pushkarenko, J.; Houston, M.E. Lack of antioxidant adaptation to short-term aerobic training in human muscle. Am. J. Physiol 1996, 271, R832–R836. [Google Scholar] [CrossRef] [PubMed]
- Abdel-Raheem, I.T.; Abdel-Ghany, A.A. Hesperidin alleviates doxorubicin-induced cardiotoxicity in rats. J. Egypt Natl. Cancer Inst. 2009, 21, 175–184. [Google Scholar]
- Suarez, J.; Herrera, M.D.; Marhuenda, E. In vitro scavenger and antioxidant properties of hesperidin and neohesperidin dihydrochalcone. Phytomedicine 1998, 5, 469–473. [Google Scholar] [CrossRef]
- Kalpana, K.B.; Srinivasan, M.; Menon, V.P. Evaluation of antioxidant activity of hesperidin and its protective effect on H2O2 induced oxidative damage on pBR322 DNA and RBC cellular membrane. Mol. Cell. Biochem. 2009, 323, 21–29. [Google Scholar] [CrossRef]
- Elavarasan, J.; Velusamy, P.; Ganesan, T.; Ramakrishnan, S.K.; Rajasekaran, D.; Periandavan, K. Hesperidin-mediated expression of Nrf2 and upregulation of antioxidant status in senescent rat heart. J. Pharm. Pharmacol. 2012, 64, 1472–1482. [Google Scholar] [CrossRef]
- Friling, R.S.; Bensimon, A.; Tichauer, Y.; Daniel, V. Xenobiotic-inducible expression of murine glutathione S-transferase Ya subunit gene is controlled by an electrophile-responsive element. Proc. Natl. Acad. Sci. USA 1990, 87, 6258–6262. [Google Scholar] [CrossRef]
- Arredondo, F.; Echeverry, C.; Abin-Carriquiry, J.A.; Blasina, F.; Antúnez, K.; Jones, D.P.; Go, Y.M.; Liang, Y.L.; Dajas, F. After cellular internalization, quercetin causes Nrf2 nuclear translocation, increases glutathione levels, and prevents neuronal death against an oxidative insult. Free Radic. Biol. Med. 2010, 49, 738–747. [Google Scholar] [CrossRef]
- Sen, C.K. Glutathione homeostasis in response to exercise training and nutritional supplements. In Stress Adaptation, Prophylaxis and Treatment; Springer: Berlin/Heidelberg, Germany, 1999; pp. 31–42. [Google Scholar]
- Cordova, A.; Sureda, A.; Albina, M.L.; Linares, V.; Belles, M.; Sanchez, D.J. Oxidative stress markers after a race in professional cyclists. Int J. Sport Nutr. Exerc. Metab. 2015, 25, 171–178. [Google Scholar] [CrossRef] [PubMed]
- Leonardo-Mendonça, R.C.; Concepción-Huertas, M.; Guerra-Hernández, E.; Zabala, M.; Escames, G.; Acuña-Castroviejo, D. Redox status and antioxidant response in professional cyclists during training. Eur. J. Sport Sci. 2014, 14, 830–838. [Google Scholar] [CrossRef] [PubMed]
- Talluri, R.; Shete, S. Using the weighted area under the net benefit curve for decision curve analysis. BMC Med. Inform. Decis. Mak. 2016, 16, 94. [Google Scholar] [CrossRef]
- Zhang, G.; Zhu, J.; Zhou, Y.; Wei, Y.; Xi, L.; Qin, H.; Rao, Z.; Han, M.; Ma, Y.; Wu, X.A. Hesperidin Alleviates Oxidative Stress and Upregulates the Multidrug Resistance Protein 2 in Isoniazid and Rifampicin-Induced Liver Injury in Rats. J. Biochem. Mol. Toxicol. 2016, 30, 342–349. [Google Scholar] [CrossRef]
- Selvaraj, P.; Pugalendi, K.V. Hesperidin, a flavanone glycoside, on lipid peroxidation and antioxidant status in experimental myocardial ischemic rats. Redox Rep. 2010, 15, 217–223. [Google Scholar] [CrossRef] [PubMed]
- Owen, J.B.; Butterfield, D.A. Measurement of oxidized/reduced glutathione ratio. Methods Mol. Biol. 2010, 648, 269–277. [Google Scholar] [CrossRef] [PubMed]
- Bradshaw, P.C. Cytoplasmic and Mitochondrial NADPH-Coupled Redox Systems in the Regulation of Aging. Nutrients 2019, 11, 504. [Google Scholar] [CrossRef] [PubMed]
- Buettner, G.R.; Wagner, B.A.; Rodgers, V.G. Quantitative redox biology: An approach to understand the role of reactive species in defining the cellular redox environment. Cell Biochem. Biophys. 2013, 67, 477–483. [Google Scholar] [CrossRef]
- Leopold, J.A.; Zhang, Y.Y.; Scribner, A.W.; Stanton, R.C.; Loscalzo, J. Glucose-6-phosphate dehydrogenase overexpression decreases endothelial cell oxidant stress and increases bioavailable nitric oxide. Arter. Thromb. Vasc. Biol. 2003, 23, 411–417. [Google Scholar] [CrossRef]
- Préville, X.; Salvemini, F.; Giraud, S.; Chaufour, S.; Paul, C.; Stepien, G.; Ursini, M.V.; Arrigo, A.P. Mammalian small stress proteins protect against oxidative stress through their ability to increase glucose-6-phosphate dehydrogenase activity and by maintaining optimal cellular detoxifying machinery. Exp. Cell Res. 1999, 247, 61–78. [Google Scholar] [CrossRef]
- Salvemini, F.; Franzé, A.; Iervolino, A.; Filosa, S.; Salzano, S.; Ursini, M.V. Enhanced glutathione levels and oxidoresistance mediated by increased glucose-6-phosphate dehydrogenase expression. J. Biol. Chem. 1999, 274, 2750–2757. [Google Scholar] [CrossRef] [PubMed]
- Scheele, C.; Nielsen, S.; Pedersen, B.K. ROS and myokines promote muscle adaptation to exercise. Trends Endocrinol. Metab. 2009, 20, 95–99. [Google Scholar] [CrossRef] [PubMed]
- Ost, M.; Coleman, V.; Kasch, J.; Klaus, S. Regulation of myokine expression: Role of exercise and cellular stress. Free Radic. Biol. Med. 2016, 98, 78–89. [Google Scholar] [CrossRef] [PubMed]
- Decroix, L.; Tonoli, C.; Soares, D.D.; Descat, A.; Drittij-Reijnders, M.J.; Weseler, A.R.; Bast, A.; Stahl, W.; Heyman, E.; Meeusen, R. Acute cocoa Flavanols intake has minimal effects on exercise-induced oxidative stress and nitric oxide production in healthy cyclists: A randomized controlled trial. J. Int. Soc. Sports Nutr. 2017, 14, 28. [Google Scholar] [CrossRef]
- Petersen, A.M.; Pedersen, B.K. The anti-inflammatory effect of exercise. J. Appl. Physiol. 2005, 98, 1154–1162. [Google Scholar] [CrossRef]
- Yeh, C.-C.; Kao, S.-J.; Lin, C.-C.; Wang, S.-D.; Liu, C.-J.; Kao, S.-T. The immunomodulation of endotoxin-induced acute lung injury by hesperidin in vivo and in vitro. Life Sci. 2007, 80, 1821–1831. [Google Scholar] [CrossRef]
- Choi, I.Y.; Kim, S.J.; Jeong, H.J.; Park, S.H.; Song, Y.S.; Lee, J.H.; Kang, T.H.; Park, J.H.; Hwang, G.S.; Lee, E.J.; et al. Hesperidin inhibits expression of hypoxia inducible factor-1 alpha and inflammatory cytokine production from mast cells. Mol. Cell Biochem. 2007, 305, 153–161. [Google Scholar] [CrossRef]
- Nizamutdinova, I.T.; Jeong, J.J.; Xu, G.H.; Lee, S.-H.; Kang, S.S.; Kim, Y.S.; Chang, K.C.; Kim, H.J. Hesperidin, hesperidin methyl chalone and phellopterin from Poncirus trifoliata (Rutaceae) differentially regulate the expression of adhesion molecules in tumor necrosis factor-alpha-stimulated human umbilical vein endothelial cells. Int. Immunopharmacol. 2008, 8, 670–678. [Google Scholar] [CrossRef]
- Moon, P.-D.; Kim, H.-M. Antiinflammatory Effects of Traditional Korean Medicine, JinPi-tang and Its Active Ingredient, Hesperidin in HaCaT cells. Phytother. Res. 2012, 26, 657–662. [Google Scholar] [CrossRef]
- Ruiz-Iglesias, P.; Estruel-Amades, S.; Camps-Bossacoma, M.; Massot-Cladera, M.; Franch, À.; Pérez-Cano, F.J.; Castell, M. Influence of Hesperidin on Systemic Immunity of Rats Following an Intensive Training and Exhausting Exercise. Nutrients 2020, 12, 1219. [Google Scholar] [CrossRef]
- Li, R.; Li, J.; Cai, L.; Hu, C.M.; Zhang, L. Suppression of adjuvant arthritis by hesperidin in rats and its mechanisms. J. Pharm. Pharmacol. 2008, 60, 221–228. [Google Scholar] [CrossRef] [PubMed]
- Selmi, S.; Rtibi, K.; Grami, D.; Sebai, H.; Marzouki, L. Protective effects of orange (Citrus sinensis L.) peel aqueous extract and hesperidin on oxidative stress and peptic ulcer induced by alcohol in rat. Lipids Health Dis. 2017, 16, 152. [Google Scholar] [CrossRef]
- Hong, Y.; An, Z. Hesperidin attenuates learning and memory deficits in APP/PS1 mice through activation of Akt/Nrf2 signaling and inhibition of RAGE/NF-κB signaling. Arch. Pharm Res. 2018, 41, 655–663. [Google Scholar] [CrossRef] [PubMed]
- Nennig, S.E.; Schank, J.R. The Role of NFkB in Drug Addiction: Beyond Inflammation. Alcohol Alcohol. 2017, 52, 172–179. [Google Scholar] [CrossRef]
- De Oliveira, C.A.; Peres, D.D.A.; Rugno, C.M.; Kojima, M.; Pinto, C.A.S.d.O.; Consiglieri, V.O.; Kaneko, T.M.; Rosado, C.; Mota, J.; Velasco, M.V.R.; et al. Functional photostability and cutaneous compatibility of bioactive UVA sun care products. J. Photochem. Photobiol. B Biol. 2015, 148, 154–159. [Google Scholar] [CrossRef] [PubMed]
- Nieman, D.C.; Henson, D.A.; Davis, J.M.; Angela Murphy, E.; Jenkins, D.P.; Gross, S.J.; Carmichael, M.D.; Quindry, J.C.; Dumke, C.L.; Utter, A.C.; et al. Quercetin’s influence on exercise-induced changes in plasma cytokines and muscle and leukocyte cytokine mRNA. J. Appl. Physiol. 2007, 103, 1728–1735. [Google Scholar] [CrossRef] [PubMed]
- Yamamoto, M.; Jokura, H.; Hashizume, K.; Ominami, H.; Shibuya, Y.; Suzuki, A.; Hase, T.; Shimotoyodome, A. Hesperidin metabolite hesperetin-7-O-glucuronide, but not hesperetin-3′-O-glucuronide, exerts hypotensive, vasodilatory, and anti-inflammatory activities. Food Funct. 2013, 4, 1346–1351. [Google Scholar] [CrossRef] [PubMed]
- Cardona, F.; Andrés-Lacueva, C.; Tulipani, S.; Tinahones, F.J.; Queipo-Ortuño, M.I. Benefits of polyphenols on gut microbiota and implications in human health. J. Nutr. Biochem. 2013, 24, 1415–1422. [Google Scholar] [CrossRef]
- Corrêa, T.A.F.; Rogero, M.M.; Hassimotto, N.M.A.; Lajolo, F.M. The Two-Way Polyphenols-Microbiota Interactions and Their Effects on Obesity and Related Metabolic Diseases. Front. Nutr. 2019, 6, 188. [Google Scholar] [CrossRef] [PubMed]
- Middelbeek, R.J.W.; Motiani, P.; Brandt, N.; Nigro, P.; Zheng, J.; Virtanen, K.A.; Kalliokoski, K.K.; Hannukainen, J.C.; Goodyear, L.J. Exercise intensity regulates cytokine and klotho responses in men. Nutr. Diabetes 2021, 11, 5. [Google Scholar] [CrossRef]
- Petersen, A.C.; McKenna, M.J.; Medved, I.; Murphy, K.T.; Brown, M.J.; Della Gatta, P.; Cameron-Smith, D. Infusion with the antioxidant N-acetylcysteine attenuates early adaptive responses to exercise in human skeletal muscle. Acta Physiol. 2012, 204, 382–392. [Google Scholar] [CrossRef] [PubMed]
- Manach, C.; Morand, C.; Gil-Izquierdo, A.; Bouteloup-Demange, C.; Rémésy, C. Bioavailability in humans of the flavanones hesperidin and narirutin after the ingestion of two doses of orange juice. Eur. J. Clin. Nutr. 2003, 57, 235–242. [Google Scholar] [CrossRef] [PubMed]


| 2S-Hesperidin | Placebo | p-Value | |
|---|---|---|---|
| Age (years) | 35.0 (9.20) | 32.6 (8.90) | 0.407 |
| Body mass (kg) | 71.0 (6.98) | 70.4 (6.06) | 0.773 |
| Height (cm) | 175.3 (6.20) | 176.5 (6.10) | 0.541 |
| BMI (kg·m−2) | 23.1 (1.53) | 22.6 (1.43) | 0.292 |
| BF (%) | 8.9 (1.63) | 9.0 (1.64) | 0.803 |
| VO2MAX (L·min−1) | 3.99 (0.36) | 3.98 (0.63) | 0.971 |
| VO2MAX (mL·kg−1·min−1) | 57.5 (6.97) | 57.9 (9.53) | 0.88 |
| HRMAX (bpm) | 184.9 (11.11) | 183.2 (8.68) | 0.593 |
| VT1 (%) | 50.9 (5.63) | 50.0 (4.78) | 0.61 |
| VT2 (%) | 84.9 (5.85) | 84.1 (5.70) | 0.644 |
| Training variables | 2S-Hesperidin | Placebo | p-value |
| Total distance (km) | 1121.12 (534.99) | 1082.43 (810.46) | 0.868 |
| HRAVG (bpm) | 144.76 (8.88) | 137.48 (13.11) | 0.067 |
| WAVG (W) | 174.86 (15.79) | 163.47 (32.49) | 0.435 |
| RPE | 6.34 (0.82) | 6.33 (1.16) | 0.975 |
| Pre-Intervention | Post-Intervention | |||||
|---|---|---|---|---|---|---|
| 2S-Hesperidin | Placebo | p-Value | 2S-Hesperidin | Placebo | p-Value | |
| Kcal | 2163.6 (519.02) | 2100.2 (515.77) | 0.708 | 1974.1 (377.97) | 2133.5 (437.98) | 0.237 |
| Kcal/BM | 31.1 (9.34) | 30.2 (8.71) | 0.768 | 27.9 (6.53) | 30.3 (6.46) | 0.249 |
| CHO (g) | 245.7 (73.46) | 222.0 (69.68) | 0.312 | 216.6 (63.47) | 248.3 (58.15) | 0.117 |
| CHO/BM | 3.5 (1.31) | 3.2 (1.14) | 0.416 | 3.1 (1.08) | 3.5 (0.94) | 0.173 |
| PRO (g) | 113.5 (25.21) | 115.2 (25.37) | 0.837 | 109.0 (23.05) | 101.5 (23.67) | 0.332 |
| PRO/BM | 1.6 (0.41) | 1.7 (0.48) | 0.778 | 1.5 (0.35) | 1.5 (0.42) | 0.596 |
| LP (g) | 80.8 (27.24) | 83.5 (23.65) | 0.739 | 71.5 (17.61) | 71.6 (18.89) | 0.985 |
| LP/BM | 1.2 (0.45) | 1.2 (0.37) | 0.758 | 1.0 (0.27) | 1.0 (0.29) | 0.823 |
| 2S-HESPERIDIN | PLACEBO | Between-Group Comparison | |||||||||||
|---|---|---|---|---|---|---|---|---|---|---|---|---|---|
| Baseline | Post- PMAX | Post- REC | AUC | Baseline | Post- PMAX | Post- REC | AUC | ΔBaseline | ΔPost-PMAX | ΔPost-REC | ΔAUC | ||
| CAT | Pre-Int | 23.89 | 38.66 | 23.89 | 63.29 | 25.15 | 39.14 | 24.34 | 63.88 | ||||
| (5.14) | (11.4) | (3.75) | (14.2) | (4.54) | (8.51) | (3.85) | (11.20) | ||||||
| Post-Int | 25.17 | 35.57 | 25.5 | 61.91 | 24.78 | 35.45 | 25.01 | 60.34 | |||||
| (4.95) | (9.66) | (7.65) | (12.62) | (4.02) | (11.12) | (4.41) | (12.74) | ||||||
| p-value | 0.272 | 0.148 | 0.263 | 0.526 | 0.757 | 0.058 | 0.633 | 0.188 | 0.316 | 0.76 | 0.636 | 0.527 | |
| Effect size | 0.24 | 0.26 | 0.41 | 0.09 | 0.08 | 0.42 | 0.17 | 0.30 | 0.32 | 0.07 | 0.15 | 0.2 | |
| SOD | Pre-Int | 1509 | 1442 | 1541 | 2971 | 1566 | 1573 | 1563 | 3138 | ||||
| (435.05) | (282.29) | (280.16) | (584.34) | (284.36) | (274.41) | (303.05) | (479.34) | ||||||
| Post-Int | 1698 | 1666 | 1792 | 3391 | 1849 | 1727 | 1718 | 3511 | |||||
| (238.55) | (246.110 | (231.2) | (308.32) | (364.77) | (491.32) | (412.24) | (754.07) | ||||||
| p-value | 0.11 | 0.045 | 0.004 | 0.011 | 0.009 | 0.124 | 0.057 | 0.023 | 0.449 | 0.699 | 0.402 | 0.826 | |
| Effect size | 0.42 | 0.76 | 0.86 | 0.69 | 0.95 | 0.54 | 0.49 | 0.75 | 0.2 | 0.16 | 0.27 | 0.07 | |
| GSSG | Pre-Int | 0.357 | 0.322 | 0.314 | 0.657 | 0.363 | 0.369 | 0.34 | 0.720 | ||||
| (0.19) | (0.07) | (0.060 | (0.14) | (0.13) | (0.07) | (0.1) | (0.11) | ||||||
| Post-Int | 0.278 | 0.265 | 0.316 | 0.561 | 0.348 | 0.313 | 0.328 | 0.650 | |||||
| (0.06) | (0.07) | (0.1) | (0.06) | (0.14) | (0.12) | (0.13) | (0.21) | ||||||
| p-value | 0.08 | 0.058 | 0.963 | 0.016 | 0.734 | 0.049 | 0.719 | 0.219 | 0.326 | 0.979 | 0.772 | 0.627 | |
| Effect size | 0.39 | 0.75 | 0.02 | 0.64 | 0.11 | 0.82 | 0.11 | 0.59 | 0.31 | 0.01 | 0.09 | 0.12 | |
| GSH | Pre-Int | 26.37 | 26.41 | 26.93 | 53.07 | 26.99 | 26.61 | 26.98 | 53.60 | ||||
| (3.14) | (3.31) | (3.66) | (4.25) | (2.46) | (2.40) | (2.66) | (3.30) | ||||||
| Post-Int | 23.88 | 23.59 | 25.00 | 48.03 | 24.76 | 25.58 | 25.38 | 50.65 | |||||
| (3.09) | (2.86) | (4.61) | (5.57) | (3.66) | (3.78) | (2.80) | (5.30) | ||||||
| p-value | 0.014 | 0.029 | 0.081 | 0.011 | 0.042 | 0.335 | 0.110 | 0.027 | 0.862 | 0.246 | 0.812 | 0.343 | |
| Effect size | 0.76 | 0.82 | 0.51 | 1.14 | 0.87 | 0.41 | 0.58 | 0.86 | 0.06 | 0.37 | 0.08 | 0.3 | |
| GSSG/ GSH | Pre-Int | 1.16 | 1.25 | 1.17 | 2.41 | 1.29 | 1.36 | 1.27 | 2.65 | ||||
| (0.32) | (0.32) | (0.27) | (0.37) | (0.48) | (0.41) | (0.35) | (0.61) | ||||||
| Post-Int | 1.20 | 1.15 | 1.31 | 2.40 | 1.43 | 1.25 | 1.28 | 2.61 | |||||
| (0.30) | (0.25) | (0.49) | (0.42) | (0.53) | (0.50) | (0.42) | (0.75) | ||||||
| p-value | 0.770 | 0.390 | 0.272 | 0.950 | 0.338 | 0.361 | 0.956 | 0.082 | 0.608 | 0.938 | 0.431 | 0.903 | |
| Effect size | 0.11 | 0.29 | 0.52 | 0.02 | 0.27 | 0.26 | 0.02 | 0.06 | 0.16 | 0.02 | 0.25 | 0.04 | |
| HO1 | Pre-Int | 0.539 | 0.473 | 0.513 | 0.998 | 0.626 | 0.551 | 0.589 | 1.158 | ||||
| (0.24) | (0.20) | (0.22) | (0.41) | (0.23) | (0.28) | (0.27) | (0.51) | ||||||
| Post-Int | 0.650 | 0.581 | 0.585 | 1.198 | 0.740 | 0.678 | 0.705 | 1.400 | |||||
| (0.26) | (0.31) | (0.20) | (0.51) | (0.34) | (0.26) | (0.30) | (0.55) | ||||||
| P-value | 0.135 | 0.172 | 0.281 | 0.081 | 0.059 | 0.066 | 0.027 | 0.038 | 0.972 | 0.849 | 0.548 | 0.789 | |
| Effect size | 0.44 | 0.53 | 0.32 | 0.47 | 0.47 | 0.43 | 0.41 | 0.46 | 0.01 | 0.06 | 0.19 | 0.09 | |
| TBARS | Pre-Int | 2.55 | 2.80 | 2.41 | 5.27 | 2.64 | 2.92 | 2.75 | 5.62 | ||||
| (0.42) | (0.38) | (0.48) | (0.68) | (0.37) | (0.54) | (0.41) | (0.78) | ||||||
| Post-Int | 2.79 | 2.88 | 2.54 | 5.54 | 2.73 | 2.80 | 2.57 | 5.45 | |||||
| (0.52) | (0.49) | (0.33) | (0.69) | (0.50) | (0.49) | (0.50) | (0.77) | ||||||
| P-value | 0.052 | 0.519 | 0.393 | 0.246 | 0.527 | 0.493 | 0.216 | 0.551 | 0.399 | 0.406 | 0.134 | 0.227 | |
| Effect size | 0.55 | 0.22 | 0.25 | 0.38 | 0.22 | 0.21 | 0.42 | 0.21 | 0.27 | 0.27 | 0.48 | 0.39 | |
| 2S-Hesperidin | Placebo | Between-Group Comparison | |||||||||||
|---|---|---|---|---|---|---|---|---|---|---|---|---|---|
| Pre | Post- PMAX | Post- REC | AUC | Pre | Post- PMAX | Post- REC | AUC | ΔBaseline | ΔPost-PMAX | ΔPost-REC | ΔAUC | ||
| IL6 | Pre-Int | 2.46 | 3.05 | 4.85 | 6.71 | 5.41 | 7.17 | 9.44 | 14.59 | ||||
| (3.78) | (4.92) | (6.55) | (9.94) | (9.26) | (12.02) | (10.62) | (20.67) | ||||||
| Post-Int | 2.04 | 2.57 | 2.01 | 4.59 | 4.35 | 4.61 | 5.96 | 9.77 | |||||
| (2.32) | (2.94) | (2.61) | (5.01) | (8.65) | (7.78) | (11.98) | (17.69) | ||||||
| p-value | 0.537 | 0.695 | 0.128 | 0.255 | 0.129 | 0.045 | 0.065 | 0.021 | 0.514 | 0.243 | 0.807 | 0.31 | |
| Effect size | 0.11 | 0.10 | 0.42 | 0.20 | 0.11 | 0.20 | 0.31 | 0.22 | 0.21 | 0.39 | 0.08 | 0.33 | |
| TNFα | Pre-Int | 8.06 | 8.43 | 7.97 | 16.44 | 8.71 | 8.90 | 7.94 | 17.22 | ||||
| (1.51) | (2.07) | (2.08) | (3.17) | (1.62) | (1.83) | (1.35) | (2.76) | ||||||
| Post-Int | 7.58 | 8.17 | 7.44 | 15.68 | 7.55 | 7.61 | 7.41 | 15.09 | |||||
| (1.70) | (1.98) | (2.00) | (3.40) | (1.89) | (2.46) | (1.94) | (3.6) | ||||||
| P-value | 0.271 | 0.466 | 0.148 | 0.338 | 0.015 | 0.038 | 0.127 | 0.021 | 0.252 | 0.21 | 0.999 | 0.239 | |
| Effect size | 0.31 | 0.12 | 0.25 | 0.23 | 0.69 | 0.67 | 0.38 | 0.74 | 0.37 | 0.4 | 0 | 0.38 | |
| MCP1 | Pre-Int | 568 | 614 | 631 | 1214 | 714 | 766 | 656 | 1452 | ||||
| (177.05) | (240.06) | (184.77) | (403.32) | (324.12) | (359.13) | (291.75) | (617.47) | ||||||
| Post-Int | 453 | 543 | 466 | 1002 | 550 | 657 | 571 | 1218 | |||||
| (137.74) | (174.45) | (131.81) | (299.31) | (228.61) | (268.48) | (231.280 | (484.67) | ||||||
| P-value | 0.007 | 0.096 | 0.004 | 0.002 | <0.001 | 0.026 | 0.108 | 0.021 | 0.388 | 0.567 | 0.275 | 0.845 | |
| Effect size | 0.63 | 0.29 | 0.86 | 0.5 | 0.49 | 0.29 | 0.28 | 0.36 | 0.28 | 0.18 | 0.35 | 0.06 | |
| CRP | Pre-Int | 1.200 (2.48) | 1.268 (2.47) | 1.063 | 2.399 | 1.487 | 1.579 | 2.049 | 3.347 | ||||
| (2.00) | (4.71) | (2.56) | (2.57) | (3.45) | (5.12) | ||||||||
| Post-Int | 0.724 | 0.798 | 0.669 | 1.494 | 1.517 | 1.539 | 1.404 | 3.000 | |||||
| −0.49 | −0.54 | (0.45) | (1.01) | (2.50) | (2.49) | (2.49) | (4.98) | ||||||
| p-value | 0.521 | 0.523 | 0.634 | 0.398 | 0.981 | 0.943 | 0.402 | 0.832 | 0.606 | 0.658 | 0.819 | 0.774 | |
| Effect size | 0.18 | 0.18 | 0.19 | 0.18 | 0.01 | 0.01 | 0.18 | 0.07 | 0.16 | 0.14 | 0.07 | 0.09 | |
Publisher’s Note: MDPI stays neutral with regard to jurisdictional claims in published maps and institutional affiliations. |
© 2021 by the authors. Licensee MDPI, Basel, Switzerland. This article is an open access article distributed under the terms and conditions of the Creative Commons Attribution (CC BY) license (http://creativecommons.org/licenses/by/4.0/).
Share and Cite
Martínez-Noguera, F.J.; Marín-Pagán, C.; Carlos-Vivas, J.; Alcaraz, P.E. 8-Week Supplementation of 2S-Hesperidin Modulates Antioxidant and Inflammatory Status after Exercise until Exhaustion in Amateur Cyclists. Antioxidants 2021, 10, 432. https://doi.org/10.3390/antiox10030432
Martínez-Noguera FJ, Marín-Pagán C, Carlos-Vivas J, Alcaraz PE. 8-Week Supplementation of 2S-Hesperidin Modulates Antioxidant and Inflammatory Status after Exercise until Exhaustion in Amateur Cyclists. Antioxidants. 2021; 10(3):432. https://doi.org/10.3390/antiox10030432
Chicago/Turabian StyleMartínez-Noguera, Francisco Javier, Cristian Marín-Pagán, Jorge Carlos-Vivas, and Pedro E. Alcaraz. 2021. "8-Week Supplementation of 2S-Hesperidin Modulates Antioxidant and Inflammatory Status after Exercise until Exhaustion in Amateur Cyclists" Antioxidants 10, no. 3: 432. https://doi.org/10.3390/antiox10030432
APA StyleMartínez-Noguera, F. J., Marín-Pagán, C., Carlos-Vivas, J., & Alcaraz, P. E. (2021). 8-Week Supplementation of 2S-Hesperidin Modulates Antioxidant and Inflammatory Status after Exercise until Exhaustion in Amateur Cyclists. Antioxidants, 10(3), 432. https://doi.org/10.3390/antiox10030432