Abstract
Diabetes mellitus (DM) constitutes one of the public health problems today. It is characterized by hyperglycemia through a defect in the β-cells function and/or decreased insulin sensitivity. Apocynin has been tasted acting directly as an NADPH oxidase inhibitor and reactive oxygen species (ROS) scavenger, exhibiting beneficial effects against diabetic complications. Hence, the present study’s goal was to dissect the possible mechanisms by which apocynin could mediate its cardioprotective effect against DM-induced oxidative stress. Male Wistar rats were assigned into 4 groups: Control (C), control + apocynin (C+A), diabetes (D), diabetes + apocynin (D+A). DM was induced with streptozotocin. Apocynin treatment (3 mg/kg/day) was applied for 5 weeks. Treatment significantly decreased blood glucose levels and insulin resistance in diabetic rats. In cardiac tissue, ROS levels were higher, and catalase enzyme activity was reduced in the D group compared to the C group; the apocynin treatment significantly attenuated these responses. In heart mitochondria, Complexes I and II of the electron transport chain (ETC) were significantly enhanced in the D+A group. Total glutathione, the level of reduced glutathione (GSH) and the GSH/ oxidized glutathione (GSSG) ratio were increased in the D+A group. Superoxide dismutase (SOD) and the glutathione peroxidase (GSH-Px) activities were without change. Apocynin enhances glucose uptake and insulin sensitivity, preserving the antioxidant defense and mitochondrial function.
1. Introduction
Diabetes mellitus (DM) is considered an epidemic disease and is one of the fastest-growing challenges of the 21st century. The continued increase is mainly due to progressive urbanization, aging, rising obesity levels, unhealthy diets, tobacco use, and generalized physical inactivity [1]. DM can cause numerous health-weakening complications, decrease quality of life, and cause early death. It is associated with vascular and heart diseases, such as high blood pressure, coronary artery disease, and heart failure, responsible for increased morbidity and mortality [2,3]. The set of cardiovascular diseases causes about 80% of the deaths of diabetic patients. In turn, it has been linked to a broad spectrum of cardiovascular disorders, leading to atherogenesis, endothelial dysfunction, inflammation, vascular remodeling, and oxidative stress [4,5]. The increase in the production of reactive oxygen species (ROS) caused by metabolic changes triggered by diabetes is considered an essential factor in generating heart problems [6,7]. Oxidative stress during DM plays a crucial role in regulating coronary blood flow in response to myocardial metabolism (4) and is associated with a decrease in cardiac efficiency [8]. ROS, together with hyperglycemia, plays a central role in the initiation and progression of vascular damage, supporting the process of atherosclerosis and microvascular dysfunction [9]. Together, these conditions contribute to diabetic cardiomyopathy, which is closely associated with ischemic heart disease and heart failure [10]. The growing need to find alternatives for the treatment of diabetes justifies the study of medicinal plants used in traditional medicine.
Apocynin, a drug isolated from the medicinal herb Picrorhiza kurroa, is presumed to inhibit the expression of NADPH oxidase activity specifically and thus attenuate DM-induced oxidative stress in heart tissue [11]. Previous experiments have shown that apocynin can prevent endothelial dysfunction in diabetic rats, improved ventricular hypertrophy and fibrosis in a heart failure model of myocardial infarction [12,13]. Another study provided hemodynamic, biochemical, and molecular evidence that supported the therapeutic value of apocynin in improving adrenergic stress-induced cardiac hypertrophic [14]. Mitochondria that participate in the generation of reactive oxygen species (ROS) and apocynin have been involved in several disease models as aortic smooth muscle cell proliferation that contributes to the development of arterial remodeling and stenosis, hypertension, and atherosclerosis in metabolic syndrome [15], in hyperoxaluria induced nephrolithiasis [16], Parkinson’s disease [17], as well as in Helicobacter pylori-infected gastric epithelial cells [18]. The use of a novel mitochondrially targeted antioxidant, Mito-apocynin, has been used in cell culture models of neuroinflammation and mitochondrial dysfunction and an animal model of Parkinson’s disease showing enhanced mitochondrial function, anti-inflammatory properties, and attenuation of oxidative damage [19,20]. In this context, previous studies suggested an essential role of apocynin in the biochemical and molecular changes that occur in the heart. This study investigated apocynin’s influence as a beneficial treatment for reducing oxidative stress and improving antioxidant activity in heart tissue and mitochondrial functions with experimental diabetes.
2. Materials and Methods
2.1. Animals
Two-month-old male Wistar rats of 250 g were housed and maintained at 24 °C with 12-h day/night cycles, fed a standard rodent diet, and given water ad libitum. According to the Mexican Federal Regulations’ recommendations for the Use and Care of Animals (NOM-062-ZOO-1999, Ministry of Agriculture, Mexico), all experimental procedures took place. The Universidad Michoacana de San Nicolás de Hidalgo Institutional Committee approved the protocol performed.
2.2. Induction of Diabetes and Experimental Design
After 12 h of fasting, diabetes was induced in rats by intraperitoneal doses of streptozotocin (45 mg/kg of bodyweight) in 0.1 M citrate buffer (pH 4.5) as a vehicle, and normoglycemic rats were injected only with the vehicle. Twenty-four hours after streptozotocin injection, blood glucose levels were determined with an Accu-Check® Performa glucometer (Roche, Indianapolis, IN, USA). Only the rats that exhibited fasting blood glucose of ≥300 mg/dL were employed for this study. After diabetes confirmation rats were randomly divided into 4 groups (n = 6): Control group (C), normoglycemic + apocynin group (A), diabetic group (D), and diabetic + apocynin group (D+A). Apocynin was administered daily at a dose of 3 mg/kg of bodyweight (vehicle, 0.1% dimethyl sulfoxide (DMSO) intraperitoneally for 5 weeks.
2.3. Metabolic Biomarkers
The animals were monitored for weight, basal glucose (fasting), and postprandial glucose using an Accu-Check® Performa glucometer once a week during the 5 weeks of the experimental protocol.
2.4. Insulin Tolerance Test
After 5 weeks of treatment, an insulin tolerance test was performed. After 15 h of fasting, rats were administered a single dose of regular rapid-acting insulin (0.75 U/kg of bodyweight). Blood glucose levels were measured from baseline (before insulin administration t = 0 min); subsequently, blood glucose levels were measured at 30 min, 60 min, 90 min, and 120 min after insulin injection with an Accu-Check® Performa glucometer. The glucose disappearance rate (KITT), derived from the insulin-tolerance test (ITT), was calculated by dividing 0.693 by the plasma glucose half-time (t1/2) × 100 as described previously [21,22]. The plasma glucose t1/2 was calculated from the slope of least square analysis of the glucose concentrations after i.p. insulin injection during the linear phase of decline. This test indicates the action of insulin in periphery tissues showing their sensitivity to the hormone [23].
2.5. Tissue Preparation
The next day after the insulin tolerance test, rats were sacrificed by decapitation and the heart was dissected and immediately placed in an ice-cold buffer (100 mM KCl, 40 mM Tris HCl, 10 mM Tris base, 5 mM MgCl2 y 1 mM EDTA, pH 7.4), chopped and homogenized, and stored at −80 °C until use. Protein content was routinely determined by the Biuret method with bovine serum albumin (BSA) as standard [24].
2.6. Determination of Catalase Enzyme Activity
Using a Clark-type oxygen electrode (5300A Biological Oxygen Monitor, YSI, Yellows Springs, OH, USA), catalase activity was assayed by measuring the conversion of H2O2 according to [25]. First, 0.5 mg of protein of heart homogenate were resuspended in a 50 mM potassium phosphate buffer (pH 7.6) at 25 °C, and the trace was monitored for 1 min. Next, the conversion of H2O2 to oxygen was recorded for 2 min by adding H2O2 to the chamber. Catalase activity was calculated using bovine catalase as standard (expressed as U/mg of protein).
2.7. Measurement of Reactive Oxygen Species
ROS levels were determined according to Ortiz-Avila et al. [26] by using the cell-permeable fluorescent probe 2′,7′-dichlorodihydrofluorescein diacetate (H2DCFDA). 0.5 mg of protein were placed in 2 mL of buffer containing 100 mM KCl, 10 mM HEPES, 3 mM KH2PO4, and 3 mM MgCl2 (pH 7.4) and incubated with 12.5 μM of H2DCFDA for 15 min in an ice-bath under constant shaking and the fluorescence was recorded at 0 and 60 min at 485 nm (ext) and 520 nm (em), in a spectrofluorophotometer (Shimadzu RF-5301PC, Kyoto, Japan) (expressed as units/mg of protein).
2.8. Heart Mitochondria Isolation
Heart mitochondria were isolated, as described by Saavedra-Molina and Devlin, with modifications [27]. In brief, tissue was chopped using a tissue-tearor homogenizer and incubated for 5 min with Trypsin/EDTA solution (2.5 mg/mL/0.2 mg/mL) in isolation media 1 (70 mM sucrose, 220 mM mannitol, 2 mM MOPS and 1 mM EGTA, pH 7.4). The reaction was stopped by adding a protease inhibitor cocktail (completeTM, Mini protease inhibitor cocktail) according to the manufacturer’s instructions and incubated for 1 min. Next, the samples were transferred to a Potter-Elvehjem-type glass homogenizer and homogenized with a Teflon pestle at 750 rpm in an ice bath. The homogenate was centrifuged at 2000 rpm for 10 min at 4 °C. Next, the supernatant was decanted and centrifuged at 7500 rpm for 10 min at 4 °C. The supernatant was removed, and the pellet resuspended carefully in isolation medium 2 (220 mM mannitol, 70 mM sucrose, 2 mM MOPS, and 0.2% w/v BSA) and centrifuged at 10,000 rpm for 10 min at 4 °C. Finally, the pellet was resuspended carefully in isolation medium 2 and stored at −80 °C until use.
2.9. Determination of the Enzymatic Activities of Complexes of the Electron Transport Chain
Complex I activity was determined spectrofluorometrically using the NADH autofluorescence according to [28]. Mitochondria from the different samples were solubilized in 3 repeated freeze/thaw cycles. First, 100 μg/mL of solubilized mitochondria were resuspended in potassium phosphate buffer (50 mM, pH 7.4) and incubated for 5 min with 1 μg antimycin A and 0.5 mM KCN. Next, 40 μL of 10 mM K3[Fe(CN)6] was added to the mixture, and fluorescence was recorded at excitation/emission wavelengths 352/464 nm in a Shimadzu RF-5301PC. After 1 min, 100 μM β-NADH (β-nicotinamide adenine dinucleotide reduced) was added, and the fluorescence was monitored for 2 min, then 5 μM rotenone was added to inhibit the reaction, and the fluorescence was monitored for 2 min. For Complexes II, II + III, and IV activity determination, mitochondria from the different samples were solubilized in 3 repeated freeze/thaw cycles followed by osmotic shock, according to Spinazzi [29] with slight adaptations. Complex II activity, 0.2 mg of mitochondria were resuspended in deionized water and incubated for 2 min to induce an osmotic shock. Next, potassium phosphate buffer (250 mM, pH 7.5) was added to a final concentration of 50 mM, followed by the addition of 5 mM succinate, 5 μM of rotenone, 1 μg antimycin A, 0.5 mM KCN and 0.1 mg of BSA, mixed and incubated for 3 min. Then, 80 μM DCIP was added, and the absorbance changes were monitored for 2 min at 600 nm; then, 0.5 mM of TTFA was added to inhibit the reaction, and the absorbance was monitored for 2 min [30]. Complexes II–III activity, 0.2 mg of mitochondria were resuspended in deionized water as previously described. Thereupon, potassium phosphate buffer (250 mM, pH 7.5) was added to a final concentration of 50 mM and incubated 3 min with 5 mM succinate, 5 μM of rotenone, and 0.5 mM KCN and 0.1 mg of BSA. Later, 250 μg cytochrome c was added, and the changes in absorbance were monitored for 2 min at 550 nm, and 1 μg antimycin A was added and monitored for 2 min [31]. Complex IV activity, 0.1 mg of mitochondria were resuspended in deionized water as previously described. Next, potassium phosphate buffer (250 mM, pH 7.5) was added to a final concentration of 50 mM and mixed with 5 μM of rotenone, 0.5 mM TTFA, 1 μg antimycin A and 0.1 mg of BSA, and incubated 3 min. Then, 125 μg cytochrome c reduced (by sodium dithionite) were added and the absorbance was monitored for 1 min at 550 nm. Finally, 0.5 mM KCN was added and monitored for 1 min [32]. All experiments were performed at 30 °C in a spectrometer Perkin-Elmer UV/Vis Lambda 18.
2.10. Determination of Glutathione Peroxidase Activity
According to the method described by Lawrence and Burk with modifications, the GSH-Px activity was determined [32]. 0.2 mg of mitochondria were resuspended in potassium phosphate buffer 50 mM and 5 mM Na2EDTA and mixed with 1 mM glutathione reduced 1 mM NaN3, 0.1 mg BSA, and 100 mU/mL of glutathione reductase and incubated 5 min. Next, 100 μM of NADPH (β-nicotinamide adenine dinucleotide 2′-phosphate reduced) was added and incubated for an additional 1 min, and the fluorescence was monitored 1 min at excitation/emission wavelengths 352/464 nm, then 250 μM H2O2 was added, and the changes in fluorescence were monitored 3 min at 30 °C in a Shimadzu RF-5301PC. A separate reaction blank was prepared by replacing the sample with deionized water and subtracted from each assay.
2.11. Determination of Glutathione Status
Total glutathione, GSSG and GSH, were determined using an enzymatic recycling method according to [28]. In brief, 100 μL of mitochondria were resuspended in a blend containing 0.1% Triton-X, 0.6% sulfosalicylic acid, 5 mM Na2EDTA in 50 mM potassium phosphate buffer. The samples were sonicated in 3 cycles (sonication/ice) in a Branson sonifier 450 with a tapered microtip (20W output/constant duty cycle); next, the samples were subject to 2 repeated freeze/thaw cycles and centrifugated for 10 min at 7200 rpm. Later, 100 μL of the supernatant was placed in a mixture containing 5 mM Na2EDTA, 0.1 mM 5,5′-dithiobis-2-nitrobenzoic acid and 100 mU/mL glutathione reductase in 50 mM potassium phosphate buffer and incubated for 1 min at room temperature. Then, the reaction was started by the addition of 50 μM β-NADPH and the change in absorbance was registered at 412 nm at 30 °C in a spectrometer Perkin-Elmer UV/Vis Lambda 18 and changes in absorbance were recorded for 5 min. GSSG from the different samples was determined after incubation with 0.2% 4-vinylpyridine at room temperature for 1 h. GSH from the different samples was calculated by subtracting GSSG from the total glutathione and the GSH/GSSG ratio was calculated by dividing the GSH levels by the GSSG levels.
2.12. Determination of Superoxide Dismutase
The enzymatic activity of superoxide dismutase (SOD) was determined using Sigma-Aldrich SOD assay kit-WST (19160) (Sigma, St. Louis, MO, USA), following the manufacturer’s instructions.
2.13. Statistical Analysis
Results were expressed as the mean ± standard error. Statistical analyses were performed with one-way or two-way analysis of variance (ANOVA) with Tukey’s multiple comparison test. A p-value of ≤ 0.05 was considered statistically significant. All data were analyzed using Prism (GraphPad 7.0 version, Inc., San Diego, CA, USA).
3. Results
3.1. Effect of Apocynin on Bodyweight and Fasting and Postprandial Blood Glucose Levels
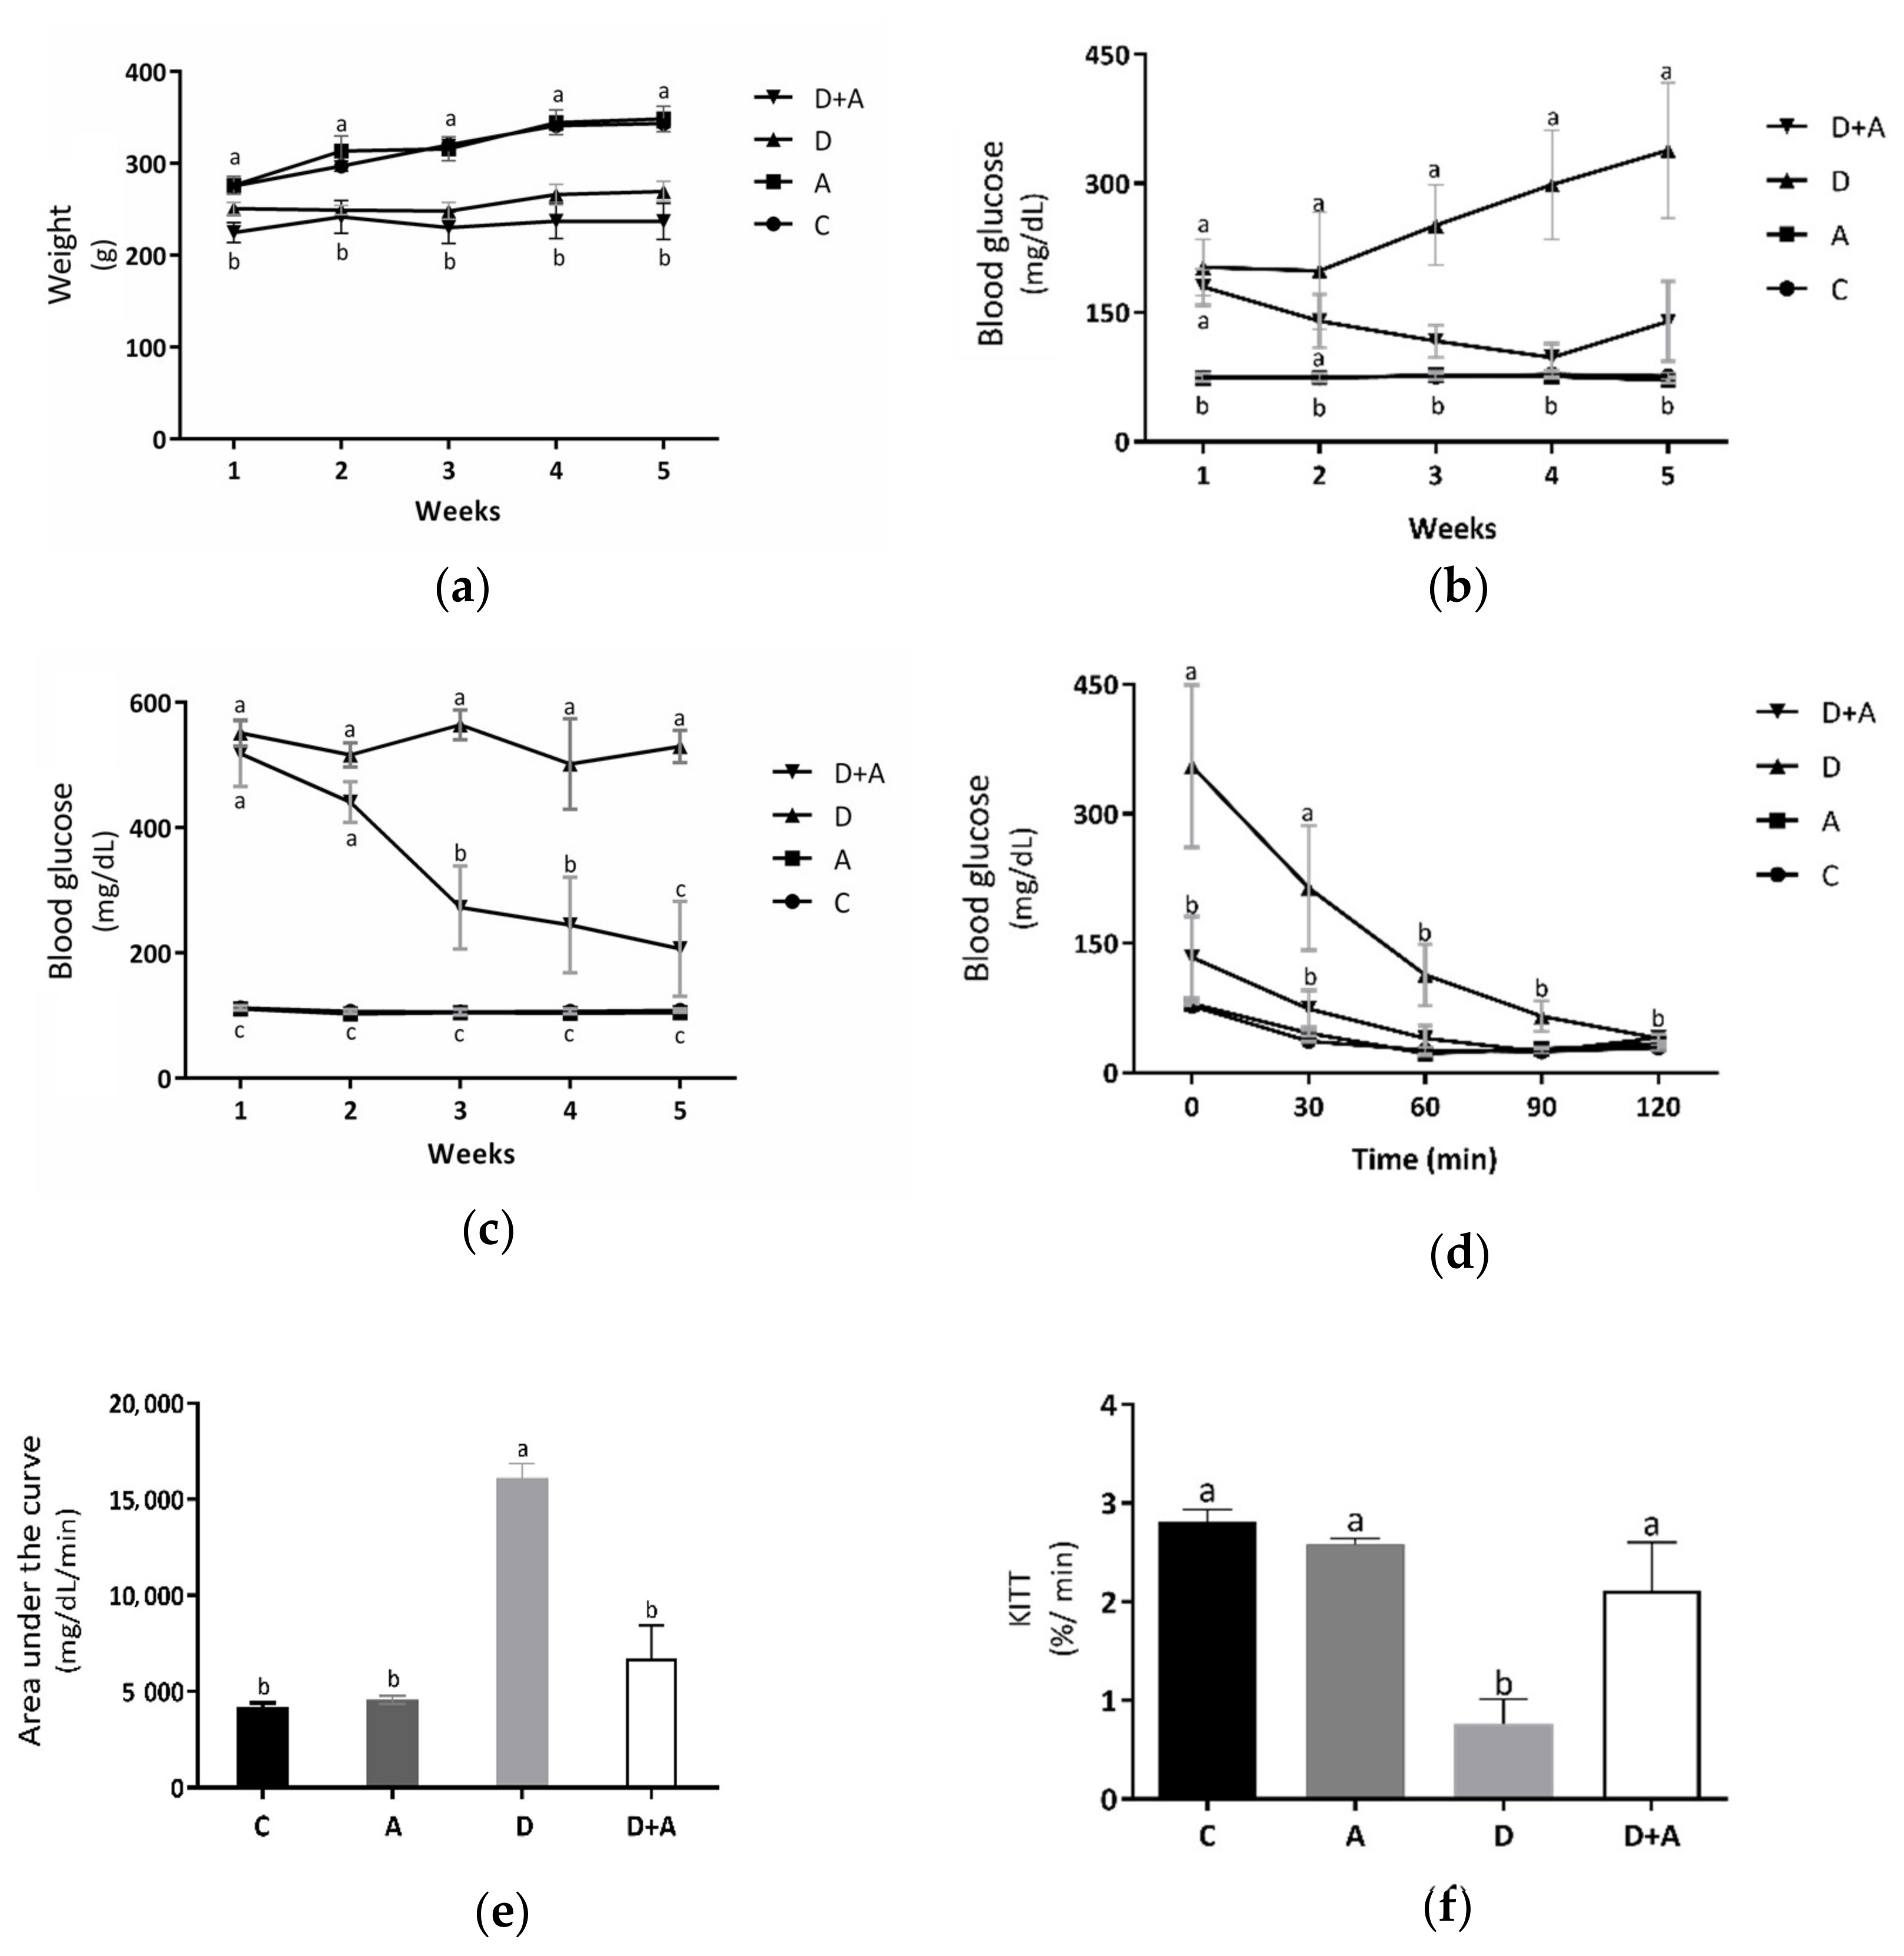
Metabolic biomarkers such as bodyweight (Figure 1a and fasting (Figure 1b and postprandial blood glucose levels (Figure 1c were evaluated to determine the effect of apocynin in the different groups. Measurements were made during the treatment period (5 weeks). As shown in Figure 1a, it was observed that the results obtained from the bodyweight measurements did not show significant differences in the group treated with apocynin (319.7 ± 11.71 g) compared to the control group (315.4 ± 4.56 g). In the diabetic rats treated with apocynin (233.49 ± 13.29 g), a reduction in bodyweight was observed compared to the control group of 26%. However, there were no significant differences with the diabetic group. It indicated that apocynin does not affect the bodyweight of diabetic rats. In fasting blood glucose levels (Figure 1b, the group treated with apocynin (74.53 ± 2.56 mg/dL), compared to the control group (76.06 ± 2.09 mg/dL), there were no significant differences, while in the diabetic group (258.1 ± 52.29 mg/dL) there were increased values by 239% compared to the control group. The diabetic group treated with apocynin (134.93 ± 10.21 mg/dL) presented glucose levels increased by 77%, concerning the control group, but did not present statistically significant differences. As of the third week, significant differences between the diabetic group and the diabetic group treated with apocynin began to be observed, demonstrating that the drug affects the blood glucose levels of diabetic rats. Figure 1c shows the postprandial blood glucose levels. There were no significant differences between the control group (107.8 ± 2.58 mg/dL) and the group treated with apocynin (102.03 ± 2.93 mg/dL). On the other side, in the diabetic group (532.46 ± 27.64 mg/dL), an increase of 394% was observed, compared to the control group, and there were significant differences. The diabetic group treated with apocynin (336.53 ± 49.62 mg/dL) presented glucose levels increased by 212%, compared to the control group. What can be observed in the graph is that both diabetic groups (treated and untreated), in the first two weeks, had significant differences against the other two groups, but not between each other. However, in week three, in the diabetic group treated with apocynin, blood glucose levels began to decline gradually. A 47% decrement was observed in the first week, 53% in the third week, and 60% in the fourth. There was no longer a statistically significant difference between this group and the control in the fifth week. Taking this into account, what was described in the previous figure was corroborated; the treatment from the third week began to have positive effects on glucose levels, either in fasting or postprandial glucose of rats with DM. The insulin sensitivity test that can be observed in Figure 1d showed a significant increase in blood glucose in diabetic rats, compared to the control group as follows: 355.2 ± 94.17 mg/dL at 30 min, 214.14 ± 72.07 mg/dL at 60 min, and 76 ± 4.08 mg/dL at 30 min, 37.5 ± 1.43 mg/dL at 60 min, respectively. After 90 min, the diabetic group did not show significant differences against the control group, indicating a deterioration in glucose uptake during the first hour, a situation established in experimental diabetes, but this became normal during the following periods. On the other side, in the group of diabetic rats + apocynin, it was observed that from the beginning, their blood glucose values (133.8 ± 47.64 mg/dL at baseline, 74 ± 21.35 mg/dL at 30 min, 39.8 ± 14.79 mg/dL at 60 min, 24.2 ± 0.91 mg/dL, at 90 min and 40.8 ± 3.77 mg/dL at 120 min) did not present statistically significant differences compared with the control groups. With the results obtained from the blood glucose during the insulin sensitivity test, the area under the curve (AUC) (Figure 1e was calculated as an integrated expression of the glucose concentration. The AUC increased significantly in the diabetic group (16,132 ± 742.14 mg/dL/min) compared to the control group (4218.6 ± 182.42 mg/dL/min) by 282%; this, as a function of the significantly higher values of glucose in the blood that was present during the pathology. In contrast, the group treated with apocynin (6758.2 ± 1510.53 mg/dL/min) increased by only 60% concerning the control but did not show significant differences. Comparing the diabetic + apocynin group against the diabetic without treatment, a difference of 222% was appreciated, with significant values of a p < 0.0001, thus showing that the drug had positive effects on insulin sensitivity to lower blood glucose levels. As depicted in Figure 1f, the KITT values, an index of insulin sensitivity, were significantly lower in the diabetic group (0.77 ± 0.24%/min; p = 0.001) than in the control group (2.80 ± 0.13%/min). In contrast, the KITT value of the diabetic+apocynin group (2.11 ± 0.48%/min; p = 0.04) was significantly higher compared with the untreated diabetic group, thus showing that the drug had positive effects on insulin sensitivity.
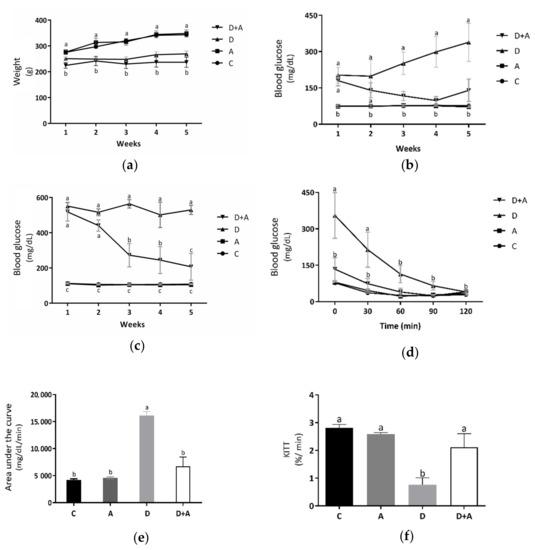
Figure 1.
Effect of Apocynin on metabolic biomarkers. This figure shows bodyweight of the different groups of rats (a) (g); fasting glucose levels (b) (mg/dL); postprandrial glucose levels (c) (mg/dL); glucose levels in the insulin-tolerance test (ITT) (d) (mg/dL); area under the curve (e) (mg/dL/min); glucose disappearance rate (KITT) during the ITT (f) (%/min). C = control; A = apocynin; D = diabetic; D+A = diabetic + apocynin. n = 6. Data are presented as the mean ± standard error. (2-way ANOVA, Tukey post-hoc test). The different letters (lower case) indicate the significant differences between groups with p < 0.05.
3.2. Effect of Apocynin on the Levels of Reactive Oxygen Species in the Heart Muscle
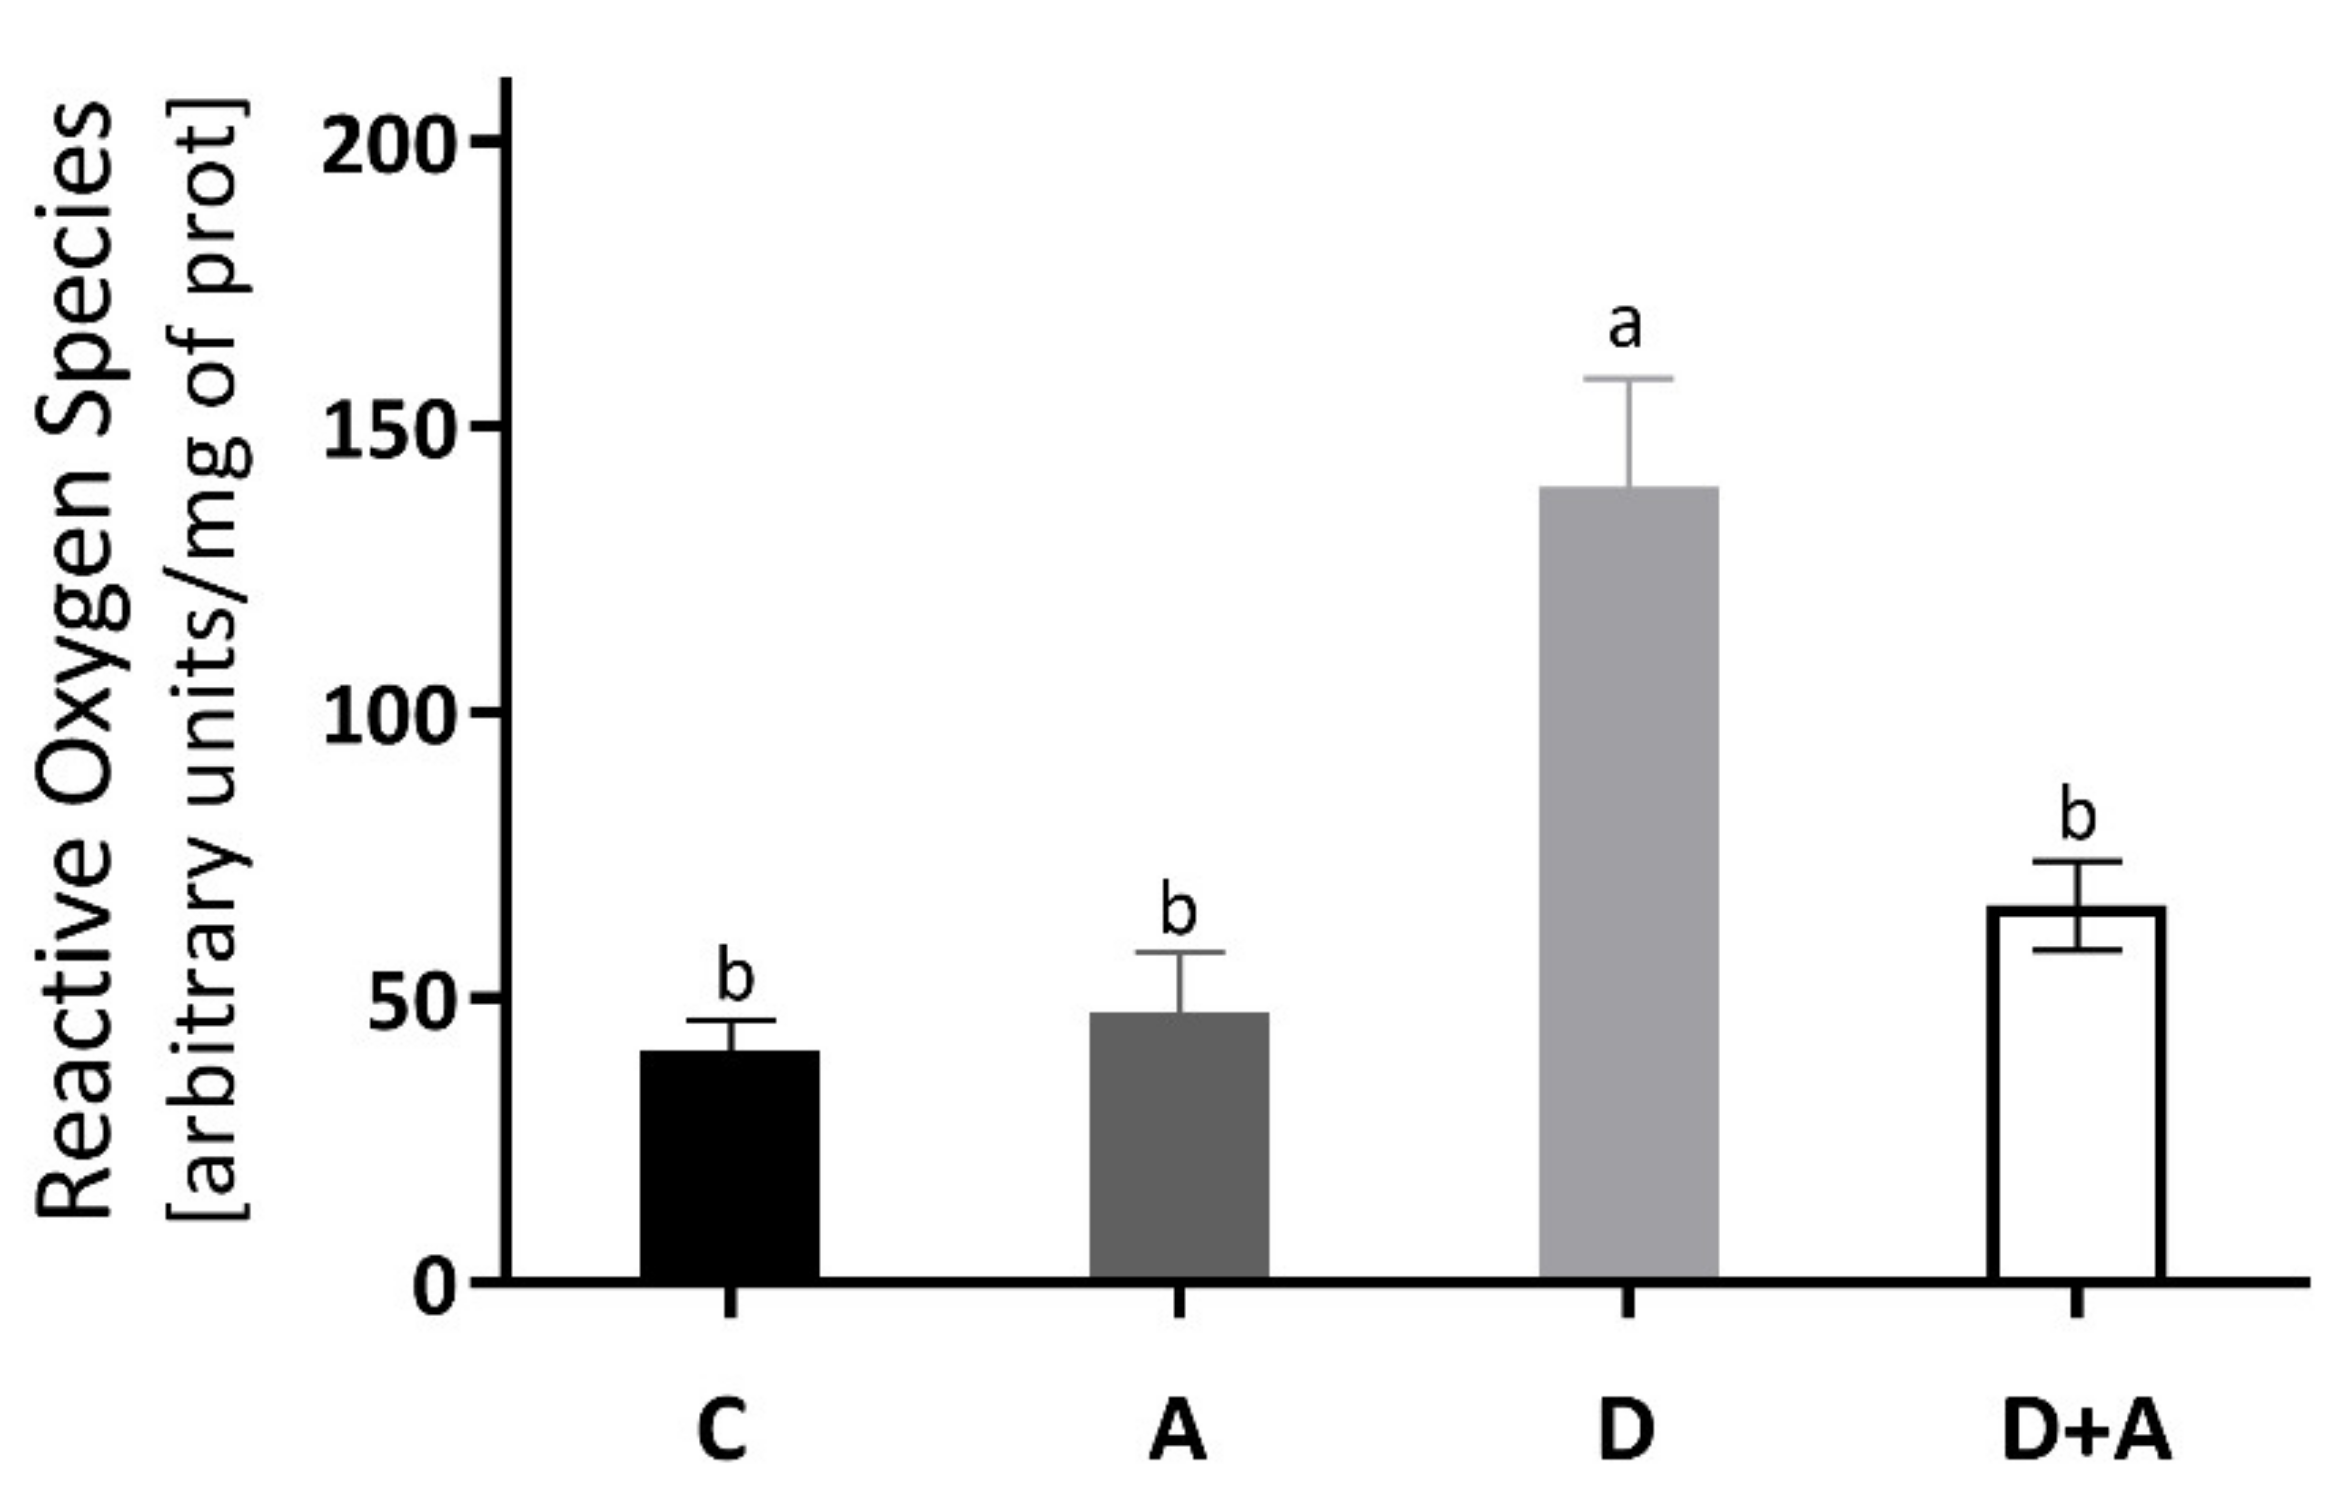
The results obtained for the determination of ROS of the heart muscle are shown in Figure 2, and it was observed that there was an increase of 244% in the group of diabetic rats (140.10 ± 16.009 ΔF) compared to the control group (40.68 ± 5.45 ΔF). Even though the diabetic group + apocynin (65.33 ± 4.60 ΔF) had an increase of 61% in ROS levels, it did not present significant differences to the control group, nor the control group treated with apocynin (47.40 ± 10.64 ΔF). On the other hand, when comparing the diabetic group to the diabetic group with treatment, a significant difference of ** p < 0.0016 was observed (an increase of 180.20%).
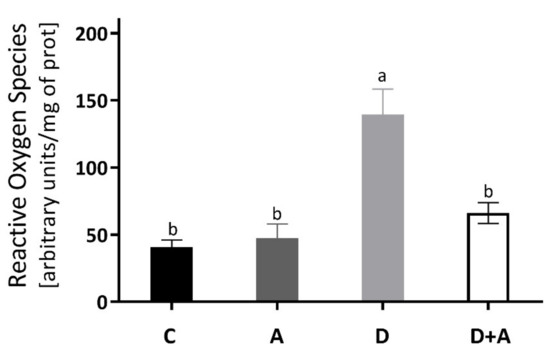
Figure 2.
Levels of Reactive Oxygen Species in the heart of different groups of rats. This figure shows the Reactive Oxygen Species (ΔF) levels in the heart for each group C = control, A = apocynin, D = diabetic, D+A = diabetic + apocynin. n = 6; Data are presented as the mean ± standard error (One-way ANOVA, Tukey posthoc test). The different letters indicate the significant differences between groups, with p < 0.05.
3.3. Effect of Apocynin on Catalase Activity in the Heart Muscle
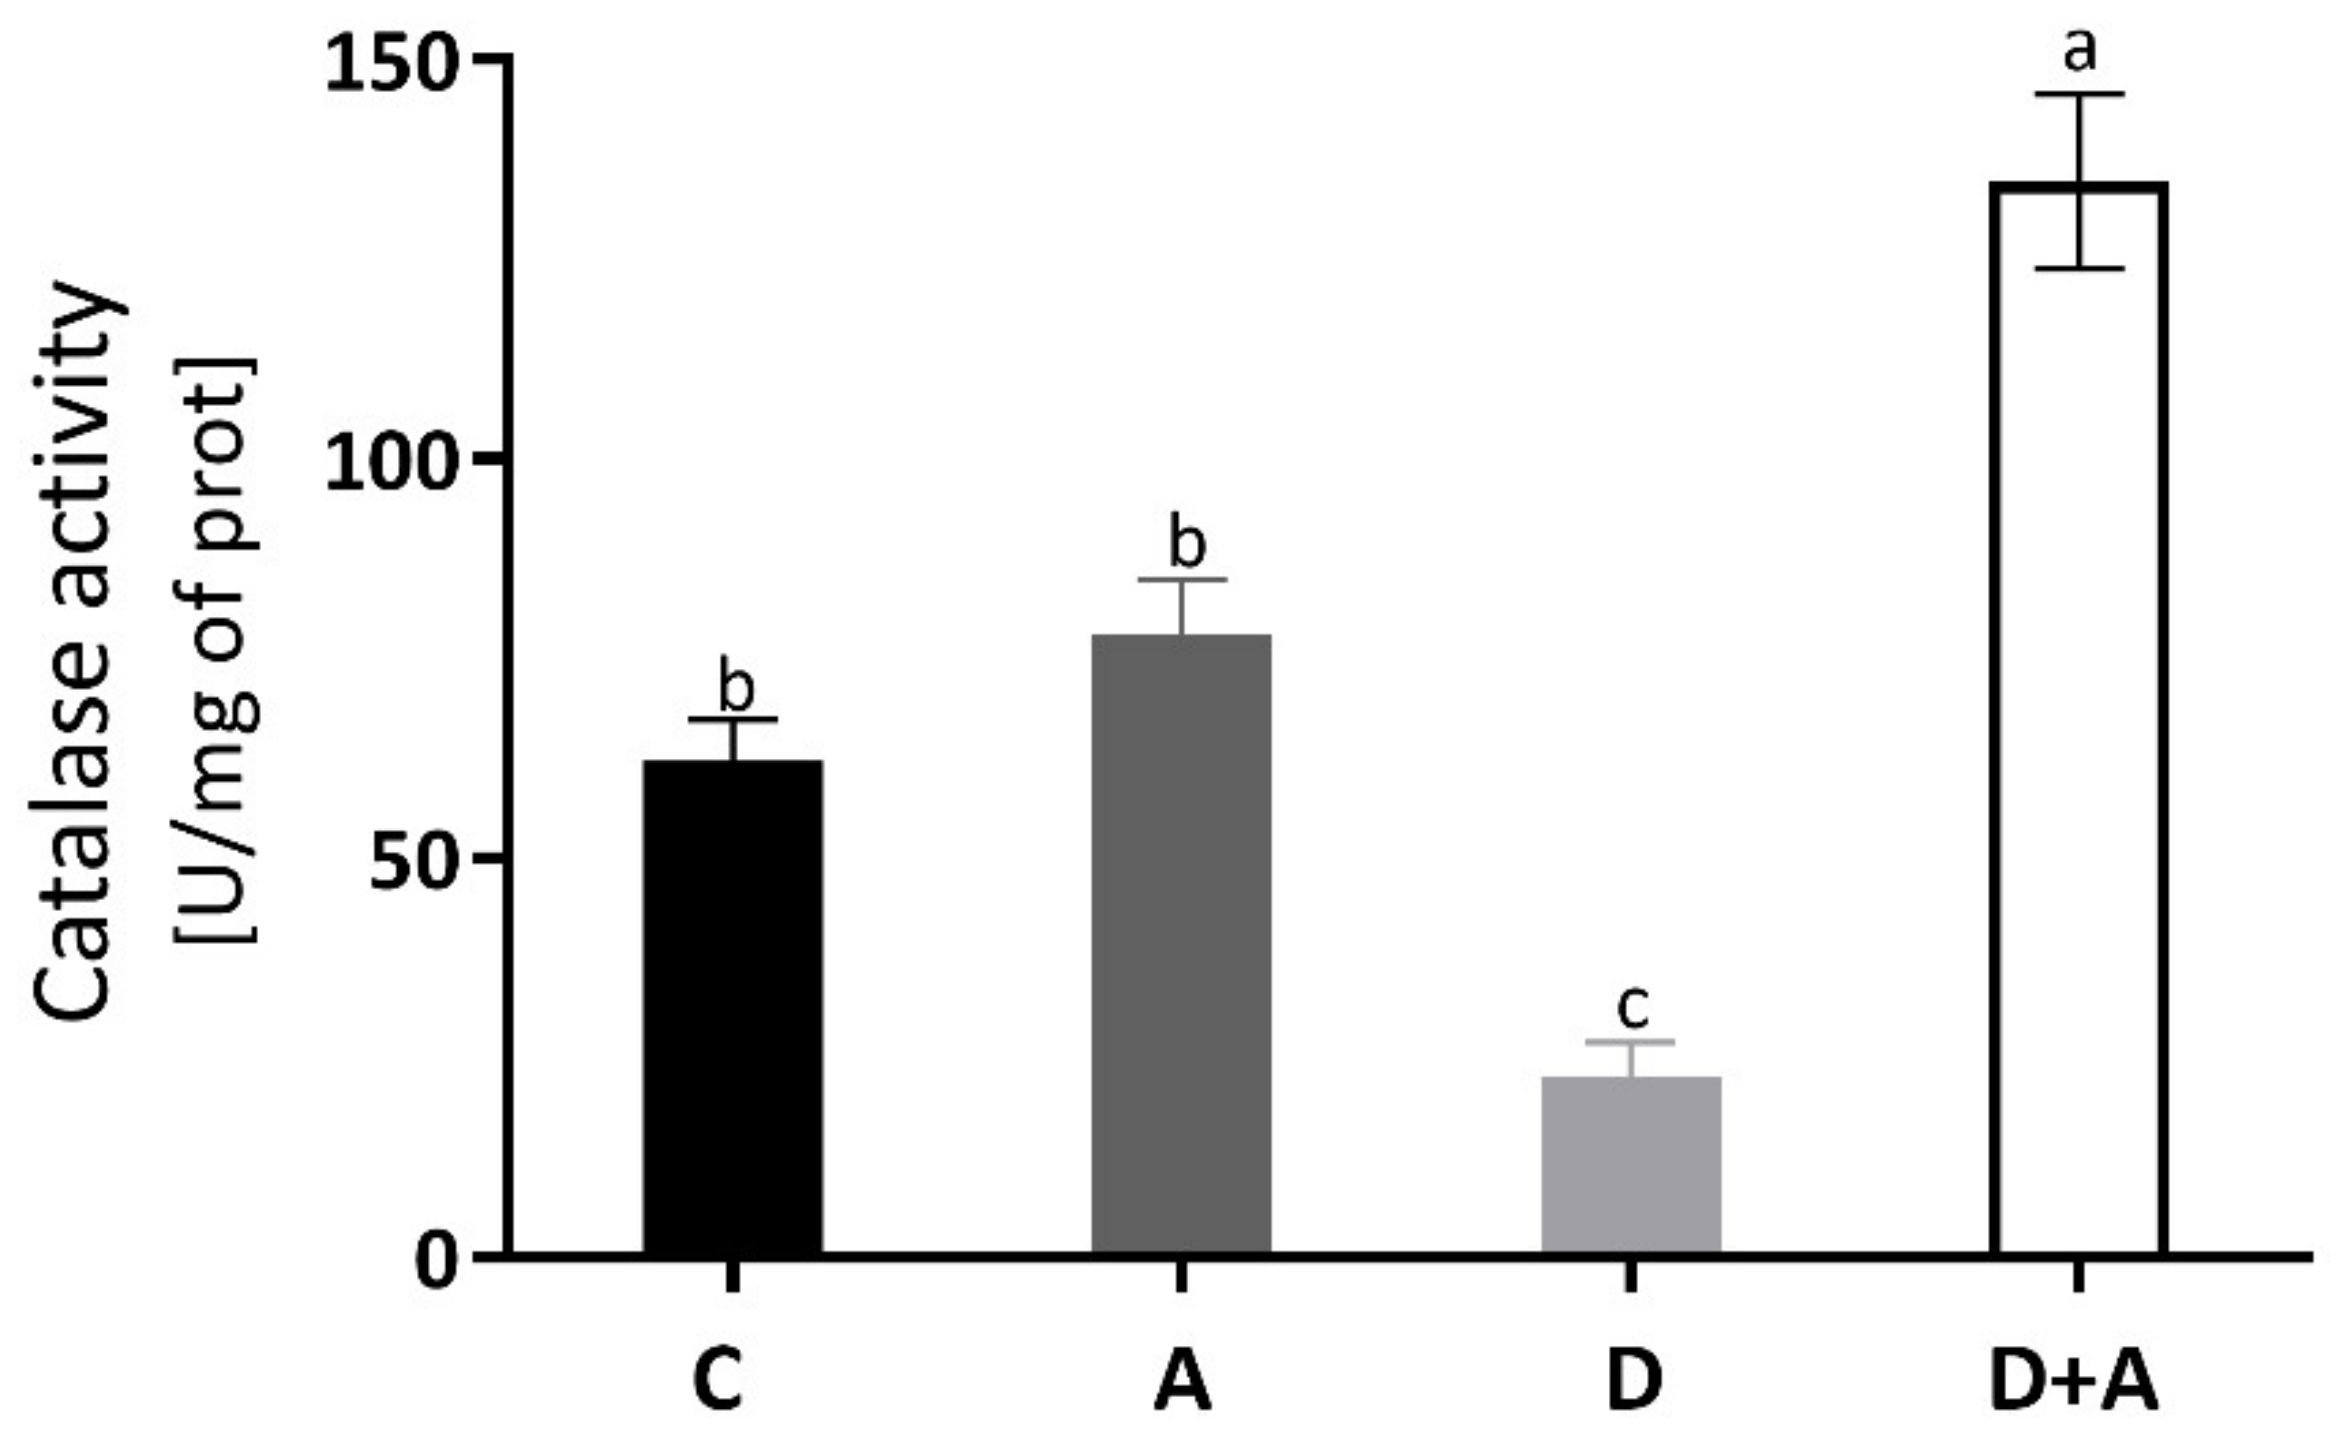
The catalase enzyme activity was measured to evaluate the antioxidant system, and the results are observed in Figure 3. In the diabetic group (22.72 ± 9.32 U/mg of prot) without treatment, a decrease of 63% was observed compared to the control group (62.13 ± 11.66 U/mg of prot), presenting statistically significant differences. In the diabetic group + apocynin (134.69 ± 24.44 U/mg of prot), there was an increase of 117% compared to the control group; significant differences were presented. The control group + apocynin (78.03 ± 15.51 U/mg of prot) presented an increase of 26%, without being statistically significant compared to the control group. The diabetic group and the diabetic group treated with apocynin did.
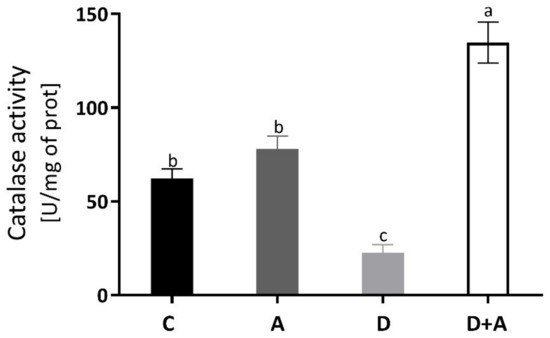
Figure 3.
Catalase enzyme activity in the heart of different groups. This figure shows the catalase enzyme activity (U of activity/mg of prot) in the heart for each group C = control, A = apocynin, D = diabetic, D+A = diabetic + apocynin. n = 6. Data are presented as the mean ± standard error (One-way ANOVA, Tukey posthoc test). The different letters indicate the significant differences between groups, with p < 0.05.
3.4. Effects of Apocynin on Mitochondrial Complex Activities
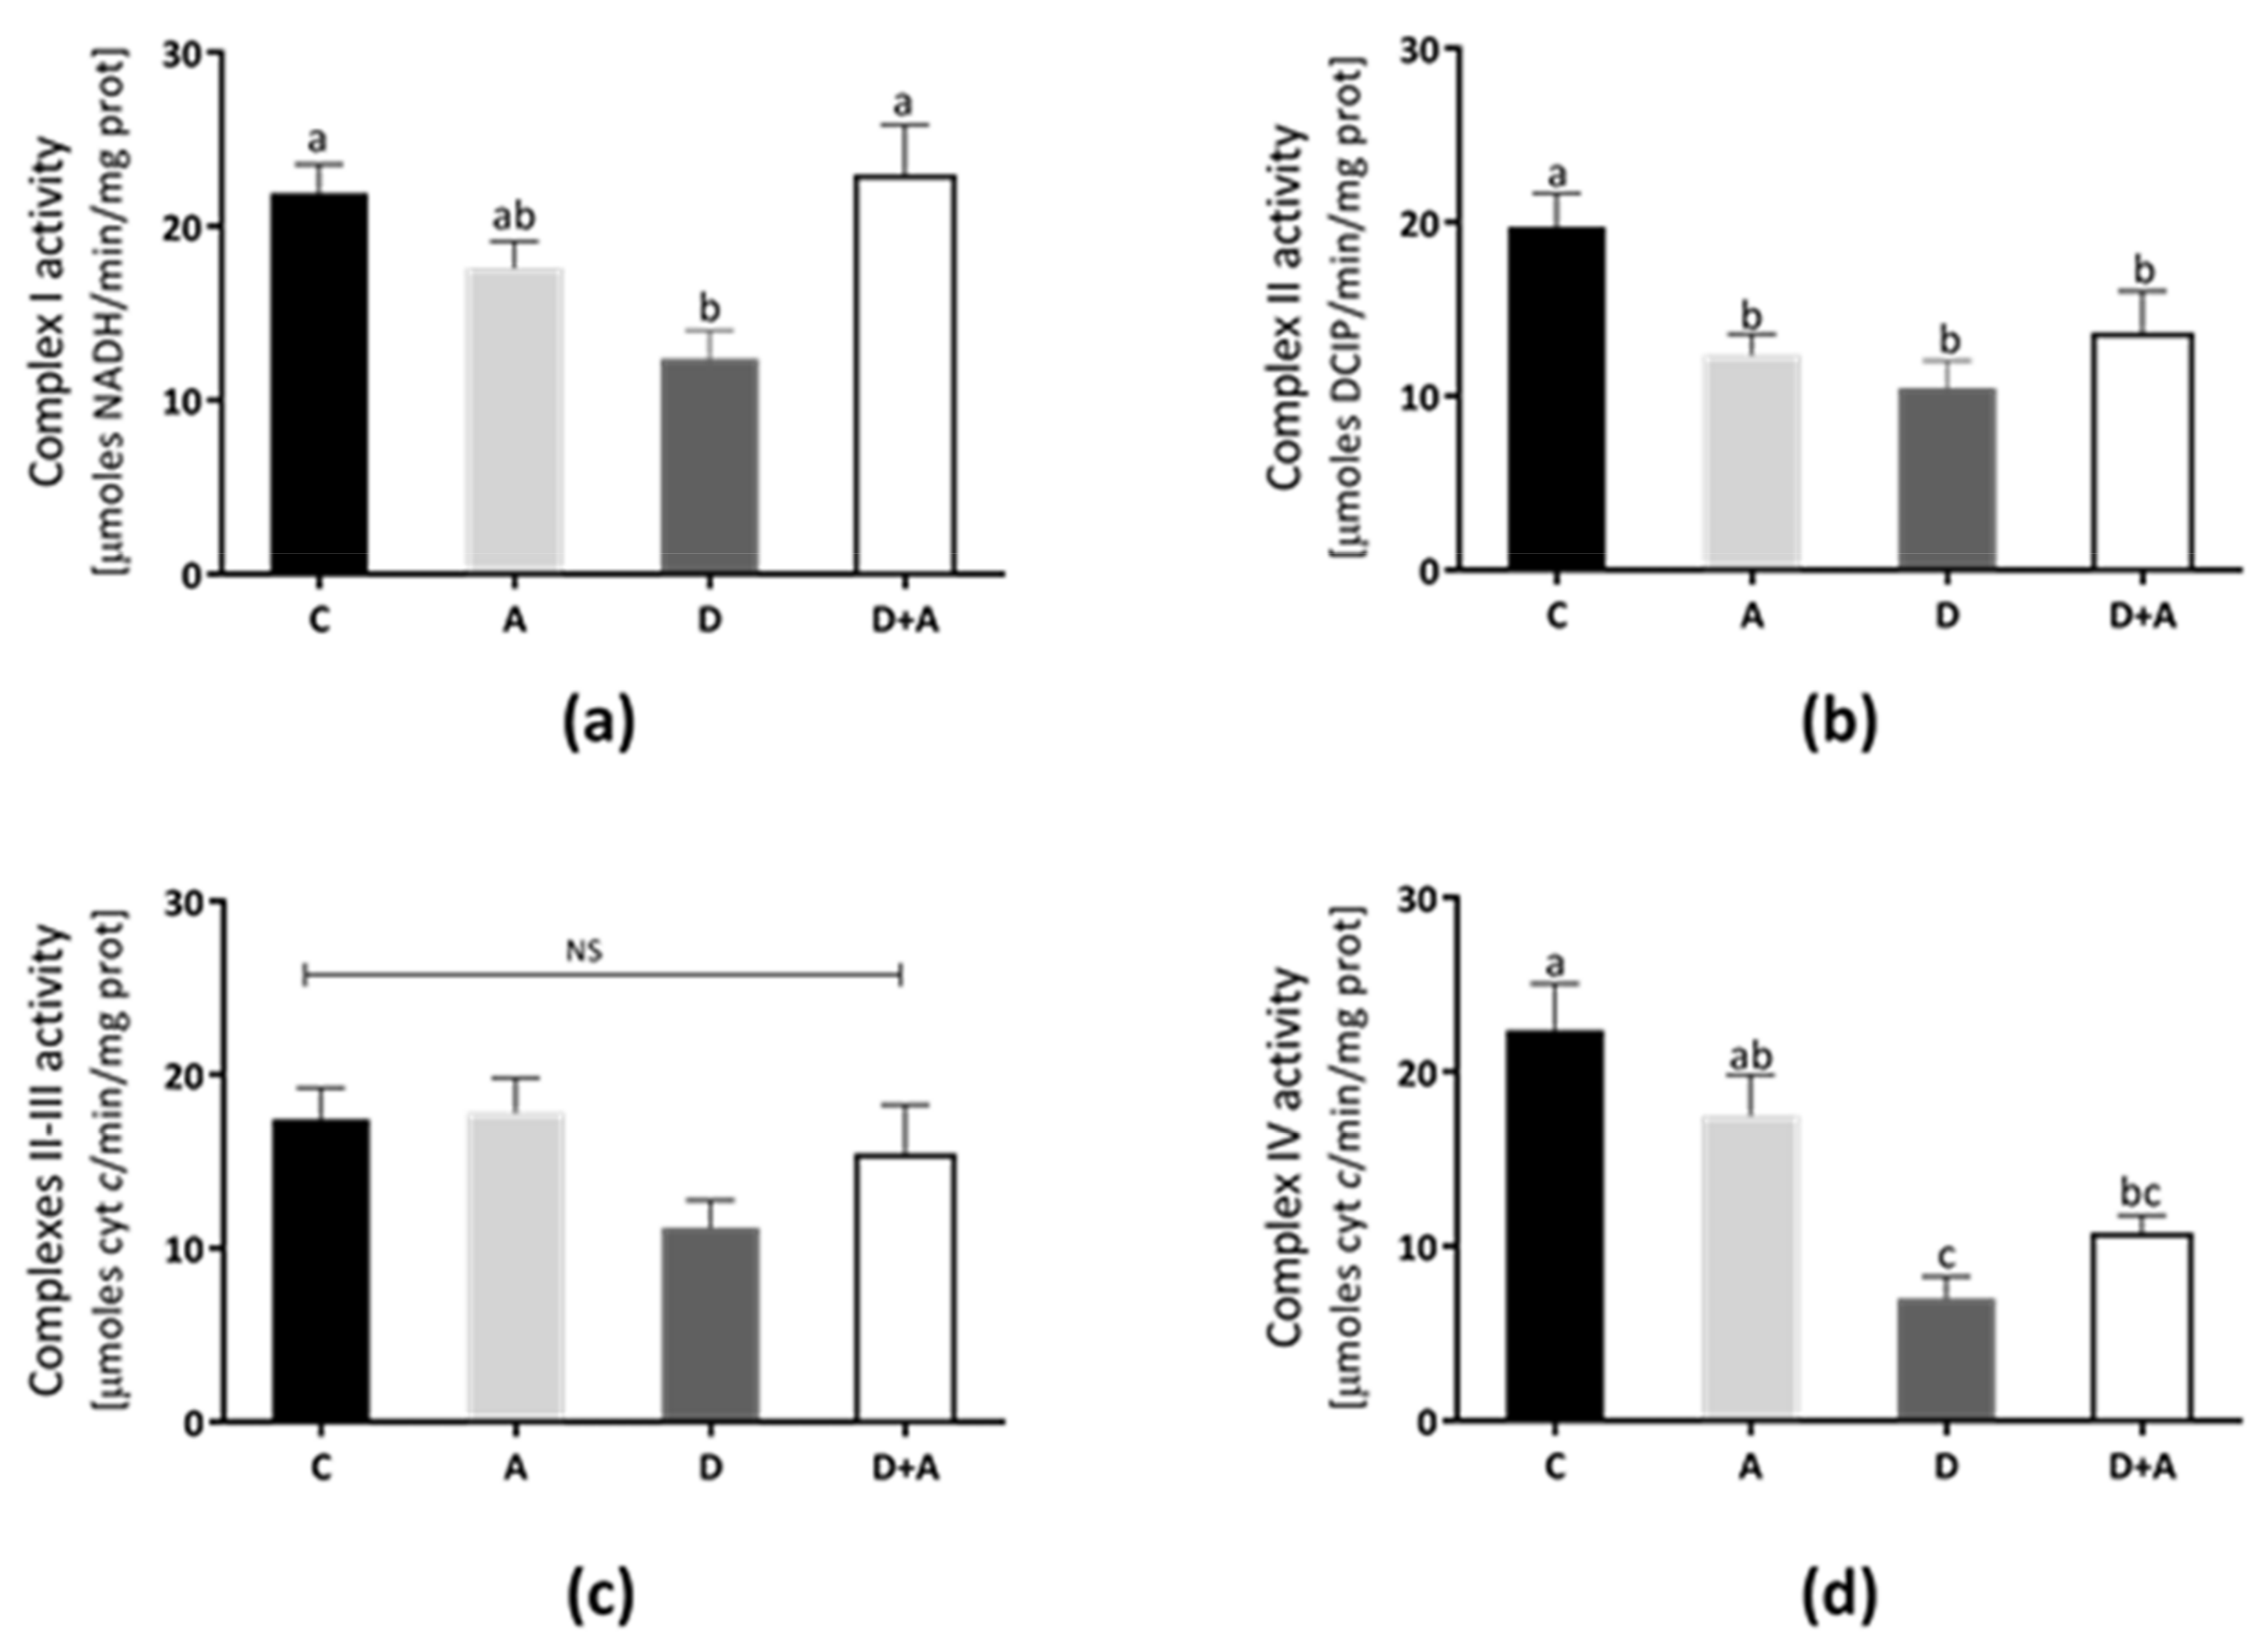
The rat heart mitochondrial complexes’ activities were determined to elucidate the apocynin effects on mitochondrial functions (Figure 4). In Complex I (Figure 4a), Complex II (Figure 4b), Complex III (Figure 4c), and Complex IV (Figure 4d) show that the lowest activity values were in the diabetic group (40%, 36%, 29%, and 70%, respectively). In contrast, Complex I and II/III activities from the apocynin + diabetes group (D+A) were normalized, compared to control (10% above control, and were significantly increased compared with the diabetic group, for Complex I only). On the other hand, in the apocynin group, Complex III was increased 6% above control (Figure 4c), whereas, in the apocynin + diabetes group, the activity increased to 24% compared diabetic group. Complex IV activity increased by 42% in the apocynin + diabetes group compared diabetic group (Figure 4d).
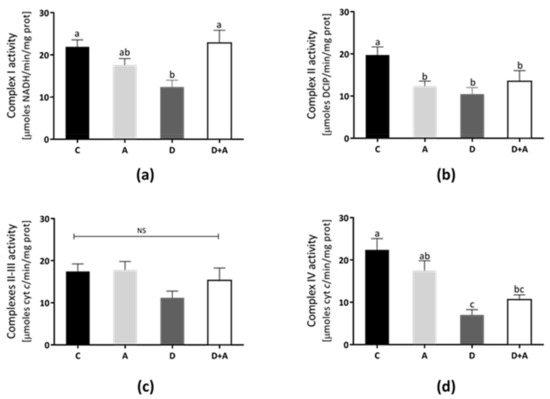
Figure 4.
Effect of apocynin on enzymatic activities of complexes of the electron transport chain (ETC) in heart mitochondria. (a) Complex I activity. (b) Complex II activity. (c) Complexes II–III. (d) Complex IV. Different letters indicate significant differences between groups, ns: Not significant, (p ≤ 0.05) by one-way ANOVA with Tukey post hoc test. Values represent means ± SEM. Control group, C, normoglycemic + apocynin group, A, diabetic group, D, and diabetic + apocynin group, D+A.
3.5. Effects of Apocynin on Oxidative Stress in Heart Mitochondria
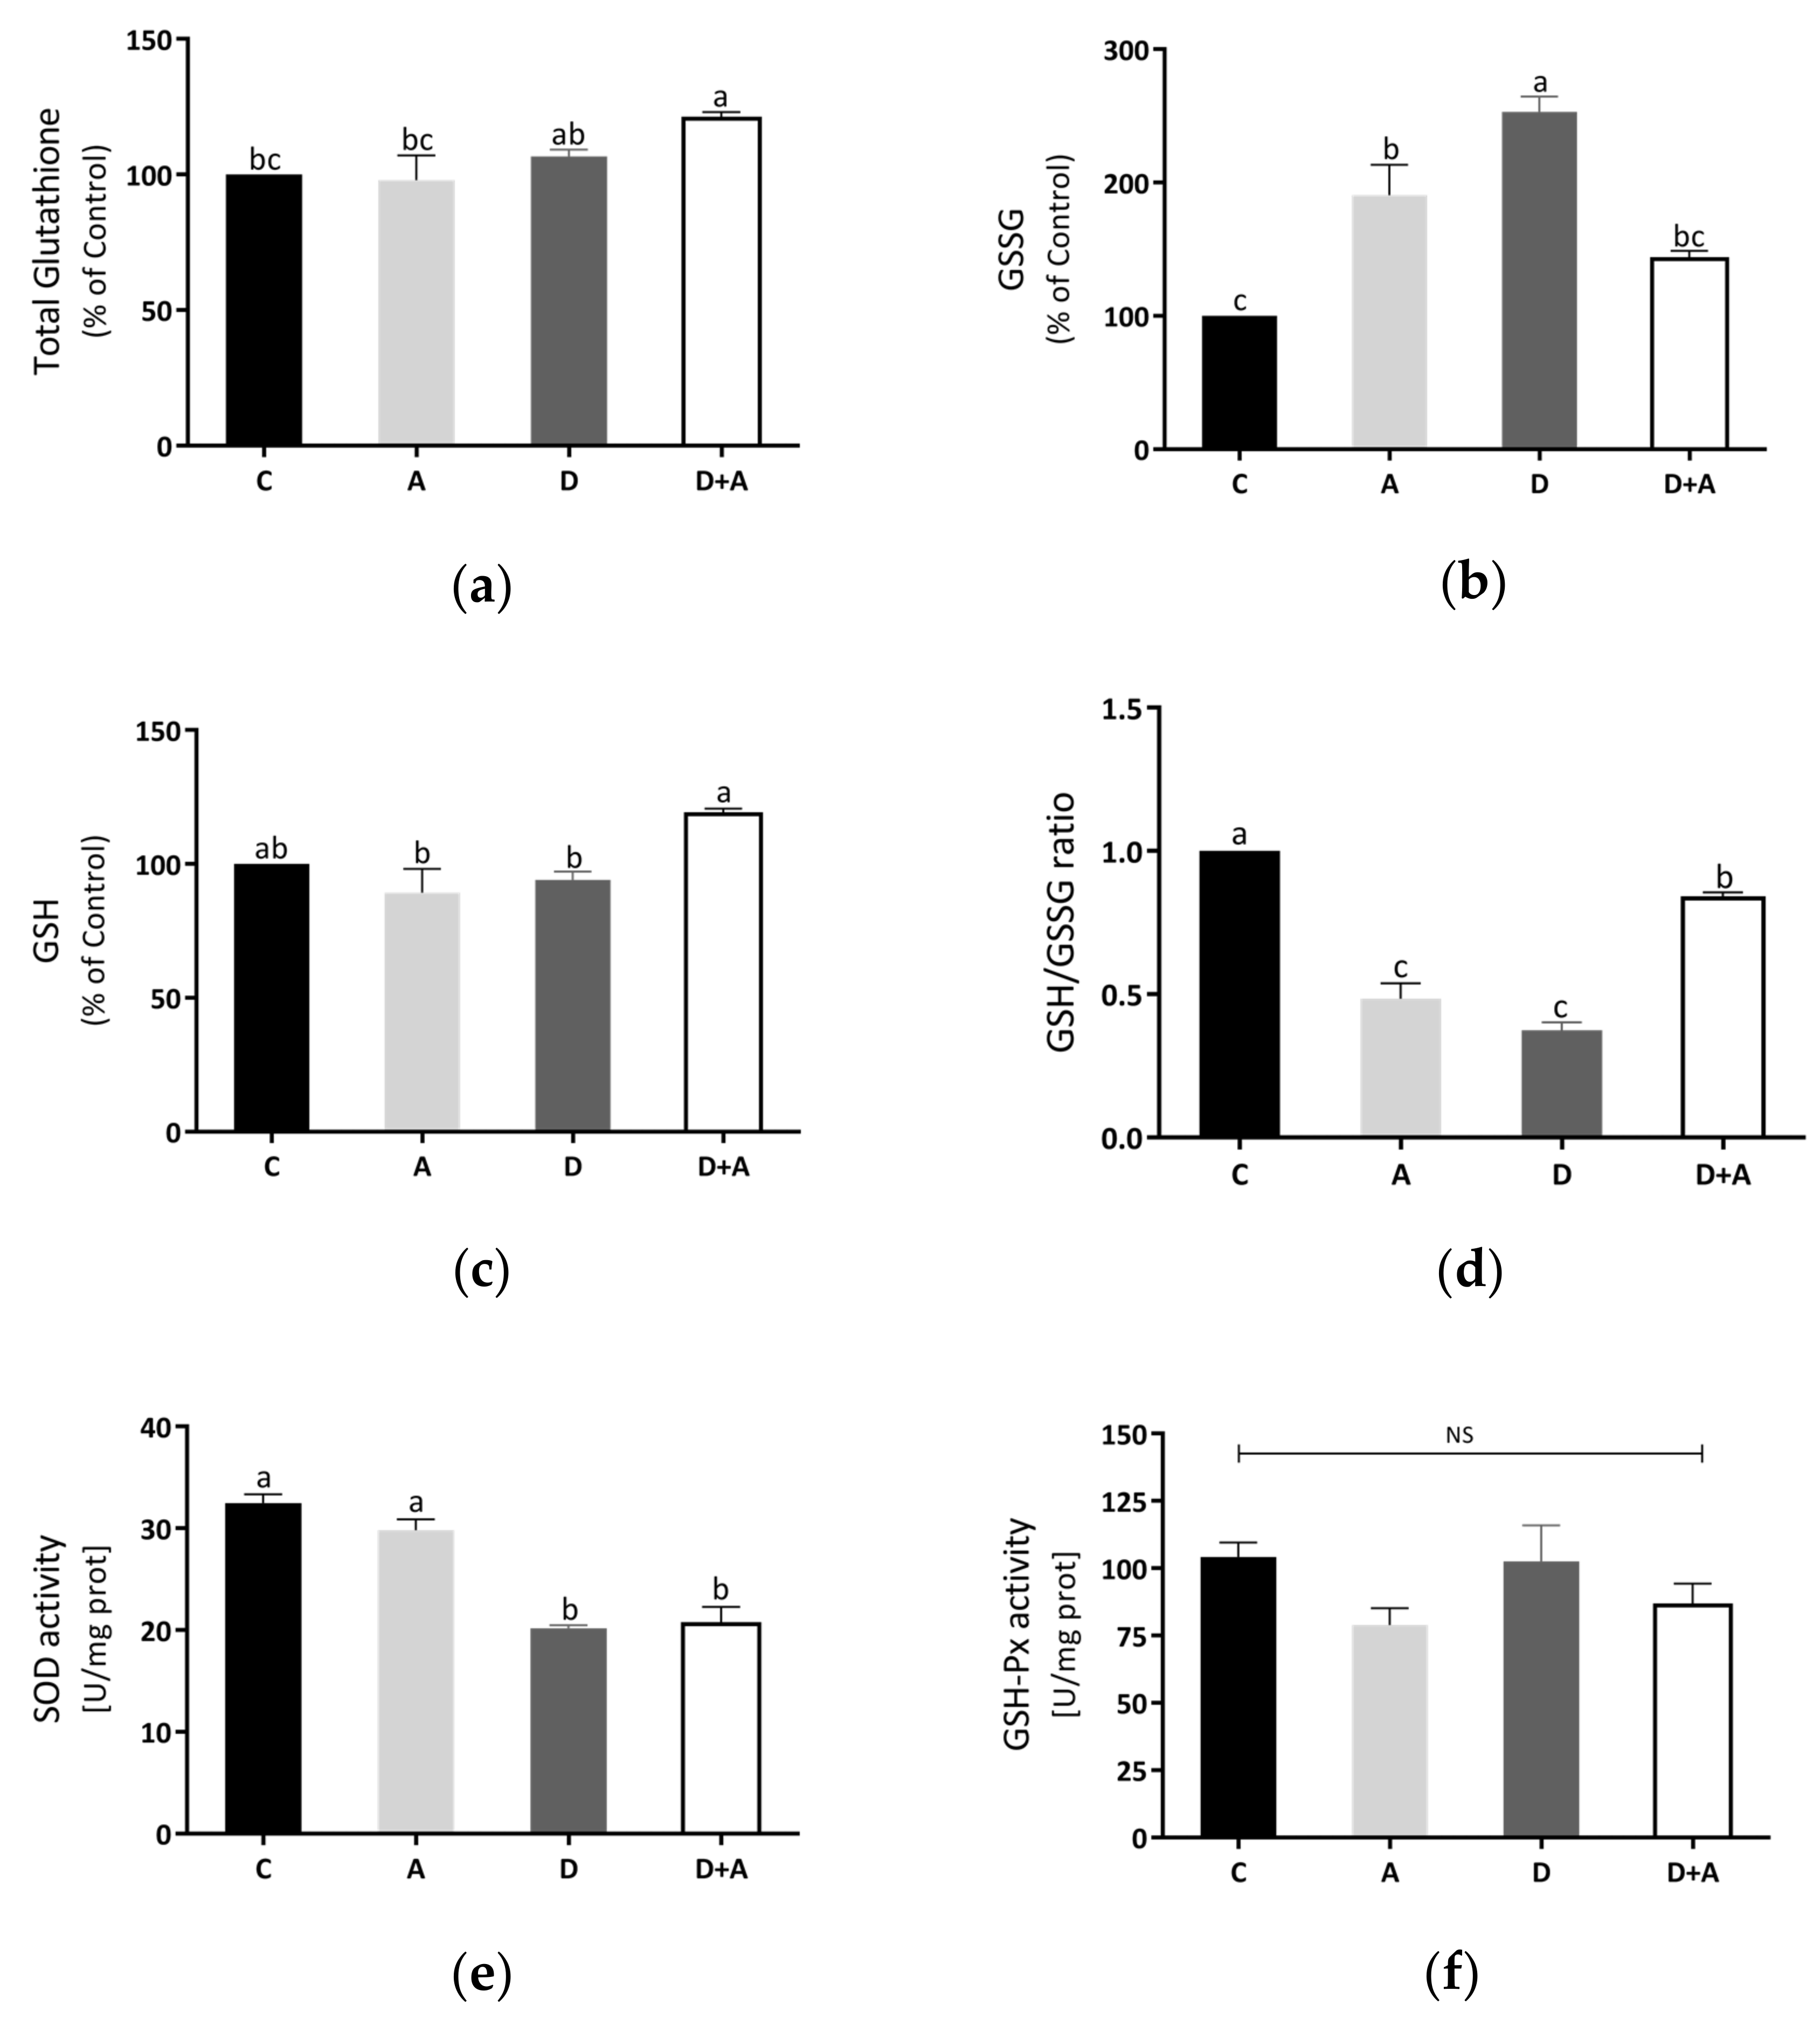
Total glutathione and GSH were increased in the diabetes + apocynin group in Figure 5a,c, compared to the control group. The oxidized GSSG values had a significant increase in the diabetes group, although a diminution was observed in the diabetes + apocynin group (Figure 5b). The GSH/GSSG ratio was significantly diminished in the diabetes group, with a significant increase in the diabetes + apocynin group (Figure 5d). We also analyzed the antioxidant mitochondrial biomarker enzymes, superoxide dismutase 2, and glutathione peroxidase (Figure 5e,f). SOD2 activity was diminished in the diabetes group and showed a significant increase in the apocynin group (Figure 5e). At the same time, GSH-Px activity showed no significant differences between the different groups tested (Figure 5f).
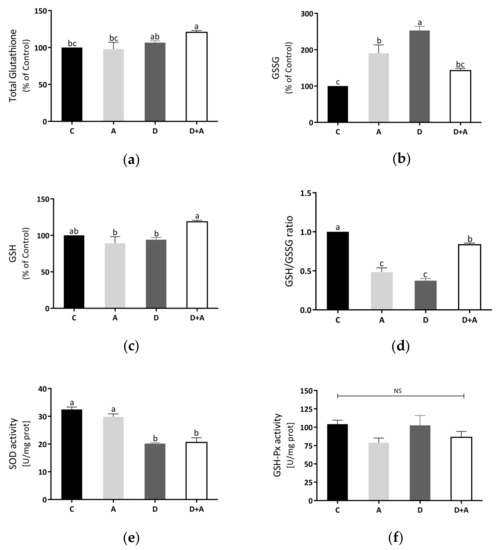
Figure 5.
Effect of apocynin on oxidative stress in heart mitochondria. (a) Total glutathione. (b) Oxidized glutathione. (c) Reduced glutathione. (d) GSH/GSSG ratio. (e) SOD activity. (f) GSH-Px activity. Different letters indicate significant differences between groups; ns: Not significant (p ≤ 0.05) by one-way ANOVA with Tukey post hoc test. Values represent means ± SEM. Control group, C, normoglycemic + apocynin group, A, diabetic group, D, and diabetic + apocynin group, D+A.
4. Discussion
The chronic hyperglycemic state characteristic of DM is linked to oxidative stress damage in various tissues, a critical component involved in triggering diabetic complications, such as diabetic cardiomyopathy [7]. Thus, ROS has emerged as a target for therapy against diabetes, using based strategies to boost cellular antioxidant capacity and ROS detoxification to mitigate oxidative stress. In the current study, we have shown the effects of apocynin administration during five weeks as a beneficial treatment by reducing oxidative stress, lowering blood glucose levels, increasing insulin sensibility, leading to improve cellular and mitochondrial-localized antioxidant defenses in heart tissue of STZ-induced diabetic rats. Our findings also identify the glutathione status redox and mitochondrial ETC as apocynin’s targets in diabetic cardiac mitochondria.
Consistently, our study demonstrates that in the diabetic group, metabolic parameters were significantly affected; fasting and postprandial hyperglycemia, low insulin sensitivity, as well as a noticeable lower weight, compared to the control group (Figure 1), which matches what was previously reported in rats treated with STZ to establish an experimental diabetes model [3,4]. Notably, apocynin treatment at a dose of 3 mg/kg contributed to a significant reduction of fasting and postprandial glucose levels from the third week of treatment; however, no differences were observed in the bodyweight gain of the diabetic group (Figure 1). In support of our results, a previous report revealed that inhibition of renal gluconeogenesis is involved in apocynin hypoglycemic action in diabetic rabbits [33]. Furthermore, insulin sensitivity significantly improved after apocynin treatment in diabetic rats (Figure 1e), which is also similar to other authors’ results, where following apocynin treatment for five weeks markedly, there was an improvement in insulin sensitivity in high-fat diet (HFD)-induced obese mice [34]. Subsequently, similar findings demonstrated that apocynin significantly reduced hyperglycemia, hyperinsulinemia, and dyslipidemia by improving insulin sensitivity in HFD fed mice as well [35].
Diabetes-related systemic insulin resistance causes alterations in cardiac metabolism, and hyperglycemia undoubtedly elicits detrimental cardiomyocyte function effects [36]. The loss in flexibility between energy sources causes reduced cardiac efficiency, contractile dysfunction, with adverse tissue remodeling, which is a hallmark of diabetic cardiomyopathy. Moreover, there is evidence linking a disrupted cardiac insulin signaling to overproduction of ROS, mitochondrial dysfunction, and oxidative stress, which are significant metabolic abnormalities implicated as well [36,37]. In our study, STZ-induced insulin deficiency triggered the overproduction of ROS in the diabetic heart. Meanwhile, apocynin significantly reduced ROS levels compared to the diabetic group (Figure 2). Increased ROS levels in diabetic hearts and high glucose-incubated cultured cardiomyocytes have been mostly attributed to NADPH oxidase activity [38,39].
Apocynin has gained importance as an antioxidant agent in experimental research. Evidence suggests that NADPH oxidase inhibition with apocynin attenuates isoproterenol-induced myocardial damage by enhancing antioxidant status [40]. This fact coincides with Gimenes et al. [1], where they indicated that apocynin restores serum antioxidant enzyme activities catalase and SOD in diabetic rats. Likewise, our results agreed by showing that chronic inhibition of the NADPH-oxidase by apocynin restoring catalase antioxidant enzyme activity in diabetic hearts (Figure 3), which is a crucial component of the intracellular ROS detoxification system. Properties of apocynin as ROS scavenging and antioxidant have been previously reported in diabetic complications such as endothelial dysfunction [41], nephropathy [42], retinopathy [43], and diabetic mitochondrial dysfunction in skeletal muscle [44]. In addition, there are reports associated with the amelioration of adverse cardiac effects in other pathological conditions [45,46].
On the other hand, studies of mitochondrial function and morphology in the heart support a connection between mitochondrial dysfunction and DM [47,48]. Our data consistently showed changes in mitochondrial function, evidenced by a significant reduction in ETC complexes’ activity in diabetic rats (Figure 4). The decreased respiratory complexes’ activities may increase electron leak, generating more superoxide anion radical and subsequent overproduction ROS that may cause damage to specific complex subunits and contribute to mitochondrial dysfunction [47,49]. Therefore, these results can represent the consequent mitochondrial dysfunction, mainly by decreasing Complex IV resulting in lower ATP production, increased mitochondrial ROS, and oxidative damage [50]. Mitochondrial oxidative stress was evident by increased GSSG levels and reduced GSH/GSSG ratio; concomitantly, we observed reduced activity of mitochondrial SOD in heart mitochondria from diabetic rats (Figure 5). Modifications due to oxidative damage in the diabetic heart’s mitochondrial complexes may play a key role in the gradual decline in mitochondrial function [48].
Moreover, decreased GSH and increased GSSG levels during oxidative stress can contribute to mitochondrial dysfunction by glutathionylation of target proteins [51]. However, we found that the decrease in Complexes I and IV detected in diabetic rats was significantly prevented by apocynin treatment, but only the Complex I and III activities were found to be similar to those detected in control rats. Notwithstanding, apocynin did not significantly influence the Complex II activity. In contrast, apocynin treatment in the control group led to a decrease in Complex II activity. A possible explanation for this effect can be due to a depletion of the coenzyme Q pool that could directly impair oxygen consumption rate, as has been suggested [52], or even by reacting apocynin with Complex II (succinate dehydrogenase) that contains two hydrophilic subunits, three Fe-S centers, a flavoprotein, and two hydrophobic subunits, which contain one heme b and the binding site for Q [53]. Additionally, a diminution in the cellular antioxidant systems has been reported when GSH negatively affected enzymes as succinate dehydrogenase (Complex II), while exogenous administration of glutathione prevented oxidative stress and a loss of enzymatic activities affected by oxidative modifications [54,55]. In this context, we hypothesize the diminution of succinate dehydrogenase activity could be due to the loss of redox balance caused by apocynin, as we observed in our results.
Based on other research, apocynin’s beneficial properties to improve mitochondrial function are decreasing the level of NADPH oxidase activity, mitochondrial DNA oxidative damage, and increasing the level of SOD activity, which suggests that apocynin efficiently decreases NADPH oxidase-associated oxidative stress [56]. In line with this, studies using hearts from diabetic animals showed that upregulation of NADPH oxidase by activation of CaMKII might lead to morphological changes of mitochondria [57]. Therefore, in addition to mitochondria, NADPH oxidase may be the primary ROS source in the diabetic heart [48]. In turn, the redox imbalance on glutathione status in mitochondria from diabetic rats was mitigated by apocynin, confirming its antioxidative action manifested by a significant increase in GSH/GSSG ratio. In addition, the changes observed in Figure 5 could be attributed to a direct interaction of apocynin with GSH or thiol groups and increased levels of GSSH [58].
Similarly, apocynin has turned out to produce a beneficial effect on glutathione homeostasis in various mammalian tissues, including in kidneys of the Zucker diabetic fatty (ZDF) rat [59] and spontaneously hypertensive Dahl salt-sensitive rats [60], liver of high-fat diet-induced obese mice [35]. However, the present study is the first to show apocynin’s effects on glutathione redox status in mitochondria from STZ-diabetic rats’ hearts. Hence, these results suggest other possible mechanisms by which apocynin could mediate its cardioprotective effects against DM-induced oxidative stress, at least partly through its mitochondrial action acting as a mitochondria-targeted antioxidant and modulating respiratory chain enzyme activities.
5. Conclusions
In summary, apocynin enhances glucose uptake and insulin sensitivity, thereby preserving the antioxidant defense and mitochondrial function in diabetic rat hearts. These findings provide new insights into the mechanisms of apocynin antioxidative action. This study is the first showing the effects of apocynin on glutathione redox status and components of ETC in heart mitochondria from STZ-induced diabetic rats. Apocynin has been demonstrated as an efficient and antidiabetic drug in muscle heart in an experimental animal model of DM type 1.
Author Contributions
Conceptualization, R.M.-P., E.S.-D.; methodology, E.B.-S., D.P.-M., S.S.-D.; formal analysis, R.M.-P., E.S.-D., A.S.-M.; investigation, E.B.-S., D.P.-M.; resources, A.S.-M., R.M.-P., E.S.-D.; writing—original draft preparation, E.B.-S., S.S.-D., E.S.-D., R.M.-P., D.P.-M., A.S.-M., R.M.-P.; writing—review and editing, E.B.-S., S.S.-D., E.S.-D., R.M.-P., D.P.-M., A.S.-M., R.M.-P.; supervision, R.M.-P., E.S.-D.; project administration, R.M.-P., E.S.-D.; funding acquisition, R.M.-P., E.S.-D. All authors have read and agreed to the published version of the manuscript.
Funding
This work was supported in part by grants from Coordinación de la Investigación Científica, Universidad de Guanajuato (E.S.D.-CIIC-237/2019) and PRODEP-SEP (grant number: UGTO-PTC-667). In addition, Coordinación de la Investigación Científica, Universidad Michoacana de San Nicolás de Hidalgo (R.M.P.-CIC/2020; A.S.M.-CIC/2020).
Institutional Review Board Statement
The study was conducted according to the guidelines of the Official Mexican Standard (NOM-062-ZOO), and approved by the Institutional Review Board (or Ethics Committee) of the Instituto de Investigaciones Químico-Biológicas de la Universidad Michoacana de San Nicolás de Hidalgo.
Informed Consent Statement
Not applicable.
Data Availability Statement
All data are included in the document.
Conflicts of Interest
The authors declare no conflict of interest.
References
- Gimenes, R.; Gimenes, C.; Rosa, C.M.; Xavier, N.P.; Campos, D.H.S.; Fernandes, A.A.H.; Cezar, M.D.M.; Guirado, G.N.; Pagan, L.U.; Chaer, I.D.; et al. Influence of apocynin on cardiac remodeling in rats withstreptozotocin-induced diabetes mellitus. Cardiovasc. Diabetol. 2018, 17, 15. [Google Scholar] [CrossRef] [PubMed]
- American Diabetes Association. Standards of Medical Care in Diabetes-2017. Abridged for Primary Care Providers. Clin. Diabetes 2017, 35, 5–26.
- Saeedi, A.; Petersohn, I.; Salpea, P.; Malanda, B.; Kururanga, S.; Unwin, N.; Colagiuri, S.; Guarguata, L.; Motala, A.A.; Ogurtsova, K.; et al. Global and regional diabetes prevalence estimates for 2019 and projections for 2030 and 2045: Results from the International Diabetes Federation Diabetes Atlas, 9th edition. Diabetes Res. Clin. Pract. 2019, 157, 1–10. [Google Scholar] [CrossRef] [PubMed]
- Gil-Ortega, I.; Kaski, J.C. Diabetic myocardiopathy. Med. Clin. 2006, 127, 584–594. [Google Scholar] [CrossRef] [PubMed]
- Hölscher, M.E.; Bode, C.; Bugger, H. Diabetic Cardiomyopathy: Does the Type of Diabetes Matter? Int. J. Mol. Sci. 2016, 17, 2136. [Google Scholar] [CrossRef] [PubMed]
- Aydemir-Koksoy, A.; Bilginoglu, A.; Sariahmetoglu, M.; Schulz, R.; Turan, B. Antioxidant treatment protects diabetic rats from cardiac dysfunction by preserving contractile protein targets of oxidative stress. J. Nutr. Biochem. 2010, 21, 827–833. [Google Scholar] [CrossRef]
- Liu, Q.; Wang, S.; Cai, L. Diabetic cardiomyopathy and its mechanisms: Role of oxidative stress and damage. J. Diabetes Investig. 2014, 5, 623–634. [Google Scholar] [CrossRef] [PubMed]
- Kenny, H.C.; Abel, E.D. Heart Failure in Type 2 Diabetes Mellitus. Circ. Res. 2019, 124, 121–141. [Google Scholar] [CrossRef]
- Severino, P.; D’Amato, A.; Netti, L.; Pucci, M.; Infusino, F.; Maestrini, V.; Mancone, M.; Fedele, F. Myocardial Ischemia and Diabetes Mellitus: Role of Oxidative Stress in the Connection between Cardiac Metabolism and Coronary Blood Flow. J. Diabetes Res. 2019, 201, 489826. [Google Scholar] [CrossRef]
- Severino, P.; D’Amato, A.; Pucci, M.; Infusino, F.; Adamo, F.; Birtolo, L.I.; Netti, L.; Montefusco, G.; Chimenti, C.; Lavalle, C.; et al. Ischemic Heart Disease Pathophysiology Paradigms Overview: From Plaque Activation to Microvascular Dysfunction. Int. J. Mol. Sci. 2020, 21, 8118. [Google Scholar] [CrossRef] [PubMed]
- Van den Worm, E.; Beukelman, C.J.; Van den Berg, A.J.; Kroes, B.H.; Labadie, R.P.; Van Dijk, H. Effects of methoxylation of apocynin and analogs on the inhibition of reactive oxygen species production by stimulated human neutrophils. Eur. J. Pharmacol. 2001, 433, 225–230. [Google Scholar] [CrossRef]
- Qiu, J.; Zhao, J.; Li, J.; Liang, X.; Yang, Y.; Zhang, Z.; Zhang, X.; Fu, H.; Korantzopoulos, P.; Liu, T.; et al. NADPH oxidase inhibitor apocynin prevents atrial remodeling in alloxan-induced diabetic rabbits. Int. J. Cardiol. 2016, 221, 812–819. [Google Scholar] [CrossRef]
- Yu, B.; Meng, F.; Yang, Y.; Liu, D.; Shi, K. NOX2 Antisense Attenuates Hypoxia-Induced Oxidative Stress and Apoptosis in Cardiomyocyte. Int. J. Med. Sci. 2016, 13, 646–652. [Google Scholar] [CrossRef] [PubMed][Green Version]
- Saleem, N.; Prasad, A.; Goswami, S.K. Apocynin prevents isoproterenol-induced cardiac hypertrophy in rat. Mol. Cell Biochem. 2018, 445, 79–88. [Google Scholar] [CrossRef]
- López-Acosta, O.; De Los Angeles Fortis-Barrera, M.; Barrios-Maya, M.A.; Ramírez, A.R.; Aguilar, F.J.A.; El-Hafidi, M. Reactive Oxygen Species from NADPH Oxidase and Mitochondria Participate in the Proliferation of Aortic Smooth Muscle Cells from a Model of Metabolic Syndrome. Oxid. Med. Cell Longev. 2018, 2018, 5835072. [Google Scholar] [CrossRef]
- Sharma, M.; Kaur, T.; Singla, S.K. Role of mitochondria and NADPH oxidase derived reactive oxygen species in hyperoxaluria induced nephrolithiasis: Therapeutic intervention with combinatorial therapy of N-acetyl cysteine and Apocynin. Mitochondrion 2016, 27, 15–24. [Google Scholar] [CrossRef] [PubMed]
- Hou, L.; Sun, F.; Huang, R.; Sun, W.; Zhang, D.; Wang, Q. Inhibition of NADPH oxidase by apocynin prevents learning and memory deficits in a mouse Parkinson’s disease model. Redox Biol. 2019, 22, 101134. [Google Scholar] [CrossRef] [PubMed]
- Kim, S.H.; Lim, J.W.; Kim, H. Astaxanthin Inhibits Mitochondrial Dysfunction and Interleukin-8 Expression in Helicobacter pylori Infected Gastric Epithelial Cells. Nutrients 2018, 10, 1320. [Google Scholar] [CrossRef]
- Ghosh, A.; Langley, M.R.; Harischandra, D.S.; Neal, M.L.; Jin, H.; Anantharam, V.; Joseph, J.; Brenza, T.; Narasimhan, B.; Kanthasamy, A.; et al. Mitoapocynin Treatment Protects Against Neuroinflammation and Dopaminergic Neurodegeneration in a Preclinical Animal Model of Parkinson’s Disease. J. Neuroimmune Pharmacol. 2016, 11, 259–278. [Google Scholar] [CrossRef]
- Langley, M.; Ghosh, A.; Charli, A.; Sarkar, S.; Ay, M.; Luo, J.; Zielonka, J.; Brenza, T.; Bennett, B.; Jin, H.; et al. Mito-Apocynin Prevents Mitochondrial Dysfunction, Microglial Activation, Oxidative Damage, and Progressive Neurodegeneration in MitoPark Transgenic Mice. Antioxid Redox Signal. 2017, 27, 1048–1066. [Google Scholar] [CrossRef] [PubMed]
- Monzillo, L.U.; Hamdy, O. Evaluation of insulin sensitivity in clinical practice and in research settings. Nutr. Rev. 2003, 61, 397–412. [Google Scholar] [CrossRef]
- Inchiostro, S. Measurement of insulin sensitivity in Type 2 diabetes mellitus: Comparison between KITT and HOMA-%S indices and evaluation of their relationship with the components of the insulin resistance syndrome. Diabet Med. 2005, 22, 39–44. [Google Scholar] [CrossRef] [PubMed]
- Vinué, Á.; González-Navarro, H. Glucose and Insulin Tolerance Tests in the Mouse. Methods Mol. Biol. 2015, 1339, 247–254. [Google Scholar] [CrossRef]
- Gornall, A.G.; Bardawill, C.J.; David, M.M. Determination of serum proteins by means of the biuret reaction. J. Biol. Chem. 1949, 177, 751–766. [Google Scholar] [CrossRef]
- Huerta-Cervantes, M.; Peña-Montes, D.J.; Montoya-Pérez, R.; Trujillo, X.; Huerta, M.; López-Vázquez, M.Á.; Olvera-Cortés, M.E.; Saavedra-Molina, A. Gestational Diabetes Triggers Oxidative Stress in Hippocampus and Cerebral Cortex and Cognitive Behavior Modifications in Rat Offspring: Age- and Sex-Dependent Effects. Nutrients 2020, 12, 376. [Google Scholar] [CrossRef] [PubMed]
- Ortiz-Avila, O.; Sámano-García, C.A.; Calderón-Cortés, E.; Pérez-Hernández, I.H.; Mejía-Zepeda, R.; Rodríguez-Orozco, A.R.; Saavedra-Molina, A.; Cortés-Rojo, C. Dietary avocado oil supplementation attenuates the alterations induced by type I diabetes and oxidative stress in electron transfer at the complex II-complex III segment of the electron transport chain in rat kidney mitochondria. J. Bioenerg. Biomembr. 2013, 45, 271–287. [Google Scholar] [CrossRef] [PubMed]
- Saavedra-Molina, A.; Devlin, T.M. Effect of extra- and intra-mitochondrial calcium on citrulline synthesis. Amino Acids 1997, 12, 293–298. [Google Scholar] [CrossRef]
- Peña-Montes, D.J.; Huerta-Cervantes, M.; Ríos-Silva, M.; Trujillo, X.; Cortés-Rojo, C.; Huerta, M.; Saavedra-Molina, A. Effects of dietary iron restriction on kidney mitochondria function and oxidative stress in streptozotocin-diabetic rats. Mitochondrion 2020, 54, 41–48. [Google Scholar] [CrossRef] [PubMed]
- Spinazzi, M.; Casarin, A.; Pertegato, V.; Salviati, L.; Angelini, C. Assessment of mitochondrial respiratory chain enzymatic activities on tissues and cultured cells. Nat. Protoc. 2012, 7, 1235–1246. [Google Scholar] [CrossRef]
- Cortés-Rojo, C.; Calderón-Cortés, E.; Clemente-Guerrero, M.; Manzo-Avalos, S.; Uribe, S.; Boldogh, I.; Saavedra-Molina, A. Electron transport chain of Saccharomyces cerevisiae mitochondria is inhibited by H2O2 at succinate-cytochrome c oxidoreductase level without lipid peroxidation involvement. Free Radic. Res. 2007, 41, 1212–1223. [Google Scholar] [CrossRef][Green Version]
- De Zentella Piña, M.; Villalobos-Molina, R.; Saavedra-Molina, A.; Riveros-Rosas, H.; Piña, E. Effects of moderate chronic ethanol consumption on rat liver mitochondrial functions. Alcohol 1989, 6, 3–7. [Google Scholar] [CrossRef]
- Lawrence, R.A.; Burk, R.F. Glutathione peroxidase activity in selenium-deficient rat liver. Biochem. Biophys. Res. Commun. 1976, 71, 952–958. [Google Scholar] [CrossRef]
- Winiarska, K.; Grabowski, M.; Rogacki, M.K. Inhibition of renal gluconeogenesis contributes to hypoglycaemic action of NADPH oxidase inhibitor, apocynin. Chem. Biol. Interact. 2011, 189, 119–126. [Google Scholar] [CrossRef]
- Meng, R.; Zhu, D.L.; Bi, Y.; Yang, D.H.; Wang, Y.P. Apocynin improves insulin resistance through suppressing inflammation in high-fat diet-induced obese mice. Mediat. Inflamm. 2010, 2010, 858735. [Google Scholar] [CrossRef]
- Meng, R.; Zhu, D.L.; Bi, Y.; Yang, D.H.; Wang, Y.P. Anti-oxidative effect of apocynin on insulin resistance in high-fat diet mice. Ann. Clin. Lab. Sci. 2011, 41, 236–243. [Google Scholar] [PubMed]
- Varma, U.; Koutsifeli, P.; Benson, V.L.; Mellor, K.M.; Delbridge, L.M.D. Molecular mechanisms of cardiac pathology in diabetes—Experimental insights. Biochim. Biophys. Acta Mol. Basis. Dis. 2018, 1864, 1949–1959. [Google Scholar] [CrossRef] [PubMed]
- Jia, G.; Hill, M.A.; Sowers, J.R. Diabetic Cardiomyopathy: An Update of Mechanisms Contributing to This Clinical Entity. Circ. Res. 2018, 122, 624–638. [Google Scholar] [CrossRef] [PubMed]
- Teshima, Y.; Takahashi, N.; Nishio, S.; Saito, S.; Kondo, H.; Fukui, A.; Aoki, K.; Yufu, K.; Nakagawa, M.; Saikawa, T. Production of reactive oxygen species in the diabetic heart. Roles of mitochondria and NADPH oxidase. Circ. J. 2014, 78, 300–306. [Google Scholar] [CrossRef]
- Privratsky, J.R.; Wold, L.E.; Sowers, J.R.; Quinn, M.T.; Ren, J. AT1 blockade prevents glucose-induced cardiac dysfunction in ventricular myocytes: Role of the AT1 receptor and NADPH oxidase. Hypertension 2003, 42, 206–212. [Google Scholar] [CrossRef]
- Tanriverdi, L.H.; Parlakpinar, H.; Ozhan, O.; Ermis, N.; Polat, A.; Vardi, N.; Tanbek, K.; Yildiz, A.; Acet, A. Inhibition of NADPH oxidase by apocynin promotes myocardial antioxidant response and prevents isoproterenol-induced myocardial oxidative stress in rats. Free Radic. Res. 2017, 51, 772–786. [Google Scholar] [CrossRef]
- Olukman, M.; Orhan, C.E.; Celenk, F.G.; Ulker, S. Apocynin restores endothelial dysfunction in streptozotocin diabetic rats through regulation of nitric oxide synthase and NADPH oxidase expressions. J. Diabetes Complicat. 2010, 24, 415–423. [Google Scholar] [CrossRef]
- Nam, S.M.; Lee, M.Y.; Koh, J.H.; Park, J.H.; Shin, J.Y.; Shin, Y.G.; Koh, S.B.; Lee, E.Y.; Chung, C.H. Effects of NADPH oxidase inhibitor on diabetic nephropathy in OLETF rats: The role of reducing oxidative stress in its protective property. Diabetes Res. Clin. Pract. 2009, 83, 176–182. [Google Scholar] [CrossRef] [PubMed]
- Al-Shabrawey, M.; Rojas, M.; Sanders, T.; Behzadian, A.; El-Remessy, A.; Bartoli, M.; Parpia, A.K.; Liou, G.; Caldwell, R.B. Role of NADPH oxidase in retinal vascular inflammation. Invest. Ophthalmol. Vis. Sci. 2008, 49, 3239–3244. [Google Scholar] [CrossRef]
- Yokota, T.; Kinugawa, S.; Hirabayashi, K.; Matsushima, S.; Inoue, N.; Ohta, Y.; Hamaguchi, S.; Sobirin, M.A.; Ono, T.; Suga, T.; et al. Oxidative stress in skeletal muscle impairs mitochondrial respiration and limits exercise capacity in type 2 diabetic mice. Am. J. Physiol. Heart Circ. Physiol. 2009, 297, H1069–H1077. [Google Scholar] [CrossRef]
- Wen, Y.; Liu, R.; Lin, N.; Luo, H.; Tang, J.; Huang, Q.; Sun, H.; Tang, L. NADPH Oxidase Hyperactivity Contributes to Cardiac Dysfunction and Apoptosis in Rats with Severe Experimental Pancreatitis through ROS-Mediated MAPK Signaling Pathway. Oxid. Med. Cell Longev. 2019, 2019, 4578175. [Google Scholar] [CrossRef]
- Wang, K.; Zhu, Z.F.; Chi, R.F.; Li, Q.; Yang, Z.J.; Jie, X.; Hu, X.L.; Han, X.B.; Wang, J.P.; Li, B.; et al. The NADPH oxidase inhibitor apocynin improves cardiac sympathetic nerve terminal innervation and function in heart failure. Exp. Physiol. 2019, 104, 1638–1649. [Google Scholar] [CrossRef]
- Ferreira, R.; Guerra, G.; Padrão, A.I.; Melo, T.; Vitorino, R.; Duarte, J.A.; Remião, F.; Domingues, P.; Amado, F.; Domingues, M.R. Lipidomic characterization of streptozotocin-induced heart mitochondrial dysfunction. Mitochondrion 2013, 13, 762–771. [Google Scholar] [CrossRef] [PubMed]
- Kaludercic, N.; Di Lisa, F. Mitochondrial ROS Formation in the Pathogenesis of Diabetic Cardiomyopathy. Front. Cardiovasc. Med. 2020, 7, 12. [Google Scholar] [CrossRef]
- Koju, N.; Taleb, A.; Zhou, J.; Lv, G.; Yang, J.; Cao, X.; Lei, H.; Ding, Q. Pharmacological strategies to lower crosstalk between nicotinamide adenine dinucleotide phosphate (NADPH) oxidase and mitochondria. Biomed. Pharmacother. 2019, 111, 1478–1498. [Google Scholar] [CrossRef] [PubMed]
- Choi, E.M.; Lee, Y.S. Protective effect of apocynin on antimycin A-induced cell damage in osteoblastic MC3T3-E1 cells. J. Appl. Toxicol. 2012, 32, 714–721. [Google Scholar] [CrossRef]
- Marí, M.; De Gregorio, E.; De Dios, C.; Roca-Agujetas, V.; Cucarull, B.; Tutusaus, A.; Morales, A.; Colell, A. Mitochondrial Glutathione: Recent Insights and Role in Disease. Antioxidants 2020, 9, 909. [Google Scholar] [CrossRef] [PubMed]
- Wang, W.; Liparulo, I.; Rizzardi, N.; Bolignano, P.; Calonghi, N.; Bergamini, C.; Fato, R. Coenzyme Q Depletion Reshapes MCF-7 Cells Metabolism. Int. J. Mol. Sci. 2020, 22, 198. [Google Scholar] [CrossRef] [PubMed]
- Sun, F.; Huo, X.; Zhai, Y.; Wang, A.; Xu, J.; Su, D.; Bartlam, M.; Rao, Z. Crystal structure of mitochondrial respiratory membrane protein complex II. Cell 2005, 121, 1043–1057. [Google Scholar] [CrossRef]
- Lashin, O.M.; Szweda, P.A.; Szweda, L.I.; Romani, A.M. Decreased complex II respiration and HNE-modified SDH subunit in diabetic heart. Free Radic. Biol. Med. 2006, 40, 886–896. [Google Scholar] [CrossRef] [PubMed]
- Golbidi, S.; Botta, A.; Gottfred, S.; Nusrat, A.; Laher, I.; Ghosh, S. Glutathione administration reduces mitochondrial damage and shifts cell death from necrosis to apoptosis in ageing diabetic mice hearts during exercise. Br. J. Pharmacol. 2014, 171, 5345–5360. [Google Scholar] [CrossRef]
- Du, Z.D.; Yu, S.; Qi, Y.; Qu, T.F.; He, L.; Wei, W.; Liu, K.; Gong, S.S. NADPH oxidase inhibitor apocynin decreases mitochondrial dysfunction and apoptosis in the ventral cochlear nucleus of D-galactose-induced aging model in rats. Neurochem. Int. 2019, 124, 31–40. [Google Scholar] [CrossRef] [PubMed]
- Nishio, S.; Teshima, Y.; Takahashi, N.; Thuc, L.C.; Saito, S.; Fukui, A.; Kume, O.; Fukunaga, N.; Hara, M.; Nakagawa, M.; et al. Activation of CaMKII as a key regulator of reactive oxygen species production in diabetic rat heart. J. Mol. Cell Cardiol. 2012, 52, 1103–1111. [Google Scholar] [CrossRef]
- Kučera, J.; Binó, L.; Štefková, K.; Jaroš, J.; Vašíček, O.; Večeřa, J.; Kubala, L.; Pacherník, J. Apocynin and Diphenyleneiodonium Induce Oxidative Stress and Modulate PI3K/Akt and MAPK/Erk Activity in Mouse Embryonic Stem Cells. Oxid. Med. Cell Longev. 2016, 2016, 7409196. [Google Scholar] [CrossRef]
- Winiarska, K.; Focht, D.; Sierakowski, B.; Lewandowski, K.; Orlowska, M.; Usarek, M. NADPH oxidase inhibitor, apocynin, 520 improves renal glutathione status in Zucker diabetic fatty rats: A comparison with melatonin. Chem. Biol. Interact. 2014, 218, 12–19. [Google Scholar] [CrossRef]
- Tian, N.; Moore, R.S.; Phillips, W.E.; Lin, L.; Braddy, S.; Pryor, J.S.; Stockstill, R.L.; Hughson, M.D.; Manning, R.D., Jr. NADPH oxidase contributes to renal damage and dysfunction in Dahl salt-sensitive hypertension. Am. J. Physiol. Regul. Integr. Comp. Physiol. 2008, 295, R1858–R1865. [Google Scholar] [CrossRef] [PubMed]
Publisher’s Note: MDPI stays neutral with regard to jurisdictional claims in published maps and institutional affiliations. |
© 2021 by the authors. Licensee MDPI, Basel, Switzerland. This article is an open access article distributed under the terms and conditions of the Creative Commons Attribution (CC BY) license (http://creativecommons.org/licenses/by/4.0/).

