Abstract
Vitamin C is a water-soluble antioxidant. Reducing the level of oxidative stress can alleviate depression. Therefore, we investigated the correlation between dietary vitamin C intake and the risk of depressive symptoms in the general population. Data from the 2007–2018 National Health and Nutrition Examination Survey were used in our study. The dietary intake of vitamin C was assessed by two 24-h dietary recalls. Depressive symptoms were assessed with the Patient Health Questionnaire-9. Logistic regression and restricted cubic spline models were applied to assess the relationship between dietary vitamin C intake and the risk of depressive symptoms. The multivariate adjusted odds ratio (95% confidence interval) of depressive symptoms for the highest vs. lowest category of dietary vitamin C intake and vitamin C intake derived from vegetables were 0.73 (0.58–0.91) and 0.73 (0.56–0.95). In subgroup analyses, dietary vitamin C intake was negatively correlated with the risk of depressive symptoms in females 18–39 years old and 40–59 year-old groups. A dose-response analysis showed that there was a nonlinear relationship between dietary vitamin C intake and the risk of depressive symptoms. Dietary vitamin C intake and vitamin C intake derived from vegetables were inversely associated with the risk of depressive symptoms among the general population. We recommend increasing the intake of vegetables in daily diet.
1. Introduction
Depression might be related to a variety of factors, such as heredity [1], environment [2], and diet. According to previous research, there might be a negative correlation between depressive symptoms and the intake of nutrients, such as protein [3], carotenoids [4], fiber [5], natural folic acid [6], magnesium [7], and total zinc, iron, copper, and selenium intake [8]. Previous studies have shown that oxidative stress level in patients with depression is increased [9]. Vitamin C is a water-soluble antioxidant [10]. Vitamin C is also a cofactor of several important hydroxylation reactions in the human body, such as the synthesis of catecholamine [11,12]. The increase or decrease in catecholamine and other substances may be related to depression [13]. Some studies investigated the relationship between vitamin C and depression.
A previous study among male students aged 18–35 in New Zealand [14] showed that vitamin C levels were negatively correlated with depression. Another study [15] found that the intake of vitamin C in Japanese elderly people’s diet was negatively correlated with the risk of depression symptoms. It was also found that vitamin C supplementation was significantly related to a decreased depression score in depressed shift workers in an oil refinery [16]. However, a study on the elderly Merseyside residents over 60 years of age living in residential homes [17] did not find the association between vitamin C supplementation and the improvement of depressive symptoms.
Ascorbic acid mainly depends on the dietary intake of vegetables and fruits. Rare studies focused on the connection between vitamin C intake and the risk of depressive symptoms in the general population. At the same time, their dose-response relationship was also unclear. Therefore, we investigated the relationships between vitamin C (from dietary or different sources) and the risk of depressive symptoms in the general population.
2. Materials and Methods
2.1. Study Population
A National Health and Nutrition Examination Survey (NHANES) was approved by the National Health Organization Institutional Review Board, which is a nationally representative study, and all participants signed the informed consent [18].
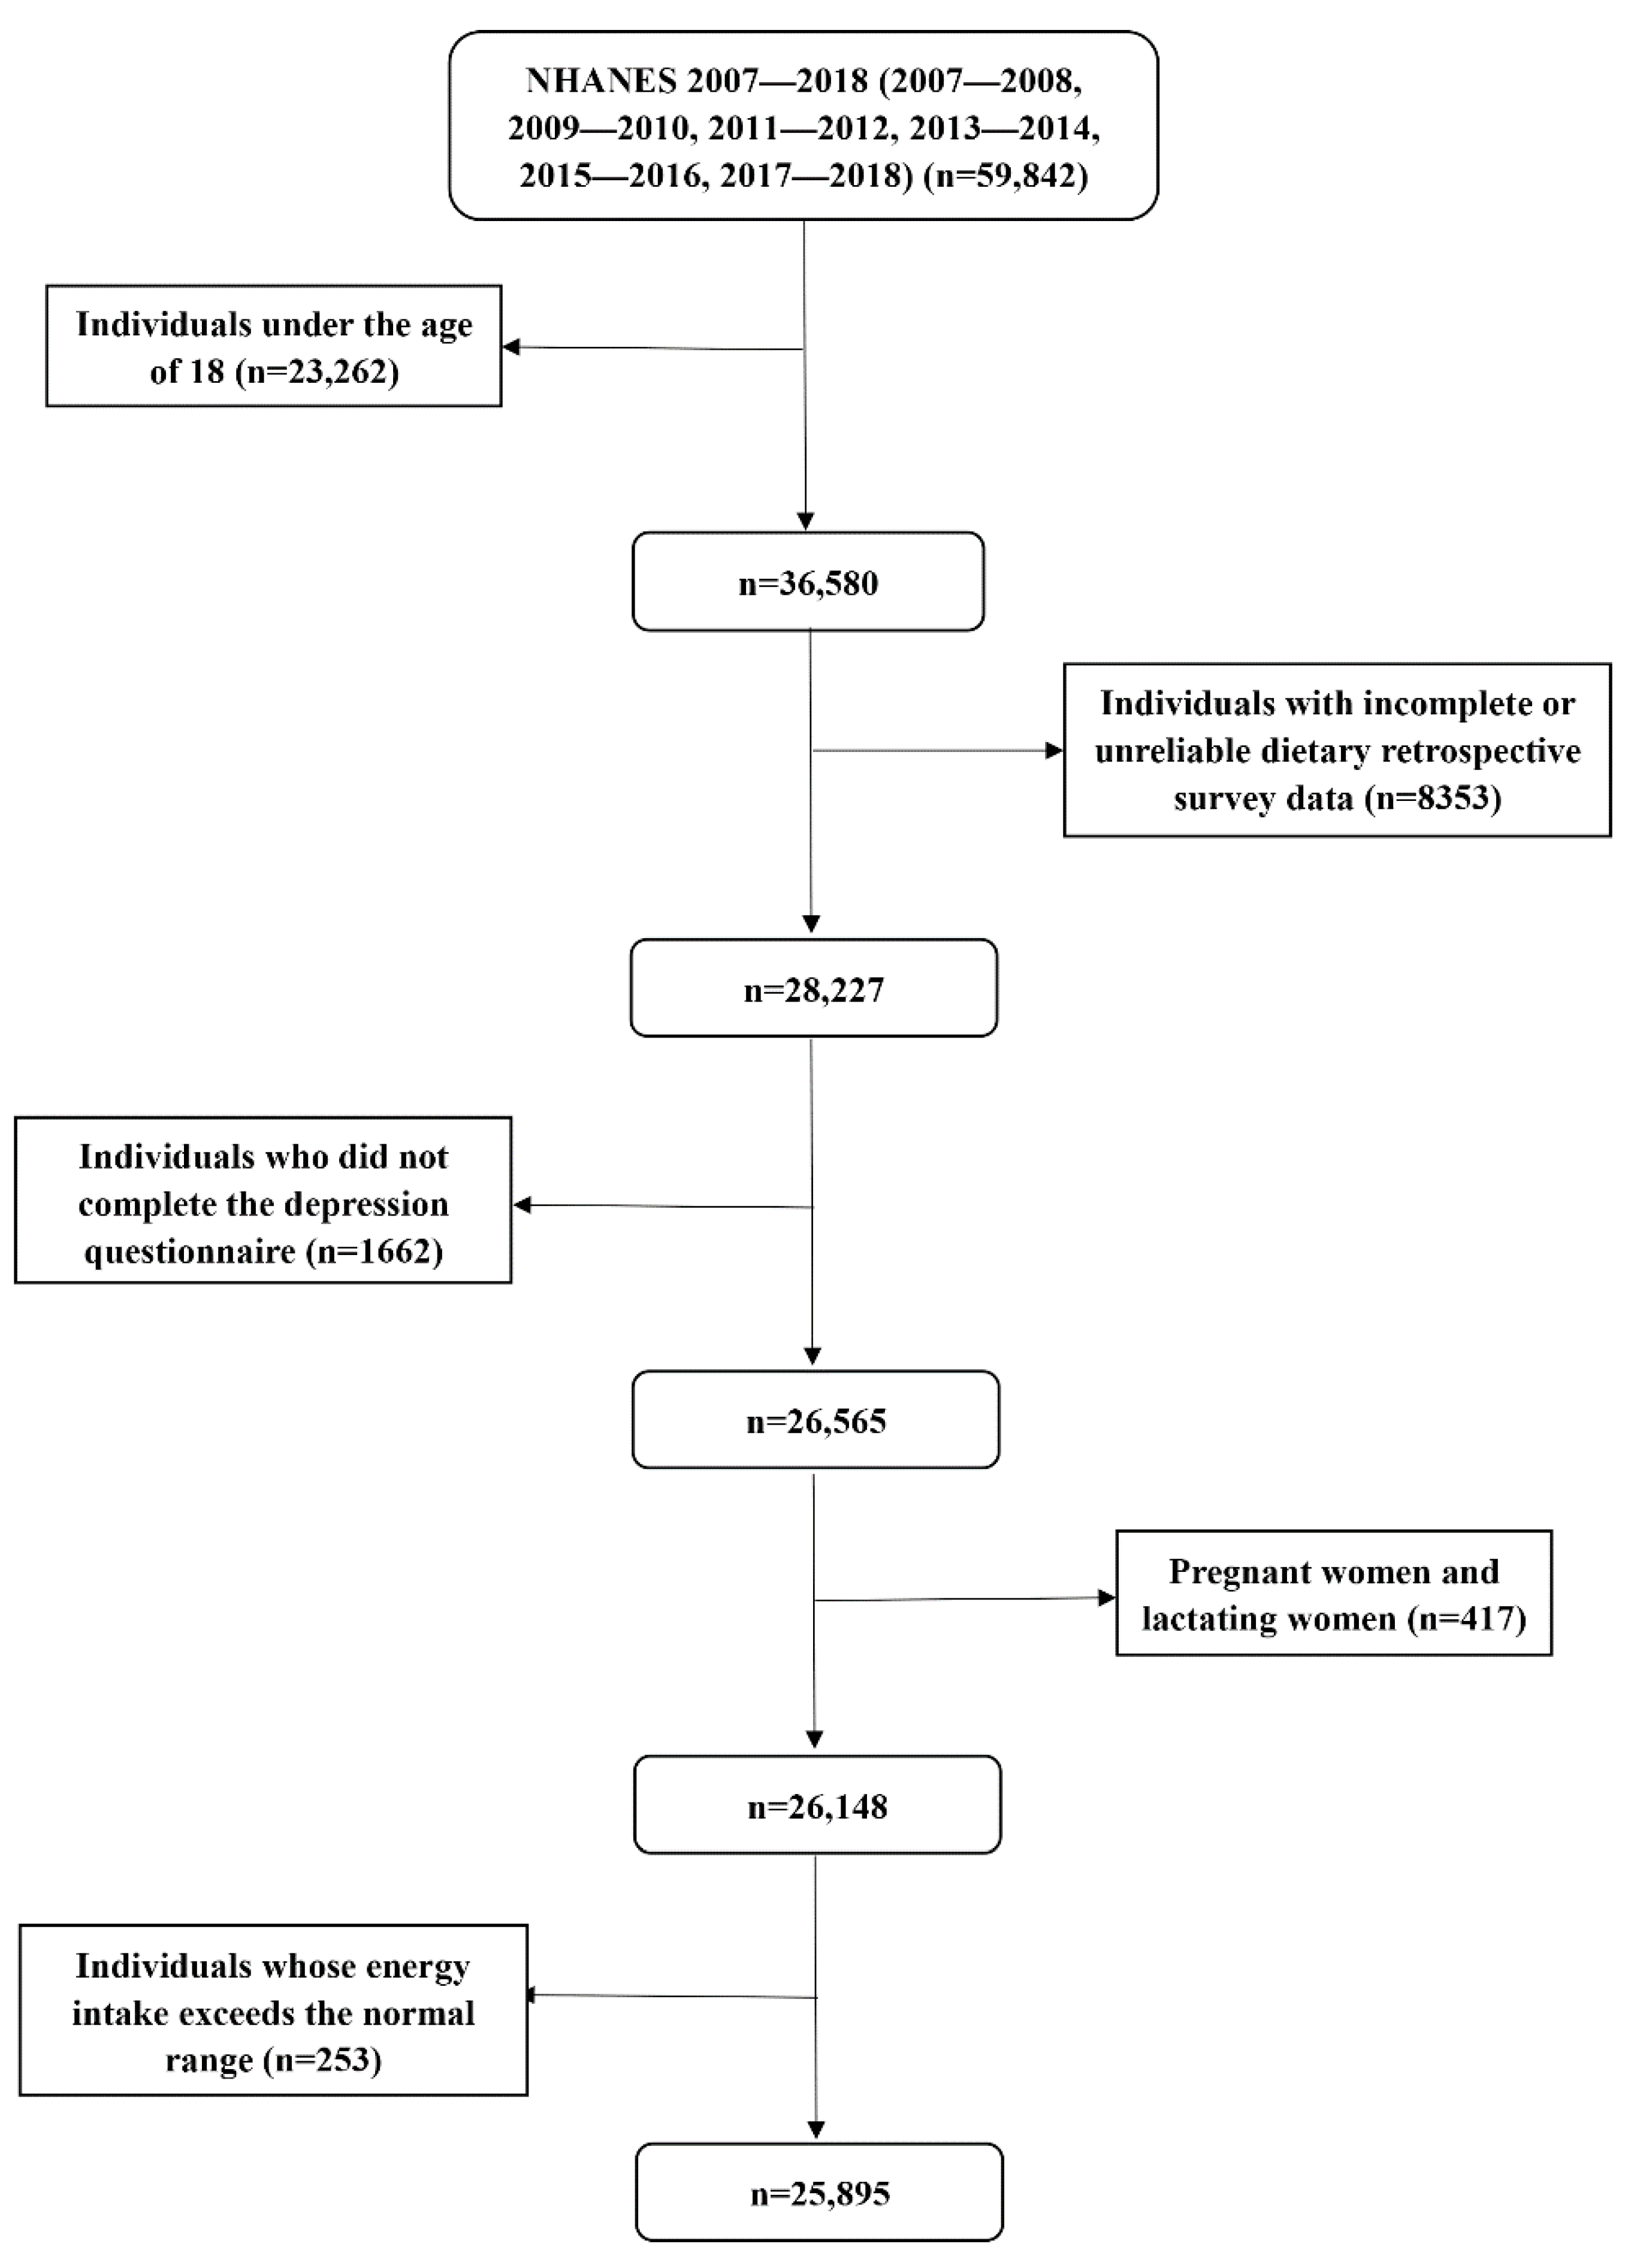
This study analyzed the data of six investigation cycles, including 59,842 respondents. Individuals younger than 18 years old with incomplete or unreliable dietary retrospective survey data and incomplete depression questionnaire data were excluded. We further excluded pregnant females, lactating females, and individuals with extreme total energy intake (more than mean ± 3 standard deviations) [19]; participants under the age of 18 did not have complete data on depressive symptoms, and pregnant or lactating females might have special dietary intake and metabolism [20]. Finally, a total of 25,895 individuals were included in this study. The specific process was shown in Figure 1.

Figure 1.
Flow chart of the screening process for the selection of eligible participants from NHANES 2007–2018.
Among 25,895 individuals, 18,341 had completed data on vitamin C from vegetable sources, 10,700 had completed vitamin C data from fruit sources, and 8132 were users of vitamin C supplements.
2.2. Assessment of Depressive Symptoms
The outcome of the interest variable was depressive symptoms. The Patient Health Questionnaire (PHQ-9) is a nine-item scale with each item ranging from 0 to 3 [21]. We used it to evaluate the group of depressive symptoms. A total score ranged from 0 to 27, and 10 was the cut-off value [22]. According to the cut-off value, participants were divided into the depressive symptoms group and the non-depressive symptoms group.
2.3. Evaluation of Dietary Vitamin C Intake and Vitamin C Supplements
The daily vitamin C intake and vitamin C supplements of each individual was the average of two 24-h dietary retrospective interviews [23]. Vegetable and fruit sources of vitamin C were identified according to US Department of Agriculture (USDA) food codes from the Individual Foods data in NHANES [24]. Dietary vitamin C intake, different sources of vitamin C, and total vitamin C intake (food + supplements) were divided into 3 groups (T1, T2, and T3) according to the terciles. T1, T2, and T3 represented low, medium, and high vitamin C intake levels, respectively.
2.4. Covariates
According to previous literature on dietary intake and depression [25,26,27], we included a series of covariates. Demographic characteristic variables included sex, age, educational levels, marital status, poverty-income ratio (PIR), and race. Body mass index (BMI) was divided into three categories [28]. We also included some health behavior variables, such as alcohol consumption status and so on. Health factors included hypertension, diabetes, and stroke. In addition, we also adjusted the total energy intake [26]. Supplementary Table S1 describes the detailed condition of the covariates.
2.5. Statistical Analysis
In this study, we used Stata 15.0 (Stata Corp., College Station, TX, USA) for the main statistical analyses. According to the NHANES guidelines, we recalculated the new sample weights when merging two or more cycles of data [29].
We compared the characteristics with or without the depressive symptoms group and high or low vitamin C intake from vegetables. Characteristics of the study population were presented as numbers (percentages) for categorical variables. For continuous variables, we used the Kolmogorov–Smirnov normality test. If distribution conformed to the normal distribution, we used mean ± standard deviation (SD) to express it; otherwise, we used the median (interquartile range). If the distribution conformed to the normal, Student’s t-tests would be applied; otherwise, we chose the Mann-Whitney U test for comparison. We used the χ2 test for the classified variables.
The lowest vitamin C intake group (T1) was taken as a reference group. The connection between dietary vitamin C intake, vitamin C derived from vegetables and fruits, total vitamin C intake (food + supplements), and depressive symptoms risk were analyzed by the logistic regression model, and the results were reported as an odds ratio (OR). In addition, we divided the participants into two categories according to whether they were vitamin C supplement users or not.
Model 1 adjusted for age and sex. Model 2 additionally adjusted for education level, marital status, PIR, race, smoking, drinking, occupational and recreational physical activity level, BMI, hypertension, stroke, diabetes, and dietary energy intake. In addition, due to the relatively long time span, we added the time dummy variable into the regression model, and also increased the interaction of time dummy variables and vitamin C intake.
We performed sensitivity analysis by excluding participants\taking antidepressant medication (Bupropion, Fluoxetine, Sertraline, Paroxetine, Venlafaxine, Citalopram, Escitalopram, and Duloxetine). Considering different sex and age teams had different depression prevalence, we performed stratification analyses by sex and age. The dose-response relationship between dietary vitamin C intake and the risk of depressive symptoms was evaluated by a restricted cubic spline model, in which three nodes were located in the 5th, 50th, and 95th percentiles of dietary vitamin C intake. The result was statistically significant when the two-sided p value was less than 0.05.
3. Results
3.1. Characteristics of the Participants
As for the intake data, a total of 25,895 individuals who met the inclusion criteria were included in this investigation. The average age was 49.00 ± 18.45 years. Among them, 2334 participants were in the depressive symptoms group, accounting for 9.01% of the total number. Table 1 shows the comparison results of the characteristics between the depressive symptoms group (PHQ-9 ≥ 10) and the non-depressive symptoms group (PHQ-9 < 10).

Table 1.
Baseline characteristics of participants by depressive symptoms, NHANES 2007–2018 (N = 25,895).
Between with and without depressive symptoms groups, the latter was more likely to have a lower education level, higher BMI, lower PIR, lower occupational physical activity, lower recreational physical activity, lower vitamin C intake, lower vitamin C vegetable source intake, and lower total energy intake. In addition, for women, smokers, and stroke, hypertension, and diabetes patients, the proportion of the depressive symptoms group was significantly higher than that of the non-depressive symptoms group.
Supplementary Table S2 shows the comparison results of the characteristic between the high (>50 mg/day) and low (≤50 mg/day) vitamin C intake from vegetables. Between the groups of high and low vitamin C intake from vegetables, the latter was more likely to have a lower education level, lower PIR, lower recreational physical activity, and lower total energy intake. In addition, for women and smokers, the proportion in the low vitamin C intake from the vegetable group was significantly higher than that in the high vitamin C intake from the vegetable group.
3.2. Relationship between Dietary Vitamin C Intake and the Risk of Depressive Symptoms
The results are shown in Table 2. After weighted calculation, the univariate logistic regression model shows that higher dietary vitamin C intake was associated with a lower risk of depressive symptoms (p < 0.001). Compared with T1, the ORs (95% confidence interval) of dietary vitamin C intake T2 and T3 were 0.58 (0.50–0.68) and 0.55 (0.48–0.63).
Table 2.
Weighted ORs and 95% CIs for depressive symptoms according to terciles of dietary vitamin C intake.
In model 1, higher dietary vitamin C intake was related to a lower risk of depressive symptoms, and the correlation was statistically significant (p < 0.001). Compared with T1, the ORs (95% confidence interval) of dietary vitamin C intake T2 and T3 were 0.58 (0.50–0.68) and 0.56 (0.49–0.65), respectively. In model 2, the negative correlation between dietary vitamin C intake and depressive symptoms remained stable. Compared with T1, T2 and T3 of dietary vitamin C intake were negatively correlated with depressive symptoms, with ORs (95% confidence interval) of 0.69 (0.58–0.83) and 0.73 (0.58–0.91), respectively. The joint test of the effect for the multiple categorical variables was used, and dietary vitamin C intake was negatively correlated with depressive symptoms, with an OR value of 0.998, p = 0.018. In a sensitivity analysis, after excluding 2415 participants who took antidepressant medication, the association of dietary vitamin C intake with depressive symptoms was still significant in T2. Compared with T1, dietary vitamin C intake was negatively correlated with depressive symptoms, with an OR (95% confidence interval) of 0.72 (0.58–0.90).
Table 3 shows the correlation between vitamin C intake and depressive symptoms after sex stratification. In a multiple-adjusted model, the T2 and T3 groups of female dietary vitamin C intake were negatively correlated with depressive symptoms, and the ORs (95% confidence interval) were 0.613 (0.48–0.78) and 0.648 (0.48–0.87), respectively.
Table 3.
Association between dietary vitamin C intake and depressive symptoms after sex stratification.
Table 4 shows the results of an age stratification analysis of the relationship between vitamin C intake and depressive symptoms risk. T2 in the age group 18–39 years old was inversely correlated with the risk of depressive symptoms, with an OR (95% confidence interval) of 0.708 (0.51–0.98). T2 and T3 were inversely correlated with the risk of depressive symptoms in the age group 40–59 years old, with ORs (95% confidence interval) of 0.630 (0.48–0.83) and 0.636 (0.44–0.91).
Table 4.
Association between dietary vitamin C intake and depressive symptoms after age stratification.
In dose-response relationships, the adjustment of covariates was consistent with model 2. The dietary vitamin C intake was nonlinearly negatively associated with depressive symptoms (P-nonlinearity = 0.009). We found an L-shaped association. The prevalence of depressive symptoms reached a plateau when the dietary vitamin C intake was higher than 126 mg/day. Figure 2 shows the dose response relationship.

Figure 2.
The results of dose response between dietary vitamin C intake and depressive symptoms.
3.3. Relationships between Dietary Vitamin C Intake Derived from Different Sources (Vegetables, Fruits), Vitamin C Supplements, Total Vitamin C Intake (Food + Supplements), and the Risk of Depressive Symptoms
The association of dietary vitamin C intake derived from vegetables and fruits with depressive symptoms risk is shown in Table 5. In a multiple-adjusted model, compared with T1, the OR (95% confidence interval) of dietary vitamin C intake derived from vegetables T3 was 0.73 (0.56–0.95). The joint test of the effect for the multiple categorical variables was used, and the dietary vitamin C intake derived from vegetables was negatively correlated with depression, with an OR value of 0.996, p = 0.026.
Table 5.
Association between vitamin C intake derived from vegetables and fruits with depressive symptoms.
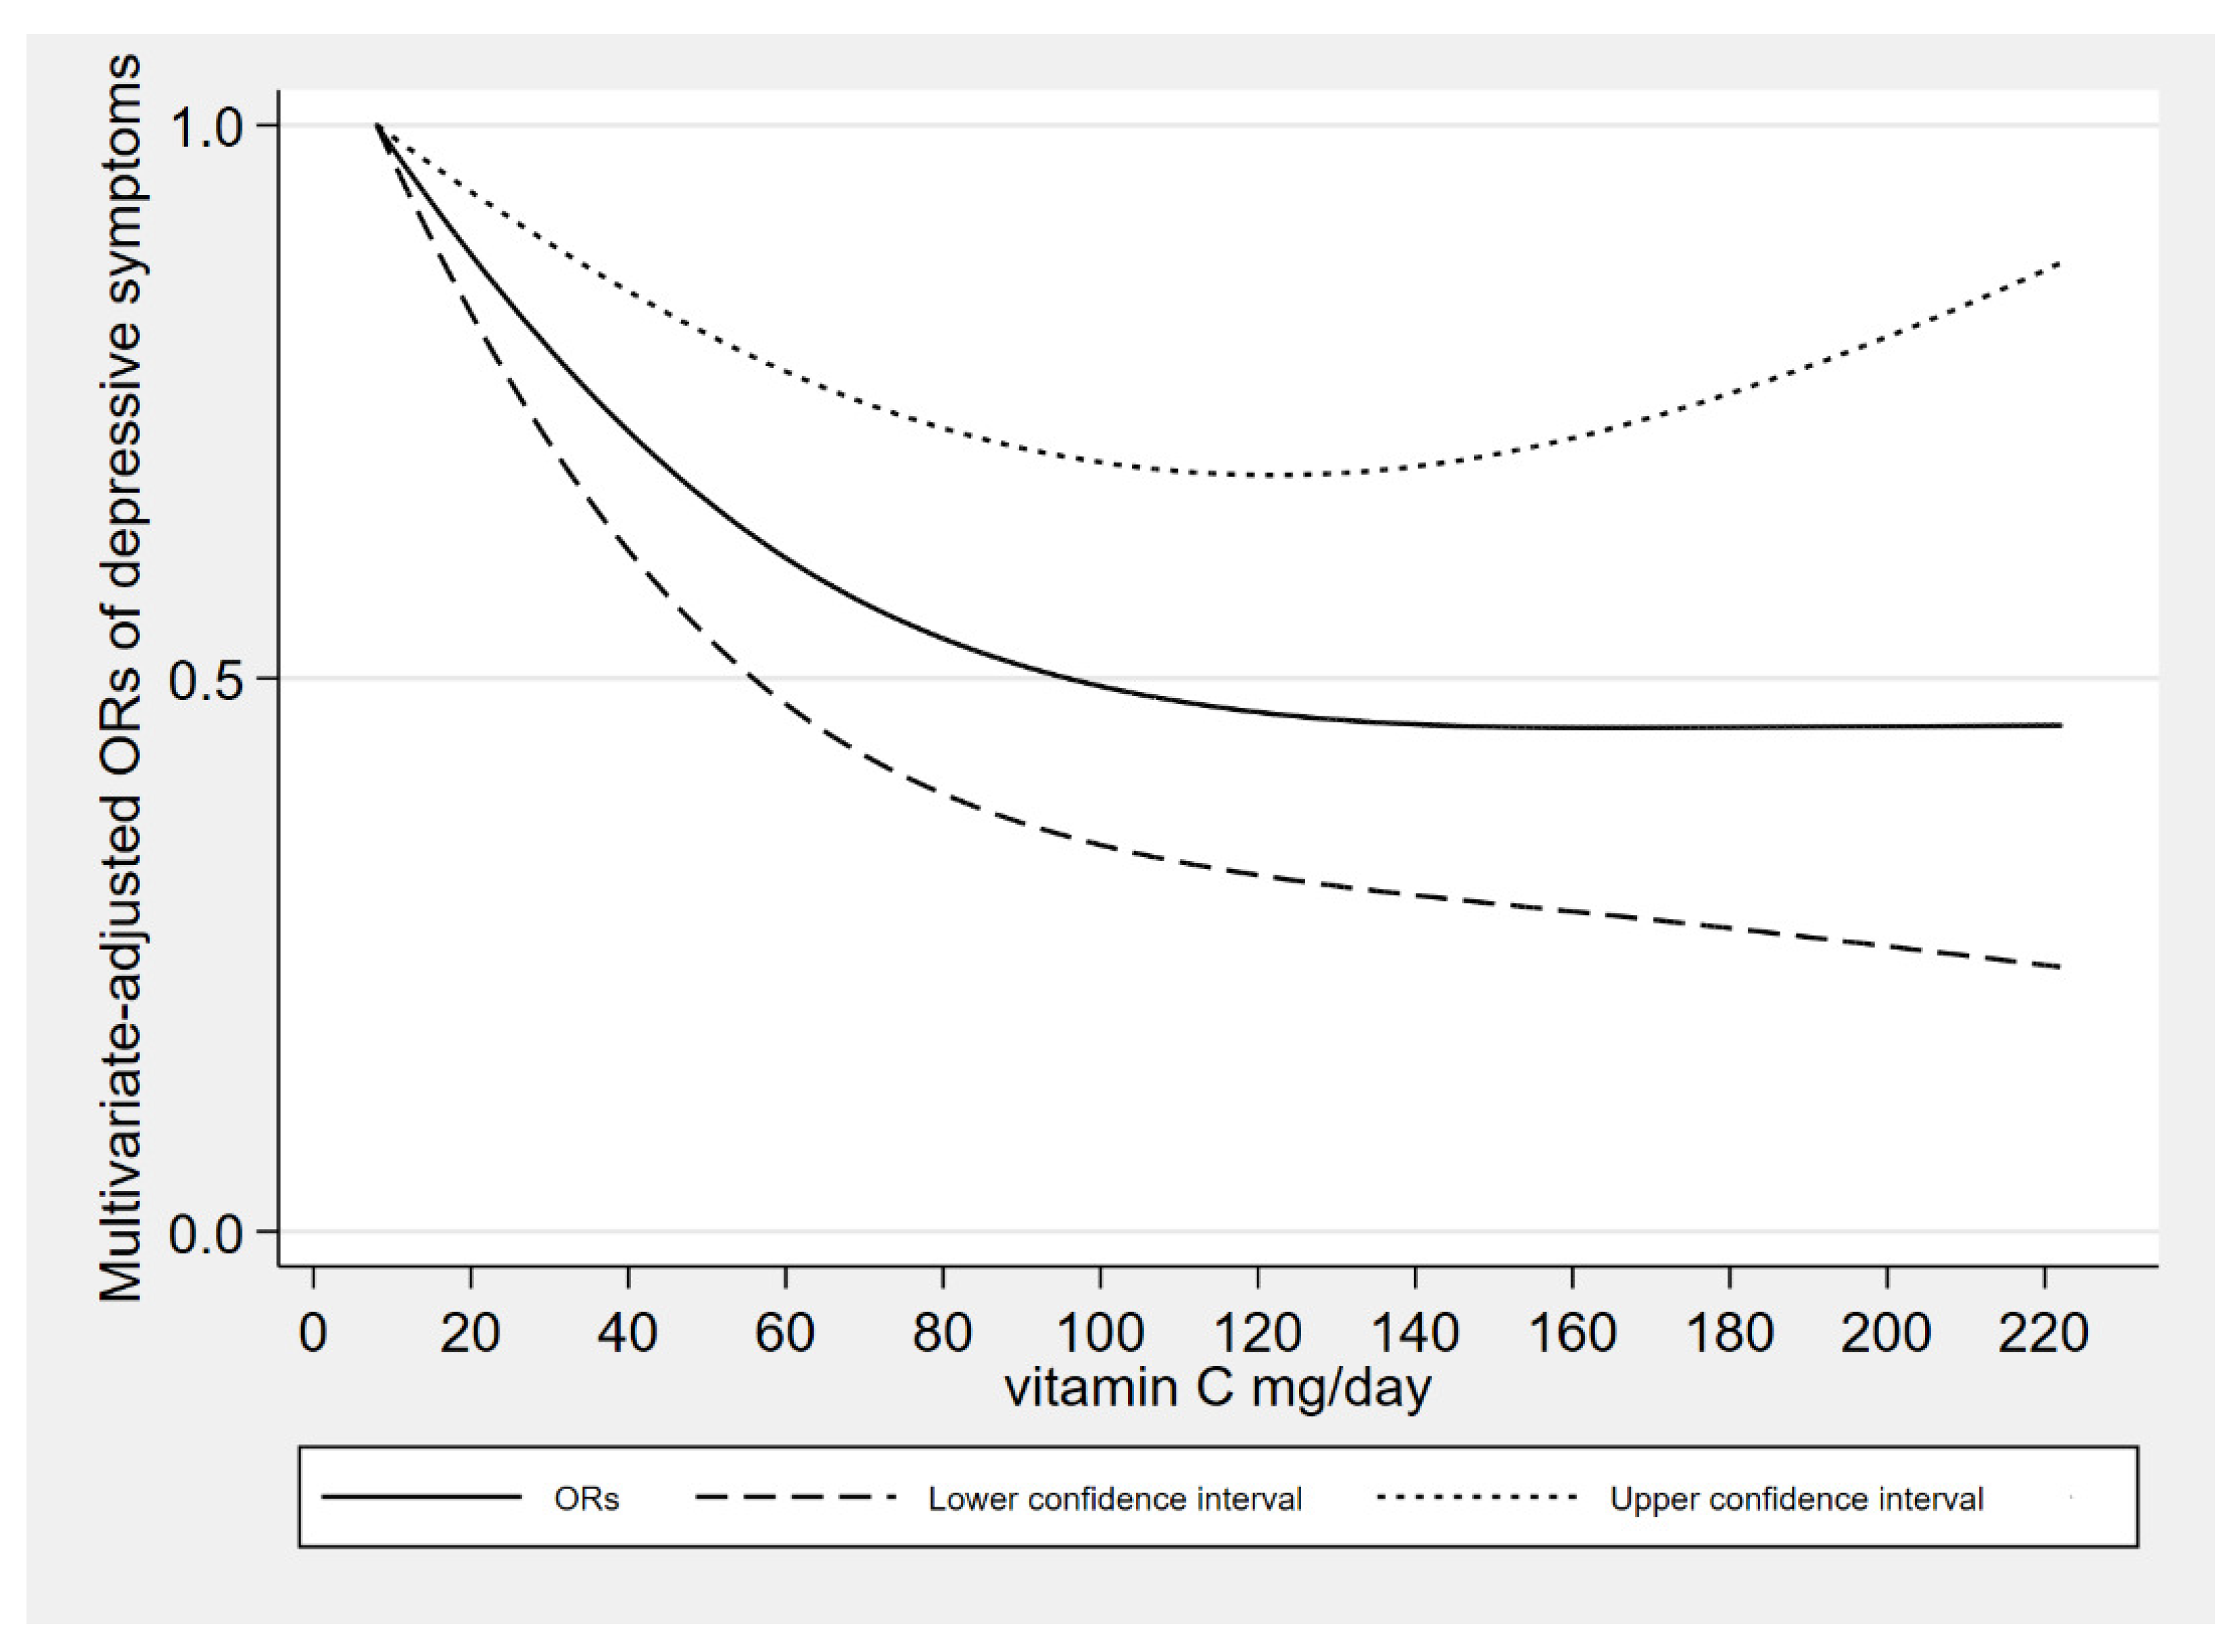
There was a linear association between the dietary vitamin C intake derived from vegetables and depressive symptoms (P-nonlinearity = 0.105). When dietary vitamin C derived from vegetables was about 50 mg/day, the risk of depressive symptoms reached a relatively low level. When dietary vitamin C derived from vegetables was more than 70 mg/day, the relationships were no longer significant. The dose response between vitamin C derived from vegetables and depressive symptoms risk is shown in Figure 3.
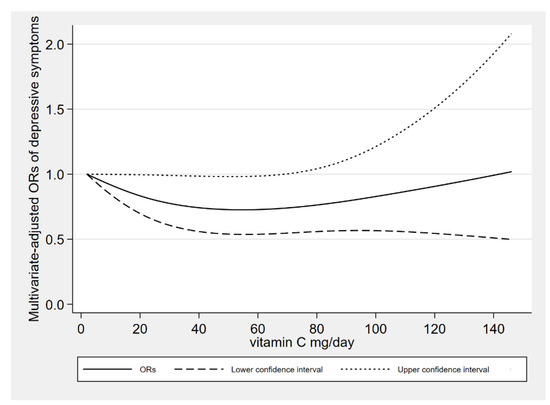
Figure 3.
The results of dose response between dietary vitamin C intake derived from vegetables and depressive symptoms.
Among 25,895 individuals, 8132 were vitamin C supplement users, accounting for 31.40% of the total participants. In the multiple adjustment model, compared with non-supplement users, vitamin C supplement users were inversely correlated with depressive symptoms risk, with an OR (95% confidence interval) of 0.78 (0.66–0.93). The association of vitamin C supplement users and non-supplement users with depressive symptoms risk is shown in Table 6.
Table 6.
Association between vitamin C supplement users and non-supplement users with depressive symptoms.
In the multiple adjustment model, compared with T1, T2 and T3 of vitamin C intake (food + supplements) were negatively correlated with depressive symptoms, with ORs (95% confidence interval) of 0.78 (0.65–0.94) and 0.72 (0.55–0.93), respectively. The association of total vitamin C intake (food + supplements) with depressive symptoms risk is shown in Table 7.
Table 7.
Association between total vitamin C intake (food + supplements) and depressive symptoms.
4. Discussion
We found that dietary vitamin C, total vitamin C intake (food + supplements), and vitamin C derived from vegetables were negatively correlated with the risk of depressive symptoms in the general population. In stratified analyses by sex, dietary vitamin C intake was negatively correlated with the risk of depressive symptoms in female. In age stratified analyses, we discovered a negative association in the 18–39 and 40–59 year-old groups. We found that there was a nonlinear association of dietary vitamin C intake and linear association of dietary vitamin C intake derived from vegetables with the risk of depressive symptoms.
The relationship between ascorbic acid and depression was initially based on the observation of clinical manifestations of ascorbic acid deficiency [30], and some clinical studies had also explored vitamin C as an adjuvant therapy for depression [31,32]. Some studies explored the relationship between vitamin C and the emotional state in acutely hospitalized patients [31] and type 2 diabetic patients [33]; the study found that vitamin C supplementation improved their emotional levels. Some controlled experiments found that supplementing foods with high vitamin C can improve the mood of adult men [34], and the intake of vitamin C in the diet of depressed students decreased significantly [35]. In addition, some reviews summarized the existing evidence for the treatment of depression with ascorbic acid [36,37,38] and the relationship between vitamin C deficiency and depression [39,40]. However, it focused more on clinical trials, and lacked research on the relationship between dietary vitamin C intake and depressive symptoms in the general population.
A cross-sectional survey of 139 male participants aged between 18 and 35 [14] found a reversed association between dietary vitamin C status and depression. This was consistent with our results. A cross-sectional study of 279 adults aged 65 to 75 [15] found that vitamin C intake was correlated with the alleviation of depressive symptoms in community-dwelling elderly persons in Japan. It was only statistically significant in men, while our results were only statistically significant in women by sex stratification. A study of 73 residents over 60 years old found that there was no relationship between the intake of vitamin C and the improvement of depressive symptoms in individuals over 60 years old [17]. Our results also found that there was no correlation between individuals over 60 years old. Inconsistent research results may be due to the different number, age, sex, and nationality of participants.
Vitamin C may be associated with depression through the following mechanisms. Firstly, vitamin C may play an antidepressant role through its antioxidant and anti-inflammatory properties [41]. Studies have shown that vitamin C can be used as an antioxidant at low doses and as a pre-oxidant at high doses [42]. In addition, vitamin C is essential for the synthesis of the monoamine neurotransmitter dopamine, norepinephrine, and serotonin [43], and studies have found that deficiencies and disorders of these substances can lead to depression [44].
In the results of age stratification, we did not find the relationship between dietary vitamin C intake and depressive symptoms in participants over 60 years old. Nutritional requirements may change with age, and the digestive organ function of the elderly gradually declines with aging [45]. Changes caused by aging on the digestive organs of the gastrointestinal tract may affect the absorption of vitamins [46]. The oxidative damage in the elderly is aggravated. Given that the activity of antioxidant enzymes decreases with age, it is very important to provide sufficient dietary antioxidants [47].
Almost all countries encourage the consumption of fruits and vegetables [48]. According to the 2020–2025 dietary guidelines for American residents [49], the recommended dietary allowance of vitamin C for men over 18 years old is 90 mg/day, and 75 mg/day for women. According to our data, 15,828 (61.12%) participants were below the recommended dietary allowance. So, we suggest that the intake of vegetables in the daily diet should be appropriately increased to prevent chronic diseases such as depression.
There are several advantages in our research. Firstly, the dose-response relationship between vitamin C intake and depressive symptoms was discussed. Secondly, in multivariate analysis, we adjusted dietary energy intake and other confounding factors. How each covariate affects the depressive symptoms outcome was shown in Supplementary Figure S1. Thirdly, this study investigated the association between sex and age stratification. Fourthly, we also analyzed the association of vegetable-derived and fruit-derived vitamin C with the risk of depressive symptoms. Finally, because of the large sample size, the results are more reliable.
There are also several limitations in our research. First of all, the study design was cross-sectional, so it was difficult to determine the causal relationship. Secondly, PHQ-9 is a kind of screening tool that might suffer from wrong classification bias. Thirdly, a 24-h dietary recall might lead to memory bias, which might lead to an overestimation or underestimation of the results in our study. However, we used the average of two 24-h dietary recollections as the dietary vitamin C intake, which might partially reduce the recollection bias. Fourthly, cooking often destroys vitamin C in vegetables. We have not controlled the influence of cooking on vitamin C derived from vegetables. Fifth, although vegetables contain high levels of vitamin C, they also contain reasonable levels of other important micronutrients that may help improve mood, such as B vitamins, magnesium, iron, vitamin A, and so on [50]. There is also a possibility that other vitamins and minerals in vegetables may increase the health benefits of vitamin C. Sixth, the best indicator of vitamin C status is plasma ascorbic acid. Due to the limitation of data, we only explored the dietary data. Seventh, due to the limitation of data, the full race classification was not available until 2011, so we cannot analyze the relationship between different races and depression.
5. Conclusions
Dietary vitamin C intake and vitamin C intake derived from vegetables were inversely associated with the risk of depressive symptoms among the general population. For the results of the stratified analysis, we found it in women and 18–59 years old group. We suggest increasing the intake of vegetables in our daily diet.
Supplementary Materials
The following are available online at https://www.mdpi.com/article/10.3390/antiox10121984/s1, Figure S1: How each covariate affects the depressive symptoms outcome. Table S1: The classifications of covariates, Table S2: The comparison results of the characteristic between the high (>50 mg/day) and low (≤50 mg/day) vitamin C intake from vegetables.
Author Contributions
Conceptualization, A.W. and J.L.; formal analysis, A.W. and T.Z.; writing—original draft preparation, A.W.; writing—review and editing, A.W. and D.Z.; supervision, D.Z. All authors have read and agreed to the published version of the manuscript.
Funding
This research received no external funding.
Institutional Review Board Statement
All procedures performed involving human individuals in NHANES were in accordance with the Declaration of Helsinki (IRB number 2005-06, 2011-17).
Informed Consent Statement
Informed consent was obtained from all individuals involved in the NHANES by the National Center for Health Statistics, Centers for Disease Control and Prevention.
Data Availability Statement
The data is contained within the article or supplementary material.
Acknowledgments
This study utilized data from the National Health and Nutrition Examination Survey (NHANES). The authors would like to thank all contributors and participants in NHANES.
Conflicts of Interest
The authors declare no conflict of interest.
References
- Wang, W.; Li, W.; Wu, Y.; Tian, X.; Duan, H.; Li, S.; Tan, Q.; Zhang, D. Genome-wide DNA methylation and gene expression analyses in monozygotic twins identify potential biomarkers of depression. Transl. Psychiatry 2021, 11, 1–10. [Google Scholar] [CrossRef] [PubMed]
- Gładka, A.; Rymaszewska, J.; Zatoński, T. Impact of air pollution on depression and suicide. Int. J. Occup. Med. Environ. Health 2018, 31, 711–721. [Google Scholar] [CrossRef]
- Li, Y.; Zhang, C.; Li, S.; Zhang, D. Association between dietary protein intake and the risk of depressive symptoms in adults. Br. J. Nutr. 2020, 123, 1290–1301. [Google Scholar] [CrossRef]
- Ge, H.; Yang, T.; Sun, J.; Zhang, D. Associations between dietary carotenoid intakes and the risk of depressive symptoms. Food Nutr. Res. 2020, 64, 3920. [Google Scholar] [CrossRef] [PubMed]
- Xu, H.; Li, S.; Song, X.; Li, Z.; Zhang, D. Exploration of the association between dietary fiber intake and depressive symptoms in adults. Nutrients 2018, 54, 48–53. [Google Scholar] [CrossRef] [PubMed]
- Zheng, L.; Yu, X.; Jiang, W.; Zhang, D. Total folate, natural folate and synthetic folic acid intake associations with adult depressive symptoms. Asia Pacific J. Clin. Nutr. 2020, 29, 846–855. [Google Scholar]
- Sun, C.; Wang, R.; Li, Z.; Zhang, D. Dietary magnesium intake and risk of depression. J. Affect. Disord. 2019, 246, 627–632. [Google Scholar] [CrossRef] [PubMed]
- Li, Z.; Wang, W.; Xin, X.; Song, X.; Zhang, D. Association of total zinc, iron, copper and selenium intakes with depression in the US adults. J. Affect. Disord. 2018, 228, 68–74. [Google Scholar] [CrossRef]
- Black, C.N.; Bot, M.; Scheffer, P.G.; Cuijpers, P.; Penninx, B.W. Is depression associated with increased oxidative stress? A systematic review and meta-analysis. Psychoneuroendocrinology 2015, 51, 164–175. [Google Scholar] [CrossRef] [PubMed] [Green Version]
- Padayatty, S.J.; Katz, A.; Wang, Y.; Eck, P.; Kwon, O.; Lee, J.-H.; Chen, S.; Corpe, C.; Dutta, A.; Dutta, S.K.; et al. Vitamin C as an Antioxidant: Evaluation of Its Role in Disease Prevention. J. Am. Coll. Nutr. 2003, 22, 18–35. [Google Scholar] [CrossRef] [PubMed]
- Chatterjee, I.B.; Majumder, A.K.; Nandi, B.K.; Subramanian, N. Synthesis and Some Major Functions of Vitamin C in Animals. Ann. N. Y. Acad. Sci. 1975, 258, 24–47. [Google Scholar] [CrossRef] [PubMed]
- Bürzle, M.; Hediger, M.A. Functional and Physiological Role of Vitamin C Transporter. In Current Topics in Membranes; Elsevier: Amsterdam, The Netherlands, 2012; Volume 70, pp. 357–375. ISBN 978-0-12-394316-3. [Google Scholar]
- Nutt, D. Relationship of neurotransmitters to the symptoms of major depressive disorder. J. Clin. Psychiatry 2008, 69, 4–7. [Google Scholar] [PubMed]
- Pullar, J.M.; Carr, A.C.; Bozonet, S.M.; Vissers, M.C.M. High Vitamin C Status Is Associated with Elevated Mood in Male Tertiary Students. Antioxidants 2018, 7, 91. [Google Scholar] [CrossRef] [Green Version]
- Oishi, J.; Doi, H.; Kawakami, N. Nutrition and depressive symptoms in community-dwelling elderly persons in Japan. Acta Med. Okayama 2009, 63, 9–17. [Google Scholar]
- Khajehnasiri, F.; Mortazavi, S.B.; Allameh, A.; Akhondzadeh, S. Effect of omega-3 and ascorbic acid on inflammation markers in depressed shift workers in Shahid Tondgoyan Oil Refinery, Iran: A randomized double-blind placebo-controlled study. J. Clin. Biochem. Nutr. 2013, 53, 36–40. [Google Scholar] [CrossRef] [Green Version]
- Gosney, M.; Hammond, M.; Shenkin, A.; Allsup, S. Effect of Micronutrient Supplementation on Mood in Nursing Home Residents. Gerontology 2008, 54, 292–299. [Google Scholar] [CrossRef] [PubMed] [Green Version]
- Centers for Disease Control and Prevention. National Health and Nutrition Examination Survey. Available online: http://www.cdc.gov/nchs/nhanes/index.htm (accessed on 14 September 2021).
- Miki, T.; Eguchi, M.; Kurotani, K.; Kochi, T.; Kuwahara, K.; Ito, R.; Kimura, Y.; Tsuruoka, H.; Akter, S.; Kashino, I.; et al. Dietary fiber intake and depressive symptoms in Japanese employees: The Furukawa Nutrition and Health Study. Nutrients 2016, 32, 584–589. [Google Scholar] [CrossRef] [Green Version]
- Bailey, R.L.; Pac, S.G.; Fulgoni, V.L., 3rd; Reidy, K.C.; Catalano, P.M. Estimation of total usual dietary intakes of pregnant women in the United States. JAMA Network Open 2019, 2, e195967. [Google Scholar] [CrossRef] [Green Version]
- National Health and Nutrition Examination Survey. Mental Health—Depression Screener Data Documentation, Codebook and Frequencies. Available online: https://wwwn.cdc.gov/Nchs/Nhanes/2017-2018/DPQ_J.htm (accessed on 14 September 2021).
- Manea, L.; Gilbody, S.; McMillan, D. Optimal cut-off score for diagnosing depression with the Patient Health Questionnaire (PHQ-9): A meta-analysis. Can. Med. Assoc. J. 2012, 184, E191–E196. [Google Scholar] [CrossRef] [Green Version]
- National Health and Nutrition Examination Survey. Dietary Interview—Total Nutrient Intakes, First Day. 2017–2018 Data Documentation, Codebook, and Frequencies. Available online: https://wwwn.cdc.gov/Nchs/Nhanes/2017-2018/DR1TOT_J.htm (accessed on 20 September 2021).
- U.S. Department of Agriculture, Agricultural Research Service. USDA Food and Nutrient Database for Dietary Studies. Available online: https://www.ars.usda.gov/northeast-area/beltsville-md-bhnrc/beltsville-human-nutrition-research-center/food-surveys-research-group/docs/fndds/ (accessed on 20 September 2021).
- Sun, J.; Wang, W.; Zhang, D. Associations of different types of dairy intakes with depressive symptoms in adults. J. Affect. Disord. 2020, 274, 326–333. [Google Scholar] [CrossRef] [PubMed]
- Zhang, R.; Sun, J.; Li, Y.; Zhang, D. Associations of n-3, n-6 Fatty Acids Intakes and n-6:n-3 Ratio with the Risk of Depressive Symptoms: NHANES 2009–2016. Nutrients 2020, 12, 240. [Google Scholar] [CrossRef] [PubMed] [Green Version]
- Zheng, L.; Sun, J.; Yu, X.; Zhang, D. Ultra-Processed Food Is Positively Associated with Depressive Symptoms Among United States Adults. Front. Nutr. 2020, 7, 600449. [Google Scholar] [CrossRef]
- Sun, J.; Li, Z.; Li, Y.; Zhang, D. Intakes of Specific Categories of Vegetables and Fruits Are Inversely Associated with Depressive Symptoms Among Adults. J. Epidemiol. 2021, 31, 210–219. [Google Scholar] [CrossRef] [PubMed] [Green Version]
- Center for Disease Control and Prevention. National Health and Nutrition Examination Survey. Modul 3: Weighting. Available online: http://wwwn.cdc.gov/nchs/nhanes/tutorials/module3.aspx (accessed on 20 September 2021).
- Kinsman, R.A.; Hood, J. Some behavioral effects of ascorbic acid deficiency. Am. J. Clin. Nutr. 1971, 24, 455–464. [Google Scholar] [CrossRef]
- Amr, M.; El-Mogy, A.; Shams, T.; Vieira, K.; Lakhan, S.E. Efficacy of vitamin C as an adjunct to fluoxetine therapy in pediatric major depressive disorder: A randomized, double-blind, placebo-controlled pilot study. Nutr. J. 2013, 12, 31. [Google Scholar] [CrossRef] [PubMed] [Green Version]
- Sahraian, A.; Ghanizadeh, A.; Kazemeini, F. Vitamin C as an adjuvant for treating major depressive disorder and suicidal behavior, a randomized placebo-controlled clinical trial. Trials 2015, 16, 94. [Google Scholar] [CrossRef] [PubMed] [Green Version]
- Mazloom, Z.; Ekramzadeh, M.; Hejazi, N. Efficacy of Supplementary Vitamins C and E on Anxiety, Depression and Stress in Type 2 Diabetic Patients: A Randomized, Single-blind, Placebo-controlled Trial. Pak. J. Biol. Sci. 2013, 16, 1597–1600. [Google Scholar] [CrossRef] [PubMed] [Green Version]
- Carr, A.C.; Bozonet, S.M.; Pullar, J.M.; Vissers, M.C.M. Mood improvement in young adult males following supplementation with gold kiwifruit, a high-vitamin C food. J. Nutr. Sci. 2013, 2, e24. [Google Scholar] [CrossRef] [Green Version]
- Prohan, M.; Amani, R.; Nematpour, S.; Jomehzadeh, N.; Haghighizadeh, M.H. Total antioxidant capacity of diet and serum, dietary antioxidant vitamins intake, and serum hs-CRP levels in relation to depression scales in university male students. Redox Rep. 2014, 19, 133–139. [Google Scholar] [CrossRef] [Green Version]
- Moretti, M.; Fraga, D.B.; Rodrigues, A.L. Ascorbic Acid to Manage Psychiatric Disorders. CNS Drugs 2017, 31, 571–583. [Google Scholar] [CrossRef]
- Han, Q.-Q.; Shen, T.-T.; Wang, F.; Wu, P.-F.; Chen, J.-G. Preventive and Therapeutic Potential of Vitamin C in Mental Disorders. Curr. Med. Sci. 2018, 38, 1–10. [Google Scholar] [CrossRef]
- Kocot, J.; Luchowska-Kocot, D.; Kiełczykowska, M.; Musik, I.; Kurzepa, J. Does Vitamin C Influence Neurodegenerative Diseases and Psychiatric Disorders? Nutrients 2017, 9, 659. [Google Scholar] [CrossRef] [Green Version]
- Plevin, D.; Galletly, C. The neuropsychiatric effects of vitamin C deficiency: A systematic review. BMC Psychiatry 2020, 20, 1–9. [Google Scholar] [CrossRef] [PubMed]
- Moritz, B.; Schmitz, A.E.; Rodrigues, A.L.S.; Dafre, A.; Cunha, M.P. The role of vitamin C in stress-related disorders. J. Nutr. Biochem. 2020, 85, 108459. [Google Scholar] [CrossRef] [PubMed]
- Sarandol, A.; Sarandol, E.; Eker, S.S.; Erdinc, S.; Vatansever, E.; Kirli, S. Major depressive disorder is accompanied with oxidative stress: Short-term antidepressant treatment does not alter oxidative–antioxidative systems. Hum. Psychopharmacol. Clin. Exp. 2007, 22, 67–73. [Google Scholar] [CrossRef]
- Mendes-Da-Silva, R.F.; Lopes-De-Morais, A.A.C.; Bandim-Da-Silva, M.E.; Cavalcanti, G.D.A.; Rodrigues, A.R.O.; Andrade-Da-Costa, B.L.D.S.; Guedes, R.C.A. Prooxidant versus antioxidant brain action of ascorbic acid in well-nourished and malnourished rats as a function of dose: A cortical spreading depression and malondialdehyde analysis. Neuropharmacology 2014, 86, 155–160. [Google Scholar] [CrossRef] [PubMed]
- Englard, S.; Seifter, S. The Biochemical Functions of Ascorbic Acid. Annu. Rev. Nutr. 1986, 6, 365–406. [Google Scholar] [CrossRef]
- Delgado, P.L. Depression: The case for a monoamine deficiency. J. Clin. Psychiatry 2000, 61, 7–11. [Google Scholar]
- Schlüter, N.; Groß, P. Special aspects of nutrition in elderly. Swiss Dental J. 2019, 129, 929–936. [Google Scholar]
- Saltzman, J.R.; Russell, R.M. THE AGING GUT: Nutritional Issues. Gastroenterol. Clin. N. Am. 1998, 27, 309–324. [Google Scholar] [CrossRef]
- Elmadfa, I.; Meyer, A. Body Composition, Changing Physiological Functions and Nutrient Requirements of the Elderly. Ann. Nutr. Metab. 2008, 52, 2–5. [Google Scholar] [CrossRef] [PubMed]
- Herforth, A.; Arimond, M.; Álvarez-Sánchez, C.; Coates, J.; Christianson, K.; Muehlhoff, E. A Global Review of Food-Based Dietary Guidelines. Adv. Nutr. 2019, 10, 590–605. [Google Scholar] [CrossRef] [PubMed] [Green Version]
- USDA. Dietary Guidelines for Americans, 2020–2025; USDA: Washington, DC, USA, 2020. [Google Scholar]
- Mohammed, S.G.; Qoronfleh, M.W. Vegetables. Adv. Neurobiol. 2020, 24, 225–277. [Google Scholar] [PubMed]

Publisher’s Note: MDPI stays neutral with regard to jurisdictional claims in published maps and institutional affiliations. |
© 2021 by the authors. Licensee MDPI, Basel, Switzerland. This article is an open access article distributed under the terms and conditions of the Creative Commons Attribution (CC BY) license (https://creativecommons.org/licenses/by/4.0/).