Article

Dietary Fiber Intake May Influence the Impact of FTO Genetic Variants on Obesity Parameters and Lipid Profile—A Cohort Study of a Caucasian Population of Polish Origin

1
Clinical Research Centre, Department of Nutriomics, Medical University of Bialystok, Jana Kilinskiego 1, 15-089 Bialystok, Poland
2
Clinical Research Centre, Medical University of Bialystok Clinical Hospital, Marii Sklodowskiej-Curie 24A, 15-276 Bialystok, Poland
3
Department of Endocrinology, Diabetology and Internal Medicine, Medical University of Bialystok, Jana Kilinskiego 1, 15-089 Bialystok, Poland
*
Authors to whom correspondence should be addressed.
These authors contributed equally to this work.
Antioxidants 2021, 10(11), 1793; https://doi.org/10.3390/antiox10111793
Submission received: 30 September 2021 / Revised: 5 November 2021 / Accepted: 6 November 2021 / Published: 9 November 2021
(This article belongs to the Special Issue Nutrigenomics and Antioxidant Components of Diet)

Abstract

:
Genetic and environmental factors play a key role in the development of obesity. The aim of this study was to explore the potential effect of fat mass and obesity-associated (FTO) rs3751812, rs8050136, rs9939609, rs6499640, rs8044769, and rs7190492 genotypes and dietary fiber intake on the obesity-related parameters and lipid profile in the Polish population. We selected 819 Polish Caucasian adult subjects (52.5% female and 47.5% male) for a final gene–diet interaction analysis, with mean BMI 28.5 (±6.6) kg/m2. We performed measurements of anthropometric parameters, total body fat content and distribution, and blood glucose, insulin, and lipid concentrations. Daily fiber intake was analyzed based on 3-day food-intake diaries, and daily physical activity was evaluated based on the International Physical Activity Questionnaire—Long Form. Our study shows that carriers of the GG genotype (rs3751812), CC genotype (rs8050136), and GG genotype (rs6499640) presented lower hip circumference if daily fiber intake was above 18 g per day. Additionally, GG genotype (rs3751812) and CC genotype (rs8050136) carriers showed surprisingly higher total cholesterol and LDL-cholesterol levels when they were stratified to the group with higher than median fiber intake. The results of this study highlight that high-fiber diets may positively affect anthropometric parameters but may also worsen lipid profile dependent on the FTO genotype.

1. Introduction

The prevalence and development of obesity has increased substantially worldwide [1]. It has been established that obesity is a leading factor for diabetes [2] and cardiovascular disease prevalence [3]. In addition, abnormalities in serum lipids and their metabolism are one of the major risk factors of cardiovascular diseases [4]. One of the major strategies that has been attempted to address this is a balanced diet that fulfils all nutritional needs, connected with genome-customized recommendations.
The fat mass and obesity-associated (FTO) gene has been reported as the gene with the strongest significant correlation with obesity [5]. The associations between FTO genetic variants, dietary factors, and metabolic consequences are still under investigation. However, it has been postulated that associations of some FTO variants with obesity can occur due to their influence on dietary intake [6]. Moreover, in our previously published results, we observed that dietary carbohydrate, protein, and fat intake may modulate the impact of FTO genetic SNPs on obesity and obesity-related metabolic consequences [7]; therefore, we decided to perform additional analyses, including on dietary fiber intake.
Dietary fiber is a non-digestible carbohydrate, derived mainly from fruits and vegetables. Moreover, dietary fiber antioxidant capacity is mainly based on the effect of bioaccessibility and bioavailability of natural antioxidants, including polyphenol compounds, in the diet [8]. Unfortunately, this interaction of dietary fiber and other components of diet could result in retarded absorption of micro- and macronutrients in the small intestine. Nevertheless, it has been shown that dietary fiber intake plays an important role in the improvement of parameters such as glycemic response [9] and plasma lipid profile [10].
The purpose of this study is to evaluate whether daily fiber intake can modify the association between genetic variations of the FTO gene and obesity in the Polish Caucasian population. To the best of our knowledge, this study is the first to examine associations between dietary fiber intake and FTO genetic variants in the Polish population, based on gene–diet interactions.

2. Materials and Methods

2.1. Participants of the Study Cohort

The study group comprised 819 participants recruited from 1549 Polish-origin Caucasian volunteers (18–79 years old) of the 1000PLUS Cohort Study (registered at www.clinicaltrials.gov as NCT03792685), described previously [7,11,12,13]. Participants who previously took diet supplements, medicines (weight loss, anti-diabetic, lipid-lowering, etc.), or other chemical and natural-based substances that could affect the results were eliminated from this study. Individuals who reported metabolic, endocrine, hepatic, or gastrointestinal disorders or who had bariatric surgery, which could have an impact on the study, were excluded from the study analysis as well. Subjects who previously took treatment, or who followed any special diet or dietary pattern (vegan, vegetarian, etc.), and others who met the exclusion criteria mentioned above, were not included in the analysis.

2.2. Anthropometric Measurements and Body Composition Analysis

In all subjects, we recorded the body weight and height using a standardized method [14]. Using the bioelectrical impedance method (InBody 220, Biospace, Seoul, Korea), we analyzed total body composition (fat mass, fat-free mass, and skeletal muscle mass). Body fat distribution analysis, including determination of the percentage of total body fat, visceral adipose tissue (VAT), subcutaneous adipose tissue (SAT), and VAT/SAT ratio, was performed by the multi-frequency bioimpedance method (MaltronBioScan 920-2, Maltron International Ltd., Rayleigh, UK).

2.3. Oral Glucose Tolerance Test (OGTT) Performance

The OGTTs were performed in non-diabetic participants according to the World Health Organization (WHO) recommendations, using a 75 g oral glucose dose. The subjects were instructed to fast for 8–12 h prior to the tests, but not to restrict carbohydrate intake 3 days before the test. Blood was collected at 0, 30, 60, and 120 min after glucose load. Glycemia and insulin levels were measured in all study participants without a history of diabetes.

2.4. Blood Collection and Biochemical Analysis

Blood samples were obtained and collected to evaluate the concentrations of plasma glucose, insulin, total cholesterol, low-density lipoprotein (LDL), high-density lipoprotein (HDL), triglyceride (TG), and hemoglobin A1c (HbA1c). The samples were stored in accordance with the kit instructions until testing at −20 or −80 °C. The samples were prepared for testing in accordance with the instructions provided with the laboratory kit. Concentrations of plasma glucose were measured by the hexokinase enzymatic colorimetric assay (Cobas c111, Roche Diagnostics Ltd., Risch-Rotkreuz, Switzerland). Serum insulin concentrations were evaluated by immunoradiometric assay (INS-Irma, DIASource S.A., Ottignies-Louvain-la-Neuve, Belgium; Wallac Wizard 1470 Automatic Gamma Counter, PerkinElmer Life Sciences, Turku, Finland). Concentrations of lipids were evaluated by enzymatic colorimetric assay using commercially available kits (Cobas c111, Roche Diagnostic Ltd., Risch-Rotkreuz, Switzerland). HbA1c levels were assessed using HPLC (high performance liquid chromatography; D-10 Hemoglobin Testing System, Bio-Rad Laboratories Inc., Hercules, CA, USA by France, Bio-Rad, Marnes-la-Coquette).

2.5. Calculations

Body mass index (BMI) was calculated using the following formula: body weight (kg) divided by height (m) squared. The waist–hip ratio (WHR) was determined by dividing waist circumference by hip circumference. The VAT/SAT ratio was calculated by dividing visceral adipose tissue content by subcutaneous adipose tissue content. In order to evaluate insulin resistance, we performed the homeostasis model assessment (HOMA-IR), following the standard formula: (fasting plasma glucose concentration (mmol/L)) × (fasting insulin concentration (µU/mL))/22.5. Homeostatic model assessment of β-cell function (HOMA-B) was determined using the following formula: 20 × fasting insulin (μIU/mL)/fasting glucose 100 (mmol/mL) − 3.5. The metabolic equivalent (MET, min per week) was calculated using the following formula: (MET level) × (minutes of activity) × (events per week).

2.6. Daily Physical Activity and Dietary Intake Analyses

Daily physical activity was estimated using the International Physical Activity Questionnaire—Long Form (IPAQ-LF), which is a self-administered questionnaire [15]. The results of the questionnaire were used to assess the level of physical activity, expressed as MET values. Each subject was stratified as having a low, moderate, or high level of physical activity.
We conducted a 3-day food-intake diary analysis. Participants were instructed to weigh food and estimate portion sizes based on provided color photograph albums of portion sizes. Daily carbohydrate, protein, fat, and fiber intake were estimated using Dieta 6.0 software (National Food and Nutrition Institute, Warsaw, Poland). Dieta 6.0 software is used to calculate the nutritional value of food and diets based on the tables of the nutritional value of local food products. In order to study the interactions between genetic factors and diet, study participants were divided into 2 quantiles based on average daily fiber intake: lower and higher than median dietary fiber intake (≤18 g a day and >18 g a day of total fiber intake, respectively).

2.7. Genetic Analysis

We selected and genotyped 6 previously identified FTO SNPs in rs3751812 (G > T), rs8050136 (A > C), rs9939609 (T > A), rs6499640 (G > A), rs8044769 (C > T), and rs7190492 (A > G), based on the validated catalog of published genome-wide association studies [16]. DNA was extracted from peripheral blood leukocytes using a classical salting-out method. The SNPs were genotyped with TaqMan SNP technology from a ready-to-use human assay library (Applied Biosystems, Beverly, MA, USA) using a high-throughput genotyping system, OpenArray (Life Technologies, South San Francisco, CA, USA). SNP analysis was performed in duplicate, following the manufacturer’s instructions. As a negative control, we used a sample without a template. The negative control was applicable in measuring any false positive signal caused by contamination.

2.8. Ethics Statement

The study methods were carried out in accordance with the ethical standards of the responsible committee on human experimentation (Ethics Committee of the Medical University of Bialystok, Poland, R-I-002/35/2009) and with the Helsinki Declaration of 1975. Written informed consent was obtained from all participants included in the study.

2.9. Statistical Analysis

Numerical data were summarized with number of observations (N), arithmetic mean, and standard deviation (SD). For categorical data, the number of observations and frequency (percentage) are presented. Study participants were divided into quantiles based on average daily fiber intake, with the thresholds set as the median value of each parameter. Risk genotypes of the 6 previously identified FTO SNPs were predefined based on the literature and our previous findings. Comparisons of the allelic and genotypic frequencies as well as odds ratio calculations in this study were not included because of the relatively small sample size. Continuous parameters were tested for normality with Shapiro–Wilk’s test and by visual inspection. Homogeneity of variance across groups was studied using Levene’s test. Nonparametric tests were used for response variables that failed the mentioned statistical tests. Differences between selected parameters and dietary groups were then compared using analysis of variance (ANOVA) or Kruskal–Wallis test for numerical variables, with either Tukey’s or Dunn’s post hoc test with Holm p-value adjustment (in case multiple pairwise tests were performed, or when there were multiple grouping variables, as presented in tables and figures), and chi-squared test for categorical variables. The statistical significance level was set at <0.05 for all 2-sided tests and multivariate comparisons. All calculations were prepared in R (version 4.0.3).

3. Results

Data from 819 participants (52.5% female and 47.5% male) were included in the gene–diet interaction analysis, as described previously [7]. The mean age of the subjects was 42.1 (±14.5) years, and the mean BMI was 28.5 (±6.6) kg/m2. Among the individuals, 33.9% had a BMI of <25.00 kg/m2, 34.5% were overweight with a BMI of ≥25.00 and <30.00 kg/m2, and 31.6% were obese with a BMI of ≥30.00 kg/m2. Among the study population, 411 individuals (50.2%) were identified as having prediabetes or diabetes. Of these subjects, 109 participants (13.3%) had a previous history of prediabetes or diabetes, 56 participants (6.8%) previously took anti-diabetic drugs and 47 participants (5.7%) were being treated with lipid-lowering medications. The clinical characteristics, stratified by investigated genotypes, are presented in Table 1, Table 2 and Table 3. No significant deviation from the Hardy–Weinberg equilibrium was reported for any of the investigated SNPs (p > 0.05). Among the investigated FTO SNPs, some of the loci were in strong link disequilibrium (D’ = 1.0 for rs8050136 and rs9939609) [17]; thus, we present the results for one of them: rs8050136. We analyzed the same parameters for all of the investigated SNPs, however, in Figure 1, Figure 2, Figure 3, Figure 4 and Figure 5 we present only statistically significant results.
Table 1. Characteristics of participants stratified by rs3751812 and rs8050136 genotypes.
rs3751812rs8050136
G/GG/TT/Tp ValueC/CA/CA/Ap Value
N211420181 209424182
Genotype frequency0.260.520.22>0.050.260.520.22>0.05
Age (years)40.5 (14.2)41.2 (14.7)39.5 (14.3)0.3340.2 (14.1)41.3 (14.8)39.4 (14.3)0.24
BMI (kg/m2)27.6 (6.0)28.7 (6.8)28.9 (6.8)0.06027.6 (6.1)28.7 (6.8)28.9 (6.8)0.063
BMI < 25.0
BMI 25.0–29.9
BMI ≥ 30.0
81 (38.8%)136 (32.9%)53 (29.9%)0.41080 (38.6%)138 (33.2%)54 (30.2%)0.422
69 (33.0%)141 (34.1%)66 (37.3%)69 (33.3%)140 (33.7%)67 (37.4%)
59 (28.2%)136 (32.9%)58 (32.8%)58 (28.0%)138 (33.2%)58 (32.4%)
Total body fat content (kg)25.3 (12.4)27.6 (13.8)28.2 (15.2)0.08025.3 (12.4)27.5 (13.8)28.2 (15.2)0.095
Total body fat content (%)30.6 (9.1)31.8 (9.6)31.6 (10.3)0.37730.6 (9.1)31.8 (9.6)31.6 (10.4)0.465
Waist circumference (cm)94.3 (17.5)96.7 (17.2)97.5 (16.7)0.05494.2 (17.6)96.7 (17.2)97.4 (16.6)0.053
Hip circumference (cm)101.3 (12.4)104.2 (13.0)103.8 (12.5)0.008101.2 (12.5)104.1 (13.0)103.8 (12.4)0.008
WHR0.927 (0.091)0.925 (0.088)0.937 (0.085)0.3270.927 (0.092)0.925 (0.088)0.936 (0.085)0.382
Visceral fat (cm3)103.0 (81.0)110.0 (79.9)112.3 (83.0)0.379103.3 (81.5)110.2 (80.0)111.8 (82.5)0.381
Visceral fat (%)36.4 (11.8)37.5 (12.4)37.2 (11.7)0.58736.4 (11.7)37.6 (12.5)37.1 (11.6)0.570
Subcutaneous fat (cm3)163.5 (83.1)167.2 (80.5)175.0 (82.7)0.401163.7 (83.5)166.9 (80.8)175.3 (83.1)0.405
Subcutaneous fat (%)63.7 (11.7)62.3 (12.9)62.8 (11.7)0.55763.7 (11.6)62.2 (13.0)62.9 (11.6)0.540
Visceral/subcutaneous fat ratio0.642 (0.406)0.687 (0.475)0.665 (0.413)0.5540.641 (0.404)0.690 (0.477)0.662 (0.410)0.536
Total cholesterol (mg/dL)202.7 (56.0)191.7 (41.3)194.0 (43.2)0.070201.9 (56.1)192.1 (41.4)193.7 (43.1)0.153
HDL (mg/dL)60.7 (14.1)59.8 (15.6)59.5 (14.5)0.66260.8 (14.0)59.6 (15.7)59.7 (14.4)0.422
LDL (mg/dL)117.3 (43.3)109.4 (37.8)111.2 (41.8)0.095116.3 (43.3)109.9 (37.9)111.1 (41.8)0.189
TG (mg/dL)123.8 (143.9)111.9 (69.7)116.3 (61.9)0.289124.1 (144.3)113.2 (71.1)115.1 (61.3)0.491
Frequency of prediabetes or diabetes
Yes
No
103 (48.8%)209 (49.8%)95 (52.5%)0.751100 (47.8%)213 (50.2%)96 (52.7%)0.628
108 (51.2%)211 (50.2%)86 (47.5%)109 (52.2%)211 (49.8%)86 (47.3%)
Corrected insulin response level during OGTT (10 × mU × mL × mg−2)
30 min
60 min
120 min
0.8 (0.7)0.8 (0.7)0.9 (1.0)0.8750.8 (0.7)0.8 (0.7)0.9 (1.0)0.884
0.7 (1.1)0.6 (0.6)0.7 (0.8)0.3250.7 (1.1)0.6 (0.6)0.7 (0.8)0.325
1.0 (0.7)1.3 (1.0)1.5 (1.6)0.5541.1 (0.9)1.2 (1.0)1.5 (1.6)0.764
Daily energy intake (kcal)1807.2 (732.3)1766.9 (676.0)1837.4 (713.4)0.8491820.5 (734.9)1759.6 (673.3)1853.9 (716.3)0.645
Dietary fiber intake (g)18.5 (7.2)18.5 (8.2)18.3 (7.6)0.90118.6 (7.2)18.5 (8.2)18.4 (7.7)0.958
Daily physical activity level
Low
Moderate
High
16 (7.6%)25 (6.0%)18 (9.9%)0.30216 (7.7%)25 (5.9%)19 (10.4%)0.179
50 (23.7%)83 (19.8%)40 (22.1%)50 (23.9%)83 (19.6%)40 (22.0%)
145 (68.7%)312 (74.3%)123 (68.0%)143 (68.4%)316 (74.5%)123 (67.6%)
Data presented as mean and standard deviation (SD), number of observations, and frequency. BMI, body mass index; HDL, high-density lipoprotein; LDL, low-density lipoprotein; OGTT, oral glucose tolerance test. * Holm-adjusted Kruskal–Wallis/ANOVA p values.
Table 2. Characteristics of participants stratified by rs6499640 and 8044769 genotypes.
rs6499640rs8044769
A/AA/GG/Gp ValueC/CC/TT/Tp Value
N307377134 270406138
Genotype frequency0.370.460.16>0.050.330.500.17>0.05
Age (years)41.0 (14.7)40.0 (14.2)41.4 (15.0)0.9740.4 (14.8)41.2 (14.6)39.6 (13.7)0.54
BMI (kg/m2)28.6 (6.8)28.6 (6.8)27.6 (5.8)0.35828.5 (6.8)28.7 (6.7)27.8 (6.1)0.534
BMI < 25.0
BMI 25.0–29.9
BMI ≥ 30.0
93 (30.8%)128 (34.5%)52 (39.4%)0.23088 (33.2%)131 (32.8%)51 (37.5%)0.862
118 (39.1%)120 (32.3%)40 (30.3%)92 (34.7%)143 (35.8%)43 (31.6%)
91 (30.1%)123 (33.2%)40 (30.3%)85 (32.1%)126 (31.5%)42 (30.9%)
Total body fat content (kg)27.5 (14.5)27.5 (14.1)24.9 (10.9)0.44927.7 (15.0)27.2 (13.6)25.8 (11.9)0.676
Total body fat content (%)31.6 (9.8)31.6 (9.7)30.6 (8.9)0.59731.7 (10.1)31.4 (9.6)31.1 (9.0)0.893
Waist circumference (cm)96.8 (17.6)96.7 (17.4)93.5 (15.5)0.25596.2 (17.2)96.8 (17.3)94.6 (16.8)0.429
Hip circumference (cm)103.4 (12.9)104.2 (13.3)100.7 (10.4)0.080103.3 (12.6)104.0 (13.0)101.5 (12.2)0.189
WHR0.933 (0.089)0.925 (0.085)0.925 (0.097)0.4850.928 (0.089)0.927 (0.088)0.929 (0.089)0.980
Visceral fat (cm3)109.6 (84.1)110.2 (81.3)101.7 (72.1)0.822109.2 (78.3)110.3 (83.7)99.8 (72.5)0.648
Visceral fat (%)37.3 (11.8)36.5 (12.0)38.2 (12.8)0.48337.7 (11.8)36.9 (12.3)36.4 (12.0)0.617
Subcutaneous fat (cm3)168.9 (85.4)173.4 (82.6)151.5 (70.0)0.124168.6 (83.3)169.7 (82.4)160.9 (74.2)0.773
Subcutaneous fat (%)62.7 (11.8)63.3 (12.6)61.9 (12.7)0.50362.3 (11.8)63.0 (12.8)63.7 (11.8)0.598
Visceral/subcutaneous fat ratio0.670 (0.410)0.655 (0.459)0.706 (0.472)0.4860.689 (0.492)0.662 (0.421)0.641 (0.408)0.590
Total cholesterol (mg/dL)195.3 (51.1)193.8 (42.3)196.9 (44.4)0.646193.8 (40.1)191.7 (42.7)206.7 (62.7)0.029
LDL (mg/dL)111.0 (39.6)111.1 (40.3)114.9 (41.7)0.487111.0 (38.6)109.6 (38.7)119.8 (46.5)0.058
HDL (mg/dL)60.2 (14.6)60.3 (15.8)58.3 (13.4)0.28960.7 (14.7)59.2 (15.5)60.4 (13.8)0.176
TG (mg/dL)120.5 (124.2)111.8 (67.8)118.6 (71.1)0.584110.5 (58.7)114.6 (73.4)132.6 (170.6)0.689
Frequency of prediabetes or diabetes
Yes
No
152 (49.5%)187 (49.6%)71 (53.0%)0.796143 (53.0%)201 (49.5%)64 (46.4%)0.420
155 (50.5%)190 (50.4%)63 (47.0%)127 (47.0%)205 (50.5%)74 (53.6%)
Corrected insulin response level during OGTT (10 × mU × mL × mg−2)
30 min
60 min
120 min
0.8 (0.9)0.8 (0.7)0.9 (0.8)0.6160.9 (0.9)0.8 (0.7)0.8 (0.7)0.618
0.6 (0.7)0.7 (0.8)0.7 (0.7)0.7450.7 (0.7)0.7 (0.9)0.5 (0.5)0.194
1.4 (1.4)1.2 (1.0)1.2 (1.0)0.9491.3 (1.3)1.4 (1.0)1.1 (0.8)0.639
Daily energy intake (kcal)1786.5 (705.2)1825.7 (725.8)1720.7 (594.6)0.7281775.7 (646.2)1792.7 (735.8)1816.0 (686.3)0.791
Dietary fiber intake (g)18.1 (7.1)19.0 (8.5)17.9 (7.4)0.57018.1 (7.4)18.8 (8.2)18.2 (7.4)0.598
Daily physical activity level
Low
Moderate
High
22 (7.2%)30 (8.0%)8 (6.0%)0.73623 (8.5%)26 (6.4%)10 (7.2%)0.060
68 (22.1%)81 (21.5%)24 (17.9%)55 (20.4%)77 (19.0%)41 (29.7%)
217 (70.7%)266 (70.6%)102 (76.1%)192 (71.1%)303 (74.6%)87 (63.0%)
Data presented as mean and standard deviation (SD), number of observations, and frequency. BMI, body mass index; HDL, high-density lipoprotein; LDL, low-density lipoprotein; OGTT, oral glucose tolerance test. * Holm-adjusted Kruskal–Wallis/ANOVA p values.
Table 3. Characteristics of participants stratified by rs7190492 genotype.
rs7190492
G/GA/GA/Ap Value
N37435883
Genotype frequency0.460.440.10>0.05
Age (years)40.4 (14.8)40.8 (14.4)40.4 (13.6)1.0
BMI (kg/m2)28.7 (6.8)28.3 (6.5)28.1 (6.6)0.605
BMI < 25.0
BMI 25.0–29.9
BMI ≥ 30.0
120 (32.5%)122 (34.8%)30 (36.1%)0.461
126 (34.1%)128 (36.5%)23 (27.7%)
123 (33.3%)101 (28.8%)30 (36.1%)
Total body fat content (kg)27.8 (14.5)26.5 (13.4)26.6 (12.4)0.533
Total body fat content (%)31.9 (10.0)30.8 (9.5)32.1 (8.8)0.303
Waist circumference (cm)96.6 (17.3)96.2 (17.0)94.7 (17.6)0.585
Hip circumference (cm)103.4 (12.7)103.6 (12.9)101.7 (12.5)0.588
WHR0.930 (0.090)0.925 (0.086)0.927 (0.092)0.774
Visceral fat (cm3)110.7 (83.0)106.6 (81.2)103.0 (67.1)0.777
Visceral fat (%)37.4 (11.6)36.6 (12.5)37.5 (12.5)0.665
Subcutaneous fat (cm3)170.4 (85.7)166.5 (78.9)160.7 (72.5)0.921
Subcutaneous fat (%)62.4 (12.2)63.4 (12.5)62.7 (12.2)0.653
Visceral/subcutaneous fat ratio0.674 (0.454)0.660 (0.434)0.676 (0.443)0.652
Total cholesterol (mg/dL)192.9 (40.4)194.3 (51.0)206.0 (47.5)0.056
LDL (mg/dL)110.1 (38.2)111.4 (41.0)119.6 (45.5)0.219
HDL (mg/dL)60.4 (14.6)59.1 (15.4)61.0 (14.0)0.227
TG (mg/dL)111.8 (62.8)118.6 (119.3)126.9 (86.2)0.422
Frequency of prediabetes or diabetes
Yes
No
194 (51.9%)176 (49.2%)38 (45.8%)0.544
180 (48.1%)182 (50.8%)45 (54.2%)
Corrected insulin response level during OGTT (10 × mU × mL × mg−2)
30 min
60 min
120 min
0.8 (0.8)0.9 (0.7)0.9 (0.7)0.421
0.6 (0.6)0.8 (1.0)0.5 (0.4)0.428
1.3 (1.3)1.3 (1.0)1.2 (0.9)0.828
Daily energy intake (kcal)1765.4 (660.6)1823.5 (728.6)1771.0 (744.1)0.609
Dietary fiber intake (g)18.0 (6.8)18.8 (8.7)19.4 (8.4)0.586
Daily physical activity level
Low
Moderate
High
29 (7.8%)23 (6.4%)8 (9.6%)0.626
75 (20.1%)75 (20.9%)21 (25.3%)
270 (72.2%)260 (72.6%)54 (65.1%)
Data presented as mean and standard deviation (SD), number of observations, and frequency. BMI, body mass index; HDL, high-density lipoprotein; LDL, low-density lipoprotein; OGTT, oral glucose tolerance test. * Holm-adjusted Kruskal–Wallis/ANOVA p values.

3.1. General Characteristic of Studied Population Stratified by Genotypes

Based on the food intake, physical activity, clinical, anthropometric and demographic data, we observed significant differences only in hip circumference between studied genotypes rs3751812 and rs8050136 (Table 1), and in total cholesterol level between genotypes of rs8044769 (Table 2), which was presented previously [7]. We did not observe any other significant differences between the studied genotypes.

3.2. Assessment of Dietary Intake

The 3-day food diaries were available exclusively from a selected subgroup of 622 participants because not all participants completed diaries properly. We did not find any differences between studied genotypes and dietary fiber intake presented in Table 1, Table 2 and Table 3. With the use of boxplots in the figures, we showed the contrast between median values of the selected responses and the interquartile ranges (IQRs) in different genotypic and dietary strata.

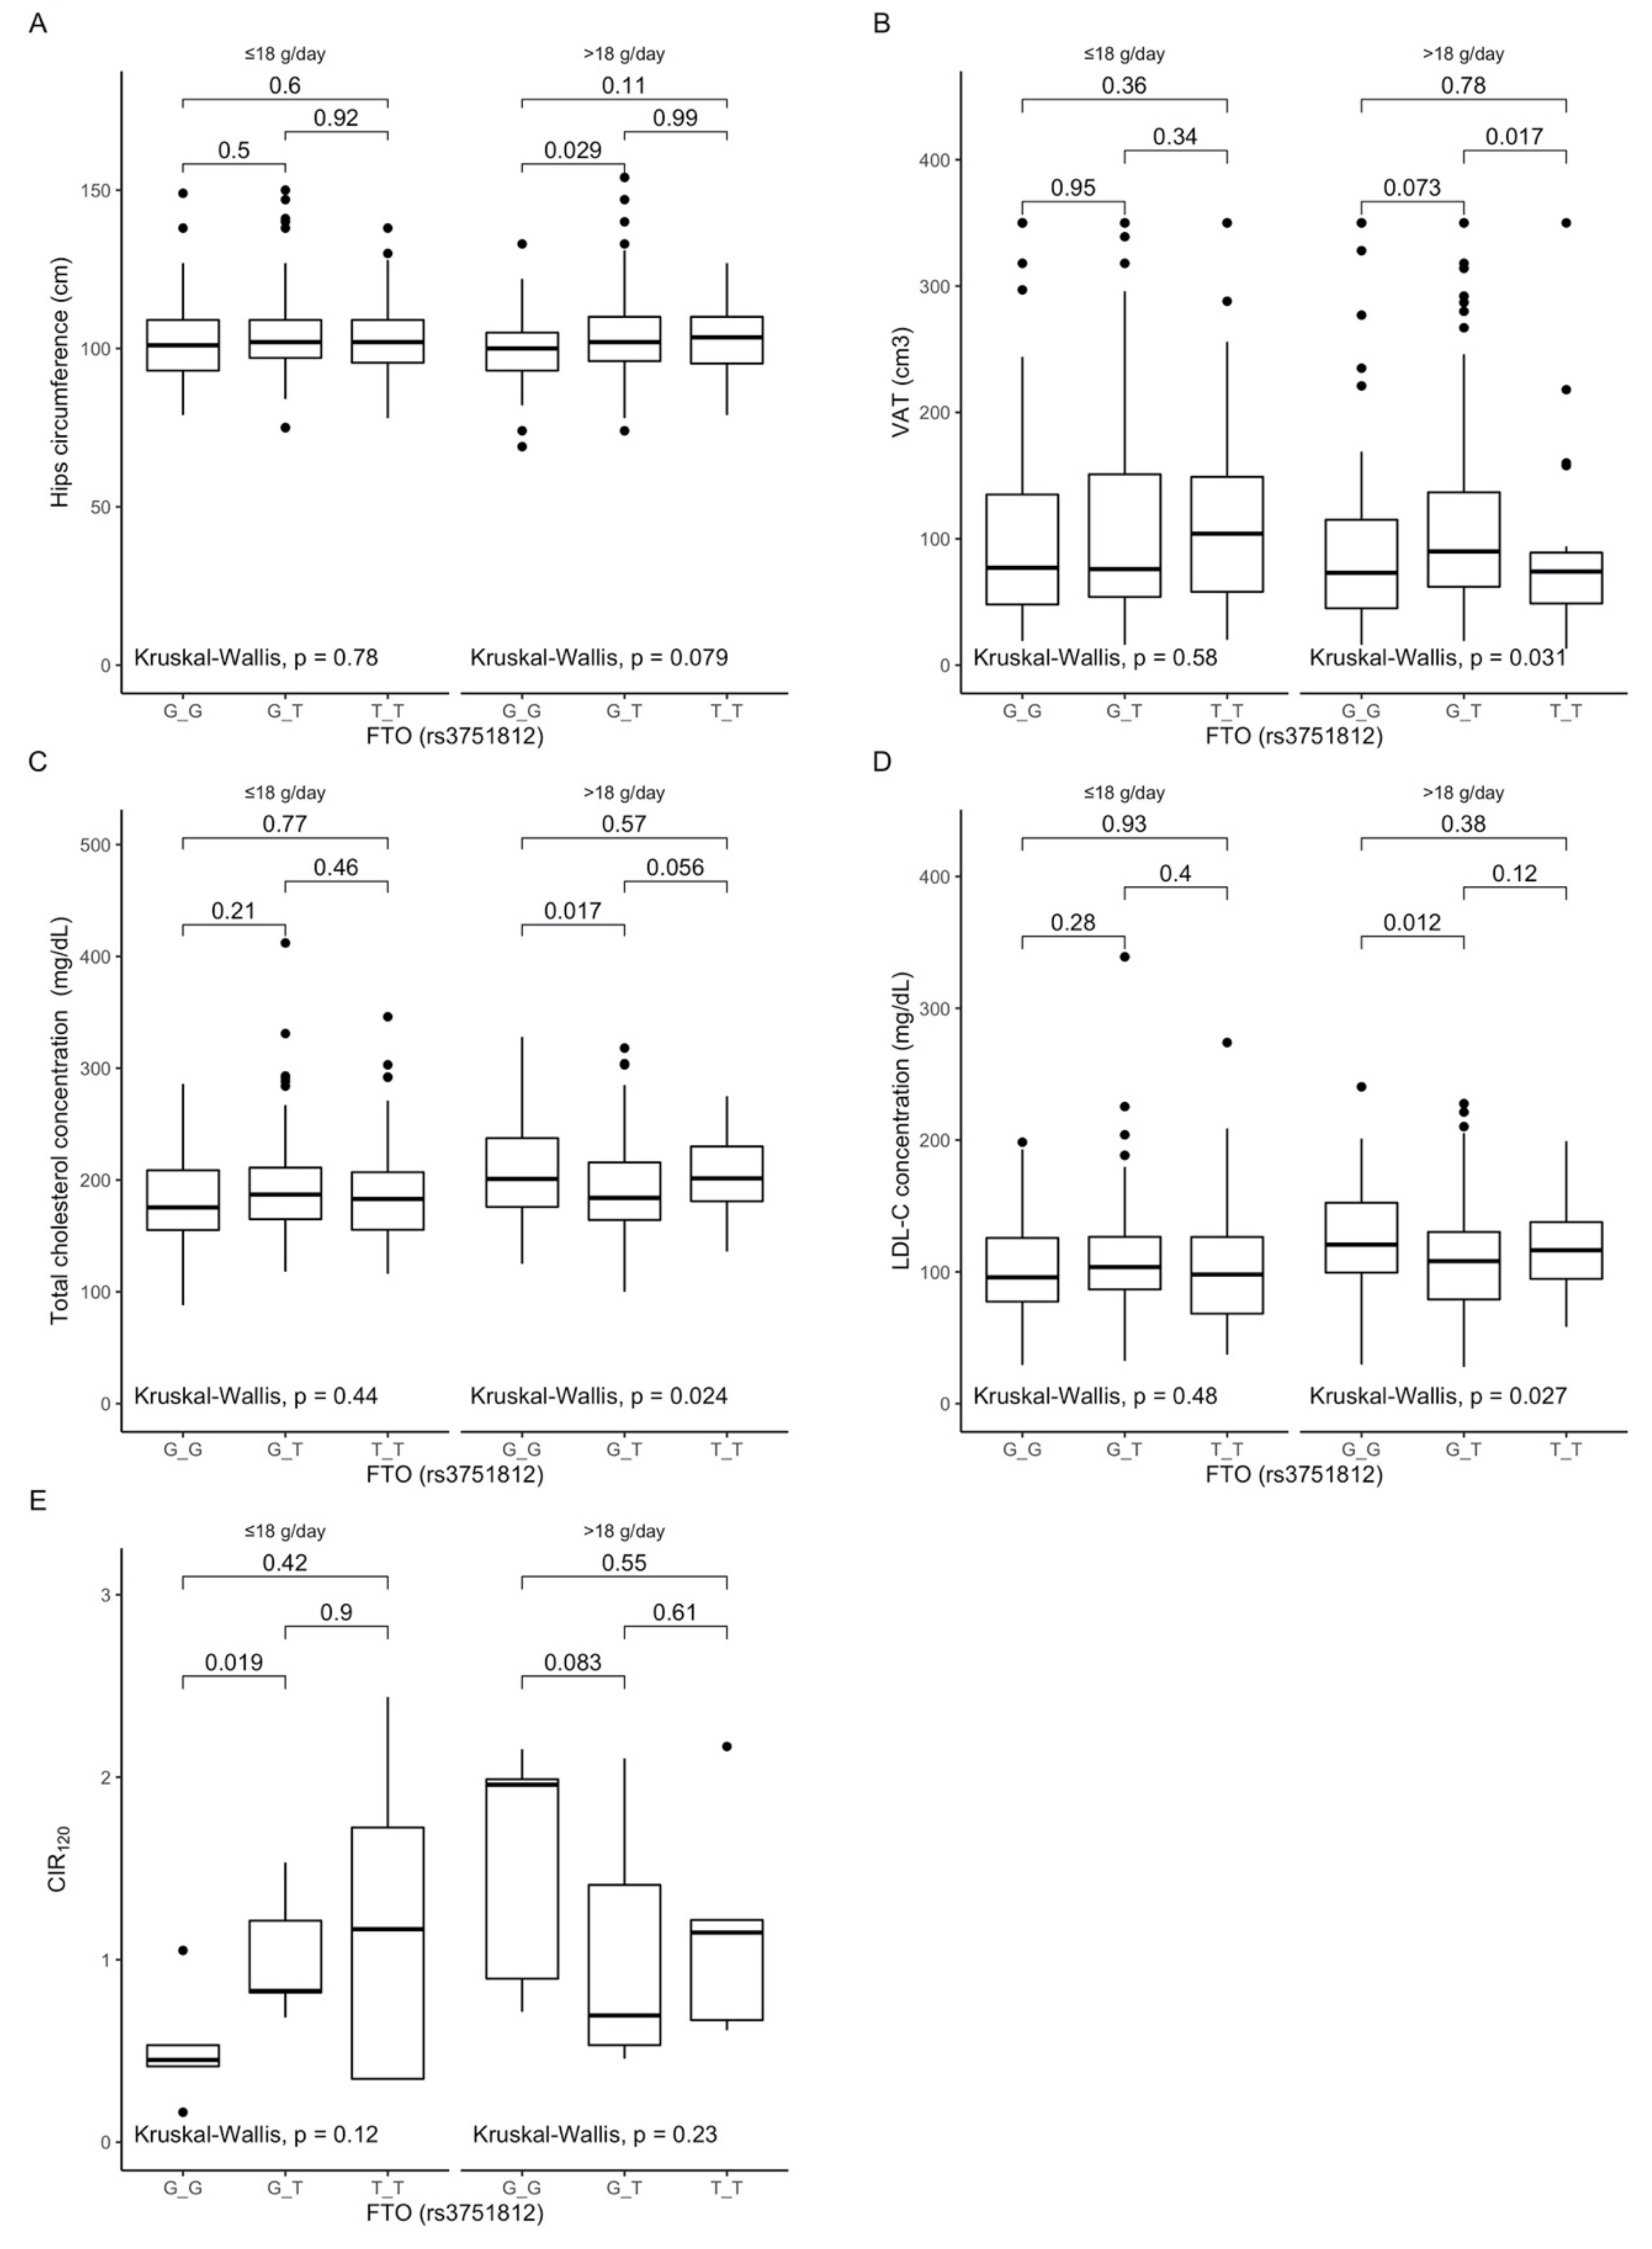
3.3. Associations between rs3751812 Polymorphism, Anthropometric Measurements, Lipid Profile, and Dietary Fiber Intake

Based on the analysis of the interactions between rs3751812 genotypes and fiber intake, we observed that GG genotype carriers presented lower hip circumferences (Figure 1A), while TT genotype carriers presented lower visceral fat content than heterozygous individuals (Figure 1B) when they were stratified to the group with higher than median fiber intake. Moreover, we noted that GG genotype carriers in the group with higher than median fiber intake presented higher total cholesterol (Figure 1C) and LDL-cholesterol levels (Figure 1D). Additionally, we observed that GG carriers showed lower corrected insulin response levels at 120 min of OGTT (Figure 1E) when they were stratified to the group with lower than median fiber intake.
Figure 1. Association of the FTO rs3751812 genotypes with (A) Hip circumference (cm); (B) Visceral adipose tissue (VAT) (cm3); (C) Total cholesterol concentration (mg/dL); (D) LDL-C concentration (mg/dL); (E) CIR 120 by dietary fiber intake strata: ≤18 g/day and >18 g/day.
Antioxidants 10 01793 g001

3.4. Associations between rs8050136 Polymorphism, Anthropometric Measurements, Lipid Profile, and Dietary Fiber Intake

Analyzing the differences between rs8050136 genotypes dependent on dietary fiber intake, we observed that carriers of the CC genotype stratified to the group with higher than median fiber intake presented lower hip circumferences (Figure 2A), while AA genotype carriers presented lower visceral fat content (Figure 2B). Additionally, we observed that CC genotype carriers showed higher total cholesterol (Figure 2C) and higher LDL-cholesterol levels (Figure 2D), whereas when CC genotype carriers were stratified to the group with lower than median fiber intake, we noted lower corrected insulin response levels at 120 min of OGTT (Figure 2E).
Figure 2. Association of the FTO rs8050136 genotypes with (A) Hip circumference (cm); (B) Visceral adipose tissue (VAT) (cm3); (C) Total cholesterol concentration (mg/dL); (D) LDL-C concentration (mg/dL); (E) CIR 120 by dietary fiber intake strata: ≤18 g/day and >18 g/day.
Antioxidants 10 01793 g002

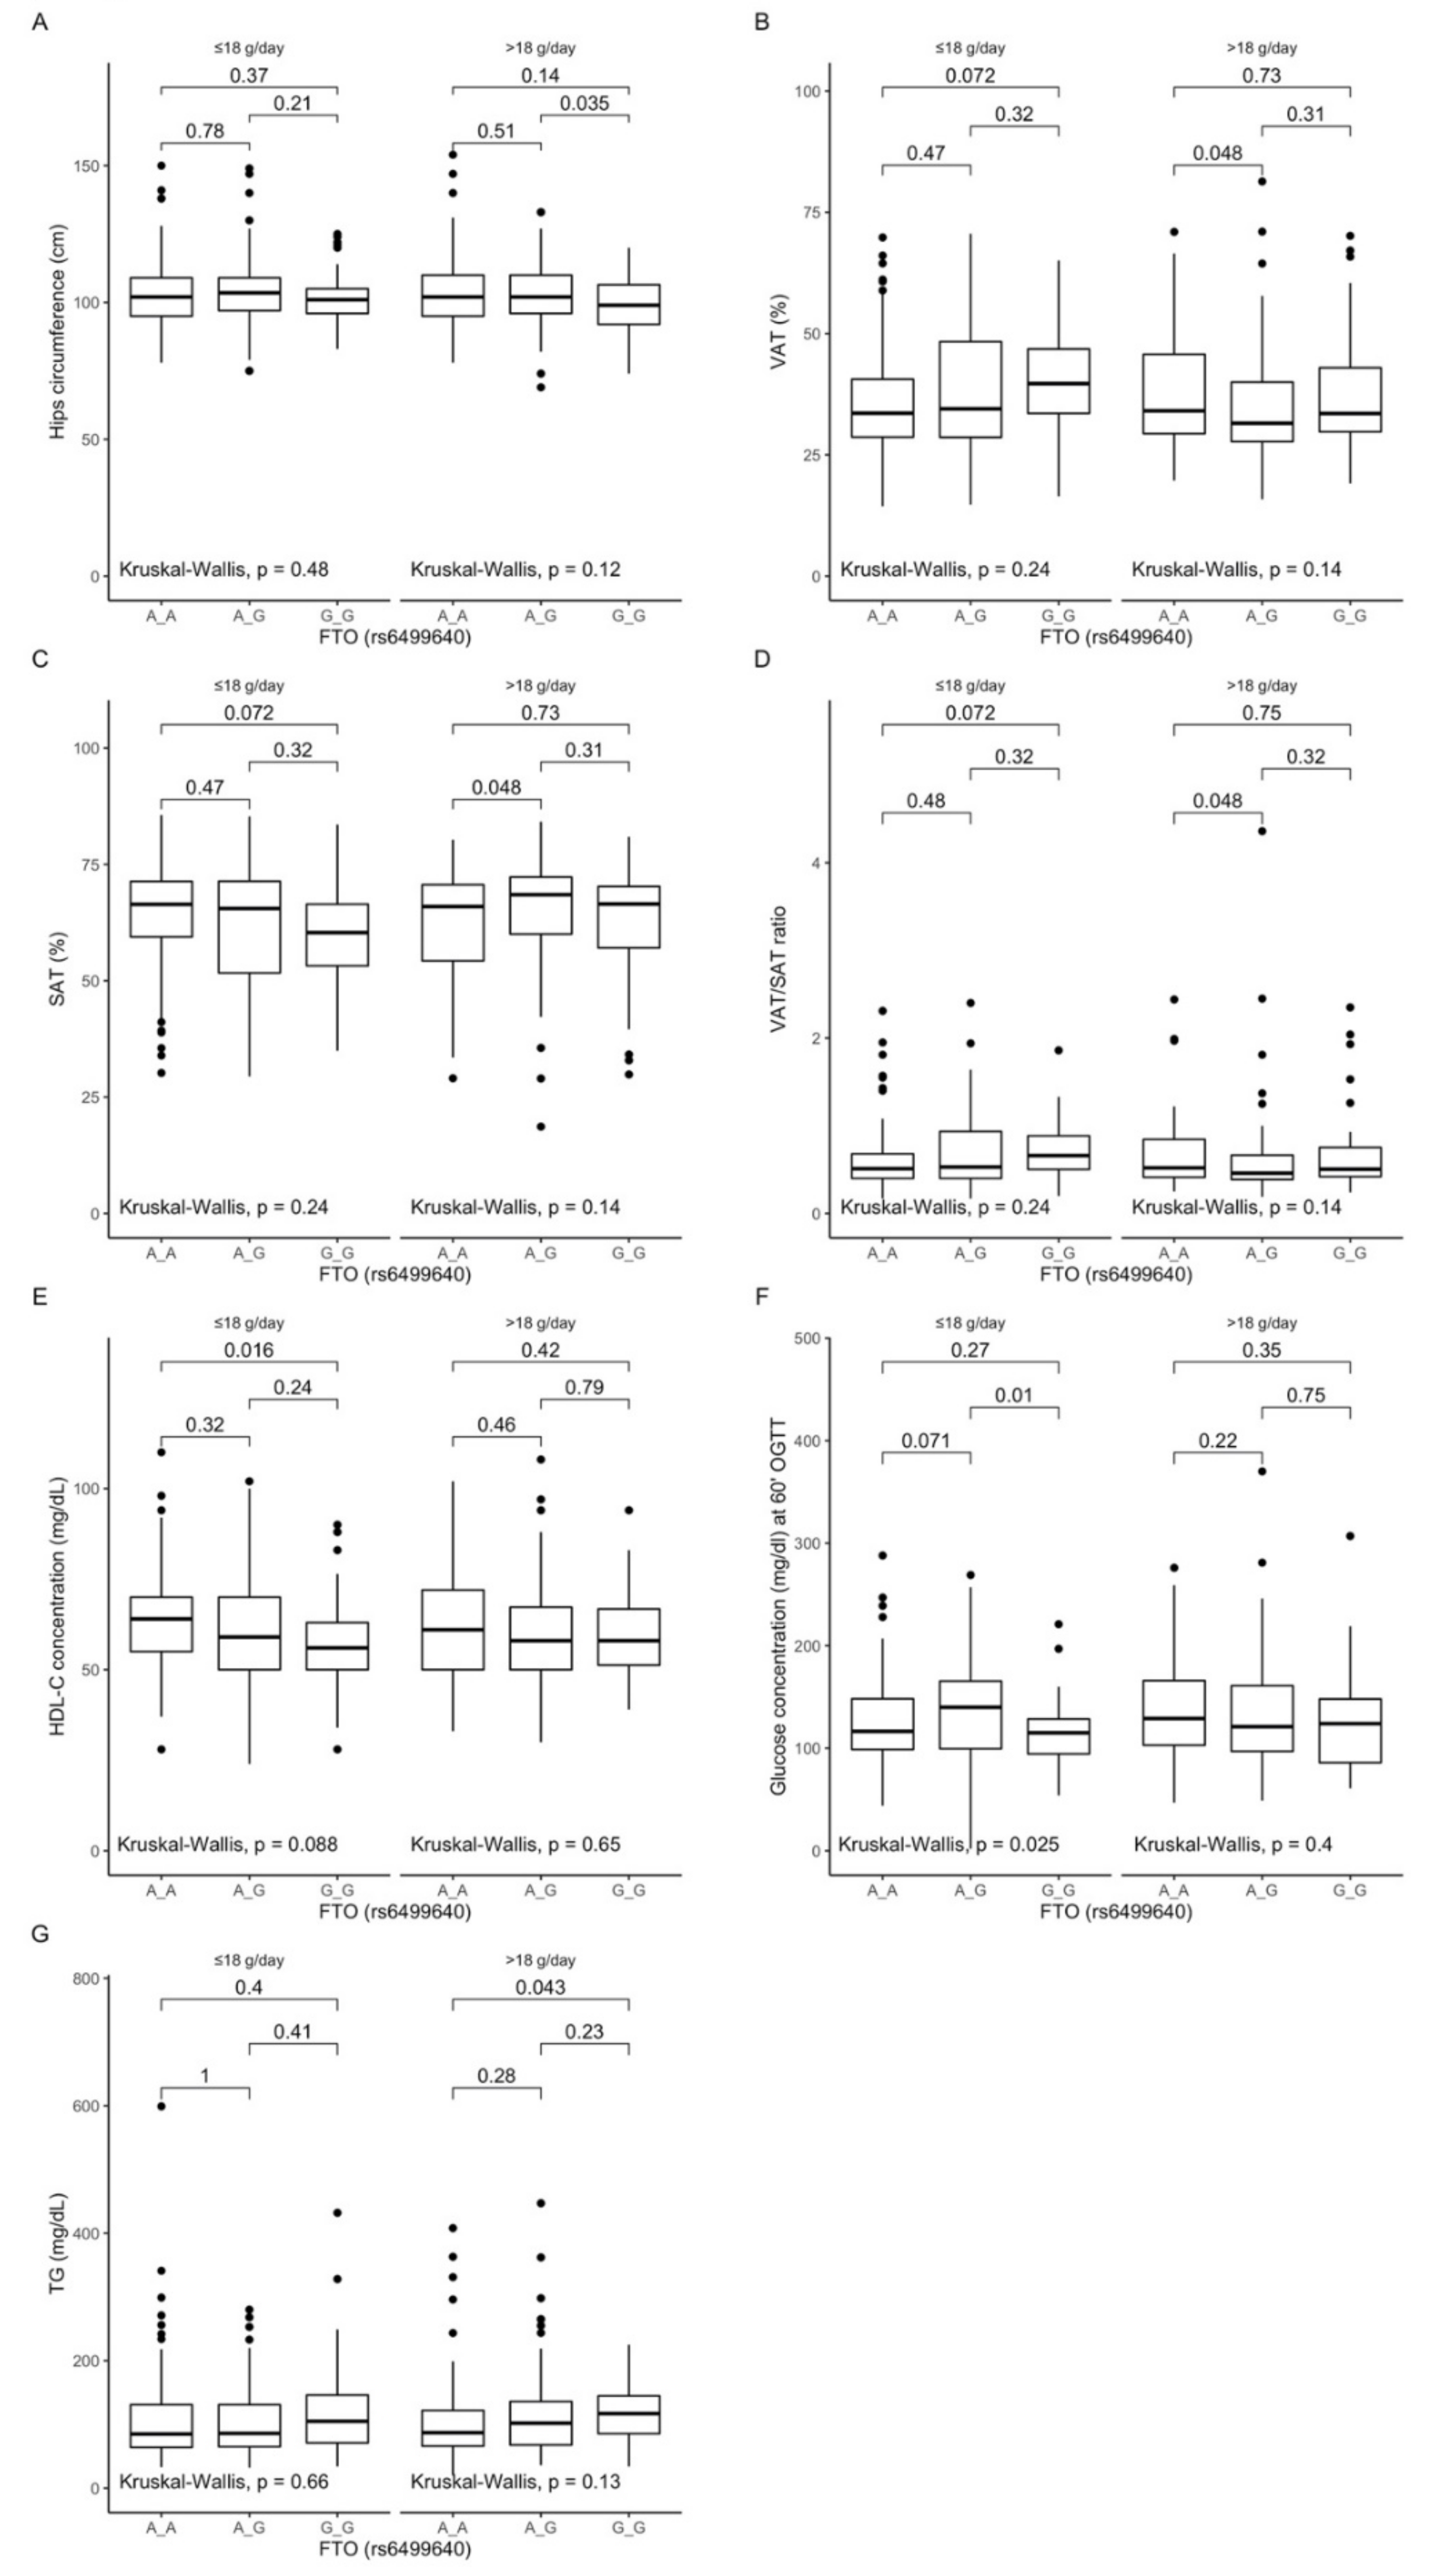
3.5. Associations between rs6499640 Polymorphism, Anthropometric Measurements, Lipid Profile, and Dietary Fiber Intake

The gene–diet interaction analysis showed that GG genotype carriers stratified to the group with higher than median fiber intake presented lower hip circumferences (Figure 3A). Additionally, we observed that the AG genotype carriers presented surprisingly lower visceral fat content (Figure 3B), higher subcutaneous fat content (Figure 3C), and lower VAT/SAT ratio (Figure 3D) compared to the AA genotype carriers. We noted that homozygous AA carriers presented higher HDL-cholesterol levels (Figure 3E), and heterozygous AG carriers presented higher blood glucose levels at 60 min of OGTT (Figure 3F), compared to the heterozygous participants in the group with lower than median fiber intake. The higher levels of triglycerides were noted only in the GG genotype carriers (Figure 3G) when they were stratified to the group with higher than median fiber intake.
Figure 3. Association of the FTO rs6499640 genotypes with (A) Hip circumference (cm); (B) Visceral adipose tissue (VAT) (cm3); (C) Subcutaneous adipose tissue (SAT) (%); (D) VAT/SAT ratio; (E) HDL-C concentration (mg/dL); (F) Glucose concentration (mg/dL) at 60 min of OGTT; (G) Triglycerides (TG) (mg/dL) by dietary fiber intake strata: ≤18 g/day and >18 g/day.
Antioxidants 10 01793 g003

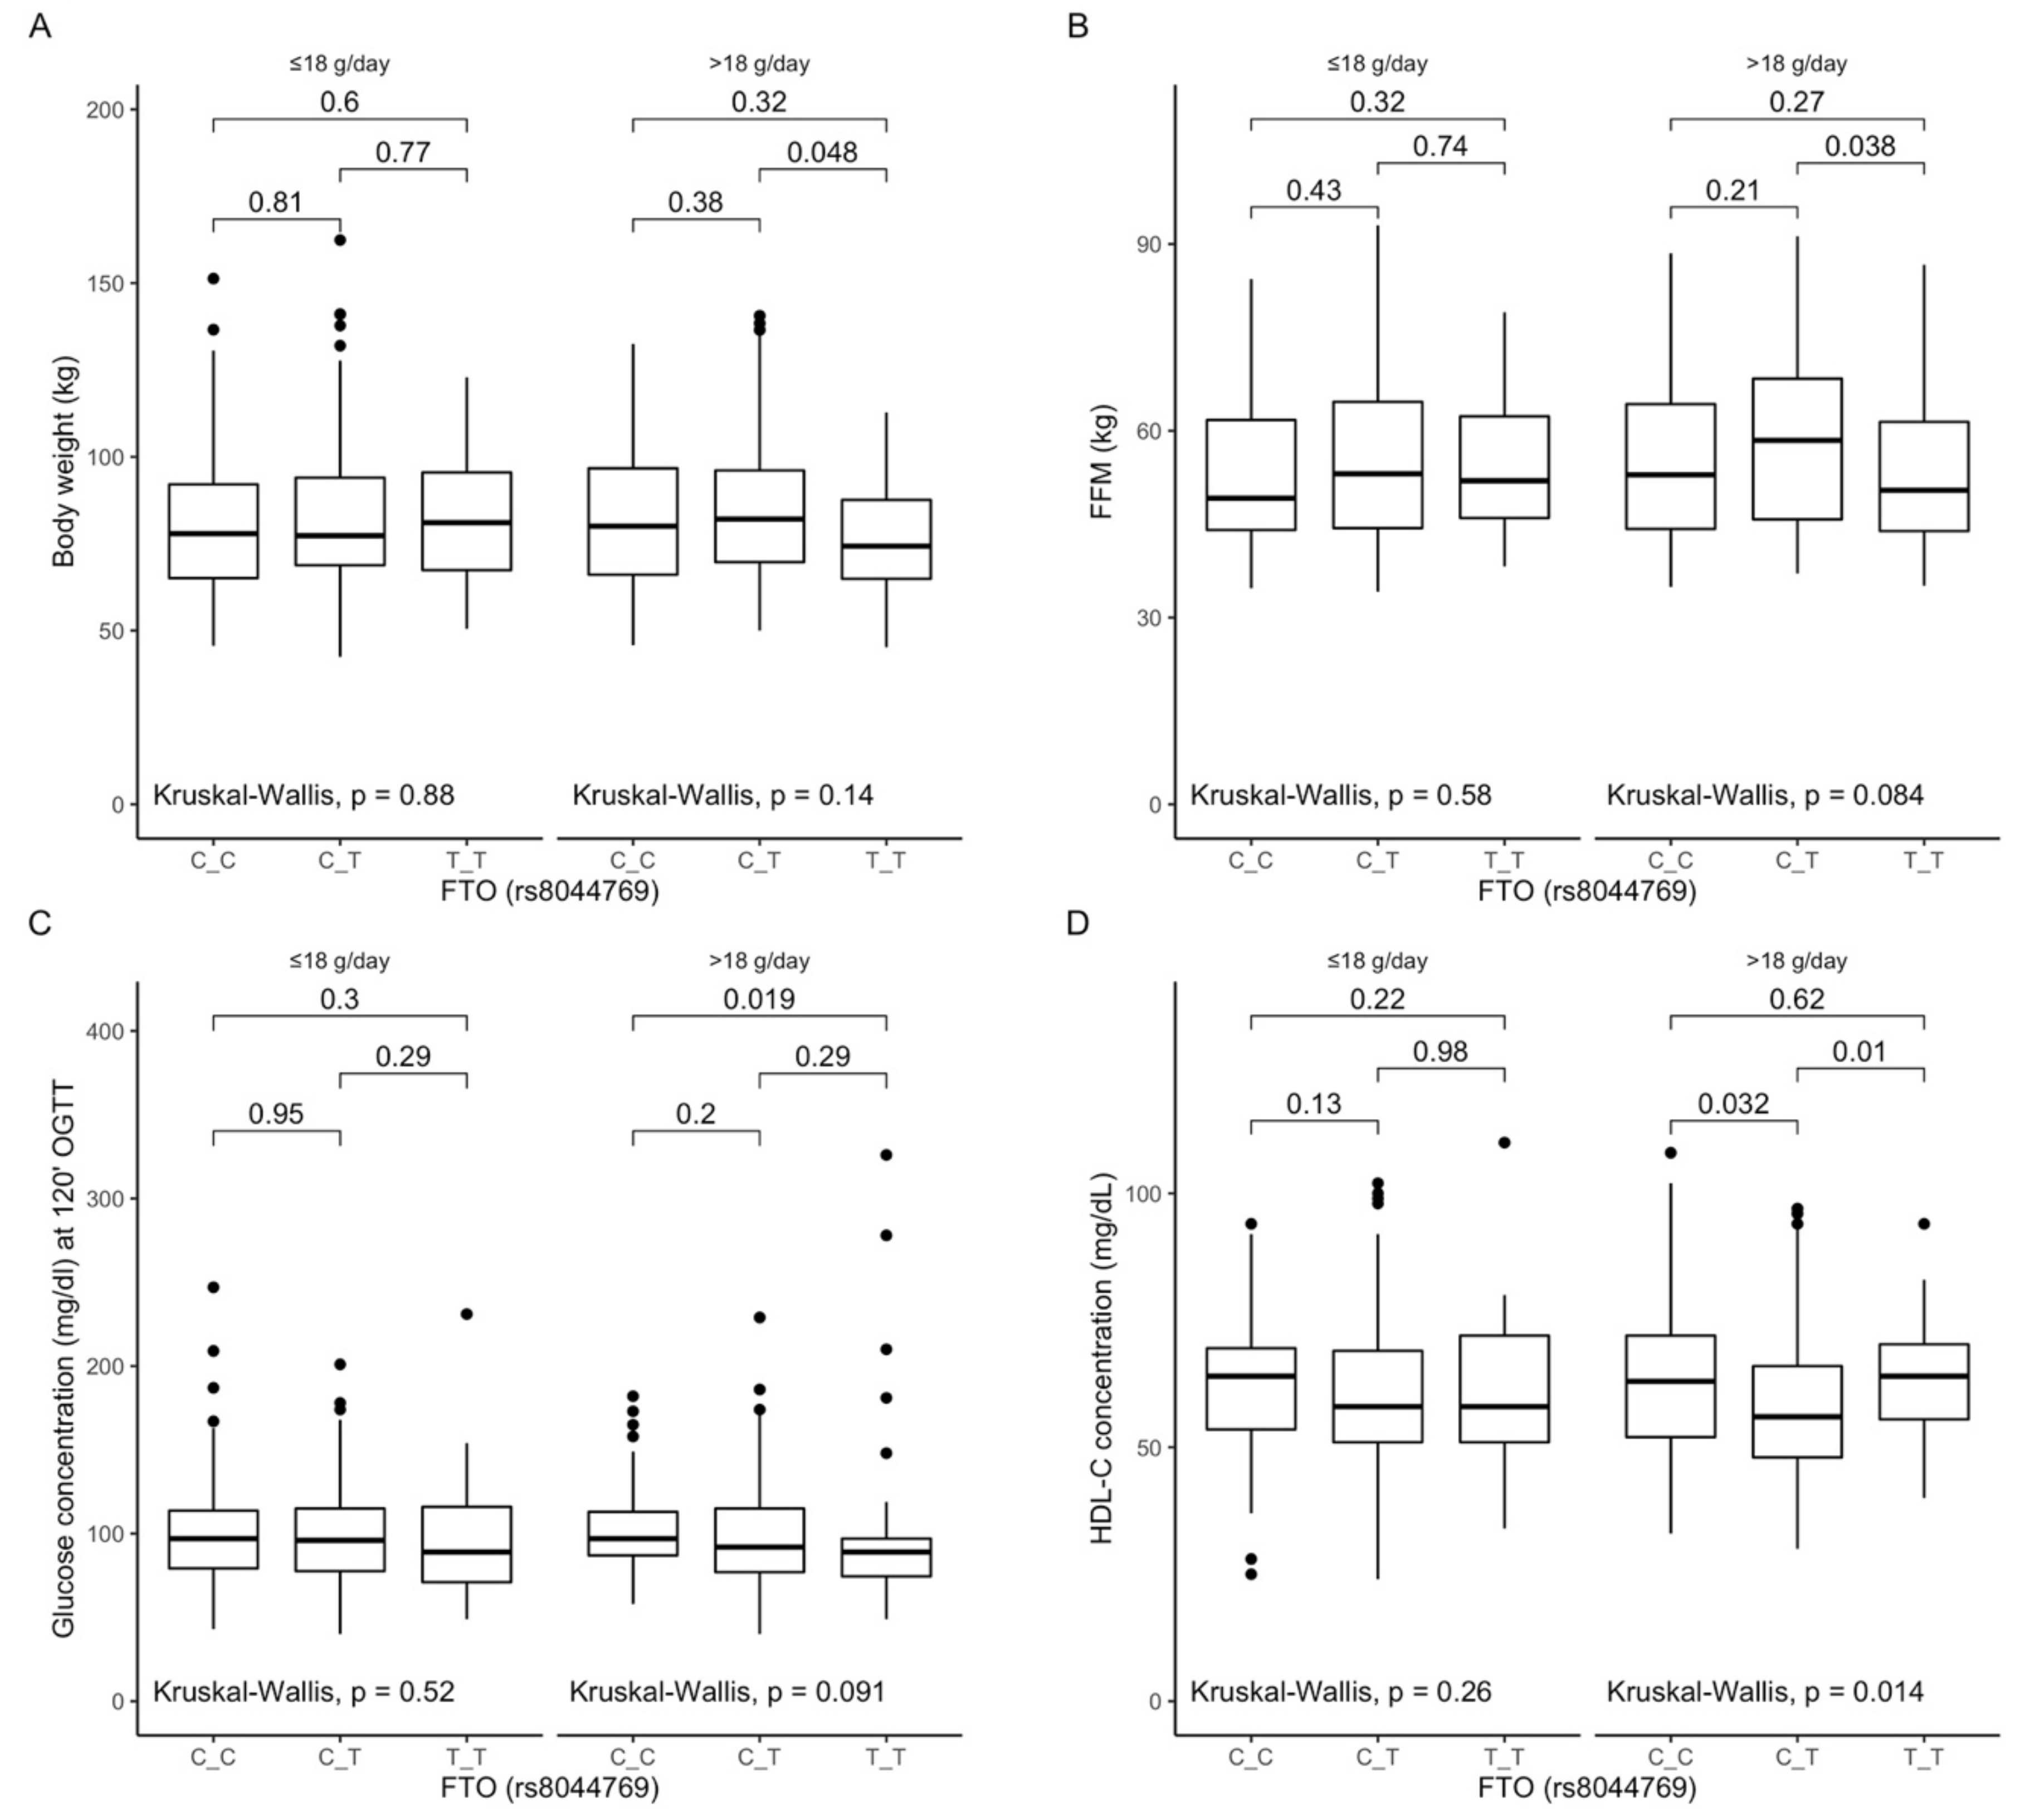
3.6. Associations between rs8044769 Polymorphism, Anthropometric Measurements, Lipid Profile, and Dietary Fiber Intake

Based on the analysis of the interactions between rs8044769 genotypes and fiber intake, we observed that TT genotype carriers, when they were stratified to higher than median fiber intake, presented lower body weight (Figure 4A) and lower fat-free mass content (Figure 4B). Moreover, we noted lower blood glucose levels at 120 min of OGTT in TT genotype carriers (Figure 4C), and lower HDL-cholesterol levels in CT genotype carriers were observed (Figure 4D) when they were stratified to the group with higher than median fiber intake.
Figure 4. Association of the FTO rs8044769 genotypes with (A) Body weight (kg); (B) Fat-free mass content (FFM) (kg); (C) Glucose concentration (mg/dL) at 120 min of OGTT; (D) HDL-C concentration (mg/dL) by dietary fiber intake strata: ≤18 g/day and >18 g/day.
Antioxidants 10 01793 g004

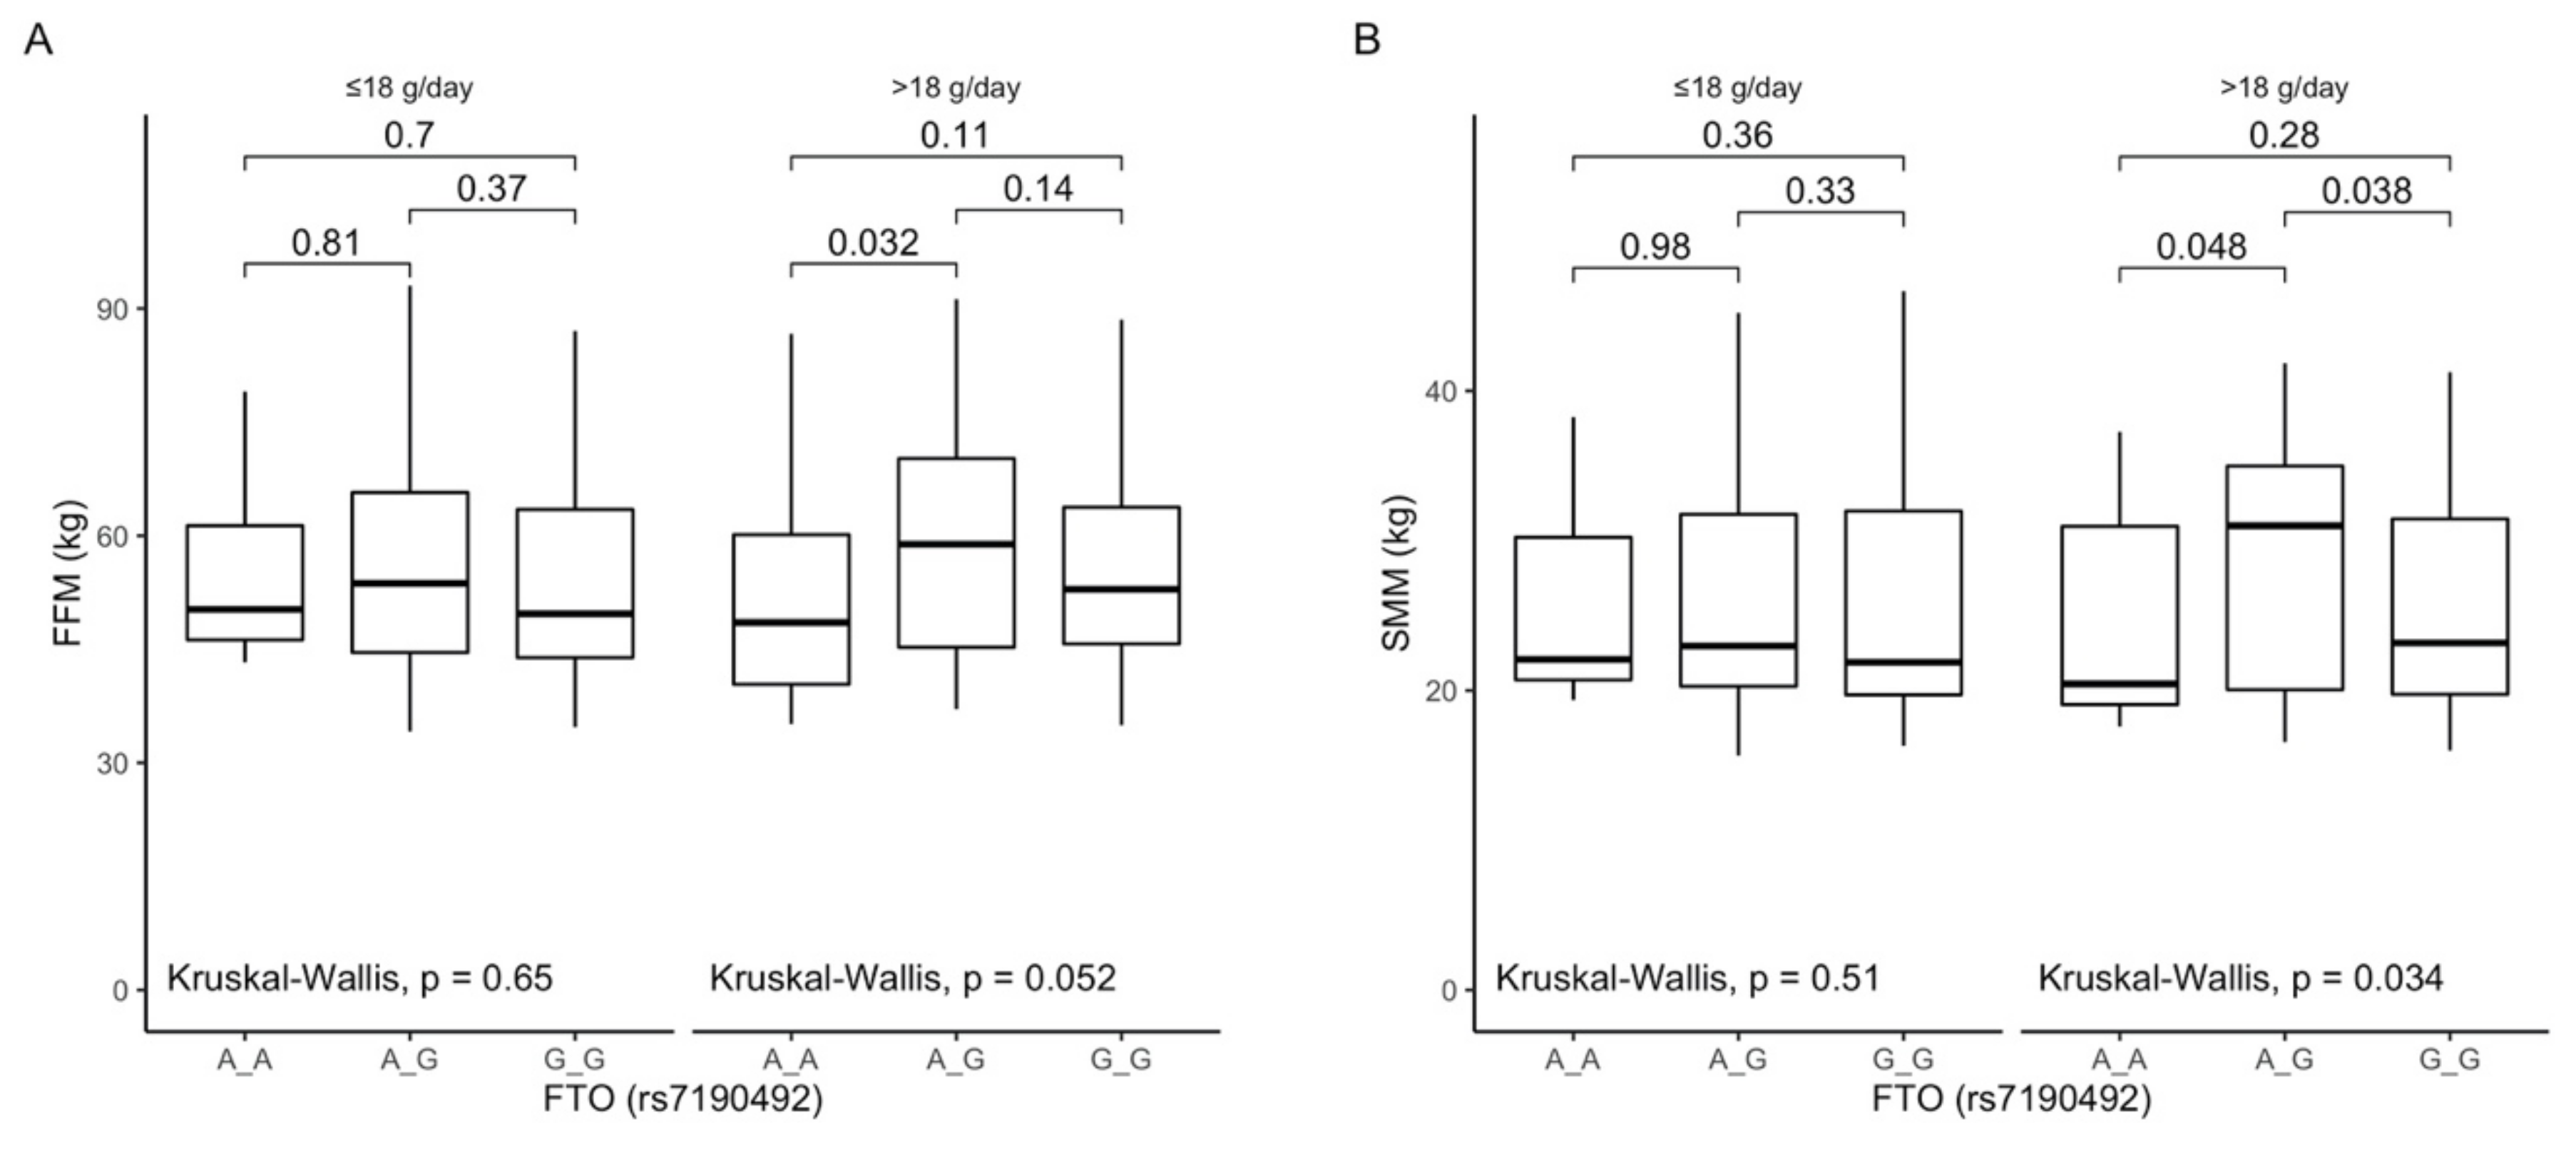
3.7. Associations between rs7190492 Polymorphism, Anthropometric Measurements, Lipid Profile, and Dietary Fiber Intake

The analysis of differences between rs7190492 genotypes dependent on dietary fiber intake showed that carriers of the AG genotype stratified to the group with higher than median fiber intake presented higher fat-free mass content (Figure 5A) and higher skeletal muscle mass content (Figure 5B). We did not observe any other differences that were dependent on dietary fiber intake.
Figure 5. Association of the FTO rs7190492 genotypes with (A) Fat-free mass content (FFM) (kg); (B) Skeletal muscle mass content (SMM) (kg) by dietary fiber intake strata: ≤18 g/day and >18 g/day.
Antioxidants 10 01793 g005

4. Discussion

The role of dietary habits in the prevalence and pathogenesis of obesity is significant. Comprehension of the interactions between genetic variations and dietary intake could be a solution for this dilemma. In our study, we present the association of total diet fiber intake with body composition and the subject’s glycemic and lipid profile status among Polish-origin Caucasian participants. The present study reveals that dietary fiber intake may modify the association of the FTO SNPs, rs3751812, rs8050136, rs9939609, rs6499640, rs8044769, and rs7190492, especially among those who consume high levels of dietary fiber. Our study demonstrated that associations of the FTO SNPs with hip circumference, visceral adipose tissue distribution, total cholesterol and LDL levels, and corrected insulin response levels may be dependent on daily fiber intake. In our previous study, we observed an interplay between FTO genetic variants and daily macronutrient intake (carbohydrates, proteins, and fat) with impact on obesity and its metabolic consequences [7]. Nevertheless, the associations between FTO genetic variants, dietary fiber intake, and metabolic consequences are still under investigation. Given the high prevalence of obesity in nearly all parts of Europe, and the fact that during the last four decades, the percentage of obese people substantially increased [18,19], our findings presented in this study seem to be significant for public health.
Dietary fiber is defined as a carbohydrate polymer; it is not hydrolyzed by human enzymes and is therefore not digested or absorbed from the digestive tract. Dietary fibers include soluble and insoluble fibers, and are classified based on their solubility in hot water, water holding capacity, and viscosity [20]. It is widely known that high dietary fiber intake, depending on the dietary fiber consumed, has several protective effects against chronic diseases, including diabetes, obesity, metabolic syndrome, inflammatory bowel syndrome, and cardiovascular disease [21,22,23,24]. The specific role of dietary fiber in the bioaccessibility and bioavailability of natural antioxidants derived mainly from fruits and vegetables is still widely discussed. It was shown that dietary fiber can reduce the accessibility of macronutrients, especially fat, in the human diet [25,26,27]. Moreover, dietary fiber is considered as a part of the diet that can interact with antioxidants, including polyphenol compounds. Above interaction with fiber and food components, there could be an effect of prolonged gastric emptying time and retarded absorption of nutrients in the small intestine [8].
We observed significant associations of FTO rs3751812 and rs8050136 according to the clinical characteristics of the studied group. Based on the anthropometric data, we noted that homozygous GG genotype carriers of rs3751812 and CC genotype carriers of rs8050136 showed significantly lower only in hip circumference. Our observations are consistent with the current state of knowledge, based on the associations of FTO SNPs and markers of obesity. It has been shown that the CC genotype carriers (rs8050136) present significantly lower BMI, total body fat content, and waist and hip circumferences [28,29,30]. In this case, the CC genotype carriers (rs8050136) have been shown to play a protective role, which confirms our results. Scuteri et al. [31] showed that rs3751812 was not associated with BMI and hip circumference in the population of African Americans when compared to the Hispanic and European Americans of the GenNetstudy. However, this association may be misleading due to lower minor allele frequencies or smaller effect sizes of variants in the conducted study. The fact that the effect of dietary fiber intake on the association of genotype may differ by race or ethnicity should not be ignored. For example, Villegas et al. [32] found that, in non-Hispanic whites, dietary fiber modified the association between FTO rs8050136 and diabetes, whereas no significant interaction was observed among non-Hispanic black participants. Taking the fact that FTO rs3751812 risk allele T is related to increased BMI compared to the protective allele G [33], the results that we obtained during our study seem to be appropriate. Currently, numerous studies have shown an association of FTO SNPs with anthropometric measurements; nevertheless, the impact of the dietary fiber intake between genotypes is still unclear.
In our study, we did not notice any crucial differences in daily dietary fiber intake between studied genotypes. However, when we stratified the study group dependent on daily fiber intake, we observed that GG genotype (rs3751812), CC genotype (rs8050136), and GG genotype (rs6499640) subjects presented lower hip circumference if daily fiber intake was higher than 18 g a day. These results are consistent with Hosseini-Esfahani et al. [34], who observed the relationship between abdominal obesity, fiber, and FTO rs3751812. The findings of Hosseini-Esfahani et al. suggest that individuals with a high number of risk alleles may benefit more from a higher daily dietary fiber intake versus individuals with a low number of risk alleles.
It has been noted that the FTO effect on obesity and other comorbidities may be modulated by a healthy dietary pattern. The traditional Mediterranean diet pattern, which may protect against type 2 diabetes [35], is low in saturated fat and includes foods rich in fiber, including vegetables, fruits, legumes, and nuts, which showed interactions with FTO rs9939609 [36].
Our study also showed an unexpected observation: that higher fiber intake can have a negative impact on lipid profile. However, soluble fibers have been shown to lower blood cholesterol by several mechanisms [10,37], and we observed that GG genotype (rs3751812) and CC genotype (rs8050136) subjects presented higher levels of total cholesterol and LDL-cholesterol when they were stratified to the high fiber intake quantiles. Moreover, in the same study conditions, but in the low fiber intake quantiles, we noted lower corrected insulin response levels at 120 min of OGTT in the GG genotype (rs3751812) and CC genotype (rs8050136) carriers. These observations might be associated with a source of dietary fiber and its interaction with food components, which we have not analyzed in our study. It is widely known that the source of dietary fiber has an impact on health outcomes [38]. Insoluble fibers present low or no effect on gastric emptying, macronutrient absorption, postprandial glucose responses, or blood lipid levels [39]. In contrast, consumption of soluble fibers influence serum lipids and postprandial glucose responses [40]. Freeland et al. [41] observed that higher consumption of wheat fiber intake results in increased short-chain fatty acid (SCFA) production and glucagon-like peptide-1 (GLP-1) secretion. Since GLP-1 may increase insulin sensitivity and secretion, these effects took over nine months to develop under colonic adaptation to increased wheat fiber intake.
Newly published studies showed that diets might modify the effect of the FTO variant on obesity, but these data are conflicting and are limited by a small sample size [42,43]. Some of the intervention studies searching for body fat distribution changes focused on diets with reduced fat or carbohydrates and increased fiber but did not find significant influence of FTO polymorphisms (rs8050136 and rs9939609) [44,45]. In our study, in the participants stratified to the higher daily dietary fiber intake, we found that TT genotype (rs3751812), AA genotype (rs8050136), and AG genotype (rs6499640) subjects presented lower visceral fat distribution (VAT). These results are consistent with studies focused on fiber consumption in healthy adolescent groups [46] or groups with obesity [47], but without the gene–diet analysis impact. We found no more main effects of the FTO variant on body composition during the intervention. As far as we know, there are limited studies on VAT distribution and FTO analysis, taking into consideration fiber intake. Therefore, our analysis presented in this study seems to be significant for public health awareness.
The present study has several strengths. To the best of our knowledge, this is one of the first studies to present associations between FTO SNPs rs3751812, rs8050136, rs9939609, rs6499640, rs7190492 and rs8044769, daily fiber intake and obesity, and glucose homeostasis and lipid profile. Moreover, our study has a relatively large sample size with excluded confounders. Another strength of our study is that we did not observe any significant differences in fiber intake between studied genotypes. This can be interpreted as a strength of our study because we can exclude the possibility of interactions between fiber and gene expression, and contribute it to consistency in gene–diet interactions. However, our study has several limitations. Our research is partially based on self-reported data, such as 3-day diaries of food intake, therefore, measurement error due to underreported or misreported data by subjects cannot be completely excluded. Nevertheless, this method is commonly being used for large-scale population investigations thus far. The other limitation is the fact that we analyzed total daily fiber intake without considering fiber source. Finally, although we obtained only Polish Caucasian individuals for our study, the data should be reflected on other populations of different ethnic groups. We included 18–79-year-old volunteers, with a mean age of around 42 years old. We did not perform analyses with an age stratification due to too small of a study group; nevertheless, it is an important factor, since most of the investigated metabolic disturbances are strongly associated with aging. Including only elderly individuals might show more significant associations, which should be considered in future analyses.

5. Conclusions

In summary, we found that dietary fiber intake might modify the effect of FTO SNPs on body composition and lipid profile. Our study indicates that daily fiber intake above 18 g per day by carriers of the GG genotype (rs3751812), CC genotype (rs8050136), and GG genotype (rs6499640) may positively affect anthropometric parameters, decreasing hip circumference, but increasing total cholesterol and LDL levels. Advances in this field bring us closer to the development of genome-customized diet recommendations to prevent obesity and its metabolic complications. Further studies are needed to verify our findings and to achieve an efficient strategy to prevent obesity development and metabolic diseases.

Author Contributions

Conceptualization, E.A.-P., M.G. and A.K.; methodology, E.A.-P., M.G. and A.K.; formal analysis, W.B.; investigation, E.A.-P., P.C., W.B., J.F., U.K. and M.M.; writing—original draft preparation, P.C. and E.A.-P.; writing—review and editing, E.A.-P., M.G. and A.K.; visualization, W.B.; supervision, M.G. and A.K.; project administration, E.A.-P.; funding acquisition, E.A.-P., M.G. and A.K. All authors have read and agreed to the published version of the manuscript.

Funding

This study was funded by the Polish Ministry of Science and Higher Education (4774/B/P01/2009/37) and by the Medical University of Bialystok. P.C. was granted POWR.03.02.00-00-I051/16 from European Union funds, and PO WER 2014–2020, grant number 03/IMSD/G/2019.

Institutional Review Board Statement

The study procedures were carried out in accordance with the ethical standards for human experimentation and with the guidelines laid down in the Helsinki Declaration of 1975, revised in 1983. The study protocol was approved by the local Ethics Committee of the Medical University of Bialystok, Poland (R-I-002/35/2009).

Informed Consent Statement

Informed consent was obtained from all the subjects involved in the study.

Data Availability Statement

The datasets used and/or analyzed during the current study are available from the corresponding author upon reasonable request.

Acknowledgments

We thank the staff of the Medical University of Bialystok, Poland, for their contributions and help with data collection and laboratory analysis.

Conflicts of Interest

The authors declare no conflict of interest. The funders had no role in the design of the study; in the collection, analysis, or interpretation of data; in the writing of the manuscript, or in the decision to publish the results.

References

  1. Jaacks, L.M.; Vandevijvere, S.; Pan, A.; McGowan, C.J.; Wallace, C.; Imamura, F.; Mozaffarian, D.; Swinburn, B.; Ezzati, M. The obesity transition: Stages of the global epidemic. Lancet Diabetes Endocrinol. 2019, 7, 231–240. [Google Scholar] [CrossRef]
  2. Loh, M.; Zhou, L.; Ng, H.K.; Chambers, J.C. Epigenetic disturbances in obesity and diabetes: Epidemiological and functional insights. Mol. Metab. 2019, 27, S33–S41. [Google Scholar] [CrossRef]
  3. Dal Canto, E.; Ceriello, A.; Ryden, L.; Ferrini, M.; Hansen, T.B.; Schnell, O.; Standl, E.; Beulens, J.W. Diabetes as a cardiovascular risk factor: An overview of global trends of macro and micro vascular complications. Eur. J. Prev. Cardiol. 2019, 26, 25–32. [Google Scholar] [CrossRef] [PubMed] [Green Version]
  4. Xu, Z.R.; Zhang, M.Y.; Ni, J.W.; Cheng, R.Q.; Zheng, Z.Q.; Xi, L.; Luo, F.H. Clinical characteristics and beta-cell function of Chinese children and adolescents with type 2 diabetes from 2009 to 2018. World J. Pediatr. 2019, 15, 405–411. [Google Scholar] [CrossRef]
  5. Tan, L.J.; Zhu, H.; He, H.; Wu, K.H.; Li, J.; Chen, X.D.; Zhang, J.G.; Shen, H.; Tian, Q.; Krousel-Wood, M.; et al. Replication of 6 obesity genes in a meta-analysis of genome-wide association studies from diverse ancestries. PLoS ONE 2014, 9, e96149. [Google Scholar] [CrossRef] [PubMed] [Green Version]
  6. Steemburgo, T.; Azevedo, M.J.; Gross, J.L.; Milagro, F.I.; Campion, J.; Martinez, J.A. The rs9939609 polymorphism in the FTO gene is associated with fat and fiber intakes in patients with type 2 diabetes. J. Nutr. Nutr. 2013, 6, 97–106. [Google Scholar] [CrossRef]
  7. Czajkowski, P.; Adamska-Patruno, E.; Bauer, W.; Fiedorczuk, J.; Krasowska, U.; Moroz, M.; Gorska, M.; Kretowski, A. The Impact of FTO Genetic Variants on Obesity and Its Metabolic Consequences is Dependent on Daily Macronutrient Intake. Nutrients 2020, 12, 3255. [Google Scholar] [CrossRef] [PubMed]
  8. Palafox-Carlos, H.; Ayala-Zavala, J.F.; Gonzalez-Aguilar, G.A. The role of dietary fiber in the bioaccessibility and bioavailability of fruit and vegetable antioxidants. J. Food Sci. 2011, 76, R6–R15. [Google Scholar] [CrossRef] [Green Version]
  9. Jenkins, D.J.; Jenkins, A.L. Dietary fiber and the glycemic response. Proc. Soc. Exp. Biol. Med. 1985, 180, 422–431. [Google Scholar] [CrossRef]
  10. Brown, L.; Rosner, B.; Willett, W.W.; Sacks, F.M. Cholesterol-lowering effects of dietary fiber: A meta-analysis. Am. J. Clin. Nutr. 1999, 69, 30–42. [Google Scholar] [CrossRef]
  11. Adamska-Patruno, E.; Goscik, J.; Czajkowski, P.; Maliszewska, K.; Ciborowski, M.; Golonko, A.; Wawrusiewicz-Kurylonek, N.; Citko, A.; Waszczeniuk, M.; Kretowski, A.; et al. The MC4R genetic variants are associated with lower visceral fat accumulation and higher postprandial relative increase in carbohydrate utilization in humans. Eur. J. Nutr. 2019, 58, 2929–2941. [Google Scholar] [CrossRef] [PubMed] [Green Version]
  12. Kretowski, A.; Adamska, E.; Maliszewska, K.; Wawrusiewicz-Kurylonek, N.; Citko, A.; Goscik, J.; Bauer, W.; Wilk, J.; Golonko, A.; Waszczeniuk, M.; et al. The rs340874 PROX1 type 2 diabetes mellitus risk variant is associated with visceral fat accumulation and alterations in postprandial glucose and lipid metabolism. Genes Nutr. 2015, 10, 4. [Google Scholar] [CrossRef] [Green Version]
  13. Maliszewska, K.; Adamska-Patruno, E.; Goscik, J.; Lipinska, D.; Citko, A.; Krahel, A.; Miniewska, K.; Fiedorczuk, J.; Moroz, M.; Gorska, M.; et al. The Role of Muscle Decline in Type 2 Diabetes Development: A 5-Year Prospective Observational Cohort Study. Nutrients 2019, 11, 834. [Google Scholar] [CrossRef] [PubMed] [Green Version]
  14. Nagy, E.; Vicente-Rodriguez, G.; Manios, Y.; Beghin, L.; Iliescu, C.; Censi, L.; Dietrich, S.; Ortega, F.B.; De Vriendt, T.; Plada, M.; et al. Harmonization process and reliability assessment of anthropometric measurements in a multicenter study in adolescents. Int. J. Obes. 2008, 32, S58–S65. [Google Scholar] [CrossRef] [Green Version]
  15. Hagstromer, M.; Oja, P.; Sjostrom, M. The International Physical Activity Questionnaire (IPAQ): A study of concurrent and construct validity. Public Health Nutr. 2006, 9, 755–762. [Google Scholar] [CrossRef] [PubMed]
  16. MacArthur, J.; Bowler, E.; Cerezo, M.; Gil, L.; Hall, P.; Hastings, E.; Junkins, H.; McMahon, A.; Milano, A.; Morales, J.; et al. The new NHGRI-EBI Catalog of published genome-wide association studies (GWAS Catalog). Nucleic Acids Res. 2017, 45, D896–D901. [Google Scholar] [CrossRef]
  17. Peng, S.; Zhu, Y.; Xu, F.; Ren, X.; Li, X.; Lai, M. FTO gene polymorphisms and obesity risk: A meta-analysis. BMC Med. 2011, 9, 71. [Google Scholar] [CrossRef] [Green Version]
  18. Kontis, V.; Bennett, J.E.; Mathers, C.D.; Li, G.; Foreman, K.; Ezzati, M. Future life expectancy in 35 industrialised countries: Projections with a Bayesian model ensemble. Lancet 2017, 389, 1323–1335. [Google Scholar] [CrossRef] [Green Version]
  19. World Health Organization. Obesity: Preventing and managing the global epidemic. Report of a WHO consultation. World Health Organ. Tech. Rep. Ser. 2000, 894, 1–253. [Google Scholar]
  20. Eastwood, M.A.; Kay, R.M. An hypothesis for the action of dietary fiber along the gastrointestinal tract. Am. J. Clin. Nutr. 1979, 32, 364–367. [Google Scholar] [CrossRef] [Green Version]
  21. Adams, S.; Che, D.; Qin, G.; Rui, H.; Sello, C.T.; Hailong, J. Interactions of Dietary Fibre with Nutritional Components on Gut Microbial Composition, Function and Health in Monogastrics. Curr. Protein Pept. Sci. 2018, 19, 1011–1023. [Google Scholar] [CrossRef] [PubMed]
  22. Cicero, A.F.; Colletti, A. Role of phytochemicals in the management of metabolic syndrome. Phytomedicine 2016, 23, 1134–1144. [Google Scholar] [CrossRef] [PubMed]
  23. Crowe, F.L.; Balkwill, A.; Cairns, B.J.; Appleby, P.N.; Green, J.; Reeves, G.K.; Key, T.J.; Beral, V.; Million Women Study, C.; Million Women Study, C. Source of dietary fibre and diverticular disease incidence: A prospective study of UK women. Gut 2014, 63, 1450–1456. [Google Scholar] [CrossRef] [Green Version]
  24. Sanjoaquin, M.A.; Appleby, P.N.; Spencer, E.A.; Key, T.J. Nutrition and lifestyle in relation to bowel movement frequency: A cross-sectional study of 20630 men and women in EPIC-Oxford. Public Health Nutr. 2004, 7, 77–83. [Google Scholar] [CrossRef]
  25. Kritchevsky, D. Dietary fibre and lipid metabolism. Int. J. Obes. 1987, 11, 33–43. [Google Scholar]
  26. Lattimer, J.M.; Haub, M.D. Effects of dietary fiber and its components on metabolic health. Nutrients 2010, 2, 1266–1289. [Google Scholar] [CrossRef] [PubMed] [Green Version]
  27. Bordoni, L.; Petracci, I.; Zhao, F.; Min, W.; Pierella, E.; Assmann, T.S.; Martinez, J.A.; Gabbianelli, R. Nutrigenomics of Dietary Lipids. Antioxidants 2021, 10, 994. [Google Scholar] [CrossRef]
  28. Graff, M.; Gordon-Larsen, P.; Lim, U.; Fowke, J.H.; Love, S.A.; Fesinmeyer, M.; Wilkens, L.R.; Vertilus, S.; Ritchie, M.D.; Prentice, R.L.; et al. The influence of obesity-related single nucleotide polymorphisms on BMI across the life course: The PAGE study. Diabetes 2013, 62, 1763–1767. [Google Scholar] [CrossRef] [PubMed] [Green Version]
  29. Chauhan, G.; Tabassum, R.; Mahajan, A.; Dwivedi, O.P.; Mahendran, Y.; Kaur, I.; Nigam, S.; Dubey, H.; Varma, B.; Madhu, S.V.; et al. Common variants of FTO and the risk of obesity and type 2 diabetes in Indians. J. Hum. Genet. 2011, 56, 720–726. [Google Scholar] [CrossRef] [PubMed] [Green Version]
  30. Wu, J.; Xu, J.; Zhang, Z.; Ren, J.; Li, Y.; Wang, J.; Cao, Y.; Rong, F.; Zhao, R.; Huang, X.; et al. Association of FTO polymorphisms with obesity and metabolic parameters in Han Chinese adolescents. PLoS ONE 2014, 9, e98984. [Google Scholar] [CrossRef]
  31. Scuteri, A.; Sanna, S.; Chen, W.M.; Uda, M.; Albai, G.; Strait, J.; Najjar, S.; Nagaraja, R.; Orru, M.; Usala, G.; et al. Genome-wide association scan shows genetic variants in the FTO gene are associated with obesity-related traits. PLoS Genet. 2007, 3, e115. [Google Scholar] [CrossRef]
  32. Villegas, R.; Goodloe, R.J.; McClellan, B.E., Jr.; Boston, J.; Crawford, D.C. Gene-carbohydrate and gene-fiber interactions and type 2 diabetes in diverse populations from the National Health and Nutrition Examination Surveys (NHANES) as part of the Epidemiologic Architecture for Genes Linked to Environment (EAGLE) study. BMC Genet. 2014, 15, 69. [Google Scholar] [CrossRef] [Green Version]
  33. Wing, M.R.; Ziegler, J.; Langefeld, C.D.; Ng, M.C.; Haffner, S.M.; Norris, J.M.; Goodarzi, M.O.; Bowden, D.W. Analysis of FTO gene variants with measures of obesity and glucose homeostasis in the IRAS Family Study. Hum. Genet. 2009, 125, 615–626. [Google Scholar] [CrossRef] [PubMed] [Green Version]
  34. Hosseini-Esfahani, F.; Koochakpoor, G.; Daneshpour, M.S.; Mirmiran, P.; Sedaghati-Khayat, B.; Azizi, F. The interaction of fat mass and obesity associated gene polymorphisms and dietary fiber intake in relation to obesity phenotypes. Sci. Rep. 2017, 7, 18057. [Google Scholar] [CrossRef] [PubMed]
  35. Salas-Salvado, J.; Bullo, M.; Babio, N.; Martinez-Gonzalez, M.A.; Ibarrola-Jurado, N.; Basora, J.; Estruch, R.; Covas, M.I.; Corella, D.; Aros, F.; et al. Reduction in the incidence of type 2 diabetes with the Mediterranean diet: Results of the PREDIMED-Reus nutrition intervention randomized trial. Diabetes Care 2011, 34, 14–19. [Google Scholar] [CrossRef] [Green Version]
  36. Ortega-Azorin, C.; Sorli, J.V.; Asensio, E.M.; Coltell, O.; Martinez-Gonzalez, M.A.; Salas-Salvado, J.; Covas, M.I.; Aros, F.; Lapetra, J.; Serra-Majem, L.; et al. Associations of the FTO rs9939609 and the MC4R rs17782313 polymorphisms with type 2 diabetes are modulated by diet, being higher when adherence to the Mediterranean diet pattern is low. Cardiovasc. Diabetol. 2012, 11, 137. [Google Scholar] [CrossRef] [Green Version]
  37. Soliman, G.A. Dietary Fiber, Atherosclerosis, and Cardiovascular Disease. Nutrients 2019, 11, 1155. [Google Scholar] [CrossRef] [Green Version]
  38. Howarth, N.C.; Saltzman, E.; Roberts, S.B. Dietary fiber and weight regulation. Nutr. Rev. 2001, 59, 129–139. [Google Scholar] [CrossRef] [PubMed]
  39. Jenkins, D.J.; Kendall, C.W.; Axelsen, M.; Augustin, L.S.; Vuksan, V. Viscous and nonviscous fibres, nonabsorbable and low glycaemic index carbohydrates, blood lipids and coronary heart disease. Curr. Opin. Lipidol. 2000, 11, 49–56. [Google Scholar] [CrossRef] [PubMed]
  40. Weickert, M.O.; Mohlig, M.; Schofl, C.; Arafat, A.M.; Otto, B.; Viehoff, H.; Koebnick, C.; Kohl, A.; Spranger, J.; Pfeiffer, A.F. Cereal fiber improves whole-body insulin sensitivity in overweight and obese women. Diabetes Care 2006, 29, 775–780. [Google Scholar] [CrossRef] [Green Version]
  41. Freeland, K.R.; Wilson, C.; Wolever, T.M. Adaptation of colonic fermentation and glucagon-like peptide-1 secretion with increased wheat fibre intake for 1 year in hyperinsulinaemic human subjects. Br. J. Nutr. 2010, 103, 82–90. [Google Scholar] [CrossRef] [Green Version]
  42. Sonestedt, E.; Roos, C.; Gullberg, B.; Ericson, U.; Wirfalt, E.; Orho-Melander, M. Fat and carbohydrate intake modify the association between genetic variation in the FTO genotype and obesity. Am. J. Clin. Nutr. 2009, 90, 1418–1425. [Google Scholar] [CrossRef] [Green Version]
  43. Ahmad, T.; Lee, I.M.; Pare, G.; Chasman, D.I.; Rose, L.; Ridker, P.M.; Mora, S. Lifestyle interaction with fat mass and obesity-associated (FTO) genotype and risk of obesity in apparently healthy U.S. women. Diabetes Care 2011, 34, 675–680. [Google Scholar] [CrossRef] [PubMed] [Green Version]
  44. Haupt, A.; Thamer, C.; Machann, J.; Kirchhoff, K.; Stefan, N.; Tschritter, O.; Machicao, F.; Schick, F.; Haring, H.U.; Fritsche, A. Impact of variation in the FTO gene on whole body fat distribution, ectopic fat, and weight loss. Obesity (Silver Spring) 2008, 16, 1969–1972. [Google Scholar] [CrossRef] [PubMed]
  45. Muller, T.D.; Hinney, A.; Scherag, A.; Nguyen, T.T.; Schreiner, F.; Schafer, H.; Hebebrand, J.; Roth, C.L.; Reinehr, T. “Fat mass and obesity associated” gene (FTO): No significant association of variant rs9939609 with weight loss in a lifestyle intervention and lipid metabolism markers in German obese children and adolescents. BMC Med. Genet. 2008, 9, 85. [Google Scholar] [CrossRef] [Green Version]
  46. Parikh, S.; Pollock, N.K.; Bhagatwala, J.; Guo, D.H.; Gutin, B.; Zhu, H.; Dong, Y. Adolescent fiber consumption is associated with visceral fat and inflammatory markers. J. Clin. Endocrinol. Metab. 2012, 97, E1451–E1457. [Google Scholar] [CrossRef] [PubMed] [Green Version]
  47. Davis, J.N.; Alexander, K.E.; Ventura, E.E.; Toledo-Corral, C.M.; Goran, M.I. Inverse relation between dietary fiber intake and visceral adiposity in overweight Latino youth. Am. J. Clin. Nutr. 2009, 90, 1160–1166. [Google Scholar] [CrossRef] [Green Version]
Publisher’s Note: MDPI stays neutral with regard to jurisdictional claims in published maps and institutional affiliations.

