1. Introduction
Cancer molecular subtyping (describing cancer subtypes) is important not least because of its potential relevance to choice of treatment [
1,
2]. In the case of Colon Cancer, classifications of colorectal cancers (CRC) can be subdivided into 3–6 subtypes, based on
gene expression profiles [
1,
2,
3,
4]. Alternatively, CRC has been shown to divide into several subgroups according to
methylation profiles [
5]. The aim of this study is thus to establish whether there is a correlation between gene expression-based subtypes and locus specific methylation-based subgroups. Three matched expression and methylation data sets were used, in order to investigate if correlation exists between the expression and methylation subtypes. Details on the data sets are given in the next section, while the background to recent classification efforts is described below.
Efforts to classify colon cancer types according to gene expression profiles are not new: supervised approaches have been used to derive signatures related to outcomes such as recurrence, metastasis and overall survival with moderate success [
6], while semi-supervised approaches exist to refine outcome prediction on (stage-related) subsets of patients [
7]. More recent unsupervised efforts classify CRC into inherent molecular subtypes, which can subsequently be correlated to prognosis [
1,
2]. Isella
et al. [
4] have recently assessed combined information from three concurrently published independent studies (De Sousa E. Melo
et al. [
1], Sadanandam
et al. [
2], Marisa
et al. [
3]), which describe CRC classification systems (subtyping schemes), based on gene expression. Although not the primary objective of their own work, Isella and co-authors proposed a consensus classification system, based on application of the previous classifications (CCS—3 subtypes [
1], CRC-Assigner—5 subtypes [
2] and CCMS—6 subtypes [
3], respectively) from the three studies, to the TCGA colon and rectal cancer [
8] RNA-seq data [
4]. Three groups are distinguished by this consensus combination of the 3 classifiers; these are: (i) the Goblet/Inflammatory group (combining the CCS2 subtype [
1], the Goblet-like and Inflammatory subtypes from CRCA [
2], and also C2 and C3 subtypes from the CCMS system [
3]); (ii) the TA/Enterocyte group (combining the CCS1 subtype [
1], the Transit Amplification (TA) and Enterocyte from CRCA [
2] and also C1, C5 and C6 from CCMS [
3]); and (iii) the stem/serrated/mesenchymal (SSM) group, which unites the CCS3 [
1], Stem-like subtype from CRCA [
2] and the EMT-associated [
9,
10] C4 from CCMS [
3] (see
Table 1). Locus-specific methylation has been long known to have variable profile across colorectal cancers, and methylation-based groups have also been identified. CIMP-status [
11] detection, determined on the basis of the locus-specific methylation of (several small available panels of genes (<10 typically)) permits several methylation profiles to be distinguished [
12,
13]. Unsupervised clustering methylation profiles, according to data on whole-genome methylation profiling, enables refinement of the CIMP-based groups: 4 methylation-based subgroups have been identified by Hinoue
et al. [
4]. While the expression-based subtypes have been correlated with CIMP-status [
1,
3], the aim here was to examine the association of expression-based subtypes with whole genome-based methylation groups. In order to do so, we mapped the expression-based subtypes of Isella
et al. [
4] onto available TCGA colon and rectal cancer methylation data. Of particular interest were the questions as to whether methylation profiles can be used to refine the definition of these three expression-based type categories, ((i)–(iii)), for example by justifying the existence of the finer grained subtypes defined in CRC-Assigner [
2] and CCMS [
3], or to deliver new composite subtypes, thus permitting a more precise classification of molecular subtypes.
Table 1.
Abbreviations used for the various expression-based subtypes as well as the rules for consensus subtype computation. Note that equivalent subtypes are similar but not equal.
Table 1.
Abbreviations used for the various expression-based subtypes as well as the rules for consensus subtype computation. Note that equivalent subtypes are similar but not equal.
| CCS [1] | CRCA [2] | CCMS [3] | Consensus [4]) | Rule for Consensus Subtype Based on CCS, CRCA and CCMS Reconciliation [4] |
|---|
| CCS2 | Goblet-like (CRCA2) | C3 (CCMS3) | Goblet/Inflammatory | At least 2 of the assessed classifiers give equivalent subtypes. |
| Inflammatory (CRCA1) | C2 (CCMS2) |
| CCS1 | TA (CRCA4) | C1 (CCMS1) | TA/Enterocyte | At least 2 of the assessed classifiers give equivalent subtypes. |
| C5 (CCMS5) |
| Enterocyte (CRCA3) | C6 (CCMS6) |
| CCS3 | Stem-like (CRCA5) | C4 (CCMS4) | SSM (stem/serrated/mesenchimal) | Is computed using the union of the signature genes for for CCS3, Stem-like and C4. |
3. Results and Discussion
The work of Marisa
et al. [
3] investigated association of the CCMS expression subtypes to CIMP status, and in order to expand this by considering expression-based subtype association with whole genome locus-specific methylation profiles, three clustered methylation data sets: TCGA-Illu27, TCGA-Illu450 and GEO-Illu27 (see
Section 2), were annotated with expression-based subtypes.
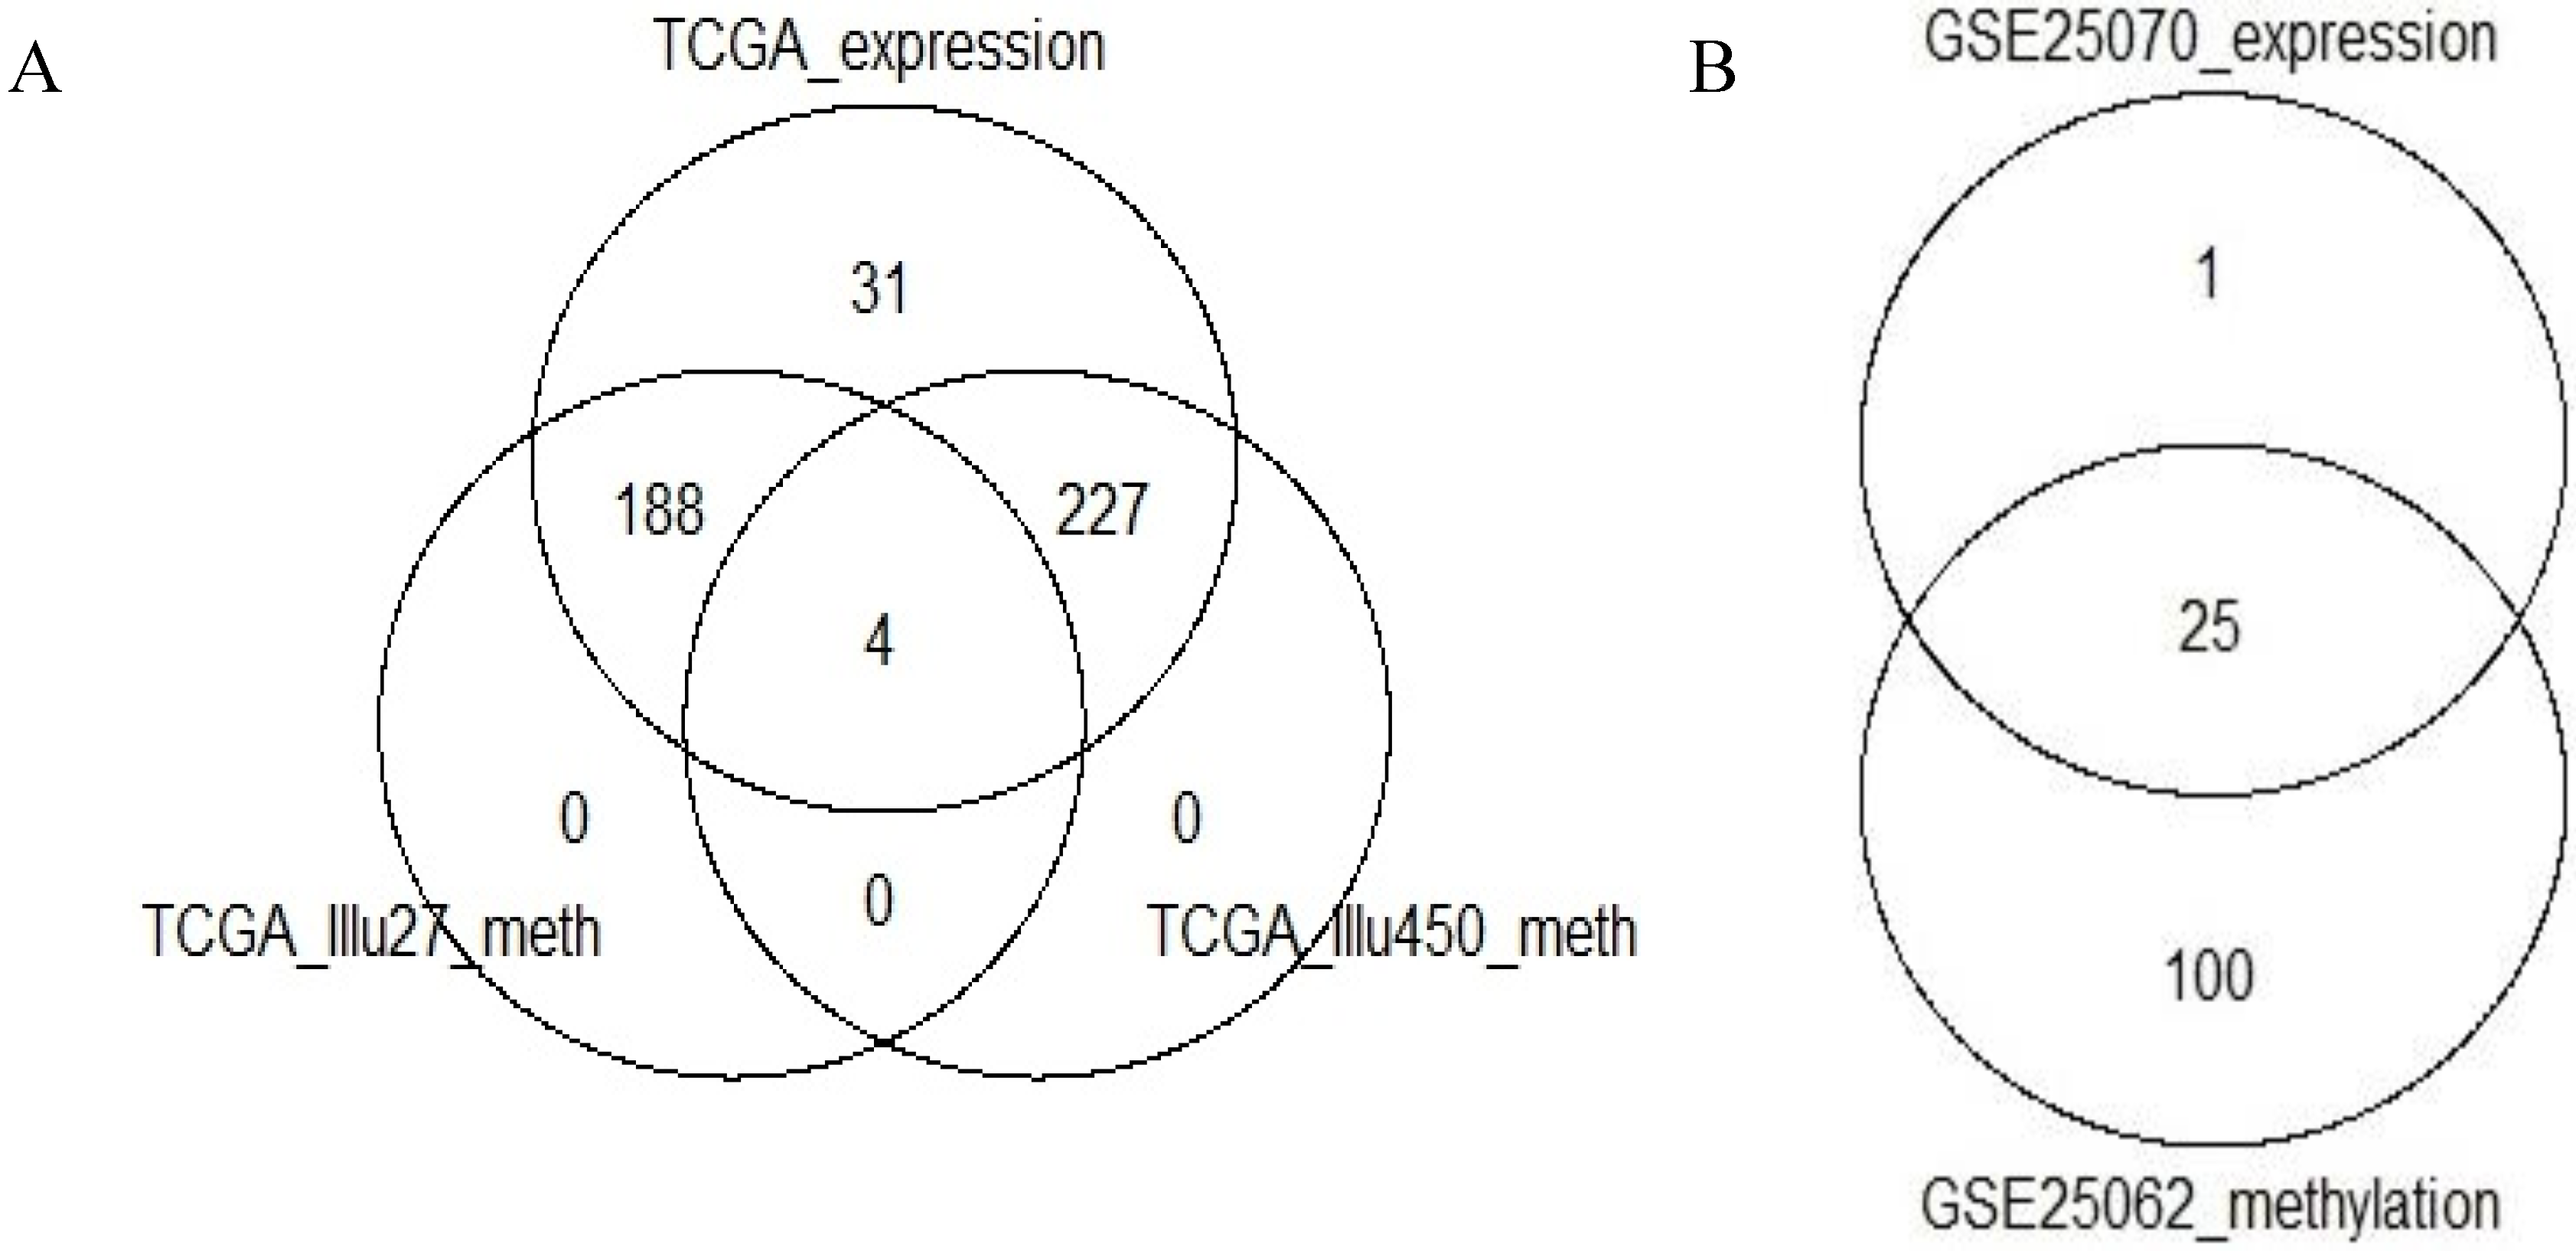
Two whole genome methylation data sets (TCGA-Illu27 and TCGA-Illu450) have been extracted from TCGA and pre-processed as described in
Section 2. No data set was initially corrected for batch effects.
Figures S1–S4 show the PCA and hierarchical clustering according to the TCGA Batch ID, Plate ID and TSS for the TCGA-Illu27 and TCGA-Illu450 data sets, respectively. For TCGA-Illu27, only one batch (29), is found distinct from the other batches. However, Cancer Genome Atlas Network argues that the differences observed for this batch are biological rather than technical, (
Supplementary Material from [
8]), not least as it consists entirely of MSI/CIMP subtype samples, (
Supplementary Material [
8]). No other batches have been found to have important effects. In addition,
Table S1 gives the Dispersion Separability Criterion (DSC) values (computed with respect to Batch ID) obtained for each complete TCGA COAD and READ data set, assessed with IlluHM27 and IlluHM450 platforms respectively. In accordance with our PCA and hierarchical clustering results, all four complete sets (COAD and READ on each of the IlluHM27 and IlluHM450 platforms respectively) have DSC < 0.5, indicating unimportant batch effects. The largest DSC has been obtained, as expected, for the COAD IlluHM27 set, which contains batch 29. Taken together, these results indicate that batch effects correction was not necessary for the TCGA-based data sets. After filtering the methylation values according to methylation value standard deviation cutoffs (see
Section 2), 2222, 2637 and 1136 probes remained in the TCGA-Illu27, TCGA-Illu450 and GEO-Illu27 data sets, respectively. The intersection between the remaining genes in the two TCGA-based data sets was of 900 genes.
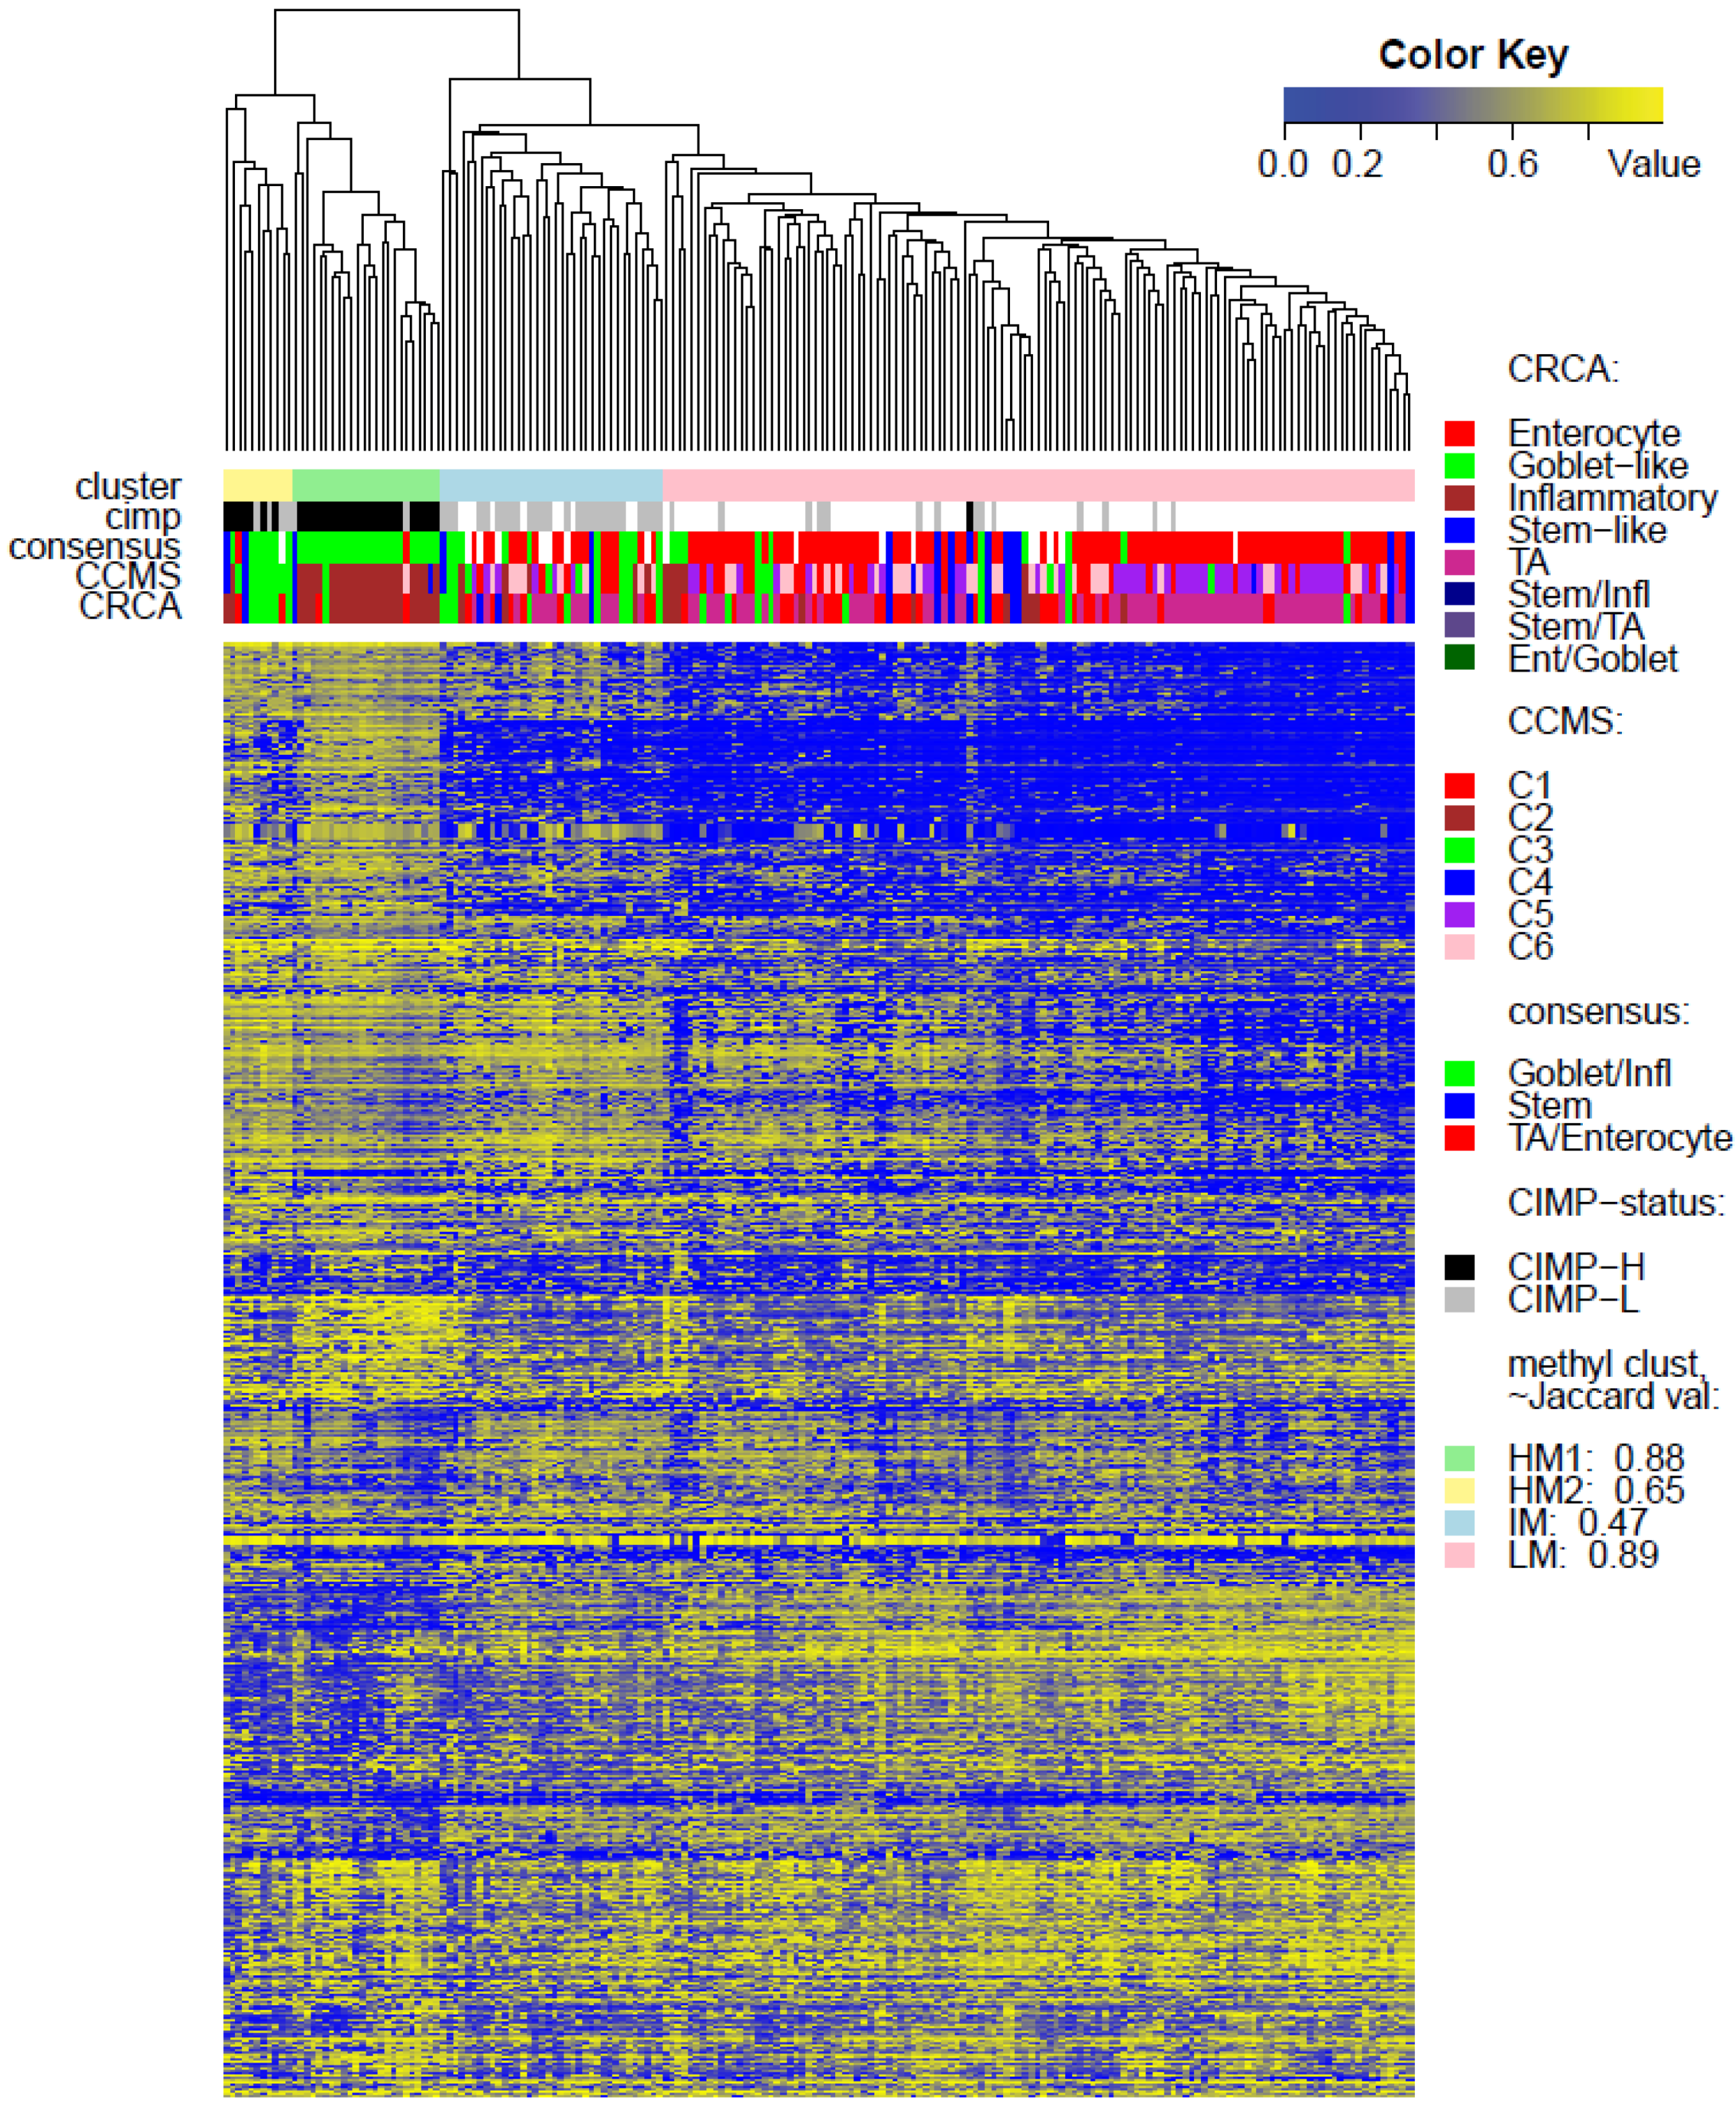
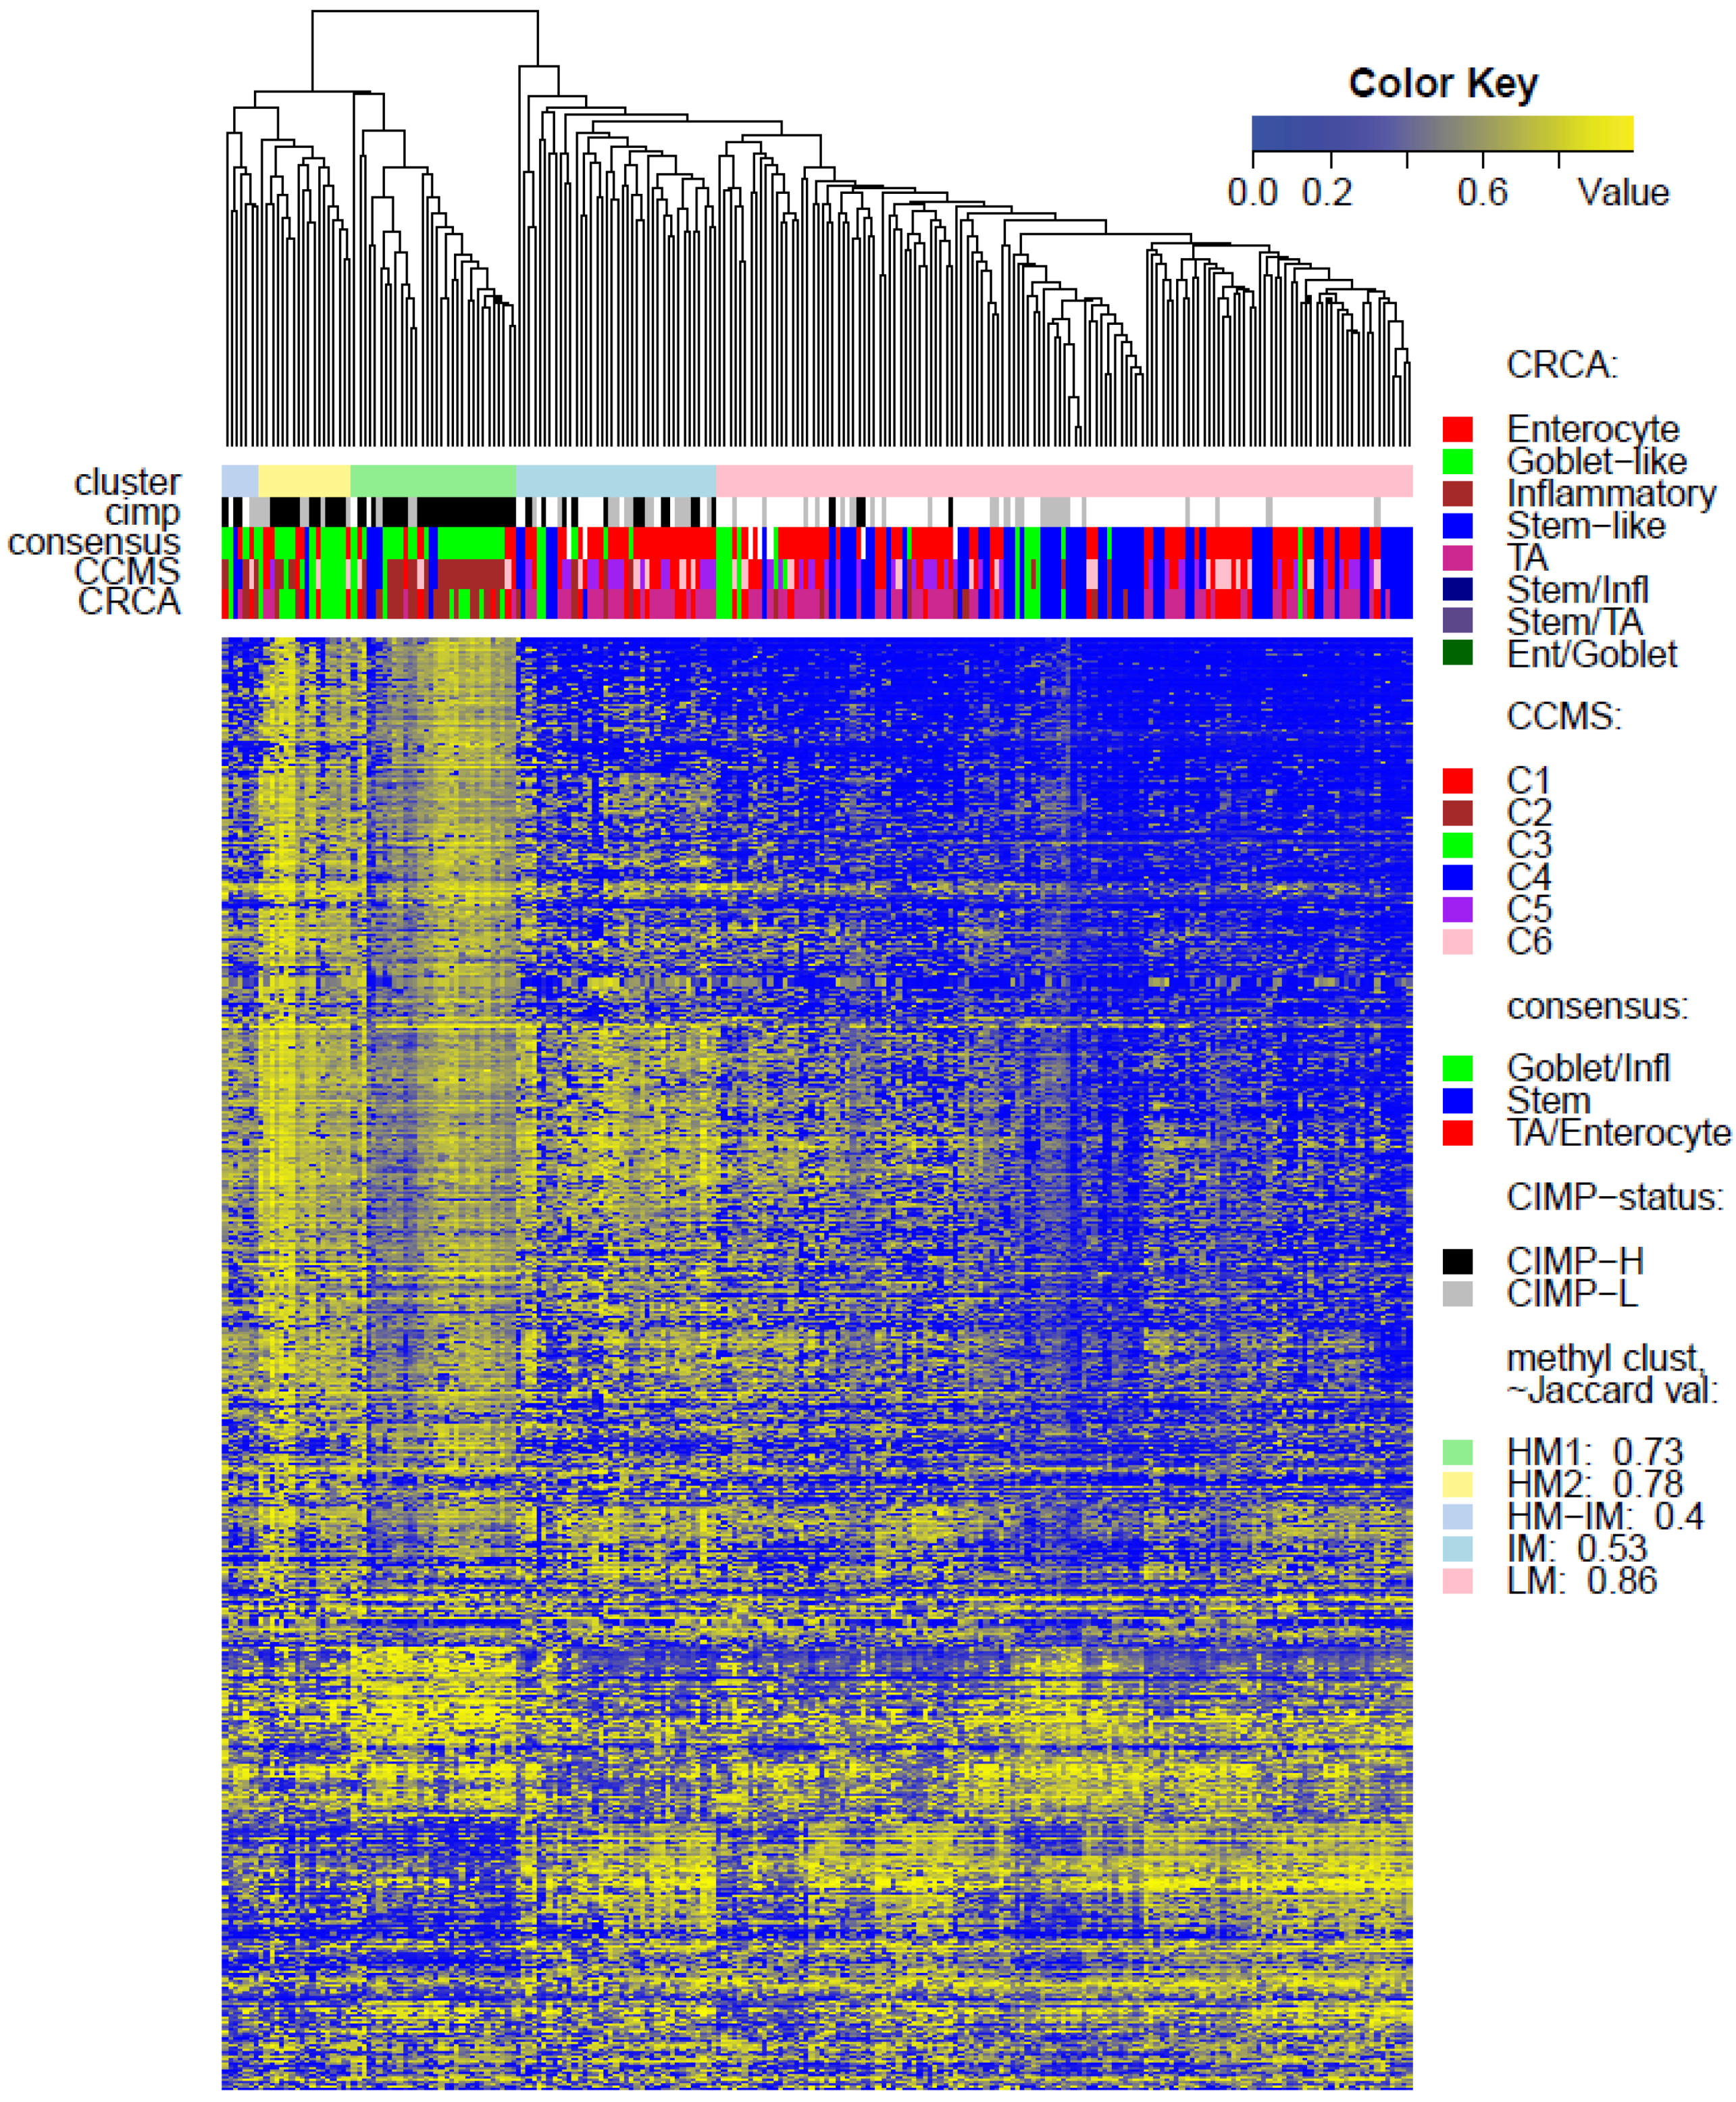
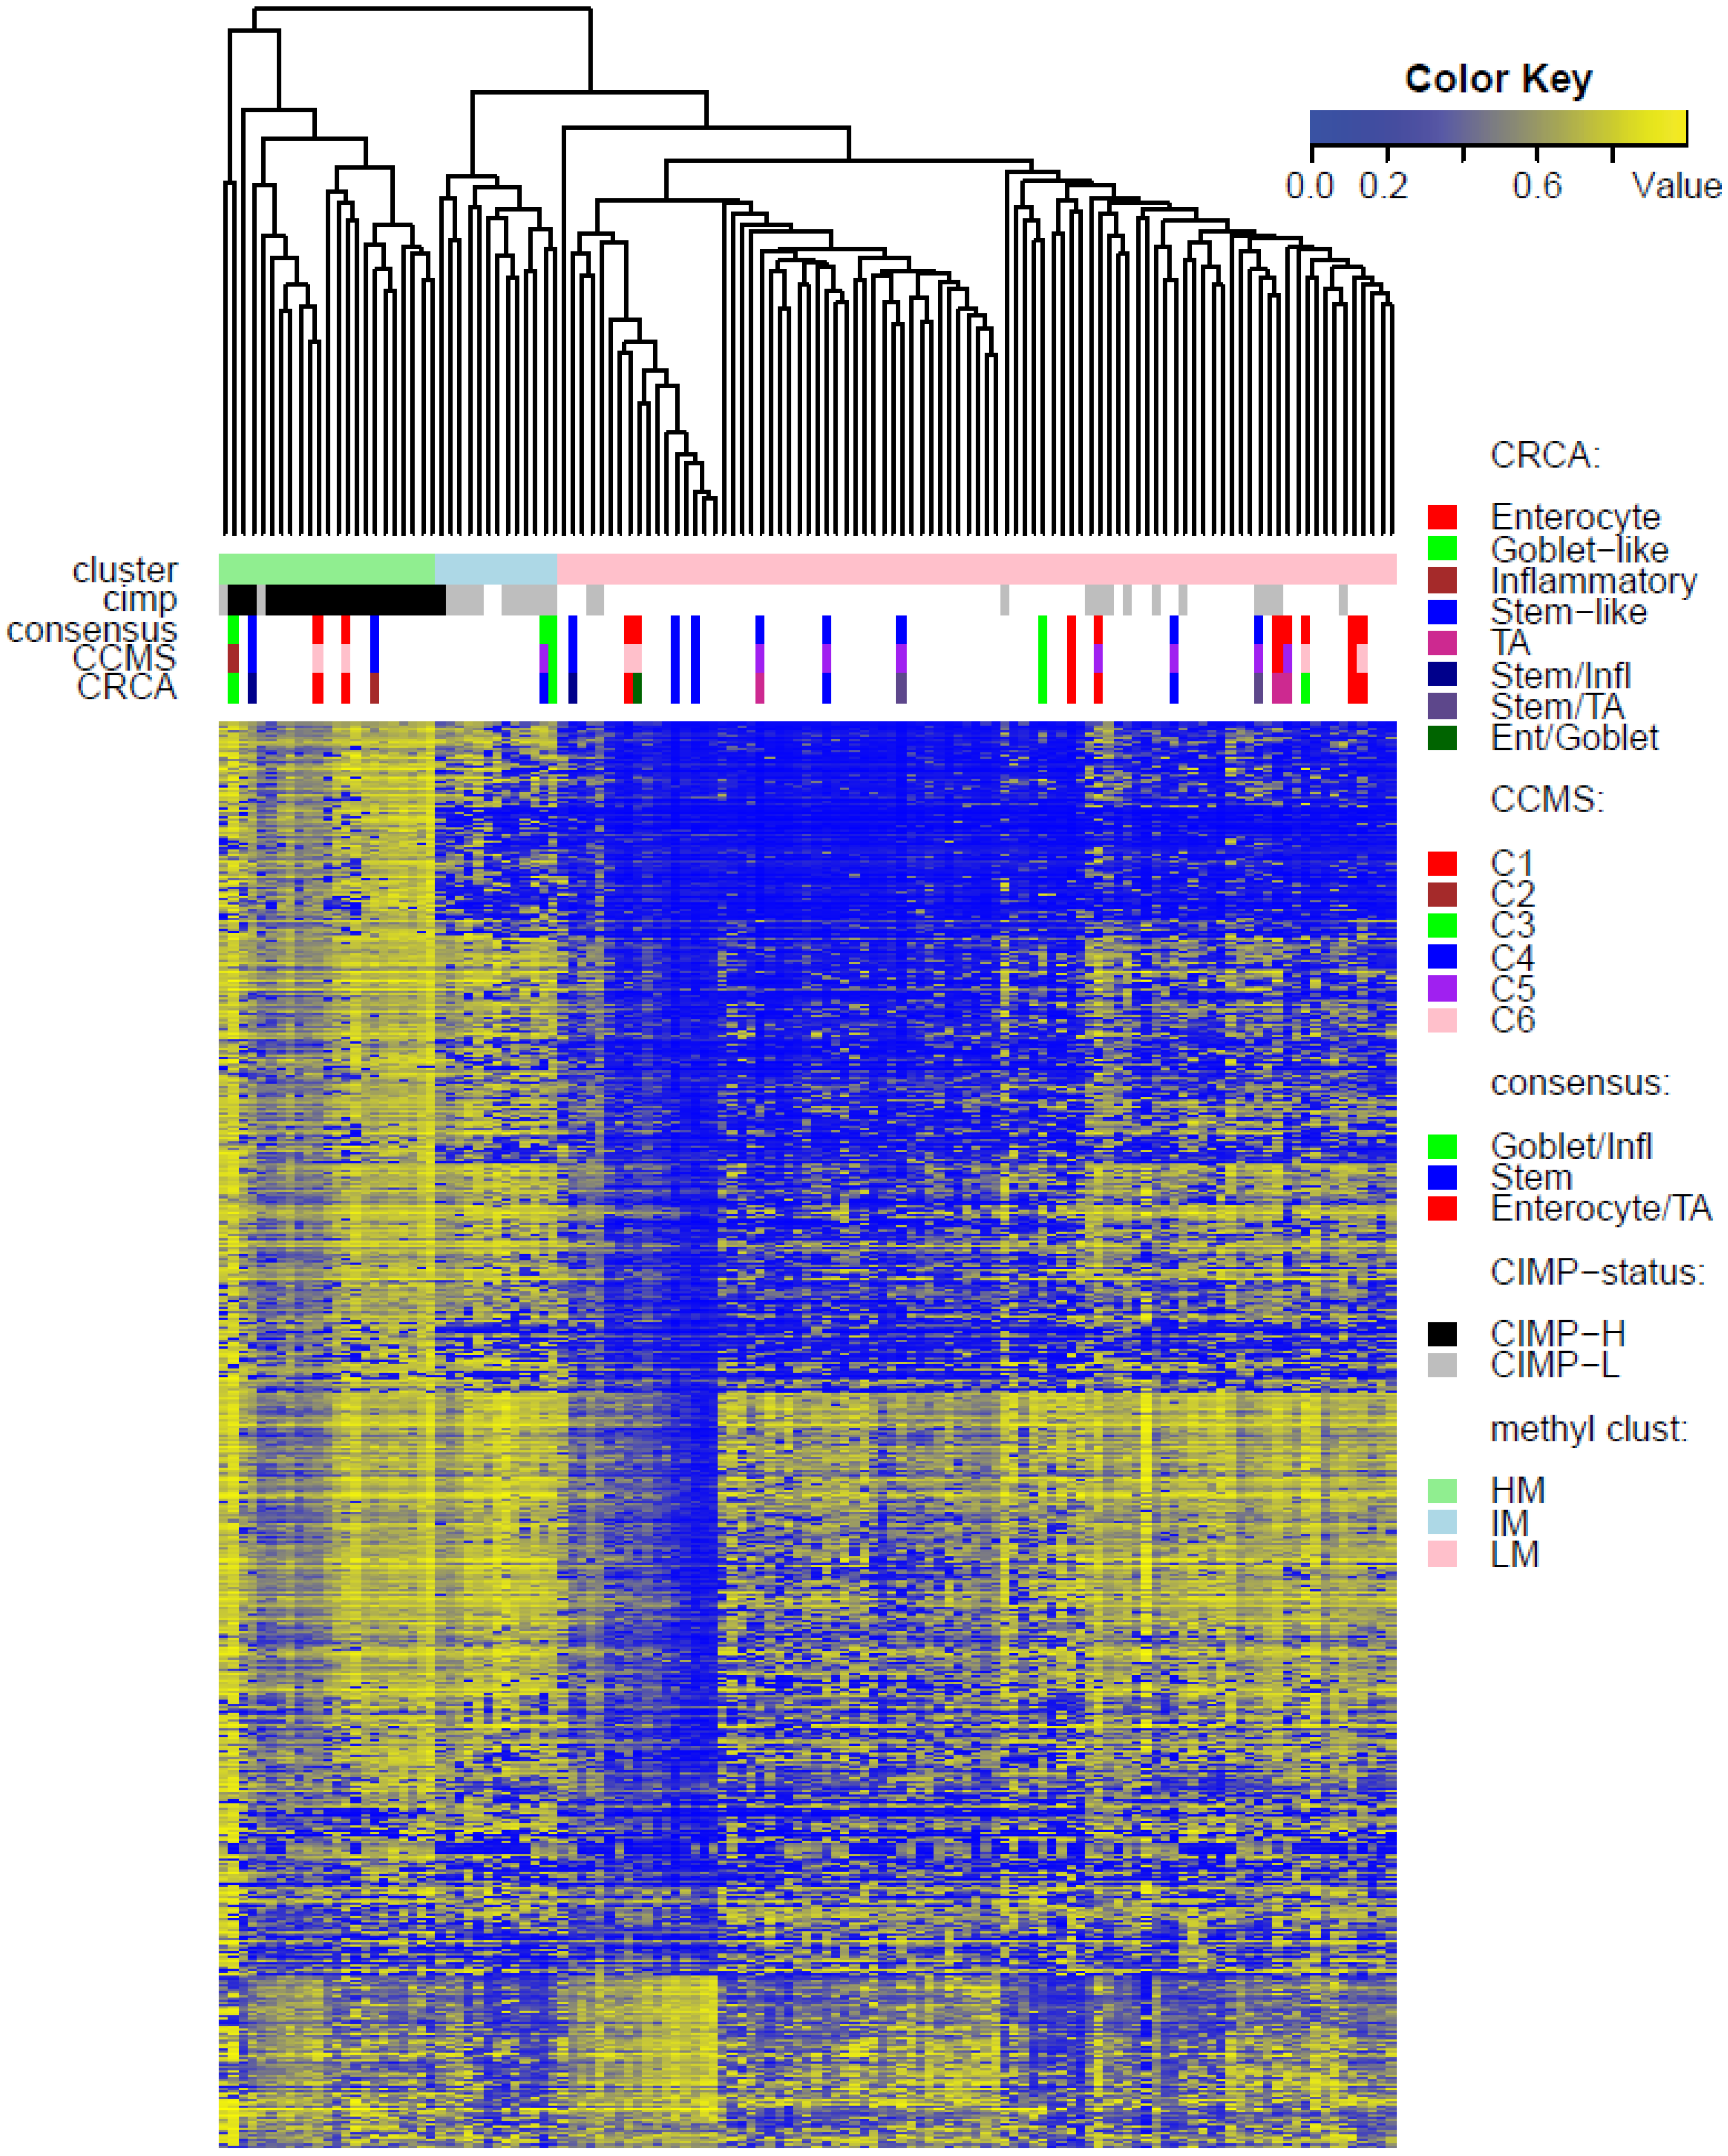
Two unsupervised clustering methods (average linkage agglomeration clustering and RPMM), were applied to the methylation values for each data set. Both methods distinguished three main clusters, (
Figure 2,
Figure 3 and
Figure 4 for average linkage agglomeration and
Figures S5 and S6 for RPMM clustering): these consisted of a highly methylated (HM) cluster, (predominantly CIMP-H, featuring two rather distinct sub-clusters HM1 and HM2 [
24] for the two TCGA data sets), an intermediately methylated (IM) cluster (including both CIMP-H and CIMP-L) and a large cluster with both lower and rarer locus-specific methylation (LM), (predominantly non-CIMP). The overlaps between the clusters obtained with the two different algorithms, for both TCGA data sets), are very good (
χ2 independence tests yielded
p-values < 10
−15). The correspondence between the labels of the methylation classes obtained with the two clustering algorithms, respectively, are illustrated by Factorial Correspondence Analysis in
Figure S7 for the two TCGA-based data sets.
In agreement with previous studies [
1,
3] which found:
- (a)
CCS2 from [
1] and both C2 and C3 (consensus Goblet/Inflammatory in [
3]) to be frequently CIMP positive (CIMP+)
- (b)
CCS1 from [
1] and C1, C5 and C6 (consensus TA/Enterocyte in [
3]) to be more frequently CIMP negative (CIMP−),
strong associations were observed for both TCGA data sets, between the consensus Goblet/Inflammatory expression subtypes and the highly methylated (HM) cluster (
p-value < 10
−11, Fisher Exact Test), as well as between the consensus Enterocyte/TA expression subtypes and the lower methylated (LM) cluster (
p-value < 10
−11).
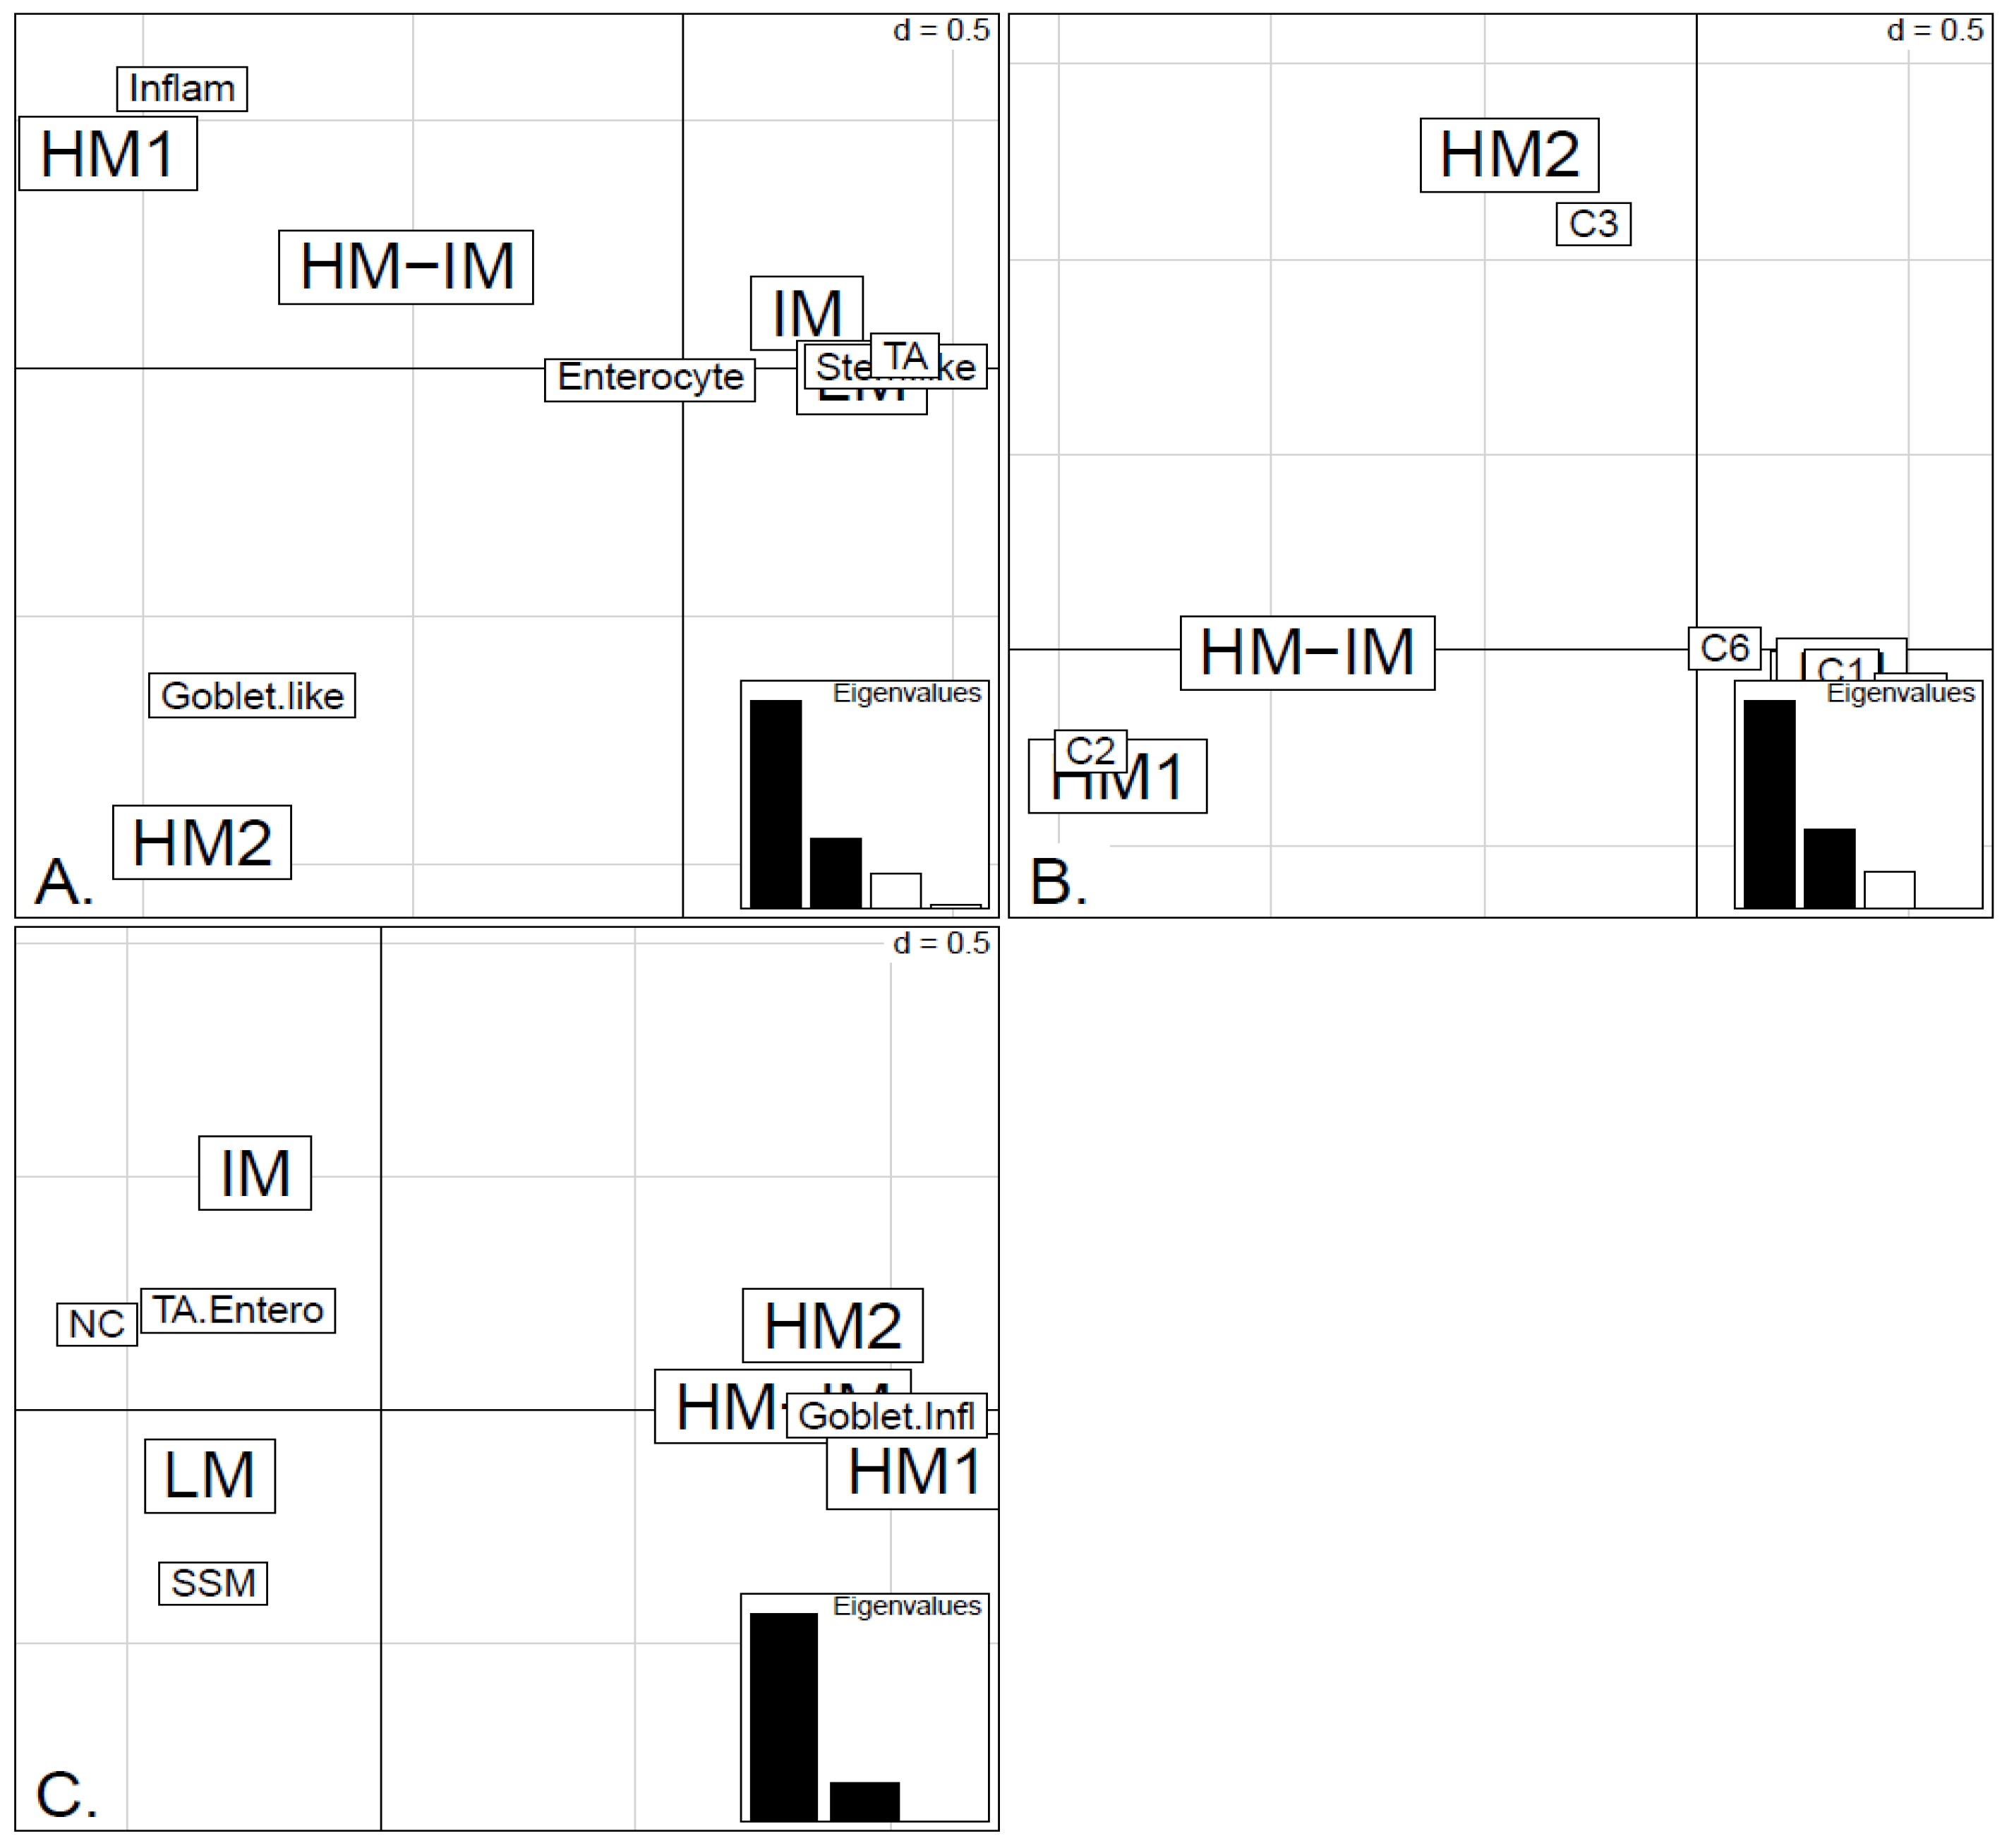
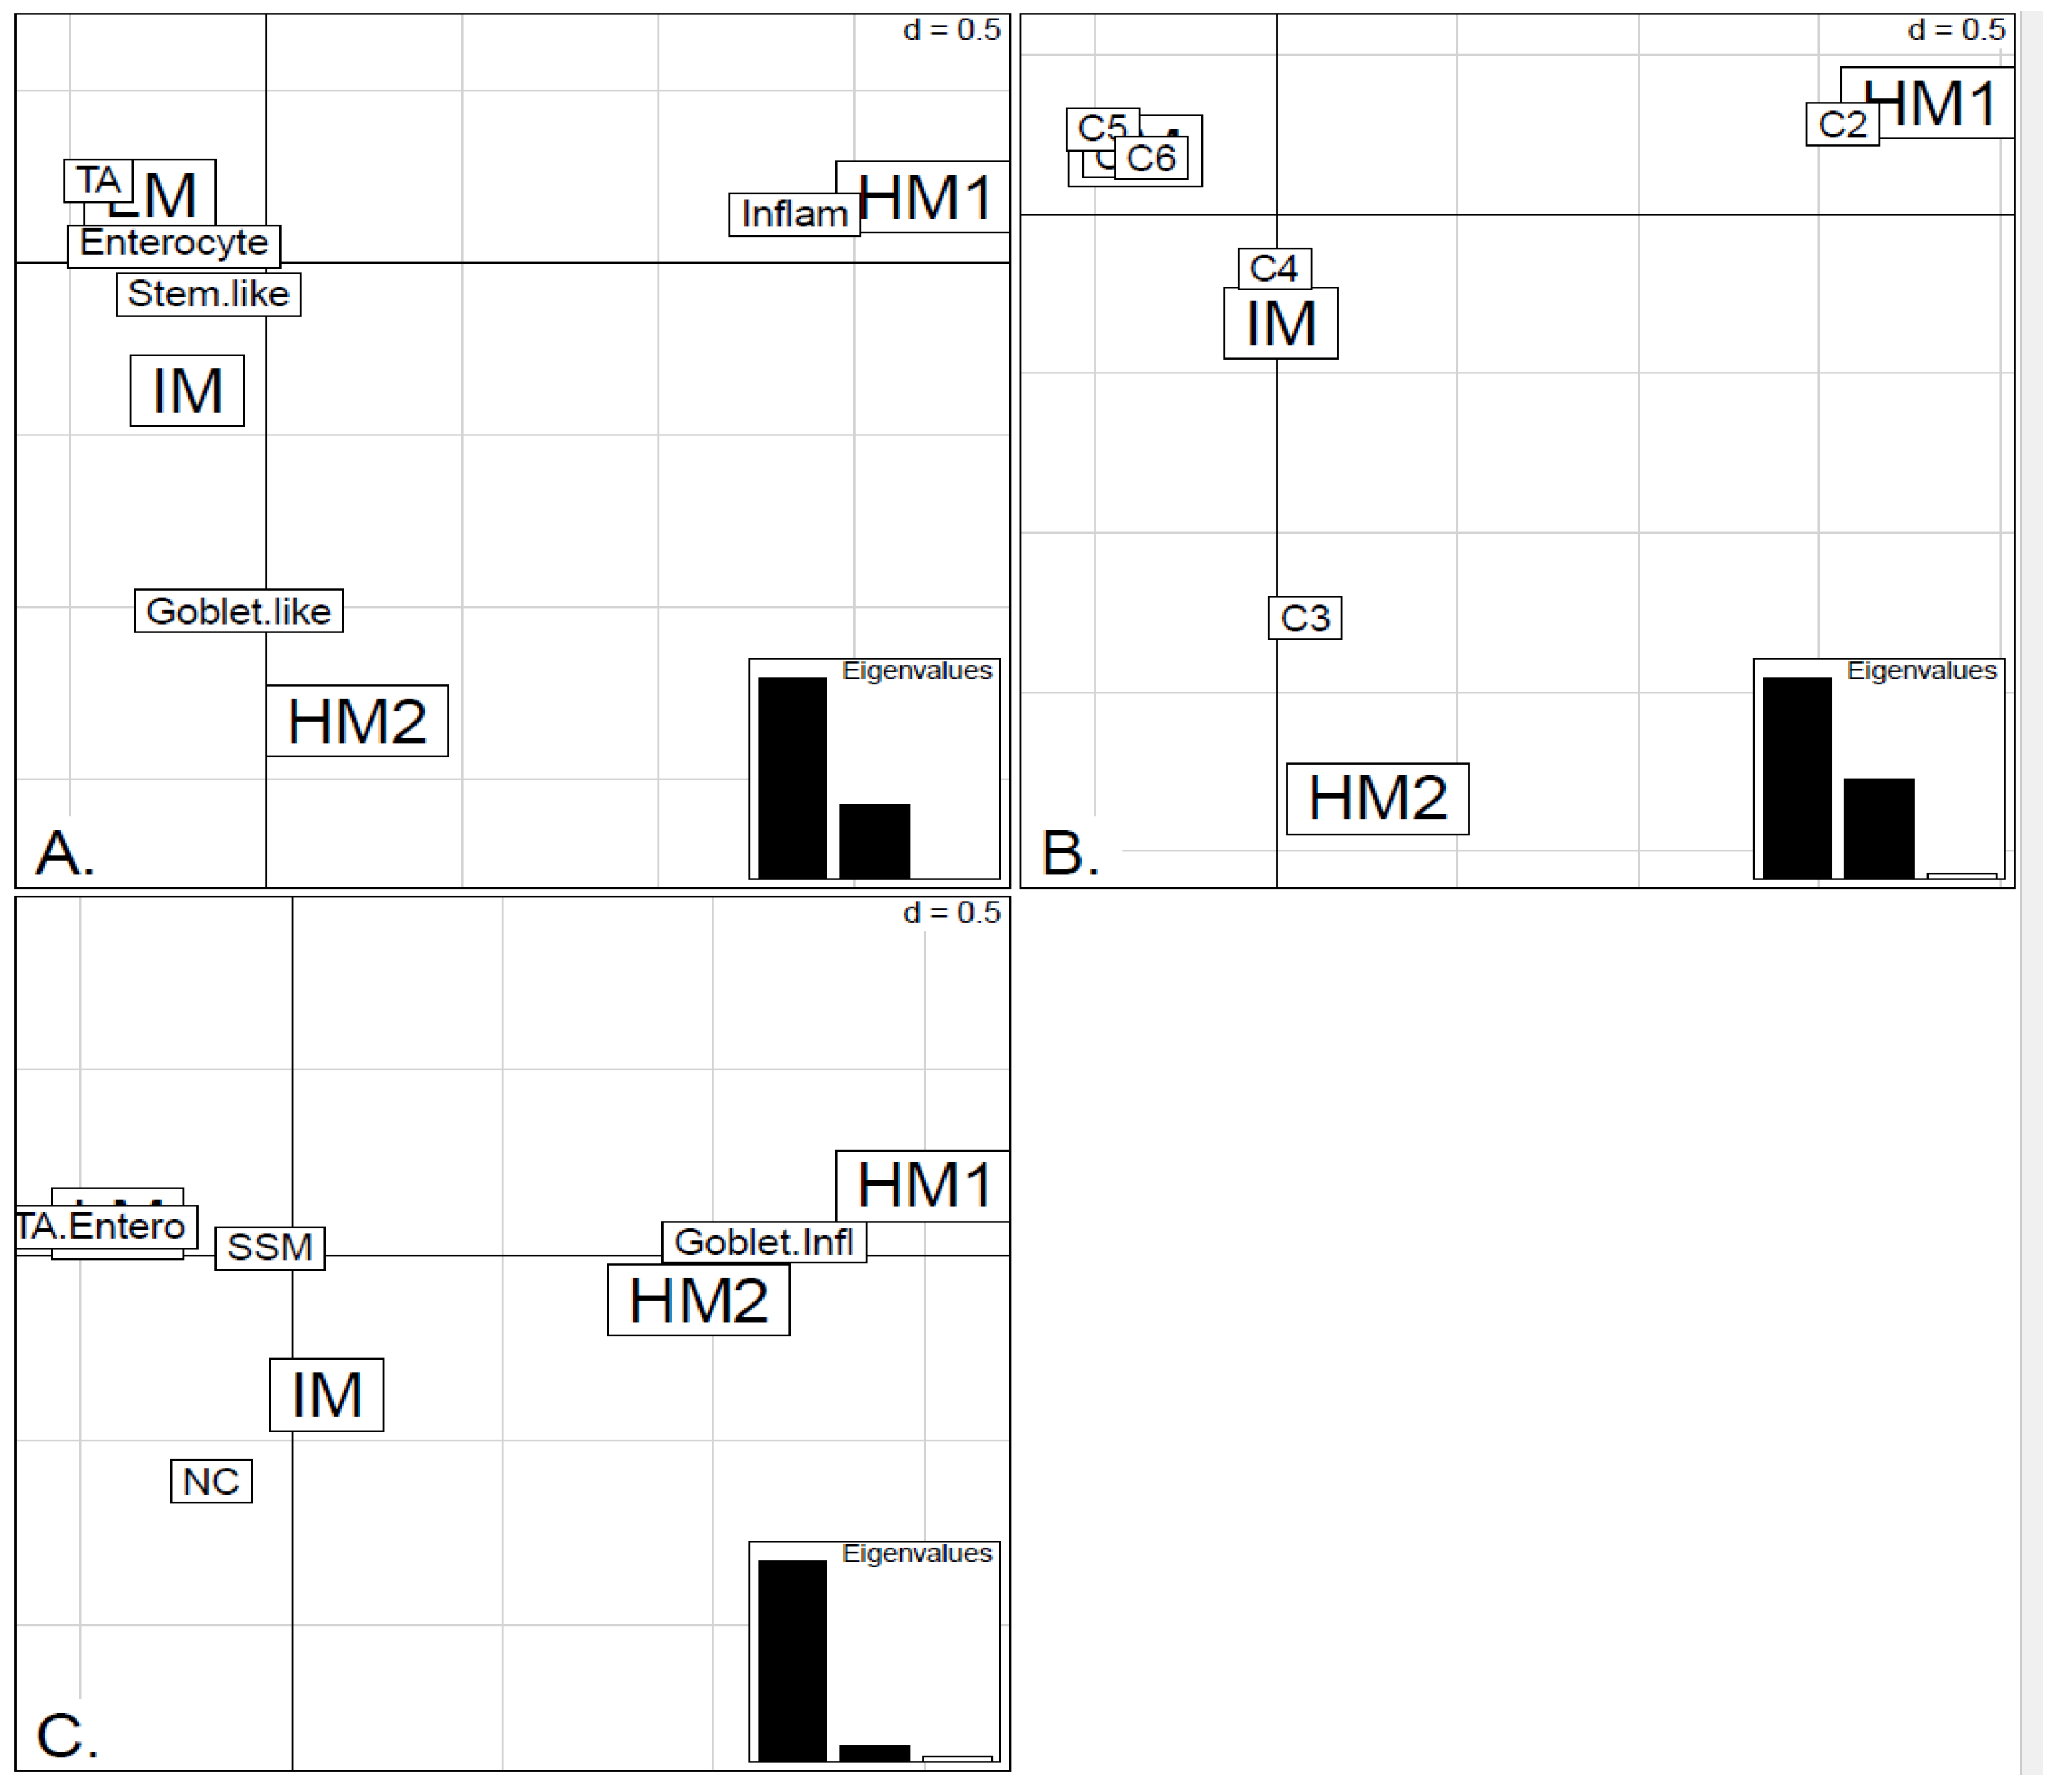
In order to illustrate correspondence between the obtained methylation clusters and the various expression-based subtypes (CRCA, CCMS and consensus), Factorial Correspondence Analysis (FCA) and Balloonplots were applied. The associations between expression subtypes and HM, IM and LM clusters are very well illustrated by spatial proximity in the correspondence analysis,
Figure 5 and
Figure 6 and are highlighted on the contingency tables representations by Balloonplots (
Figure 7c,f).
While Marisa
et al. [
3] also found C4 (consensus SSM) to be associated with CIMP+, SSM was not associated with any of the methylation clusters in TCGA-Illu27 (
Figure 2). This is possibly due to the fact that SSM represents only 8% of this data set. It was, however, significantly associated with LM cluster values in GEO-Illu27 (
p-value = 0.087, Fisher Exact Test, and more conservatively,
p-value = 0.048, Barnard’s Test,
Figure 3) and also in TCGA-Illu450 (
p-value < 10
−5, Fisher Exact Test,
Figure 4 and
Figure 6C,
Figure S5). In both GEO-Illu27 and TCGA-Illu450 data sets, SSM represented a larger fraction of all data: 40% and 27% respectively, compared to the TCGA-Illu-27 case. Given the fact that Stem-like samples have very distinctive clinical features (especially high relapse rate in untreated cases and increased sensitivity to chemotherapy in metastatic settings [
2]), a distinctive methylation profile for these samples may be expected, too. However, this is not the case, most SSM being distributed across the LM cluster. Moving from HM to LM, the preponderance of stem-like SSM becomes much higher, with the opposite true for Goblet/Inflammatory, suggesting a gradient for inclusion of these subtypes as overall methylation reduces or increases, with clearly-defined bands observed in the LM sub-clusters obtained with the RPMM method, (
Figure S6). Recent work [
4] has indicated that the stem-like and EMT features of the SSM subtype are in fact contributions from a distinctively abundant stromal fraction of these tumors. In fact, Isella
et al. [
4] show that it may be the stromal fraction in the SSM samples that influence their clinical features. Taking these observations together offers some support for the argument that, without their stromal content, the SSM samples may fall into the category of one the remaining subtypes, as noted in [
4]. The annotated methylation heatmaps here suggest that it is the low methylated profile which is enriched with samples with a high stromal fraction,
i.e., the SSM subtype.
Figure 6.
Factorial Correspondence Analysis (FCA) between the methylation clusters obtained with average linkage clustering (HM1, HM2, IM and LM) and the various expression-based subtype classifiers: (A) CRCA; (B) CCMS; (C) consensus in the TCGA-Illu450 data set. Spatial proximity between two labels illustrates closeness/correspondence of the labelled modalities. For all three comparisons, the χ2 independence test yielded p-value < 10−12.
As well as using the consensus subtypes defined in [
4], the current analysis looked at methylation clusters annotated by the finer grained subtypes CRCA [
2] and CCMS [
3]. Focusing on the TCGA-Illu27 data set, results in
Figure 1 and
Figure 5A,B suggest that CRCA Inflammatory and CCMS C2 subtypes were not randomly distributed across the HM cluster as a whole, but are quite specific to HM1, (
p-values < 10
−15, for both Inflammatory and C2). Noted in this regard is the quasi co-localisation of HM1 with Inflammatory and C2 on
Figure 5A,B respectively. Additionally, HM1 was the largest and most stable (Jaccard similarity value = 0.88) of the two component sub-clusters found here by agglomerative clustering: 74% of all CRCA Inflammatory and 66% of all CCMS C2 subtypes were found within this sub-cluster (with 86% of its overall composition due to the two), (
Figure 7a,b and
Table S2). The second largest highly-methylated sub-cluster HM2 was mainly populated by subtypes which are Goblet-like and CCMS C3 equivalent subtypes, but with these being less specific to this one sub-cluster (
p-values < 10
−4 for both Goblet-like and C3), (
Figure 7a,b,
Table S3). It is also worth noting that associations between HM2 and Goblet-like and C3 are obvious but less strong on the correspondence charts (
Figure 5A,B). The associated Jaccard similarity value of 0.64 does indicate a possible pattern in the data but, as highlighted by application of bootstrapping [
20,
21], attribution of these samples to the specific sub-cluster was less clear-cut and other attributions are also possible.
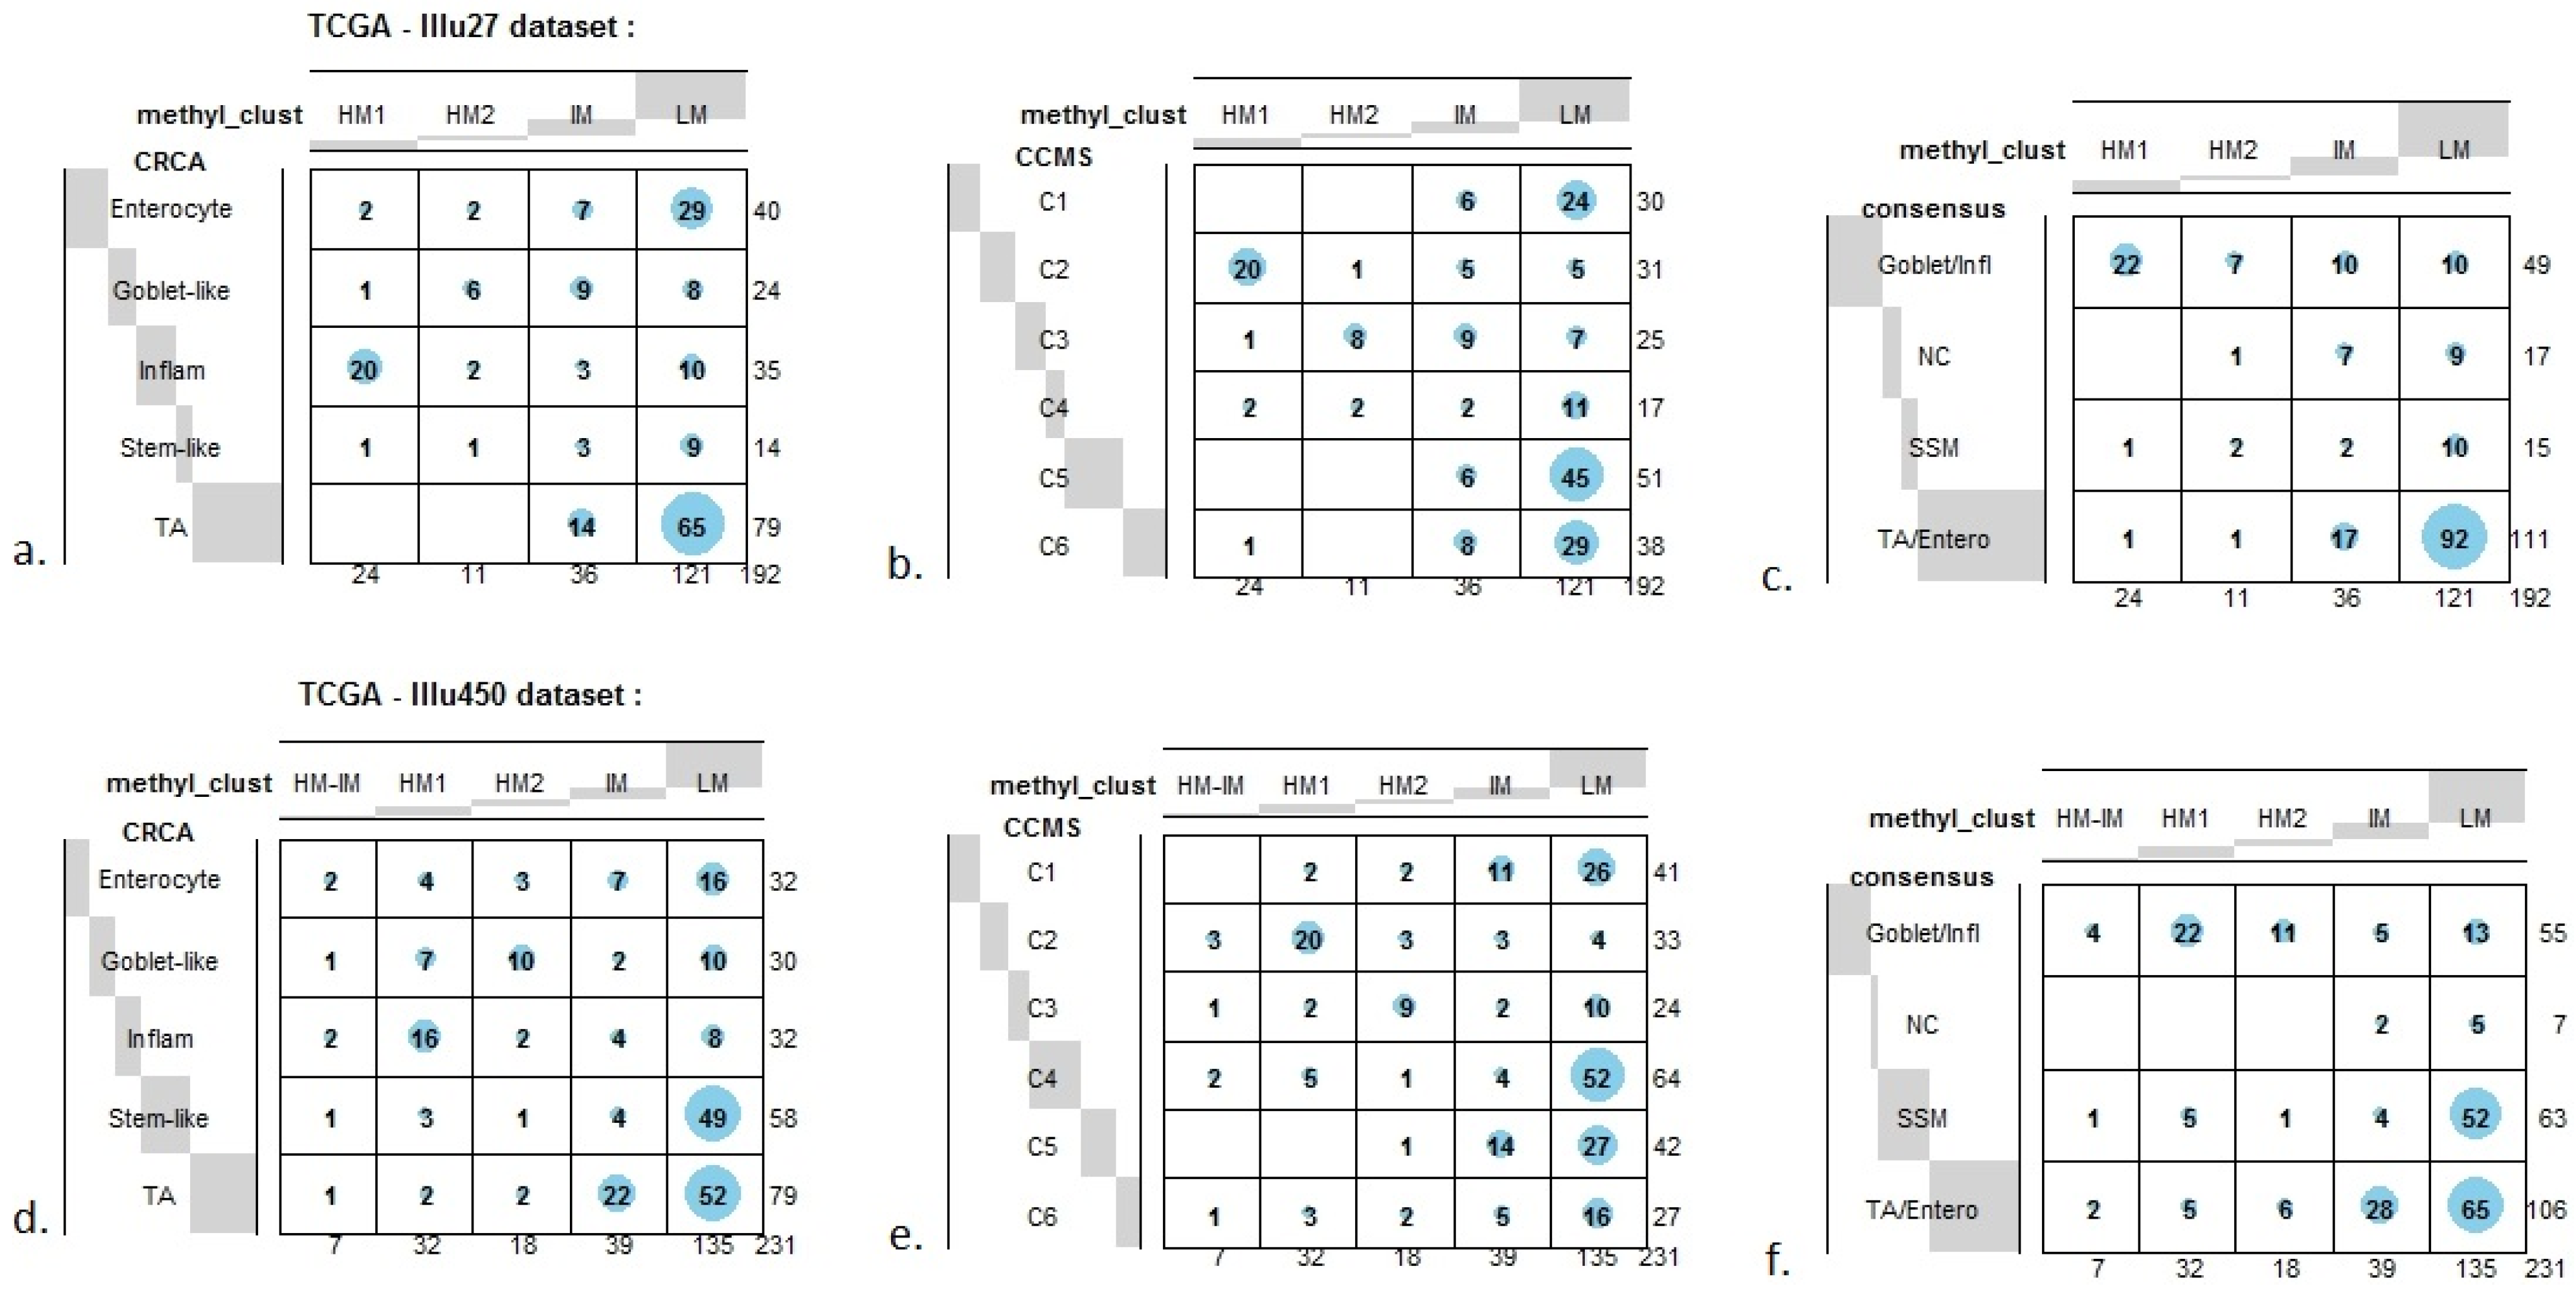
Figure 7.
Bubbleplots - graphical representations of contingency tables for expression-based subtype classifiers (CRCA, CCMS, consensus respectively) and methylation based clusters, obtained with hierarchical clustering (average-linkage agglomerative method), for the TCGA-Illu27 (a, b, c) and TCGA-Illu450 (d, e, f) data sets. The highlighted areas indicate proportional correspondence between factor modalities. For the contingency tables with consensus subtyping scheme, NC refers to those samples that do not have a consensus classification.
Very similar observations apply to HM1 and HM2 in the TCGA-Illu450 data set; in this case Inflammatory/C2 were found to be specific to HM1 (
p-values < 10
−7), and Goblet-Like/C3 specific to HM2 (
p-values < 10
−5), (
Figure 6A,B and
Figure 7d,e,
Tables S2 and S3). These results suggested that CIMP+ Inflammatory/C2 are characterized by quite distinct methylation profiles as opposed to CIMP+ Goblet-like/C3, which are subject to more heterogeneous methylation. With RPMM clustering, a predominantly Inflammatory/C2 HM cluster was obtained also for the TCGA-Illu27 data set. The CIMP+ Goblet-like/C3 samples are distributed between both HM and IM clusters, (
Figure S5), reinforcing the observation that there is considerable methylation heterogeneity in the Goblet-like/C3 classification. For TCGA-Illu450, the RPMM method yielded two HM clusters, which are labelled HM1 and HM2, (
Figure S6) and share >65% members with the HM clusters obtained by agglomerative clustering.
The fact that Inflammatory/C2 clearly segregate from Goblet-like/C3 subtypes when methylation profiles are examined, suggests that it may be interesting to consider these subtypes separately, instead of combined or paired in a single subtype. Interestingly, Inflammatory and Goblet-like subtypes seem to behave differently in terms of treatment response association. Sadanandam
et al. [
2] evaluated disease-free survival (DFS) in both untreated and treated (adjuvant chemotherapy or radiotherapy) patients. In untreated patients, Goblet-like showed a good prognosis, while Inflammatory subtypes had intermediate DFS. In treated patients, adjuvant chemotherapy or radiotherapy was detrimental for Goblet-like subtypes but made no difference for Inflammatory subtypes [
2]. These authors have also examined the possibility that the subtypes show different responses to FOLFIRI, a chemotherapy regimen used in first-line treatment of
metastatic CRC, by deriving a FOLFIRI response signature for the analysed samples where actual FOLFIRI response was not available [
2,
25]. Inflammatory subtype appears to be the second subtype the most associated to FOLFIRI response signature (after Stem-like subtype), while Goblet-like subtype is less associated to FOLFIRI response signature [
2].
In order to find genes, with methylation distinctive to HM1 or HM2, the shrunken nearest centroids method [
23] was applied to methylation data of identified HM1 and HM2 samples, for each of the TCGA-Illu27 and TCGA-Illu450 data sets. With shrinkage thresholds chosen to yield cross-validation error-rates (<0.05), a total, respectively, of 106 and 129 genes, which best characterized the HM classes for the two data sets, were obtained. Of these two gene lists, 7 genes were found to be common for both data sets and 6 of these (GDF5, SOX8, KRT20, SMOC1, OLFM4 and SLC6A3) had same sign shrunken centroids for both classes.
In contrast to Goblet and Inflammatory subtypes, TA and Enterocyte subtypes of the CRCA classifier and C1, C5 and C6 subtypes of the CCMS classifier seemed to be both heterogeneous and dispersed across IM and, in particular, LM clusters. It should be noted that, for TCGA-Illu27, the far right LM sub-cluster comprising 48 samples, (
Figure 2), was significantly associated with TA and C5 subtypes (
p-value < 10
−3) and contains the lowest methylated samples of this data set. A TA/C5 sub-cluster, such as this, was not observed for agglomerative clustering of the TCGA-Illu450 data set, (
Figure 4). From the methylation data viewpoint at least, the primary interest might be to consider TA and Enterocyte/C1, C5 and C6 subtypes under a consensus TA/Enterocyte signature, such as the one suggested in [
4]. In terms of clinical features, Sadanandam
et al. [
2] reported some differences for the TA and Enterocyte subtypes, the main one being that untreated TA showed better prognosis than untreated Enterocyte. The differences found in terms of response to treatments were less important than those found for Goblet-like and Inflammatory subtypes, ([
2] and
Supplementary Material therein).
Finally, tumors with intermediate methylation (IM) profiles appeared to be the most heterogeneous with respect to the expression-based subtypes, (exhibiting a mixture of Goblet-like/C3 and Enterocyte/C1, C5, C6), and also to methylation profiles (“unstable, dissolved” and “dispersed” IM clusters, with Jaccard similarity values of 0.48 and 0.53 obtained for the TCGA-Illu27 and TCGA-Illu450 data sets, respectively).


