A New Modified Histogram Matching Normalization for Time Series Microarray Analysis

Abstract
:
1. Introduction
2. Methods
Algorithm for Modified Histogram Matching Normalization
- (1)
- First sort all data in the whole data matrix according to magnitude from low to high;
- (2)
- Partition this sorted dataset into bins (), each bin containing exactly N numbers;
- (3)
- Sort each column in the original unsorted data matrix according to magnitude from low to high. This results in an matrix S with elements , where each column contains the same elements as in the original unsorted data matrix but in an order where the smallest values are on top and largest at the bottom;
- (4)
- For and , scale all elements in the ith row of matrix S using the following scaling function fso that the first (smallest) element equals the first value in the interval and the last element equals the last value of the bin ;
- (5)
- Return each scaled element in each column back to their original unsorted positions within the columns.
3. Results
3.1. Effects on Correlation
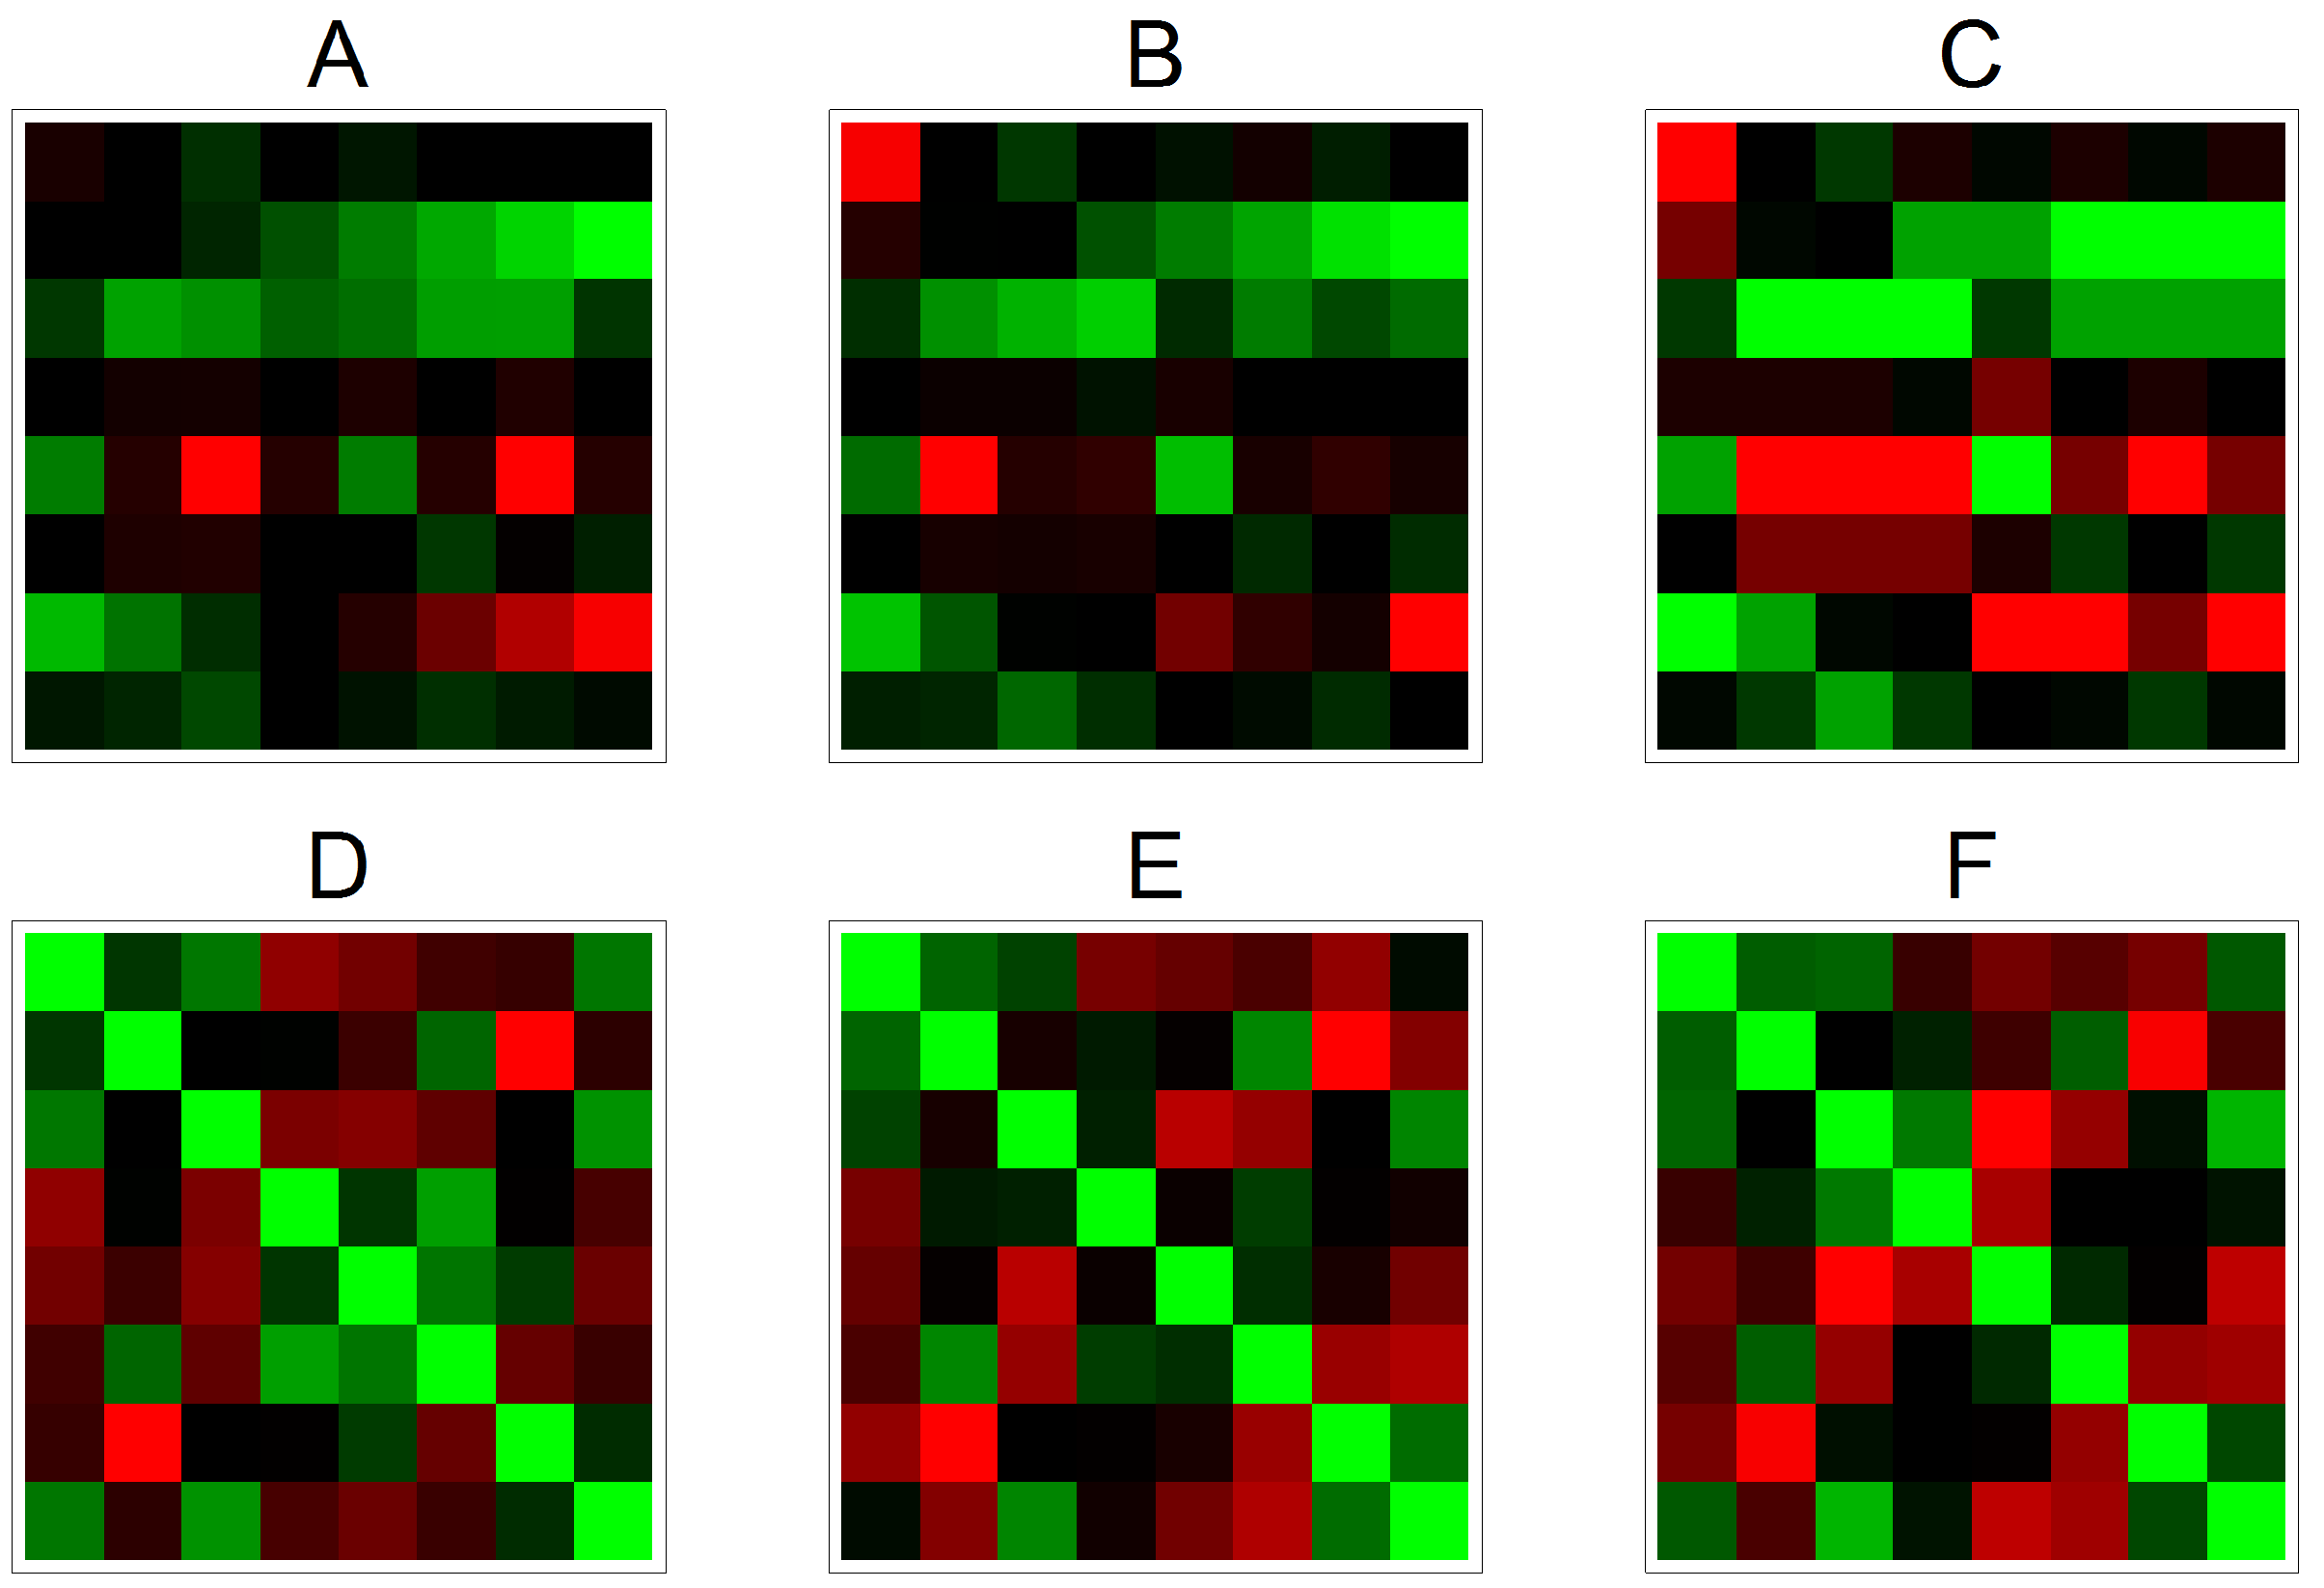

3.2. Effects on Correlation on Real Data
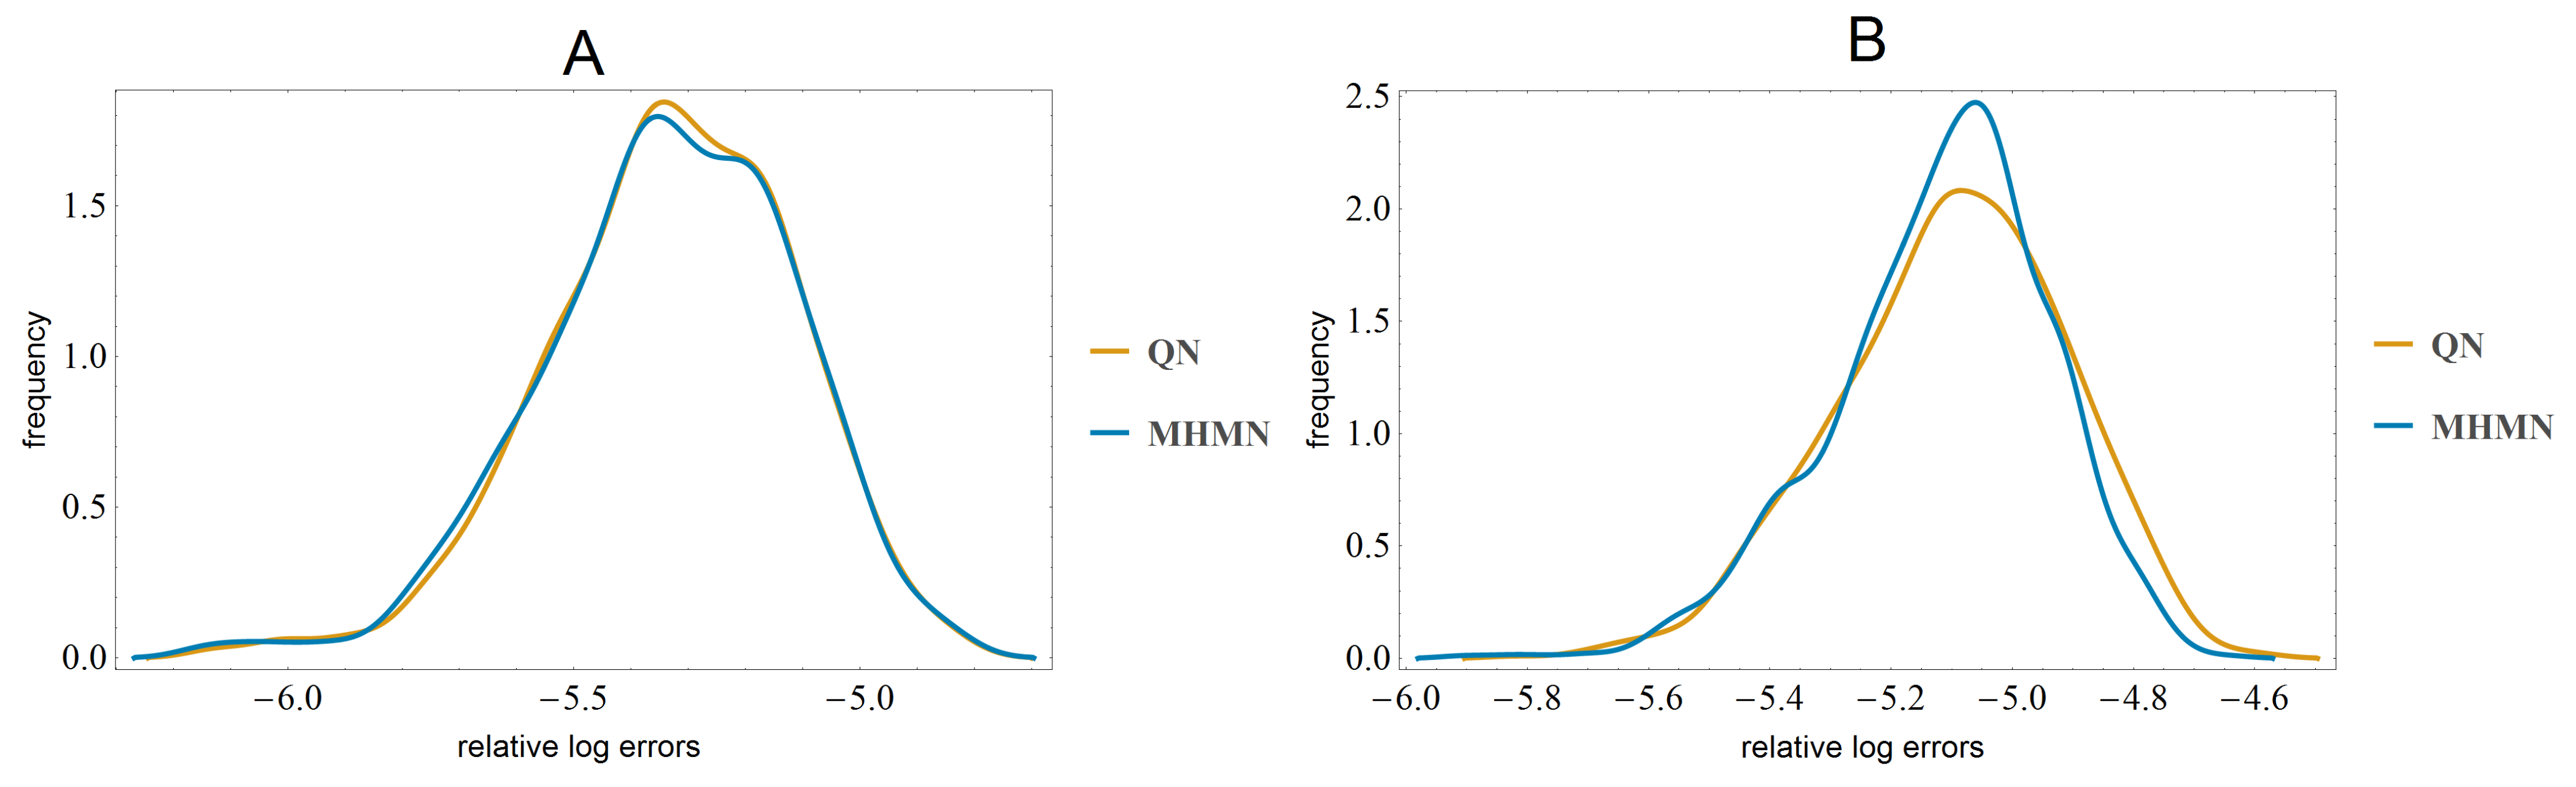
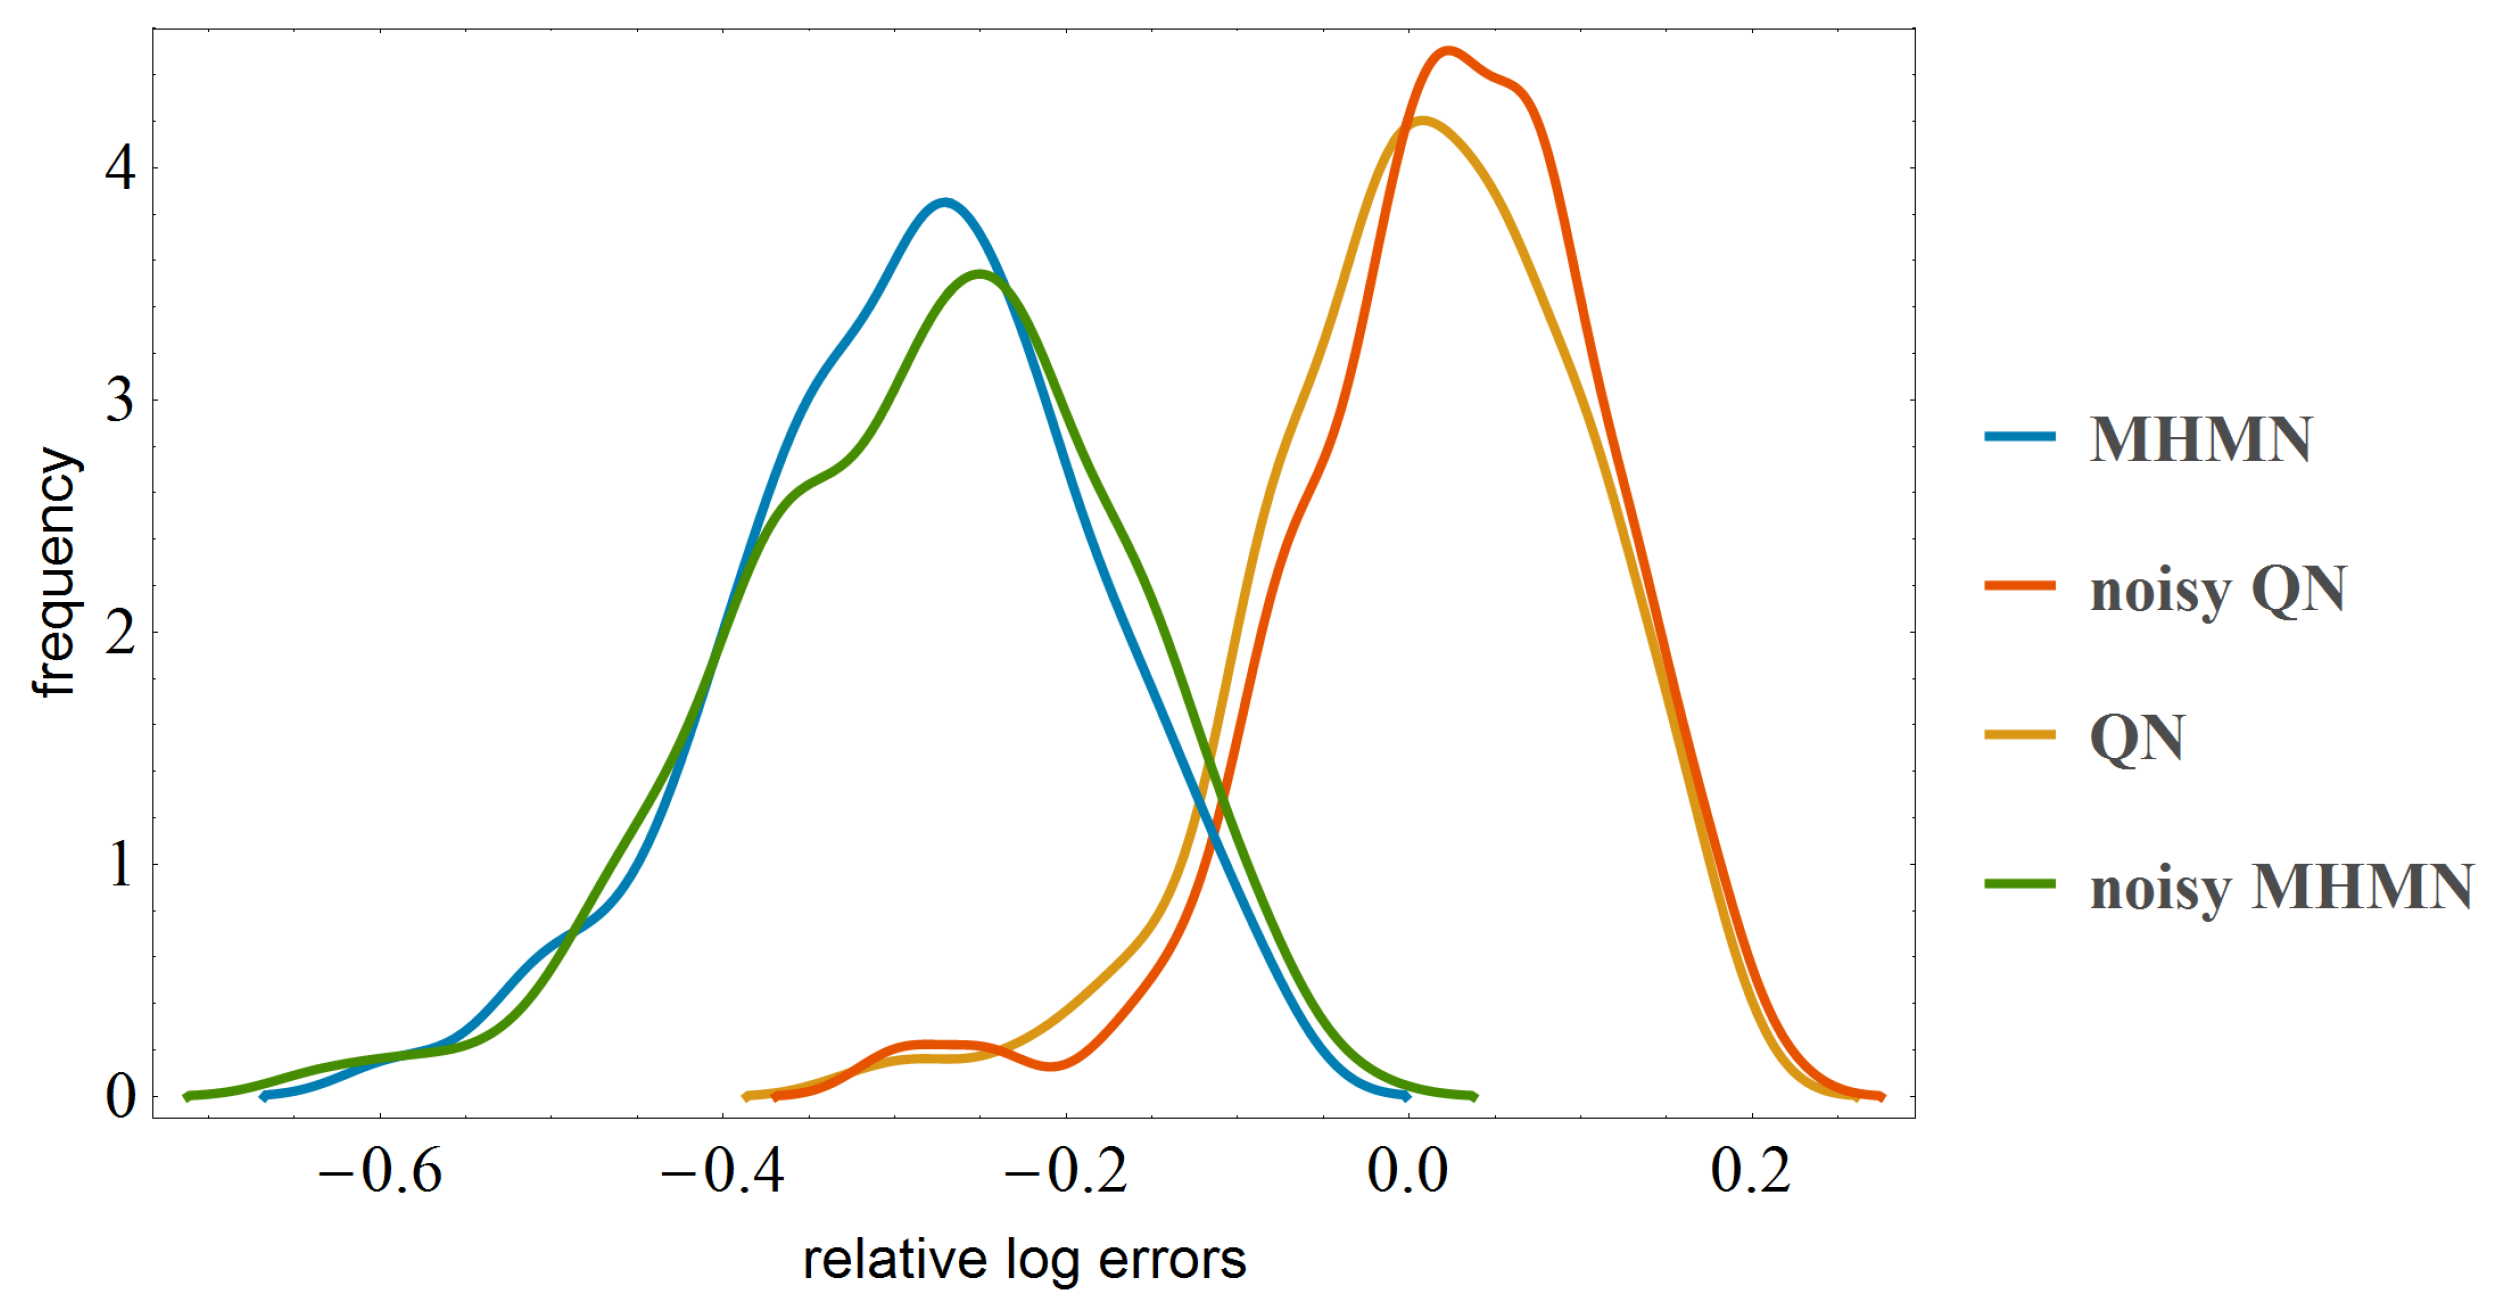
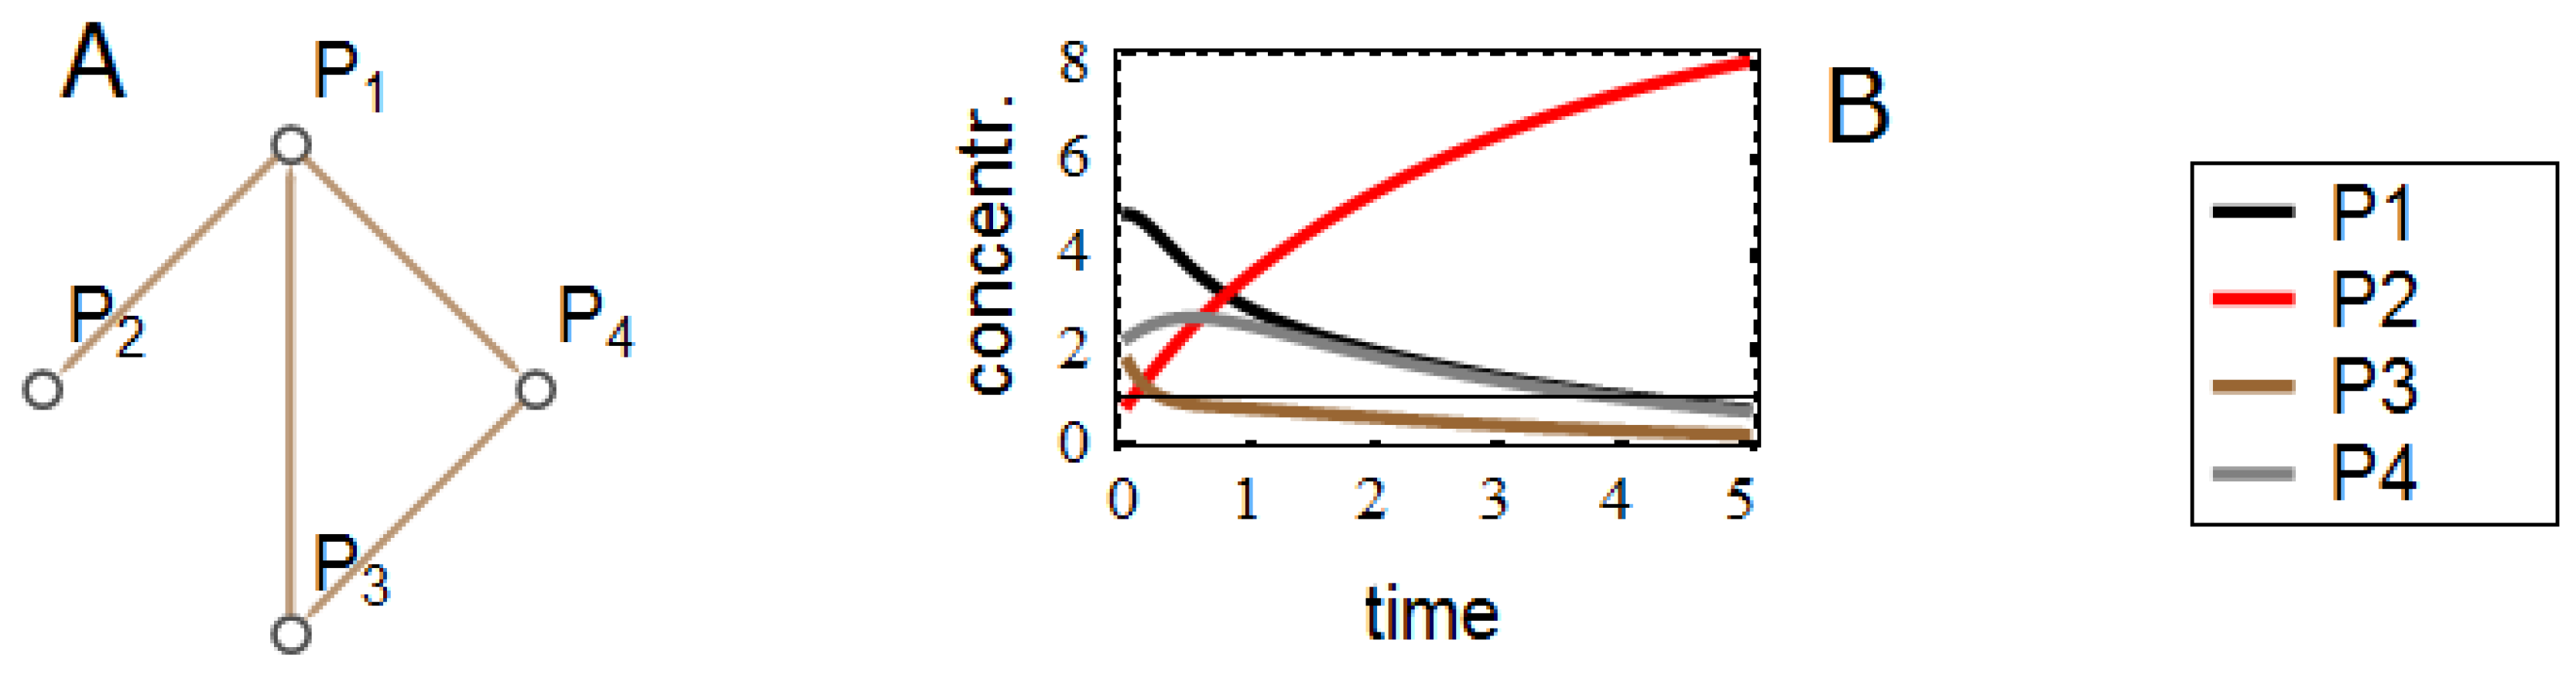
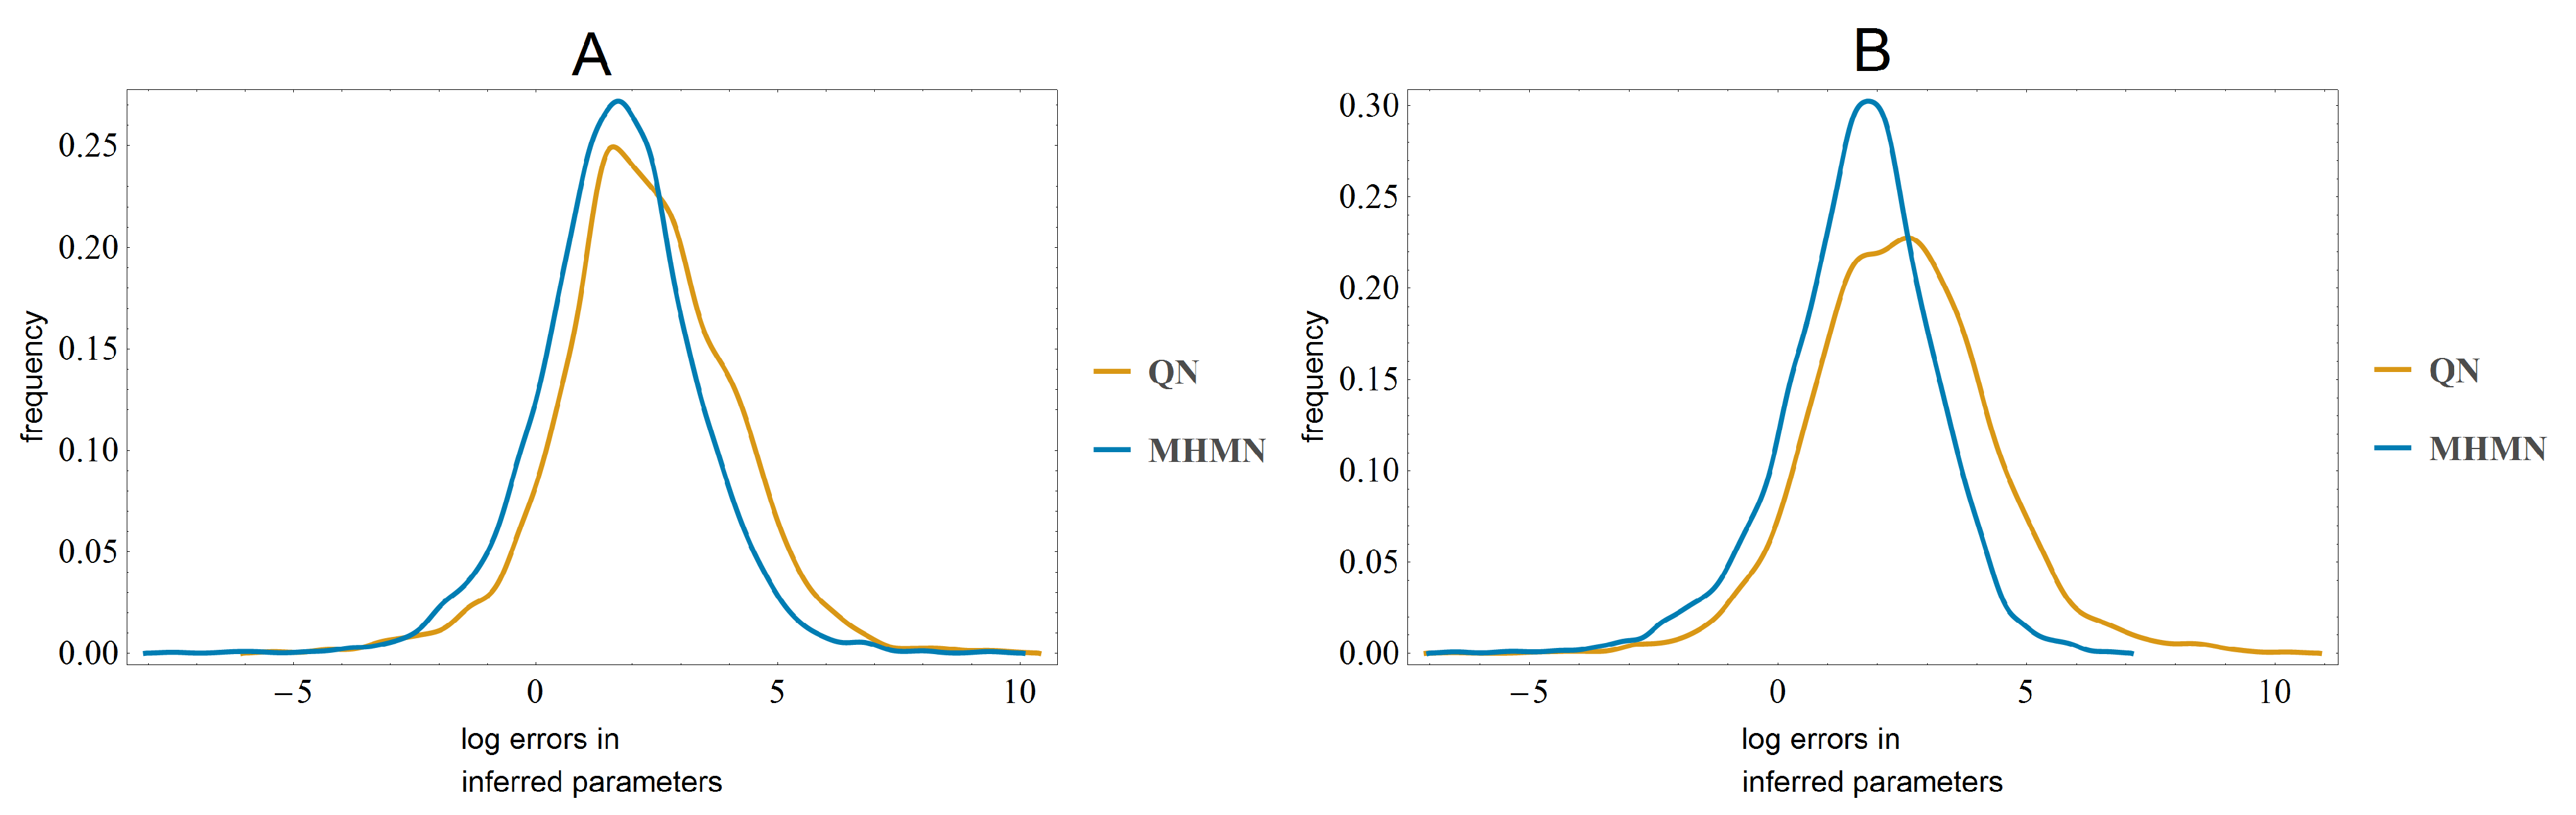
3.3. Effects on Reverse-Engineering via ODEs

4. Conclusions
Acknowledgements
Author Contributions
Conflicts of Interest
References
- Quackenbush, J. Microarray data normalization and transformation. Nat. Genet. 2002, 32, 496–501. [Google Scholar] [CrossRef] [PubMed]
- Bolstad, B.M.; Irizarry, R.A.; Astrand, M.; Speed, T.P. A comparison of normalization methods for high density oligonucleotide array data based on variance and bias. Bioinformatics 2003, 19, 185–193. [Google Scholar] [CrossRef]
- Hoffmann, R.; Seidl, T.; Dugas, M. Profound effect of normalization on detection of differentially expressed genes in oligonucleotide microarray data analysis. Genome Biol. 2002, 3. research0033.1. [Google Scholar]
- Lim, W.; Wang, K.; Lefebvre, C.; Califano, A. Comparative analysis of microarray normalization procedures: Effects on reverse engineering gene networks. Bioinformatics 2007, 23, 282–288. [Google Scholar] [CrossRef] [PubMed]
- D’haeseleer, P.; Liang, S.; Somogyi, R. Genetic network inference: From co-expression clustering to reverse engineering. Bioinformatics 2000, 16, 707–726. [Google Scholar] [CrossRef]
- Stumpf, M.; Balding, D.; Girolami, M. Handbook of Statistical Systems Biology; John Wiley & Sons Inc.: West Sussex, UK, 2011. [Google Scholar]
- Horvath, S. Weighted Network Analysis, Applications in Genomics and Systems Biology; Springer: New York, NY, USA, 2011. [Google Scholar]
- Markowetz, F.; Spang, R. Inferring cellular networks—A review. BMC Bioinform. 2007, 8, S5. [Google Scholar] [CrossRef] [PubMed]
- Chou, I.C.; Voit, E. Recent Developments in Parameter Estimation and Structure Identification of Biochemical and Genomic Systems. Math Biosci. 2009, 219, 57–83. [Google Scholar] [CrossRef] [PubMed]
- Gupta, R.; Stincone, A.; Antczak, P.; Durant, S.; Bicknell, R.; Bikfalvi, A.; Falciani, F. A computational framework for gene regulatory network inference that combines multiple methods and datasets. BMC Syst. Biol. 2011, 5, 52. [Google Scholar] [CrossRef] [PubMed]
- Li, Z.; Li, P.; Krishnan, A.; Liu, J. Large-scale dynamic gene regulatory network inference combining differential equation models with local dynamic Bayesian network analysis. Bioinfomatics 2011, 27, 2686–2691. [Google Scholar] [CrossRef] [PubMed]
- Penfold, C.A.; Wild, D.L. How to infer gene networks from expression profiles, revisited. Interface Focus 2011, 1, 857–870. [Google Scholar] [CrossRef] [PubMed]
- Cantone, I.; Marucci, L.; Iorio, F.; Ricci, M.; Belcastro, V.; Bansal, M.; Santini, S.; di Bernardo, M.; di Bernardo, D.; Cosma, M. A Yeast Synthetic Network for In Vivo Assessment of Reverse-Engineering and Modeling Approaches. Cell 2009, 137, 172–181. [Google Scholar] [CrossRef] [PubMed] [Green Version]
- Marbach, D.; Prill, R.; Schaffter, T.; Mattiussi, C.; Floreano, D.; Stolovitzky, G. Revealing strengths and weaknesses of methods for gene network inference. Proc. Natl. Acad. Sci. USA 2010, 107, 6286–6291. [Google Scholar] [CrossRef] [PubMed] [Green Version]
- Dialogue for Reverse Engineering Assessments and Methods. Available online: http://www.the-dream-project.org/ (accessed on 23 March 2014).
- Sokolović, M.; Sokolović, A.; Wehkamp, D.; Ver Loren van Themaat, E.; de Waart, D.; Gilhuijs-Pederson, L.; Nikolsky, Y.; van Kampen, A.; Hakvoort, T.; Lamers, W. The transcriptomic signature of fasting murine liver. BMC Genomics 2008, 9, 528. [Google Scholar] [CrossRef] [PubMed]
Appendix
Quantile normalization
- (1)
- First each column is ordered so that the smallest value comes to the top:
- (2)
- Then each value is replaced by the row mean. For example the row mean for the first row is .
- (3)
- Finally each element is returned to their original position:
Modified histogram matching normalization
- (2)
- Data is ordered and divided into bins: , and .
- (3)
- Instead of taking the row means, the scaling function f as defined in Section 2 is applied to each element. For example element andThis scaling results in the following matrix:
- (4)
- Finally the scaled elements are returned into their original positions:
© 2014 by the authors; licensee MDPI, Basel, Switzerland. This article is an open access article distributed under the terms and conditions of the Creative Commons Attribution license (http://creativecommons.org/licenses/by/3.0/).
Share and Cite
Astola, L.; Molenaar, J. A New Modified Histogram Matching Normalization for Time Series Microarray Analysis. Microarrays 2014, 3, 203-211. https://doi.org/10.3390/microarrays3030203
Astola L, Molenaar J. A New Modified Histogram Matching Normalization for Time Series Microarray Analysis. Microarrays. 2014; 3(3):203-211. https://doi.org/10.3390/microarrays3030203
Chicago/Turabian StyleAstola, Laura, and Jaap Molenaar. 2014. "A New Modified Histogram Matching Normalization for Time Series Microarray Analysis" Microarrays 3, no. 3: 203-211. https://doi.org/10.3390/microarrays3030203
APA StyleAstola, L., & Molenaar, J. (2014). A New Modified Histogram Matching Normalization for Time Series Microarray Analysis. Microarrays, 3(3), 203-211. https://doi.org/10.3390/microarrays3030203