A Prospective Birth Cohort Study on Maternal Cholesterol Levels and Offspring Attention Deficit Hyperactivity Disorder: New Insight on Sex Differences

Abstract
:1. Introduction
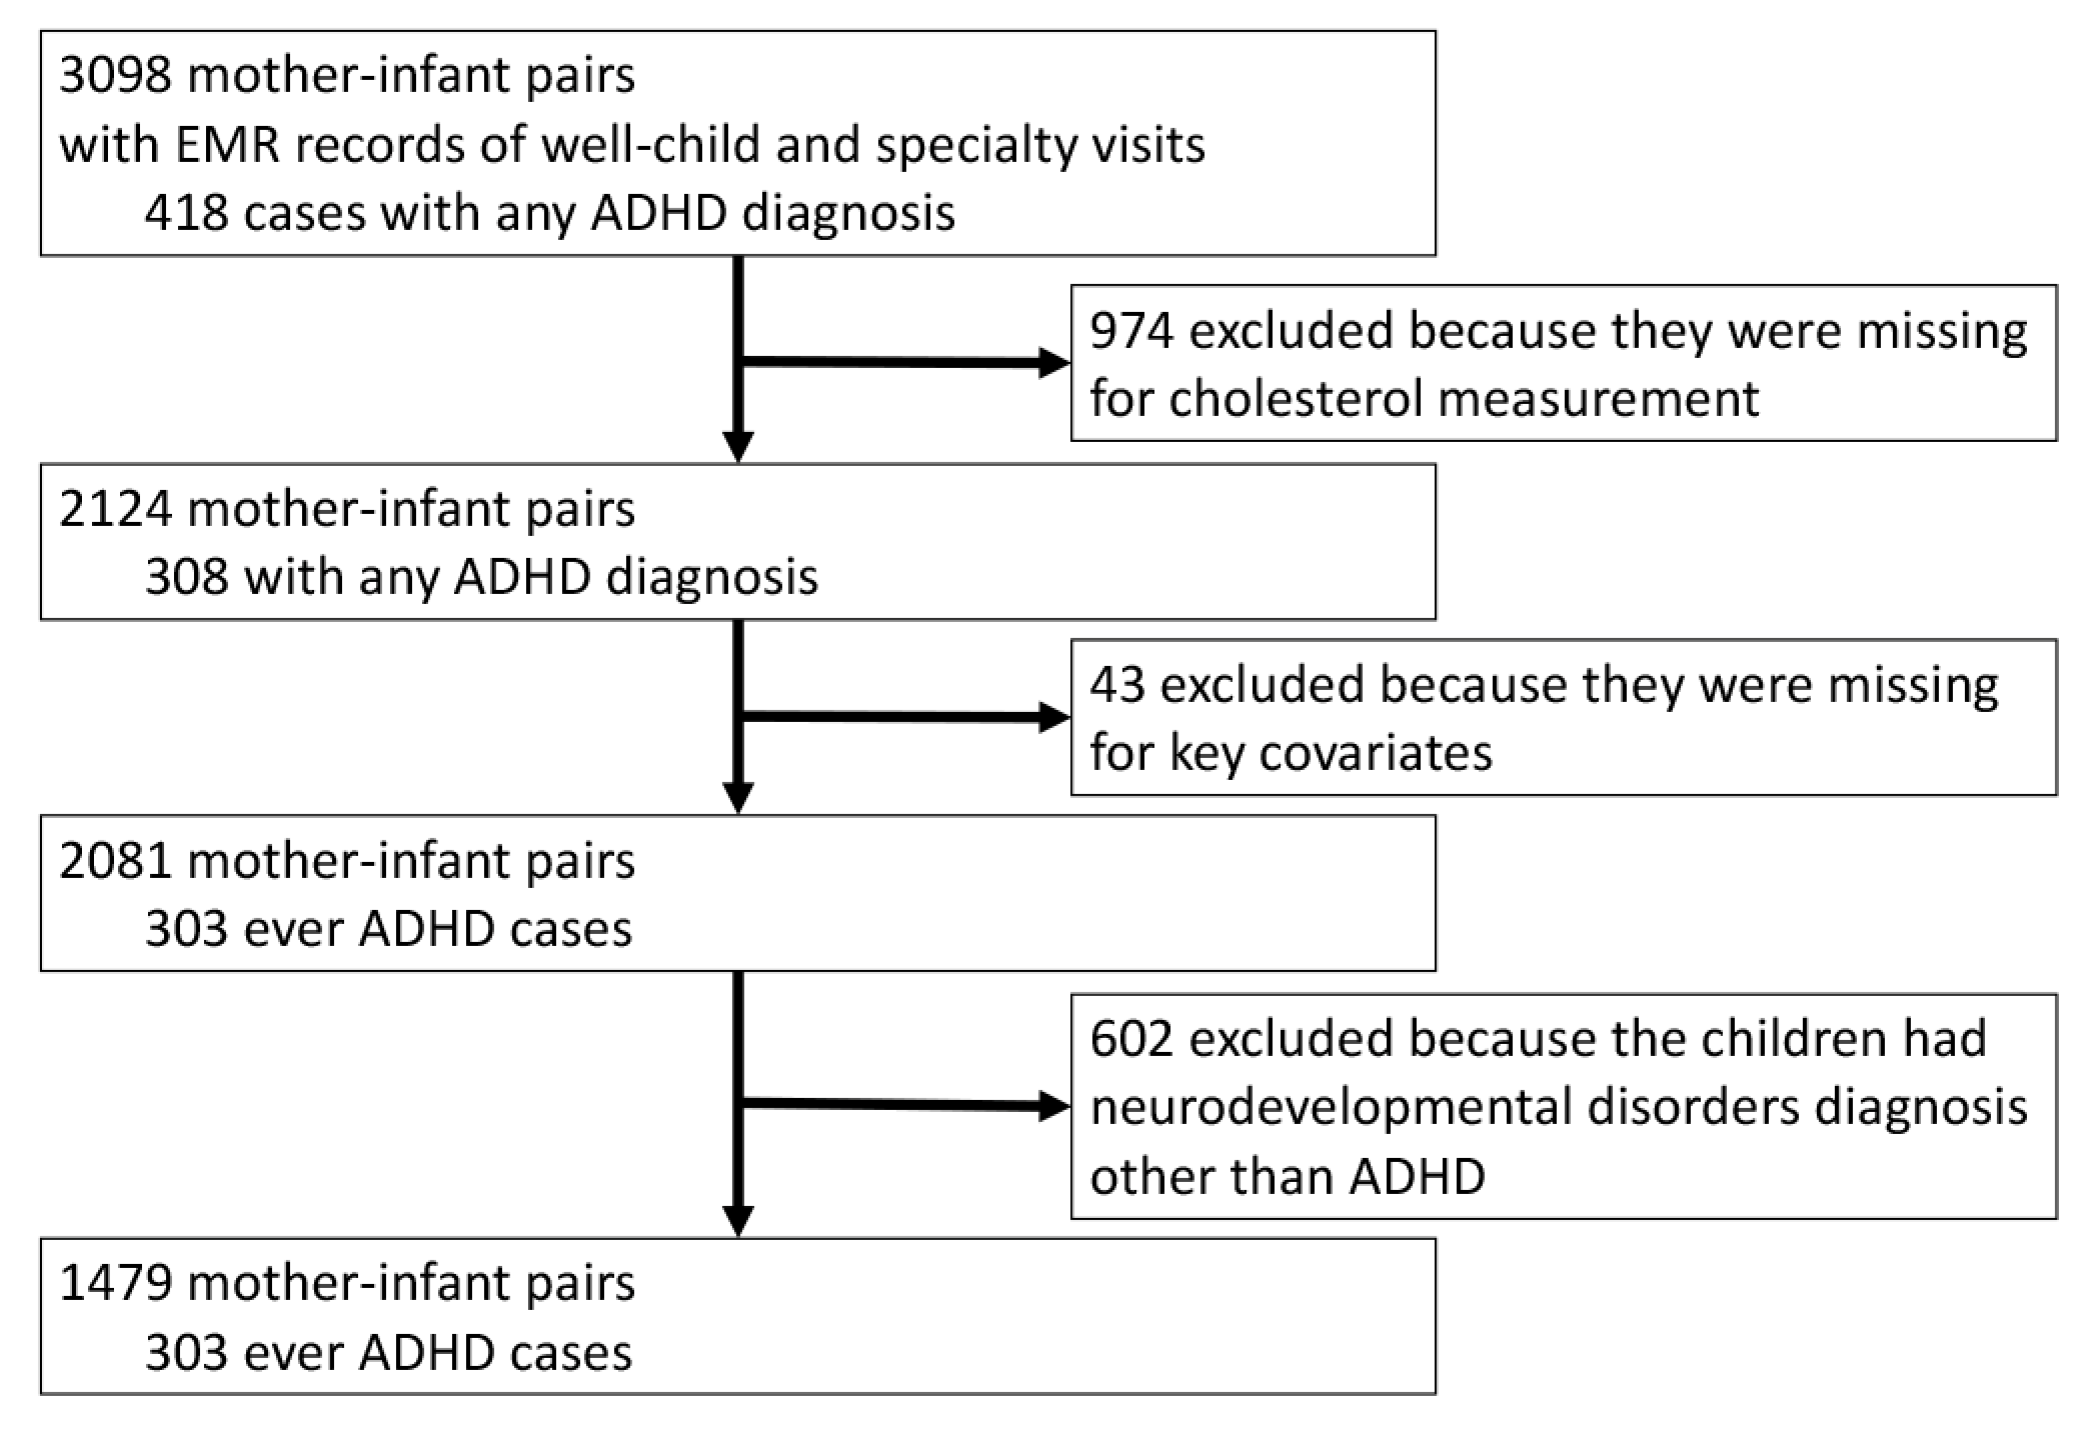
2. Materials and Methods
2.1. Study Sample
2.2. Data Collection Procedures and Measures of Key Variables
2.3. Statistical Analysis
3. Results
4. Discussion
5. Conclusions
Supplementary Materials
Acknowledgments
Author Contributions
Conflicts of Interest
References
- Pastor, P.N.; Duran, C.; Reuben, C. Quickstats: Percentage of children and adolescents aged 5–17 years with diagnosed attention-deficit/hyperactivity disorder (ADHD), by race and hispanic ethnicity—National health interview survey, united states, 1997–2014. MMWR Morb. Mortal. Wkly. Rep. 2015, 64, 925. [Google Scholar]
- Visser, S.N.; Danielson, M.L.; Bitsko, R.H.; Holbrook, J.R.; Kogan, M.D.; Ghandour, R.M.; Perou, R.; Blumberg, S.J. Trends in the parent-report of health care provider-diagnosed and medicated attention-deficit/hyperactivity disorder: United states, 2003–2011. J. Am. Acad. Child Adolesc. Psychiatry 2014, 53, 34–46. [Google Scholar] [CrossRef] [PubMed]
- Faraone, S.V.; Sergeant, J.; Gillberg, C.; Biederman, J. The worldwide prevalence of adhd: Is it an american condition? World Psychiatry 2003, 2, 104–113. [Google Scholar] [PubMed]
- Barkley, R.A. Attention-Deficit Hyperactivity Disorder: A Handbook for Diagnosis and Treatment; Guilford Publications: New York, NY, USA, 2014. [Google Scholar]
- Childress, A.C.; Berry, S.A. Pharmacotherapy of attention-deficit hyperactivity disorder in adolescents. Drugs 2012, 72, 309–325. [Google Scholar] [CrossRef] [PubMed]
- Stergiakouli, E.; Thapar, A. Fitting the pieces together: Current research on the genetic basis of attention-deficit/hyperactivity disorder (adhd). Neuropsychiatr. Dis. Treat. 2010, 6, 551–560. [Google Scholar] [CrossRef] [PubMed]
- Getahun, D.; Jacobsen, S.J.; Fassett, M.J.; Chen, W.; Demissie, K.; Rhoads, G.G. Recent trends in childhood attention-deficit/hyperactivity disorder. JAMA Pediatr. 2013, 167, 282–288. [Google Scholar] [CrossRef] [PubMed]
- Mannuzza, S.; Klein, R.G. Long-term prognosis in attention-deficit/hyperactivity disorder. Child Adolesc. Psychiatr. Clin. N. Am. 2000, 9, 711–726. [Google Scholar] [PubMed]
- Pelham, W.E.; Foster, E.M.; Robb, J.A. The economic impact of attention-deficit/hyperactivity disorder in children and adolescents. J. Pediatr. Psychol. 2007, 32, 711–727. [Google Scholar] [CrossRef] [PubMed]
- Schappert, S.M.; Rechtsteiner, E.A. Ambulatory medical care utilization estimates for 2006. Natl. Health Stat. Rep. 2008, 8, 1–29. [Google Scholar]
- Biederman, J. Attention-deficit/hyperactivity disorder: A selective overview. Biol. Psychiatry 2005, 57, 1215–1220. [Google Scholar] [CrossRef] [PubMed]
- Faraone, S.V.; Perlis, R.H.; Doyle, A.E.; Smoller, J.W.; Goralnick, J.J.; Holmgren, M.A.; Sklar, P. Molecular genetics of attention-deficit/hyperactivity disorder. Biol. Psychiatry 2005, 57, 1313–1323. [Google Scholar] [CrossRef] [PubMed]
- Patterson, G.R.; DeGarmo, D.; Forgatch, M.S. Systematic changes in families following prevention trials. J. Abnorm. Child Psychol. 2004, 32, 621–633. [Google Scholar] [CrossRef] [PubMed]
- Scott, S.; O’Connor, T.G.; Futh, A.; Matias, C.; Price, J.; Doolan, M. Impact of a parenting program in a high-risk, multi-ethnic community: The pals trial. J. Child Psychol. Psychiatry 2010, 51, 1331–1341. [Google Scholar] [CrossRef] [PubMed]
- Jaffee, S.R.; Caspi, A.; Moffitt, T.E.; Polo-Tomas, M.; Price, T.S.; Taylor, A. The limits of child effects: Evidence for genetically mediated child effects on corporal punishment but not on physical maltreatment. Dev. Psychol. 2004, 40, 1047–1058. [Google Scholar] [CrossRef] [PubMed]
- Costello, E.J.; Compton, S.N.; Keeler, G.; Angold, A. Relationships between poverty and psychopathology: A natural experiment. JAMA 2003, 290, 2023–2029. [Google Scholar] [CrossRef] [PubMed]
- Langley, K.; Rice, F.; van den Bree, M.B.; Thapar, A. Maternal smoking during pregnancy as an environmental risk factor for attention deficit hyperactivity disorder behaviour. A review. Minerva Pediatr. 2005, 57, 359–371. [Google Scholar] [PubMed]
- Linnet, K.M.; Dalsgaard, S.; Obel, C.; Wisborg, K.; Henriksen, T.B.; Rodriguez, A.; Kotimaa, A.; Moilanen, I.; Thomsen, P.H.; Olsen, J.; et al. Maternal lifestyle factors in pregnancy risk of attention deficit hyperactivity disorder and associated behaviors: Review of the current evidence. Am. J. Psychiatry 2003, 160, 1028–1040. [Google Scholar] [CrossRef] [PubMed]
- Glover, V. Annual research review: Prenatal stress and the origins of psychopathology: An evolutionary perspective. J. Child Psychol. Psychiatry 2011, 52, 356–367. [Google Scholar] [CrossRef] [PubMed]
- Grizenko, N.; Shayan, Y.R.; Polotskaia, A.; Ter-Stepanian, M.; Joober, R. Relation of maternal stress during pregnancy to symptom severity and response to treatment in children with ADHD. J. Psychiatry Neurosci. 2008, 33, 10–16. [Google Scholar] [PubMed]
- Pheula, G.F.; Rohde, L.A.; Schmitz, M. Are family variables associated with ADHD, inattentive type? A case-control study in schools. Eur. Child Adolesc. Psychiatry 2011, 20, 137–145. [Google Scholar] [CrossRef] [PubMed]
- Scahill, L.; Schwab-Stone, M.; Merikangas, K.R.; Leckman, J.F.; Zhang, H.; Kasl, S. Psychosocial and clinical correlates of ADHD in a community sample of school-age children. J. Am. Acad. Child Adolesc. Psychiatry 1999, 38, 976–984. [Google Scholar] [CrossRef] [PubMed]
- Lifford, K.J.; Harold, G.T.; Thapar, A. Parent-child relationships and ADHD symptoms: A longitudinal analysis. J. Abnorm. Child Psychol. 2008, 36, 285–296. [Google Scholar] [CrossRef] [PubMed]
- O’Connor, T.G.; Rutter, M. Attachment disorder behavior following early severe deprivation: Extension and longitudinal follow-up. English and romanian adoptees study team. J. Am. Acad. Child Adolesc. Psychiatry 2000, 39, 703–712. [Google Scholar] [CrossRef] [PubMed]
- Rutter, M.; Beckett, C.; Castle, J.; Colvert, E.; Kreppner, J.; Mehta, M.; Stevens, S.; Sonuga-Barke, E. Effects of profound early institutional deprivation: An overview of findings from a UK longitudinal study of romanian adoptees. Eur. J. Dev. Psychol. 2007, 4, 332–350. [Google Scholar] [CrossRef]
- Bhutta, A.T.; Cleves, M.A.; Casey, P.H.; Cradock, M.M.; Anand, K.J. Cognitive and behavioral outcomes of school-aged children who were born preterm: A meta-analysis. JAMA 2002, 288, 728–737. [Google Scholar] [CrossRef] [PubMed]
- Bouchard, M.F.; Bellinger, D.C.; Wright, R.O.; Weisskopf, M.G. Attention-deficit/hyperactivity disorder and urinary metabolites of organophosphate pesticides. Pediatrics 2010, 125, e1270–e1277. [Google Scholar] [CrossRef] [PubMed]
- Eubig, P.A.; Aguiar, A.; Schantz, S.L. Lead and PCBs as risk factors for attention deficit/hyperactivity disorder. Environ. Health Perspect. 2010, 118, 1654–1667. [Google Scholar] [CrossRef] [PubMed]
- Sagiv, S.K.; Thurston, S.W.; Bellinger, D.C.; Tolbert, P.E.; Altshul, L.M.; Korrick, S.A. Prenatal organochlorine exposure and behaviors associated with attention deficit hyperactivity disorder in school-aged children. Am. J. Epidemiol. 2010, 171, 593–601. [Google Scholar] [CrossRef] [PubMed]
- Braun, J.M.; Kahn, R.S.; Froehlich, T.; Auinger, P.; Lanphear, B.P. Exposures to environmental toxicants and attention deficit hyperactivity disorder in u.S. Children. Environ. Health Perspect. 2006, 114, 1904–1909. [Google Scholar] [PubMed]
- Froehlich, T.E.; Lanphear, B.P.; Auinger, P.; Hornung, R.; Epstein, J.N.; Braun, J.; Kahn, R.S. Association of tobacco and lead exposures with attention-deficit/hyperactivity disorder. Pediatrics 2009, 124, e1054–e1063. [Google Scholar] [CrossRef] [PubMed]
- Nigg, J.T.; Nikolas, M.; Mark Knottnerus, G.; Cavanagh, K.; Friderici, K. Confirmation and extension of association of blood lead with attention-deficit/hyperactivity disorder (ADHD) and ADHD symptom domains at population-typical exposure levels. J. Child Psychol. Psychiatry 2010, 51, 58–65. [Google Scholar] [CrossRef] [PubMed]
- Li, M.; Fallin, M.D.; Riley, A.; Landa, R.; Walker, S.O.; Silverstein, M.; Caruso, D.; Pearson, C.; Kiang, S.; Dahm, J.L.; et al. The association of maternal obesity and diabetes with autism and other developmental disabilities. Pediatrics 2016, 137, e20152206. [Google Scholar] [CrossRef] [PubMed]
- Rodriguez, A.; Miettunen, J.; Henriksen, T.B.; Olsen, J.; Obel, C.; Taanila, A.; Ebeling, H.; Linnet, K.M.; Moilanen, I.; Jarvelin, M.R. Maternal adiposity prior to pregnancy is associated with adhd symptoms in offspring: Evidence from three prospective pregnancy cohorts. Int. J. Obes. (Lond) 2008, 32, 550–557. [Google Scholar] [CrossRef] [PubMed]
- Alberts, B.; Johnson, A.; Lewis, J.; Raff, M.; Roberts, K.; Walter, P. Molecular biology of the cell. In Classic Textbook Now in Its 5th Edition; Garland Science: New York, NY, USA, 2002. [Google Scholar]
- Dietschy, J.M.; Turley, S.D. Cholesterol metabolism in the brain. Curr. Opin. Lipidol. 2001, 12, 105–112. [Google Scholar] [CrossRef] [PubMed]
- Dietschy, J.M.; Turley, S.D. Thematic review series: Brain lipids. Cholesterol metabolism in the central nervous system during early development and in the mature animal. J. Lipid Res. 2004, 45, 1375–1397. [Google Scholar] [CrossRef] [PubMed]
- Woollett, L.A. Maternal cholesterol in fetal development: Transport of cholesterol from the maternal to the fetal circulation. Am. J. Clin. Nutr. 2005, 82, 1155–1161. [Google Scholar] [PubMed]
- Schmid, K.E.; Davidson, W.S.; Myatt, L.; Woollett, L.A. Transport of cholesterol across a bewo cell monolayer: Implications for net transport of sterol from maternal to fetal circulation. J. Lipid Res. 2003, 44, 1909–1918. [Google Scholar] [CrossRef] [PubMed]
- Wyne, K.L.; Woollett, L.A. Transport of maternal LDL and HDL to the fetal membranes and placenta of the golden syrian hamster is mediated by receptor-dependent and receptor-independent processes. J. Lipid Res. 1998, 39, 518–530. [Google Scholar] [PubMed]
- Hayashi, H. Lipid metabolism and glial lipoproteins in the central nervous system. Biol. Pharm. Bull. 2011, 34, 453–461. [Google Scholar] [CrossRef] [PubMed]
- Lippi, G.; Albiero, A.; Montagnana, M.; Salvagno, G.L.; Scevarolli, S.; Franchi, M.; Guidi, G.C. Lipid and lipoprotein profile in physiological pregnancy. Clin. Lab. 2007, 53, 173–177. [Google Scholar] [PubMed]
- Scifres, C.M.; Catov, J.M.; Simhan, H.N. The impact of maternal obesity and gestational weight gain on early and mid-pregnancy lipid profiles. Obesity (Silver Spring) 2014, 22, 932–938. [Google Scholar] [CrossRef] [PubMed]
- An-Na, C.; Man-Li, Y.; Jeng-Hsiu, H.; Pesus, C.; Shin-Kuo, S.; Heung-Tat, N. Alterations of serum lipid levels and their biological relevances during and after pregnancy. Life Sci. 1995, 56, 2367–2375. [Google Scholar] [CrossRef]
- Van Exel, E.; de Craen, A.J.; Gussekloo, J.; Houx, P.; Bootsma-van der Wiel, A.; Macfarlane, P.W.; Blauw, G.J.; Westendorp, R.G. Association between high-density lipoprotein and cognitive impairment in the oldest old. Ann. Neurol. 2002, 51, 716–721. [Google Scholar] [CrossRef] [PubMed]
- Muckle, T.J.; Roy, J.R. High-density lipoprotein cholesterol in differential diagnosis of senile dementia. Lancet 1985, 1, 1191–1193. [Google Scholar] [CrossRef]
- Merched, A.; Xia, Y.; Visvikis, S.; Serot, J.; Siest, G. Decreased high-density lipoprotein cholesterol and serum apolipoprotein AI concentrations are highly correlated with the severity of Alzheimer’s disease. Neurobiol. Aging 2000, 21, 27–30. [Google Scholar] [CrossRef]
- Wang, G.; Divall, S.; Radovick, S.; Paige, D.; Ning, Y.; Chen, Z.; Ji, Y.; Hong, X.; Walker, S.O.; Caruso, D.; et al. Preterm birth and random plasma insulin levels at birth and in early childhood. JAMA 2014, 311, 587–596. [Google Scholar] [CrossRef] [PubMed]
- Wang, X.; Zuckerman, B.; Pearson, C.; Kaufman, G.; Chen, C.; Wang, G.; Niu, T.; Wise, P.H.; Bauchner, H.; Xu, X. Maternal cigarette smoking, metabolic gene polymorphism, and infant birth weight. JAMA 2002, 287, 195–202. [Google Scholar] [CrossRef] [PubMed]
- Kumar, R.; Tsai, H.J.; Hong, X.; Liu, X.; Wang, G.; Pearson, C.; Ortiz, K.; Fu, M.; Pongracic, J.A.; Bauchner, H.; et al. Race, ancestry, and development of food-allergen sensitization in early childhood. Pediatrics 2011, 128, e821–e829. [Google Scholar] [CrossRef] [PubMed]
- Zhang, S.; Liu, X.; Necheles, J.; Tsai, H.-J.; Wang, G.; Wang, B.; Xing, H.; Li, Z.; Liu, X.; Zang, T. Genetic and environmental influences on serum lipid tracking: A population-based, longitudinal Chinese twin study. Pediatr. Res. 2010, 68, 316–322. [Google Scholar] [CrossRef] [PubMed]
- Raghavan, R.; Riley, A.W.; Volk, H.; Caruso, D.; Hironaka, L.; Sices, L.; Hong, X.; Wang, G.; Ji, Y.; Brucato, M. Maternal multivitamin intake, plasma folate and vitamin B12 levels and autism spectrum disorder risk in offspring. Paediatr. Perinat. Epidemiol. 2017. [Google Scholar] [CrossRef] [PubMed]
- Brucato, M.; Ladd-Acosta, C.; Li, M.; Caruso, D.; Hong, X.; Kaczaniuk, J.; Stuart, E.A.; Fallin, M.D.; Wang, X. Prenatal exposure to fever is associated with autism spectrum disorder in the boston birth cohort. Autism Res. 2017, 10, 1878–1890. [Google Scholar] [CrossRef] [PubMed]
- Miller, M.; Stone, N.J.; Ballantyne, C.; Bittner, V.; Criqui, M.H.; Ginsberg, H.N.; Goldberg, A.C.; Howard, W.J.; Jacobson, M.S.; Kris-Etherton, P.M.; et al. Triglycerides and cardiovascular disease: A scientific statement from the American heart association. Circulation 2011, 123, 2292–2333. [Google Scholar] [CrossRef] [PubMed]
- Program, N.C.E. Expert panel on detection, evaluation, and treatment of high blood cholesterol in adults (adult treatment panel iii): Third report of the national cholesterol education program (NCEP) expert panel on detection, evaluation, and treatment of high blood cholesterol in adults (adult treatment panel iii) final report. Circulation 2002, 106, 3143–3421. [Google Scholar]
- Bjorkhem, I.; Meaney, S. Brain cholesterol: Long secret life behind a barrier. Arterioscler. Thromb. Vasc. Biol. 2004, 24, 806–815. [Google Scholar] [CrossRef] [PubMed]
- Vitali, C.; Wellington, C.L.; Calabresi, L. HDL and cholesterol handling in the brain. Cardiovasc. Res. 2014, 103, 405–413. [Google Scholar] [CrossRef] [PubMed]
- Zlokovic, B.V. The blood-brain barrier in health and chronic neurodegenerative disorders. Neuron 2008, 57, 178–201. [Google Scholar] [CrossRef] [PubMed]
- Balazs, Z.; Panzenboeck, U.; Hammer, A.; Sovic, A.; Quehenberger, O.; Malle, E.; Sattler, W. Uptake and transport of high-density lipoprotein (HDL) and HDL-associated alpha-tocopherol by an in vitro blood-brain barrier model. J. Neurochem. 2004, 89, 939–950. [Google Scholar] [CrossRef] [PubMed]
- Koch, S.; Donarski, N.; Goetze, K.; Kreckel, M.; Stuerenburg, H.J.; Buhmann, C.; Beisiegel, U. Characterization of four lipoprotein classes in human cerebrospinal fluid. J. Lipid Res. 2001, 42, 1143–1151. [Google Scholar] [PubMed]
- Demeester, N.; Castro, G.; Desrumaux, C.; de Geitere, C.; Fruchart, J.C.; Santens, P.; Mulleners, E.; Engelborghs, S.; de Deyn, P.P.; Vandekerckhove, J.; et al. Characterization and functional studies of lipoproteins, lipid transfer proteins, and lecithin: Cholesterol acyltransferase in CSF of normal individuals and patients with Alzheimer’s disease. J. Lipid Res. 2000, 41, 963–974. [Google Scholar] [PubMed]
- Björkhem, I. Crossing the barrier: Oxysterols as cholesterol transporters and metabolic modulators in the brain. J. Intern. Med. 2006, 260, 493–508. [Google Scholar] [CrossRef] [PubMed]
- Calabresi, L.; Gomaraschi, M.; Franceschini, G. Endothelial protection by high-density lipoproteins: From bench to bedside. Arterioscler. Thromb. Vasc. Biol. 2003, 23, 1724–1731. [Google Scholar] [CrossRef] [PubMed]
- Banks, W.A.; Coon, A.B.; Robinson, S.M.; Moinuddin, A.; Shultz, J.M.; Nakaoke, R.; Morley, J.E. Triglycerides induce leptin resistance at the blood-brain barrier. Diabetes 2004, 53, 1253–1260. [Google Scholar] [CrossRef] [PubMed]
- Morrison, C.D. Leptin signaling in brain: A link between nutrition and cognition? Biochim. Biophys. Acta 2009, 1792, 401–408. [Google Scholar] [CrossRef] [PubMed]
- Eriksson, J.G.; Kajantie, E.; Osmond, C.; Thornburg, K.; Barker, D.J. Boys live dangerously in the womb. Am. J. Hum. Biol. 2010, 22, 330–335. [Google Scholar] [CrossRef] [PubMed]
- Ravelli, A.C.; van Der Meulen, J.H.; Osmond, C.; Barker, D.J.; Bleker, O.P. Obesity at the age of 50 y in men and women exposed to famine prenatally. Am. J. Clin. Nutr. 1999, 70, 811–816. [Google Scholar] [PubMed]
- Grigore, D.; Ojeda, N.B.; Alexander, B.T. Sex differences in the fetal programming of hypertension. Gend. Med. 2008, 5 (Suppl. A), S121–S132. [Google Scholar] [CrossRef] [PubMed]
- Ozaki, T.; Nishina, H.; Hanson, M.A.; Poston, L. Dietary restriction in pregnant rats causes gender-related hypertension and vascular dysfunction in offspring. J. Physiol. 2001, 530, 141–152. [Google Scholar] [CrossRef] [PubMed]
- Woods, L.L.; Ingelfinger, J.R.; Rasch, R. Modest maternal protein restriction fails to program adult hypertension in female rats. Am. J. Physiol. Regul. Integr. Comp. Physiol. 2005, 289, R1131–R1136. [Google Scholar] [CrossRef] [PubMed]
- Suzuki, R.; Lee, K.; Jing, E.; Biddinger, S.B.; McDonald, J.G.; Montine, T.J.; Craft, S.; Kahn, C.R. Diabetes and insulin in regulation of brain cholesterol metabolism. Cell Metab. 2010, 12, 567–579. [Google Scholar] [CrossRef] [PubMed]
- American Psychiatric Association. Using DSM-5 in the Transition to ICD-10. Available online: https://www.psychiatry.org/psychiatrists/practice/dsm/icd-10 (accessed on 22 October 2017).
- American Psychiatric Association. Diagnostic and Statistical Manual of Mental Disorders (dsm-5®); American Psychiatric Pub.: Washington, DC, USA, 2013. [Google Scholar]


| Variable | Total, No. (%) | NT, No. (%) | ADHD, No. (%) | p-Value ǂ |
|---|---|---|---|---|
| Total | 1479 (100) | 1176 (79.5) | 303 (20.5) | |
| Maternal Age | 0.317 | |||
| <20 | 148 (10.0) | 111 (9.4) | 37 (12.2) | |
| 20–34 | 1080 (73.0) | 867 (73.8) | 213 (70.3) | |
| ≥35 | 251 (17.0) | 198 (16.8) | 53 (17.5) | |
| Education level | 0.022 | |||
| Below college degree | 1278 (86.4) | 1004 (85.4) | 274 (90.4) | |
| College degree or above | 201 (13.6) | 172 (14.6) | 29 (9.6) | |
| Race-ethnicity | 0.230 | |||
| Black | 968 (65.5) | 759 (64.5) | 209 (69.0) | |
| White | 74 (5.0) | 56 (4.8) | 18 (5.9) | |
| Hispanic | 357 (24.1) | 293 (24.9) | 64 (21.1) | |
| Others | 80 (5.4) | 68 (5.8) | 12 (4.0) | |
| Parity | 0.901 | |||
| Nulliparous | 625 (42.3) | 496 (42.2) | 129 (42.6) | |
| Multiparous | 854 (57.7) | 680 (57.8) | 174 (57.4) | |
| Smoking during pregnancy | <0.001 | |||
| Never | 1229 (83.1) | 998 (84.9) | 231 (76.2) | |
| Quitter | 111 (7.5) | 72 (6.1) | 39 (12.9) | |
| Continuous | 139 (9.4) | 106 (9.0) | 33 (10.9) | |
| Intrauterine infection | 0.060 | |||
| No | 1292 (87.4) | 1037 (88.2) | 255 (84.2) | |
| Yes | 187 (12.6) | 139 (11.8) | 48 (15.8) | |
| Child’s sex | <0.001 | |||
| Female | 749 (50.6) | 664 (56.5) | 85 (28.1) | |
| Male | 730 (49.4) | 512 (43.5) | 218 (71.9) | |
| Delivery type | 0.008 | |||
| C-section | 500 (33.8) | 378 (32.1) | 122 (40.3) | |
| Vaginal | 979 (66.2) | 798 (67.9) | 181 (59.7) | |
| Season of child’s birth | 0.797 | |||
| Jan to March | 333 (22.5) | 264 (22.5) | 69 (22.8) | |
| April to June | 350 (23.7) | 279 (23.7) | 71 (23.4) | |
| July to September | 402 (27.2) | 314 (26.7) | 88 (29.0) | |
| October to December | 394 (26.6) | 319 (27.1) | 75 (24.8) | |
| Preterm birth (<37 weeks) | 0.005 | |||
| No | 1125 (76.1) | 913 (77.6) | 212 (70.0) | |
| Yes | 354 (23.9) | 263 (22.4) | 91 (30.0) | |
| Low birthweight (<2500 g) | 0.028 | |||
| No | 1148 (77.6) | 927 (78.8) | 221 (72.9) | |
| Yes | 331 (22.4) | 249 (21.2) | 82 (27.1) | |
| Gestational age, week | <0.001 | |||
| Mean (SD) | 38.1 (3.1) | 38.2 (2.9) | 37.5 (3.8) | |
| Birthweight, g | 0.007 | |||
| Mean (SD) | 2996.7 (754.0) | 3023.3 (716.4) | 2893.5 (878.9) | |
| Maternal TC, mg/dL | 0.018 | |||
| Mean (SD) | 219.6 (60.9) | 221.5 (61.3) | 212.2 (58.9) | |
| Maternal TG, mg/dL | 0.838 | |||
| Mean (SD) | 191.9 (80.6) | 192.2 (80.1) | 191.1 (83.0) | |
| Maternal HDL, mg/dL | <0.001 | |||
| Mean (SD) | 62.0 (17.6) | 62.8 (17.9) | 58.8 (15.8) | |
| Maternal LDL, mg/dL | 0.011 | |||
| Mean (SD) | 126.6 (41.8) | 128.0 (42.1) | 121.2 (39.9) | |
| Age of child, years | <0.001 | |||
| Mean (SD) | 10.6 (3.3) | 10.3 (3.3) | 11.7 (3.2) |
| Maternal Cholesterols | ADHD, No. (%) | NT, No. (%) | Crude OR | 95% CI | p-Value | Adjusted OR | 95% CI | p-Value | |||
|---|---|---|---|---|---|---|---|---|---|---|---|
| HDL clinical cut-off | ≥50 mg/dL | 213 (19.2) | 898 (80.8) | 1.00 | 1.00 | ||||||
| <50 mg/dL | 90 (24.5) | 278 (75.5) | 1.36 | 1.03 | 1.81 | 0.030 | 1.30 | 0.96 | 1.74 | 0.085 | |
| HDL quartiles | Q4 (>73 mg/dL) | 55 (15.3) | 304 (84.7) | 1.00 | 1.00 | ||||||
| Q3 (61–73 mg/dL) | 67 (18.1) | 304 (81.9) | 1.22 | 0.82 | 1.80 | 0.322 | 1.11 | 0.74 | 1.67 | 0.606 | |
| Q2 (50–60 mg/dL) | 91 (23.9) | 290 (76.1) | 1.73 | 1.20 | 2.51 | 0.004 | 1.42 | 0.96 | 2.09 | 0.079 | |
| Q1 (<50 mg/dL) | 90 (24.5) | 278 (75.5) | 1.79 | 1.23 | 2.60 | 0.002 | 1.54 | 1.04 | 2.28 | 0.031 | |
| HDL binary | >median (60 mg/dL) | 122 (16.7) | 608 (83.3) | 1.00 | 1.00 | ||||||
| ≤median (60 mg/dL) | 181 (24.2) | 568 (75.8) | 1.59 | 1.23 | 2.05 | <0.001 | 1.39 | 1.06 | 1.82 | 0.016 | |
| HDL linear trend (every 20 mg/dL increase) | 303 (20.5) | 1176 (79.5) | 0.76 | 0.65 | 0.88 | <0.001 | 0.81 | 0.69 | 0.95 | 0.011 | |
| TG clinical cut-off | <200 mg/dL | 184 (19.8) | 744 (80.2) | 1.00 | 1.00 | ||||||
| ≥200 mg/dL | 119 (21.6) | 432 (78.4) | 1.11 | 0.86 | 1.44 | 0.415 | 1.26 | 0.94 | 1.68 | 0.118 | |
| TG quartiles | Q1 (<135 mg/dL) | 90 (23.9) | 287 (76.1) | 1.00 | 1.00 | ||||||
| Q2 (135–176 mg/dL) | 58 (16.3) | 297 (83.7) | 0.62 | 0.43 | 0.90 | 0.012 | 0.63 | 0.43 | 0.93 | 0.020 | |
| Q3 (177–232 mg/dL) | 76 (20.7) | 291 (79.3) | 0.83 | 0.59 | 1.18 | 0.300 | 0.88 | 0.61 | 1.27 | 0.495 | |
| Q4 (>232 mg/dL) | 79 (20.8) | 301 (79.2) | 0.84 | 0.59 | 1.18 | 0.309 | 0.98 | 0.66 | 1.44 | 0.909 | |
| TG binary | Q2 | 58 (16.3) | 297 (83.7) | 1.00 | 1.00 | ||||||
| Q1, Q3, Q4 | 245 (21.8) | 879 (78.2) | 1.43 | 1.04 | 1.96 | 0.027 | 1.51 | 1.08 | 2.10 | 0.015 | |
| TG linear trend (every 20 mg/dL increase) | 303 (20.5) | 1176 (79.5) | 1.00 | 0.97 | 1.03 | 0.838 | 1.02 | 0.98 | 1.06 | 0.348 | |
| LDL quartiles | Q1 (<96 mg/dL) | 87 (23.6) | 282 (76.4) | 1.00 | 1.00 | ||||||
| Q2 (96–121 mg/dL) | 80 (21.8) | 287 (78.2) | 0.90 | 0.64 | 1.28 | 0.565 | 0.91 | 0.63 | 1.31 | 0.603 | |
| Q3 (122–150 mg/dL) | 67 (18.2) | 301 (81.8) | 0.72 | 0.50 | 1.03 | 0.074 | 0.82 | 0.57 | 1.20 | 0.316 | |
| Q4 (>150 mg/dL) | 69 (18.4) | 306 (81.6) | 0.73 | 0.51 | 1.04 | 0.083 | 0.76 | 0.52 | 1.11 | 0.153 | |
| LDL linear trend (every 20 mg/dL increase) | 303 (20.5) | 1176 (79.5) | 0.92 | 0.87 | 0.98 | 0.011 | 0.93 | 0.87 | 0.99 | 0.033 | |
| TC quartiles | Q1 (<176 mg/dL) | 92 (24.6) | 282 (75.4) | 1.00 | 1.00 | ||||||
| Q2 (176–214 mg/dL) | 73 (20.3) | 287 (79.7) | 0.78 | 0.55 | 1.10 | 0.161 | 0.82 | 0.57 | 1.18 | 0.289 | |
| Q3 215–254 mg/dL) | 72 (19.9) | 290 (80.1) | 0.76 | 0.54 | 1.08 | 0.125 | 0.86 | 0.59 | 1.25 | 0.424 | |
| Q4 (>254 mg/dL) | 66 (17.2) | 317 (82.8) | 0.64 | 0.45 | 0.91 | 0.013 | 0.73 | 0.50 | 1.08 | 0.111 | |
| TC linear trend (every 20 mg/dL increase) | 303 (20.5) | 1176 (79.5) | 0.95 | 0.91 | 0.99 | 0.018 | 0.96 | 0.92 | 1.01 | 0.099 | |
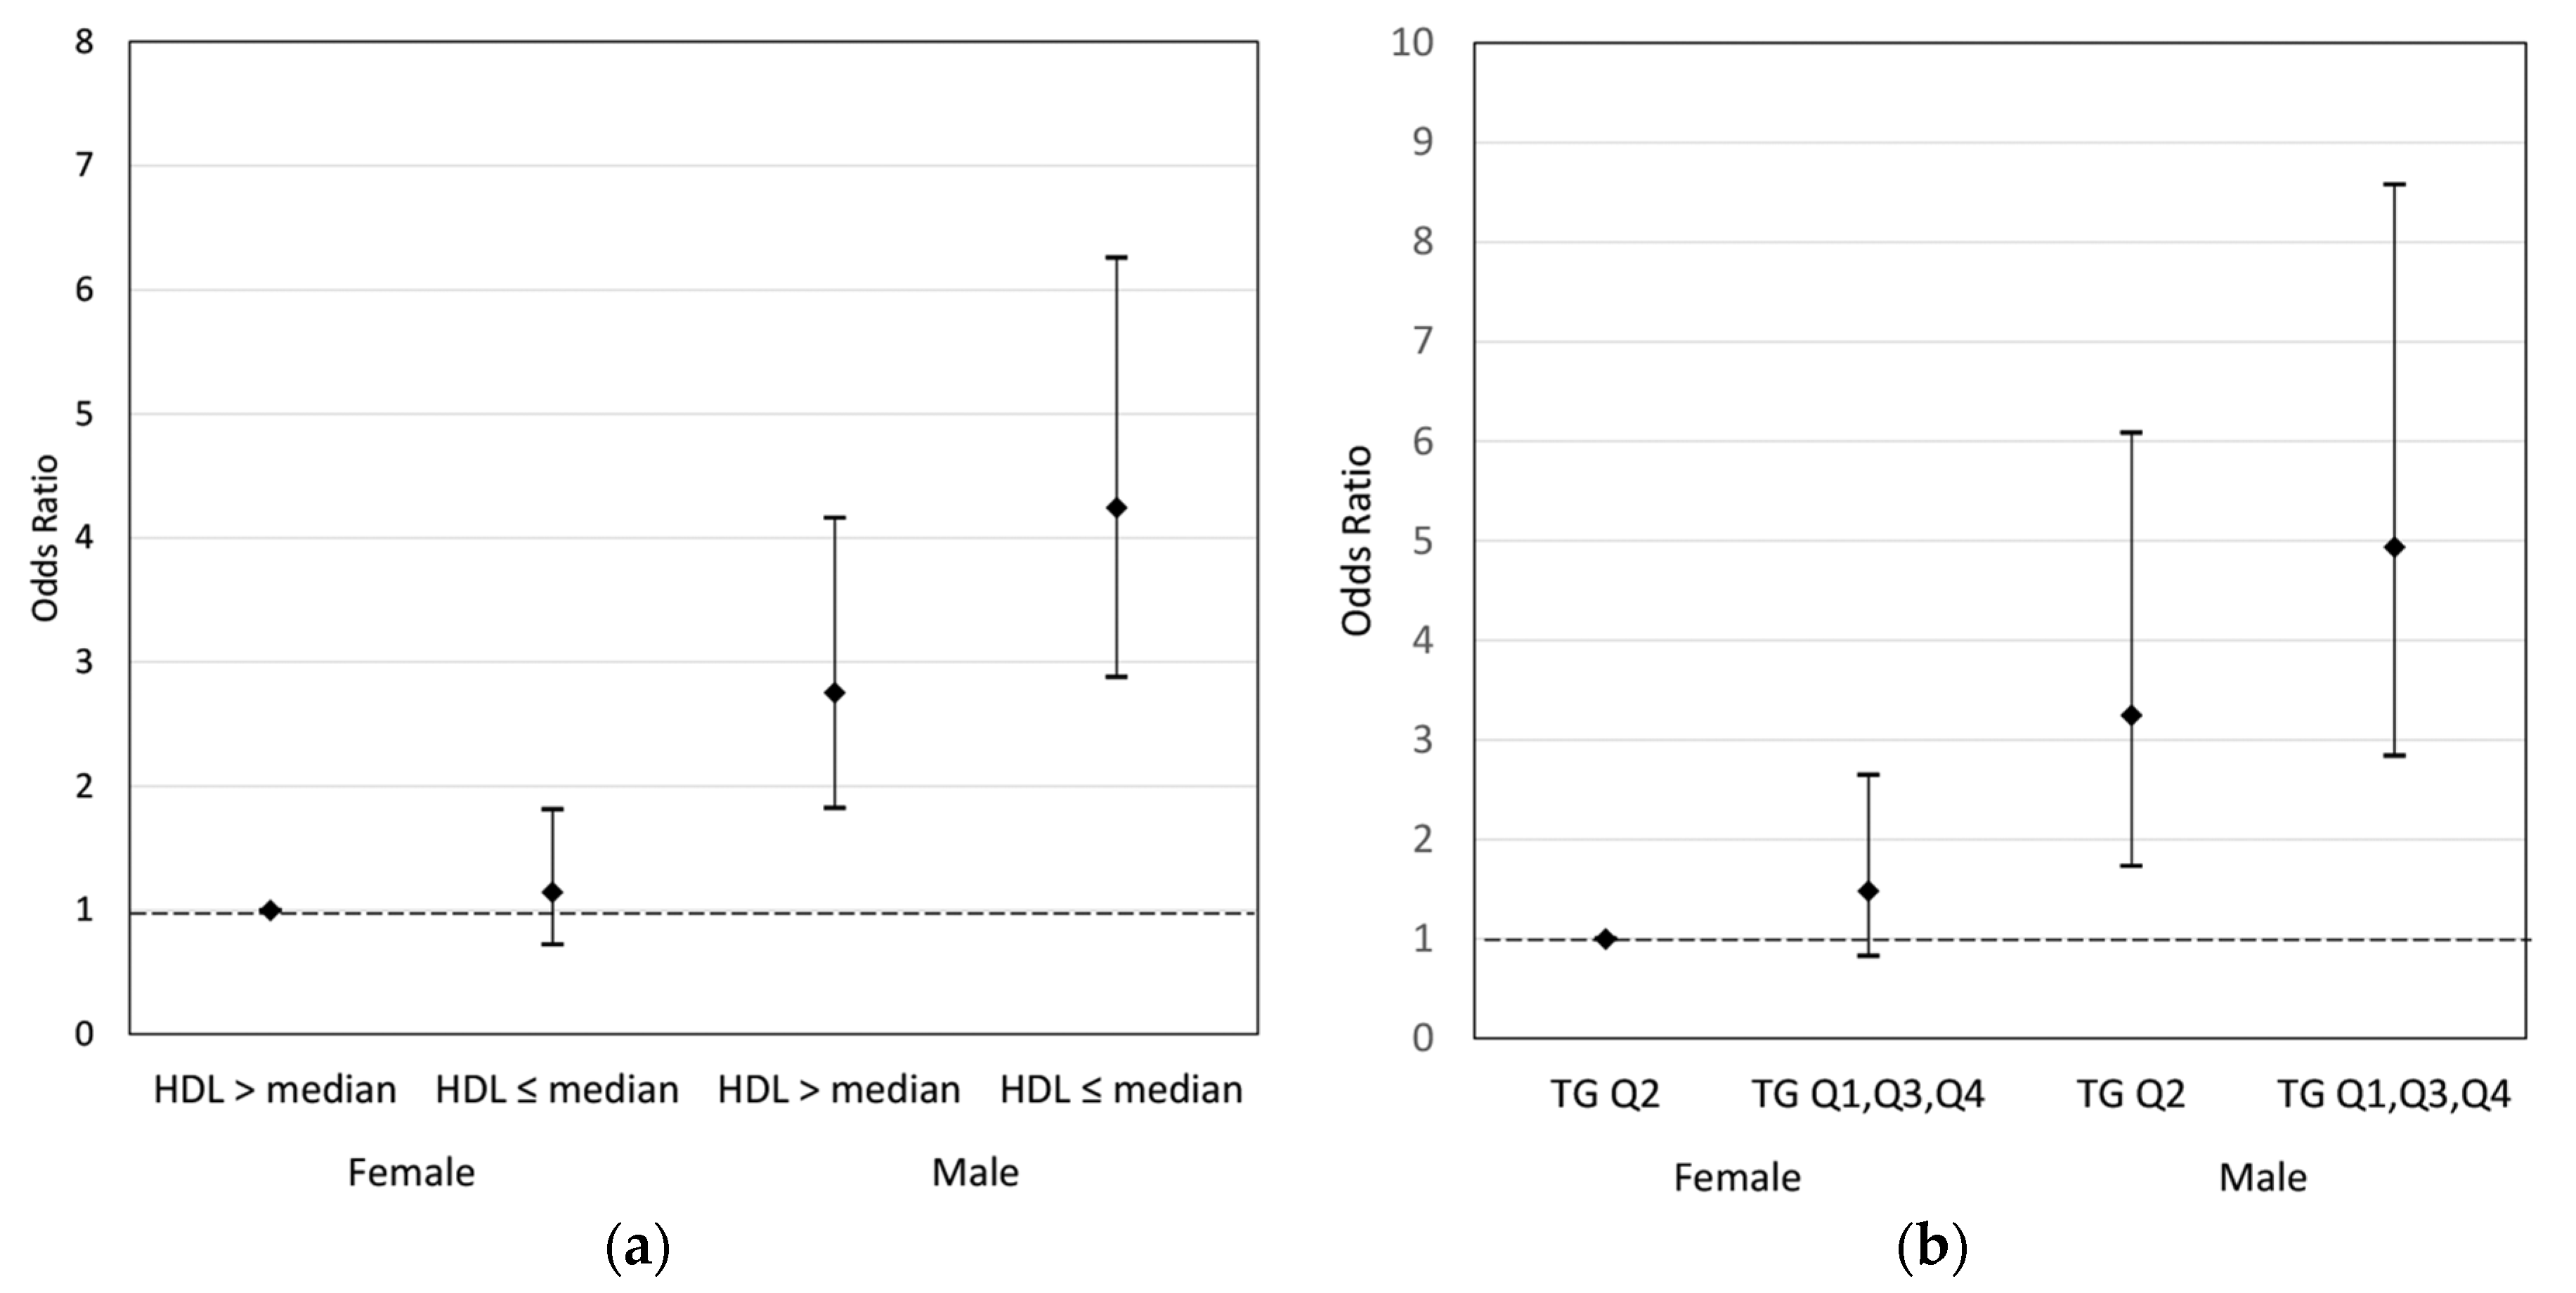
| Sex | Maternal HDL | ADHD, No. (%) | NT, No. (%) | Adjusted OR | 95% CI | p-Value | |
|---|---|---|---|---|---|---|---|
| Female | 85 (11.4) | 664 (88.6) | 1.00 | ||||
| Male | 218 (29.9) | 512 (70.1) | 3.25 | 2.45 | 4.30 | <0.001 | |
| Joint effects of maternal HDL and sex | |||||||
| Female | >median | 42 (10.5) | 359 (89.5) | 1.00 | |||
| ≤median | 43 (12.4) | 305 (87.6) | 1.14 | 0.72 | 1.81 | 0.564 | |
| Male | >median | 80 (24.3) | 249 (75.7) | 2.75 | 1.82 | 4.16 | <0.001 |
| ≤median | 138 (34.4) | 263 (65.6) | 4.25 | 2.88 | 6.26 | <0.001 | |
| Sex | Maternal TG | ADHD, No. (%) | NT, No. (%) | Adjusted OR | 95% CI | p-Value | |
|---|---|---|---|---|---|---|---|
| Female | 85 (11.4) | 664 (88.6) | 1.00 | ||||
| Male | 218 (29.9) | 512 (70.1) | 3.31 | 2.50 | 4.39 | <0.001 | |
| Joint effects of maternal TG and sex | |||||||
| Female | Q2 | 16 (8.8) | 166 (91.2) | 1.00 | |||
| Q1, Q3, Q4 | 69 (12.2) | 498 (87.8) | 1.48 | 0.83 | 2.65 | 0.184 | |
| Male | Q2 | 42 (24.3) | 131 (75.7) | 3.25 | 1.73 | 6.09 | <0.001 |
| Q1, Q3, Q4 | 176 (31.6) | 381 (68.4) | 4.94 | 2.84 | 8.58 | <0.001 | |
© 2017 by the authors. Licensee MDPI, Basel, Switzerland. This article is an open access article distributed under the terms and conditions of the Creative Commons Attribution (CC BY) license (http://creativecommons.org/licenses/by/4.0/).
Share and Cite
Ji, Y.; Riley, A.W.; Lee, L.-C.; Volk, H.; Hong, X.; Wang, G.; Angomas, R.; Stivers, T.; Wahl, A.; Ji, H.; et al. A Prospective Birth Cohort Study on Maternal Cholesterol Levels and Offspring Attention Deficit Hyperactivity Disorder: New Insight on Sex Differences. Brain Sci. 2018, 8, 3. https://doi.org/10.3390/brainsci8010003
Ji Y, Riley AW, Lee L-C, Volk H, Hong X, Wang G, Angomas R, Stivers T, Wahl A, Ji H, et al. A Prospective Birth Cohort Study on Maternal Cholesterol Levels and Offspring Attention Deficit Hyperactivity Disorder: New Insight on Sex Differences. Brain Sciences. 2018; 8(1):3. https://doi.org/10.3390/brainsci8010003
Chicago/Turabian StyleJi, Yuelong, Anne W. Riley, Li-Ching Lee, Heather Volk, Xiumei Hong, Guoying Wang, Rayris Angomas, Tom Stivers, Anastacia Wahl, Hongkai Ji, and et al. 2018. "A Prospective Birth Cohort Study on Maternal Cholesterol Levels and Offspring Attention Deficit Hyperactivity Disorder: New Insight on Sex Differences" Brain Sciences 8, no. 1: 3. https://doi.org/10.3390/brainsci8010003
APA StyleJi, Y., Riley, A. W., Lee, L.-C., Volk, H., Hong, X., Wang, G., Angomas, R., Stivers, T., Wahl, A., Ji, H., Bartell, T. R., Burd, I., Paige, D., Fallin, M. D., Zuckerman, B., & Wang, X. (2018). A Prospective Birth Cohort Study on Maternal Cholesterol Levels and Offspring Attention Deficit Hyperactivity Disorder: New Insight on Sex Differences. Brain Sciences, 8(1), 3. https://doi.org/10.3390/brainsci8010003