
Impact of Manganese on Neuronal Function: An Exploratory Multi-Omics Study on Ferroalloy Workers in Brescia, Italy


 ,
,  , ,
, , 
Abstract
1. Introduction
2. Materials and Methods
- Single molecule array (Simoa)
- Protein microarray (protein chip)
3. Results
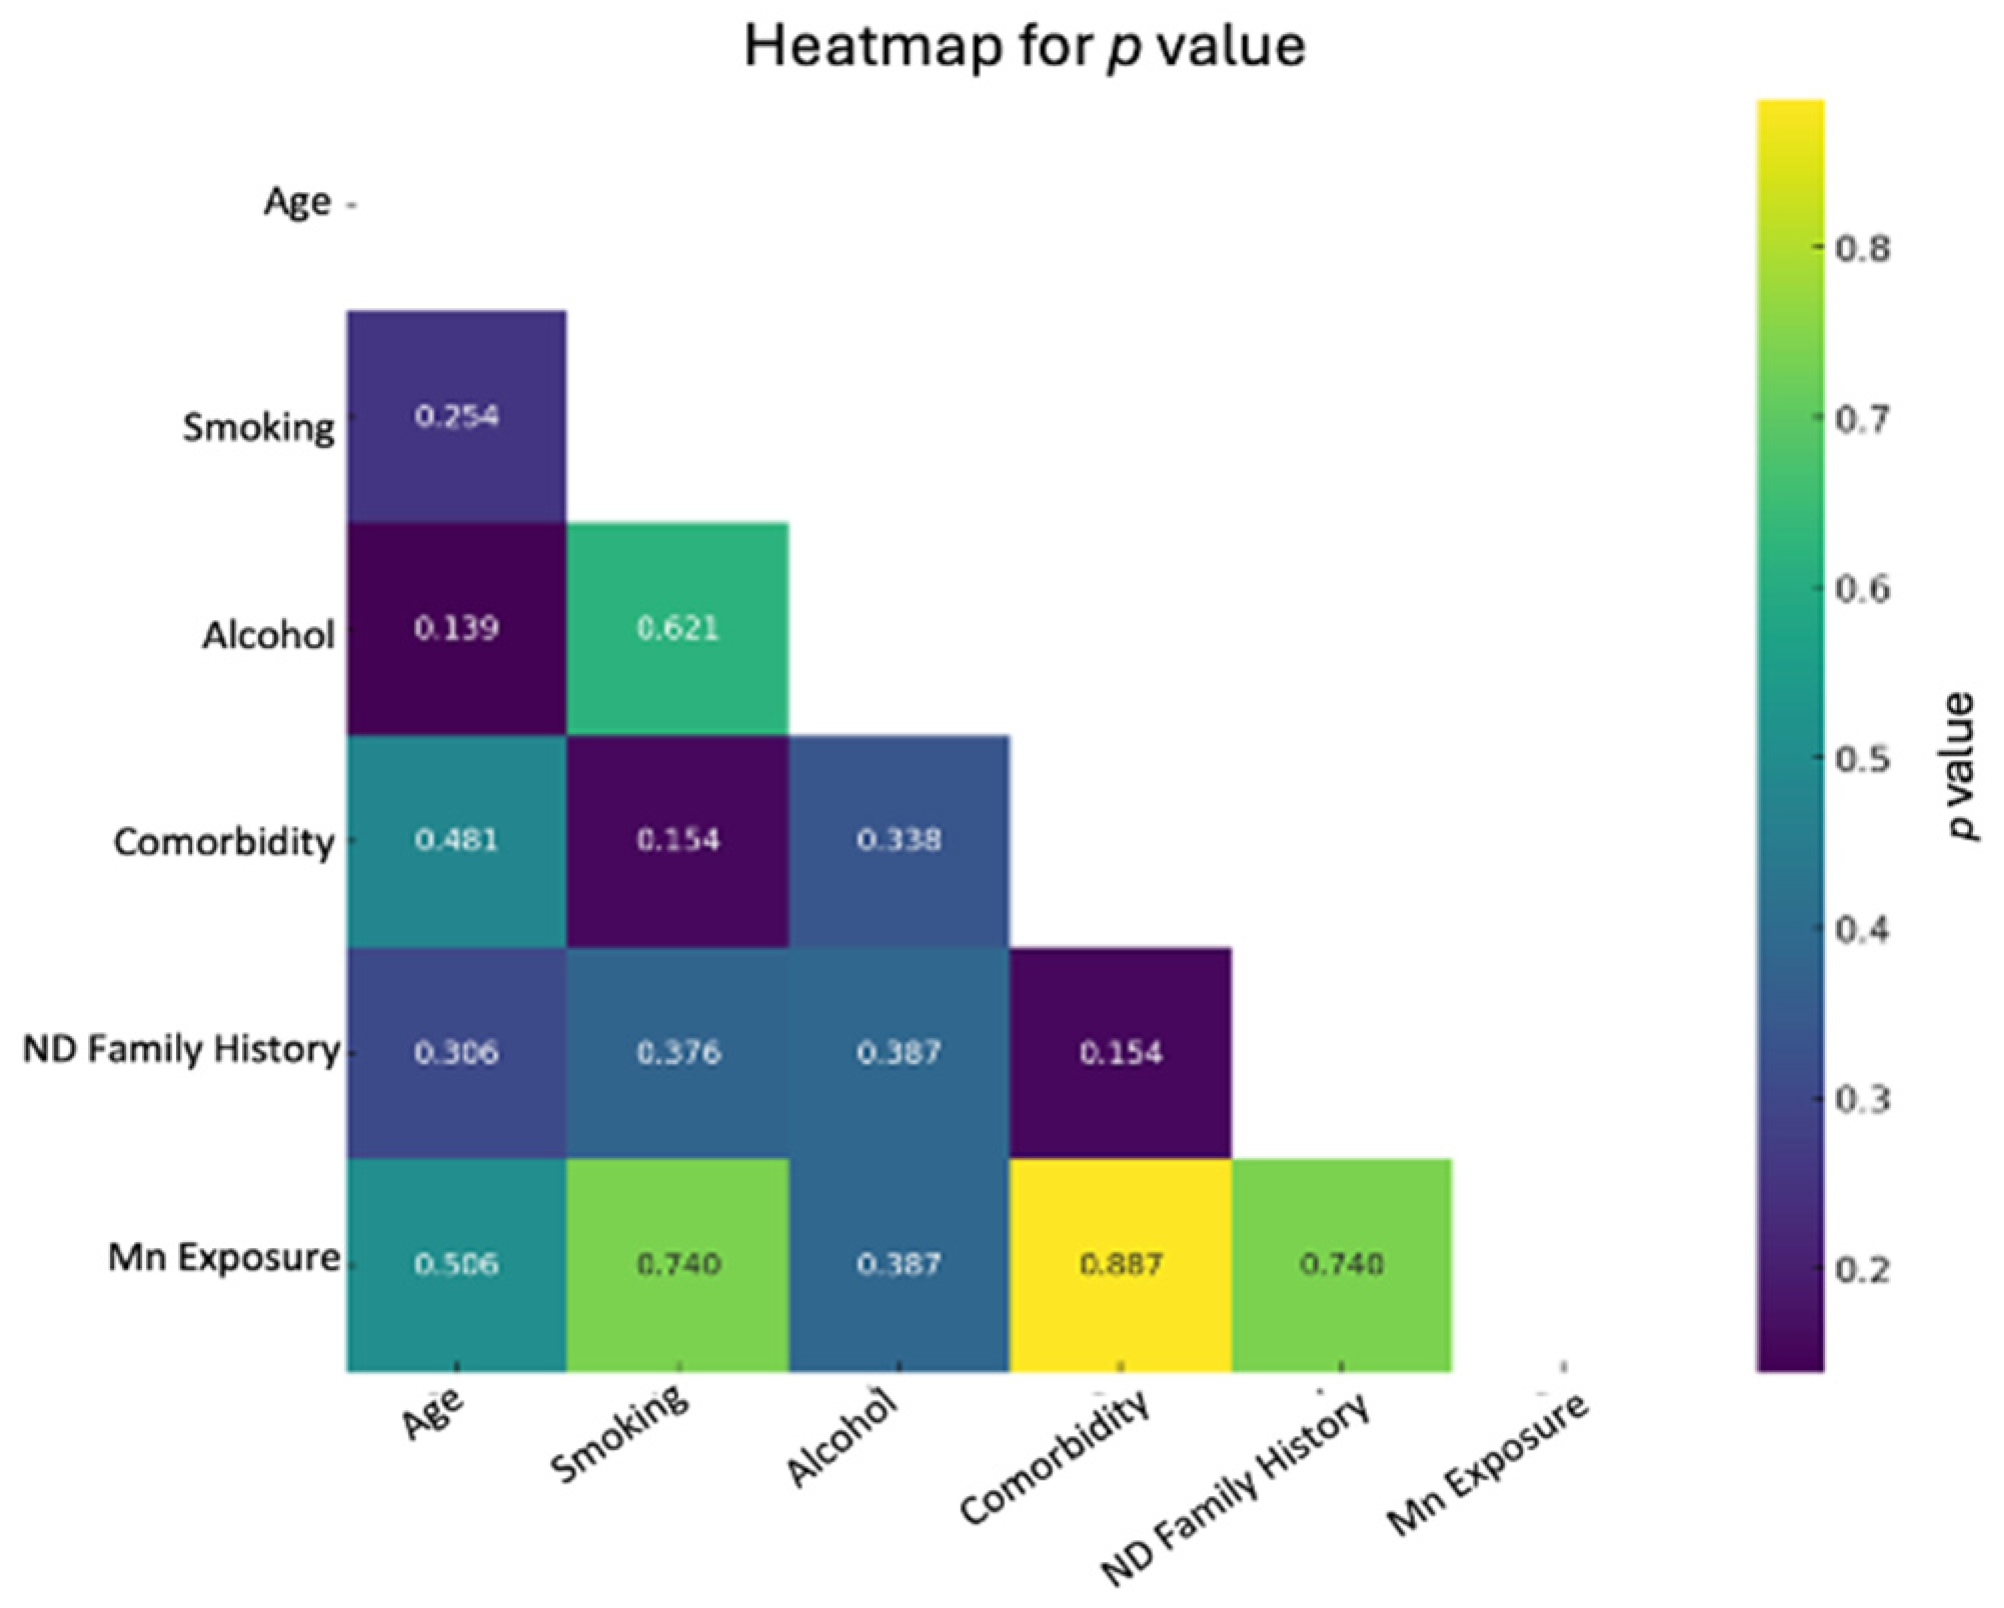
- Descriptive characteristics of the target groups
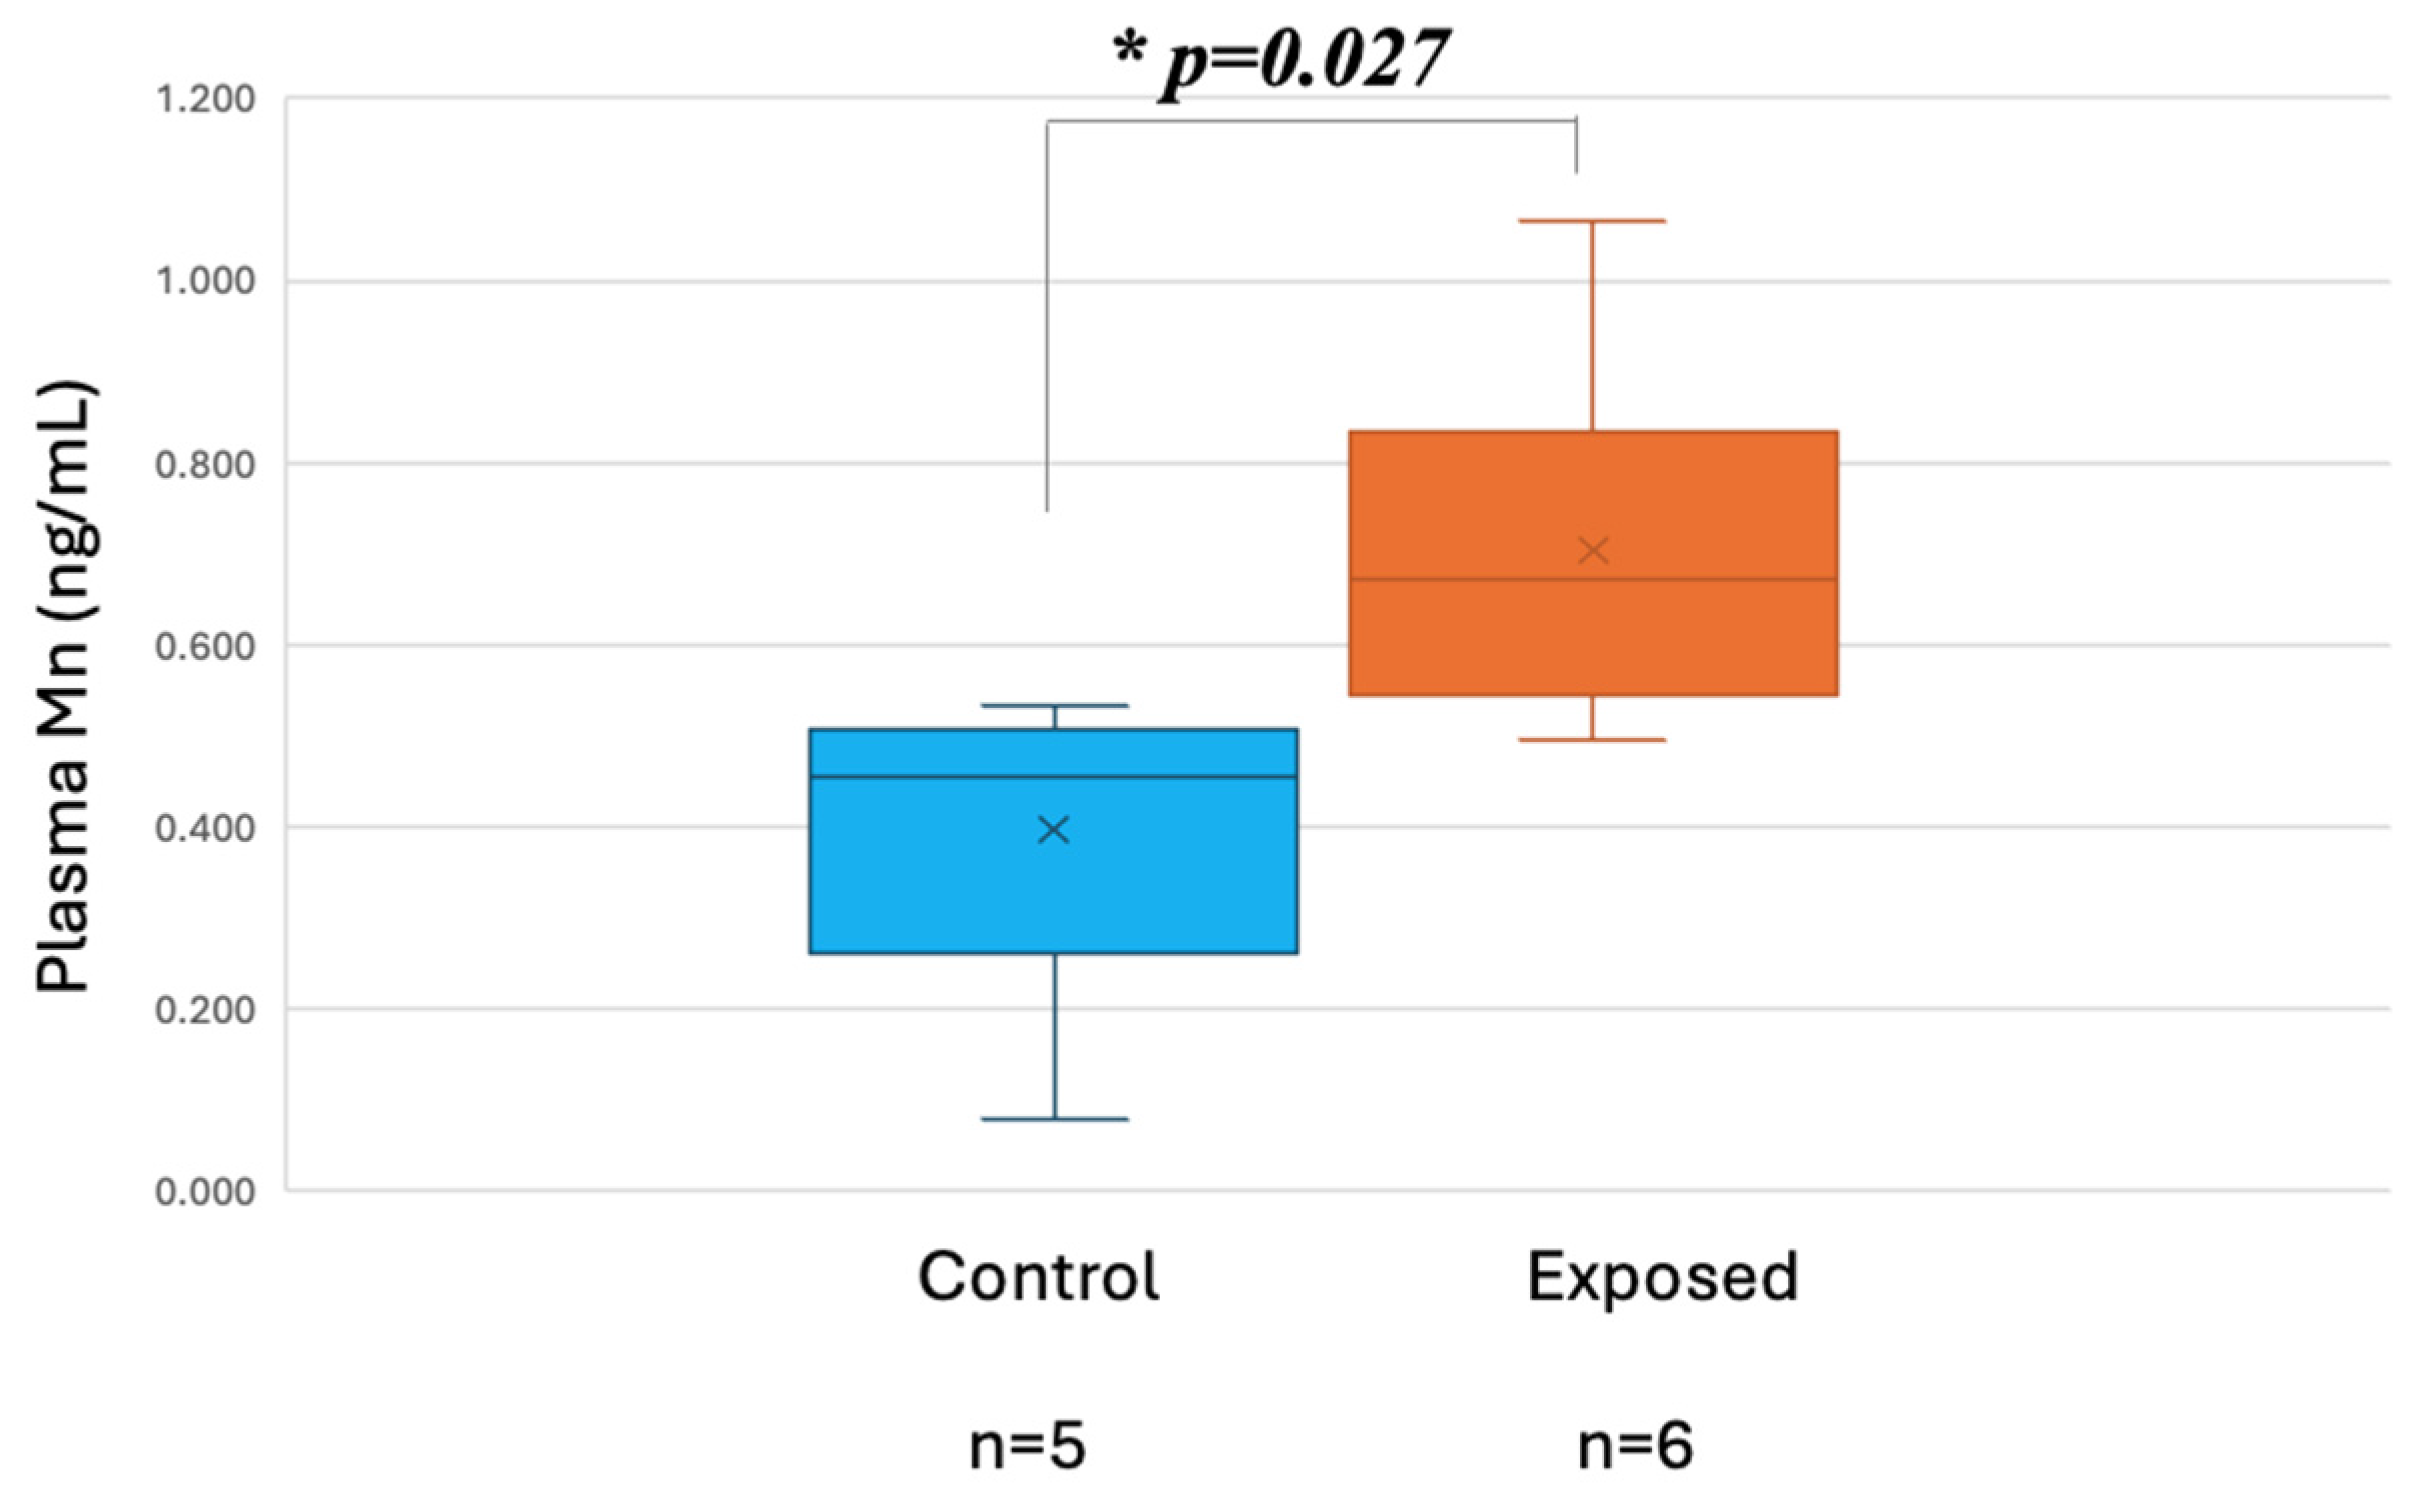
- Exposure data
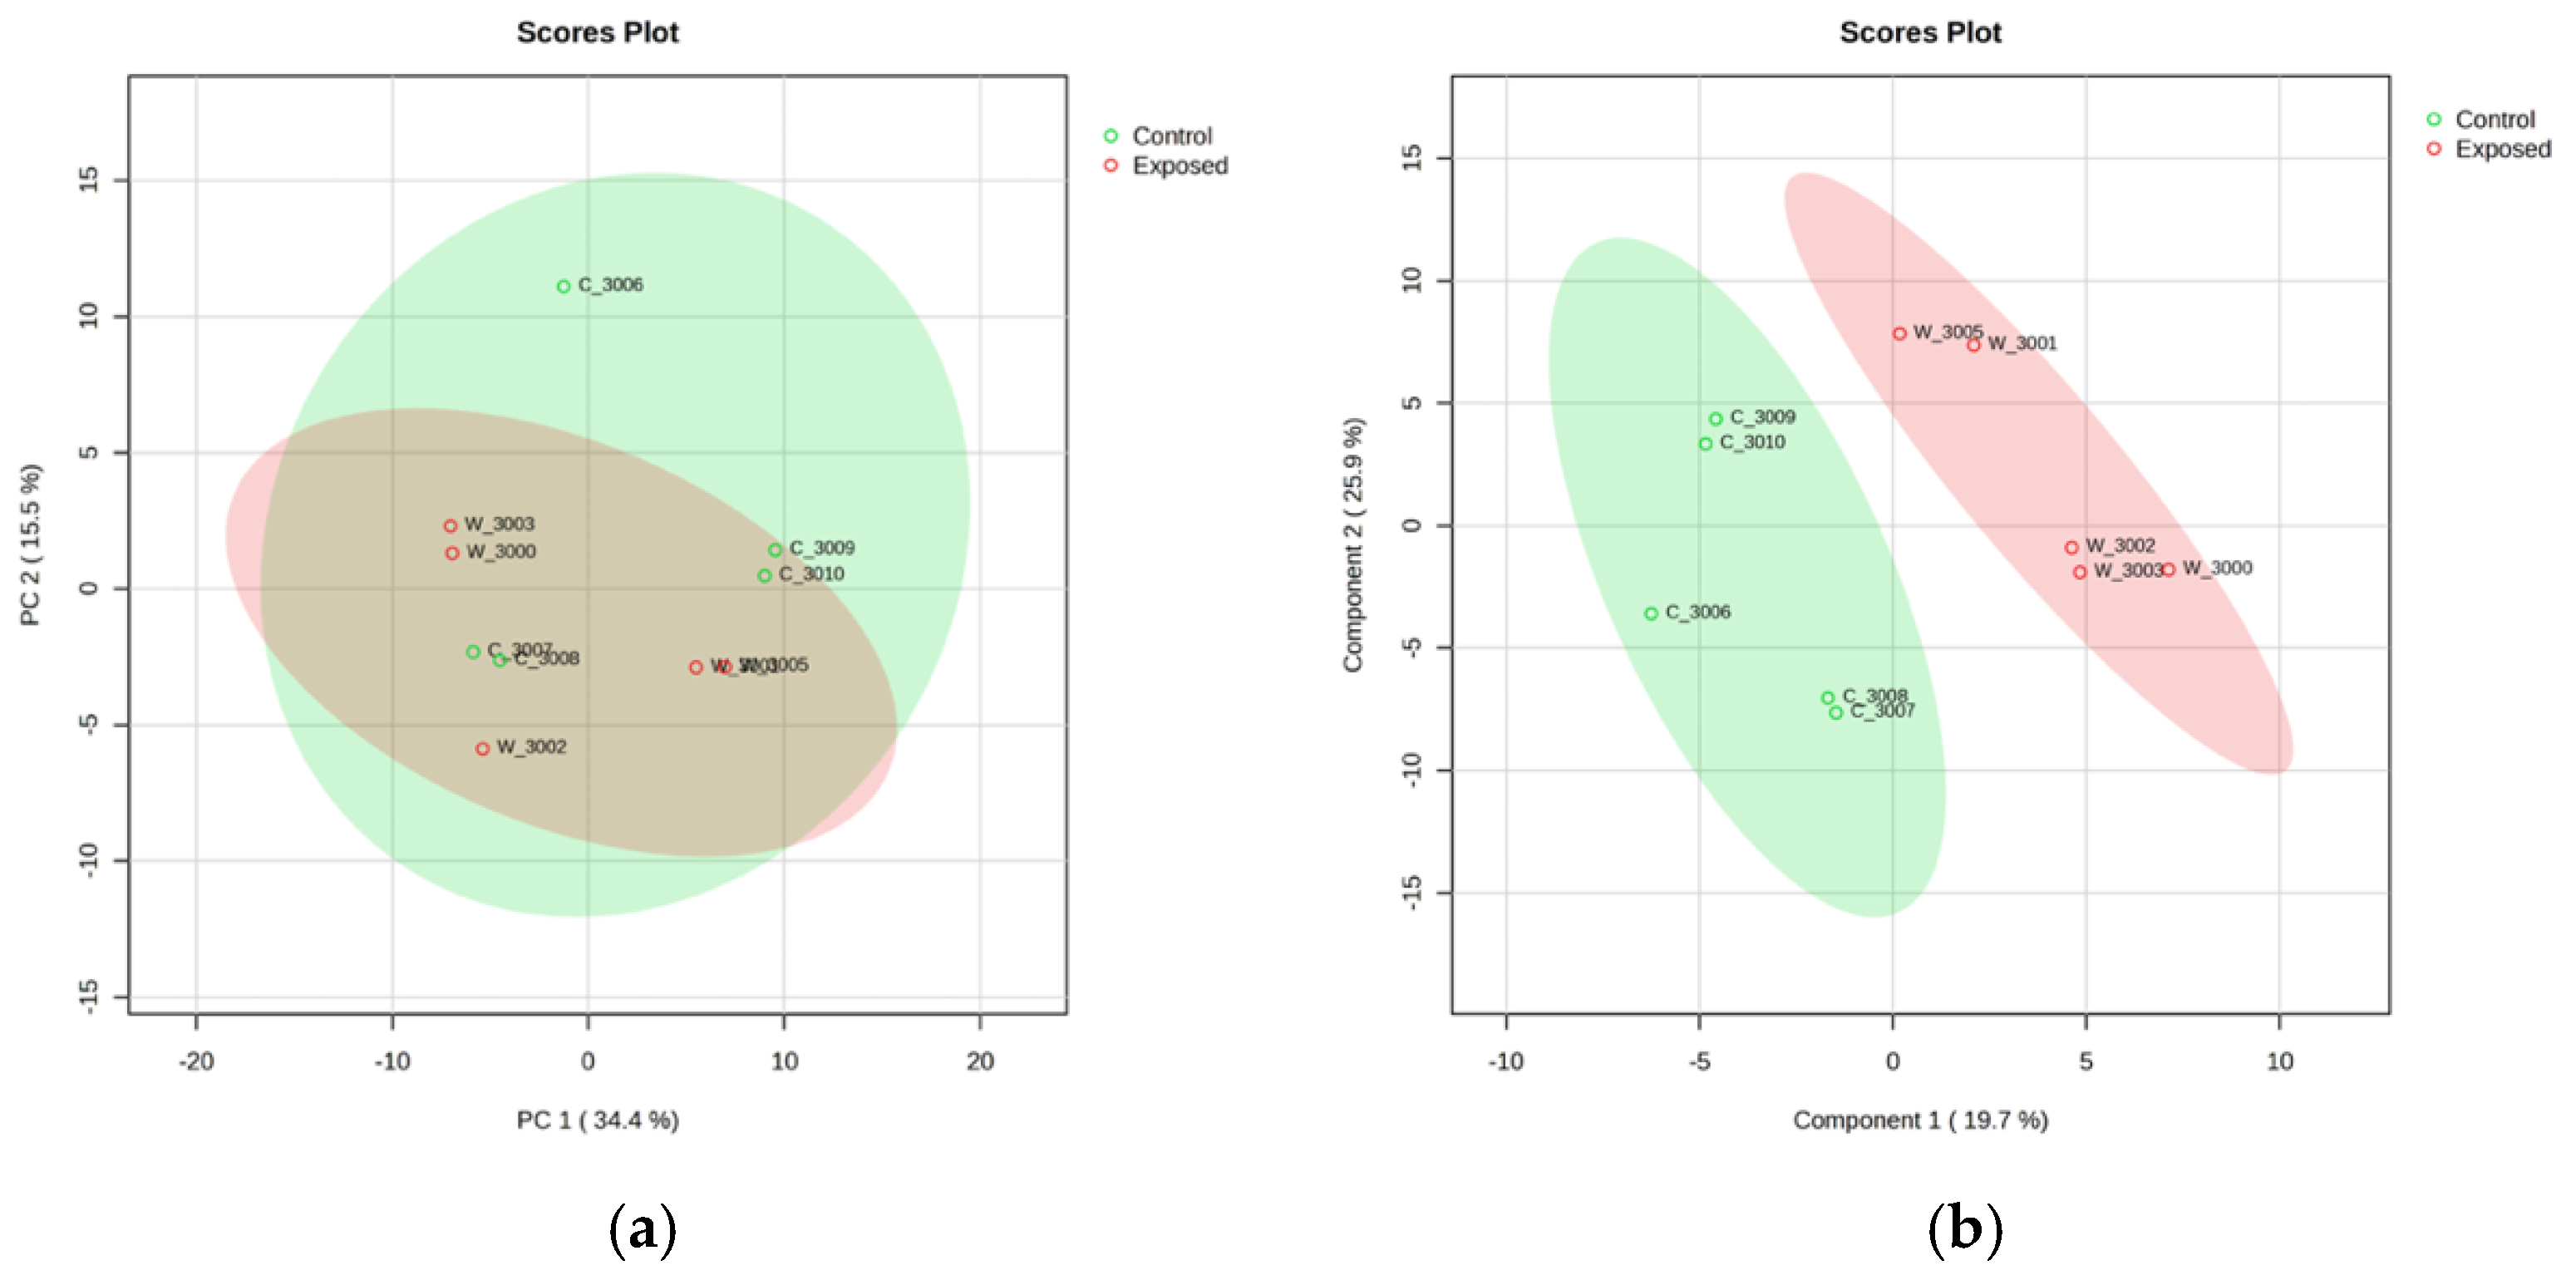
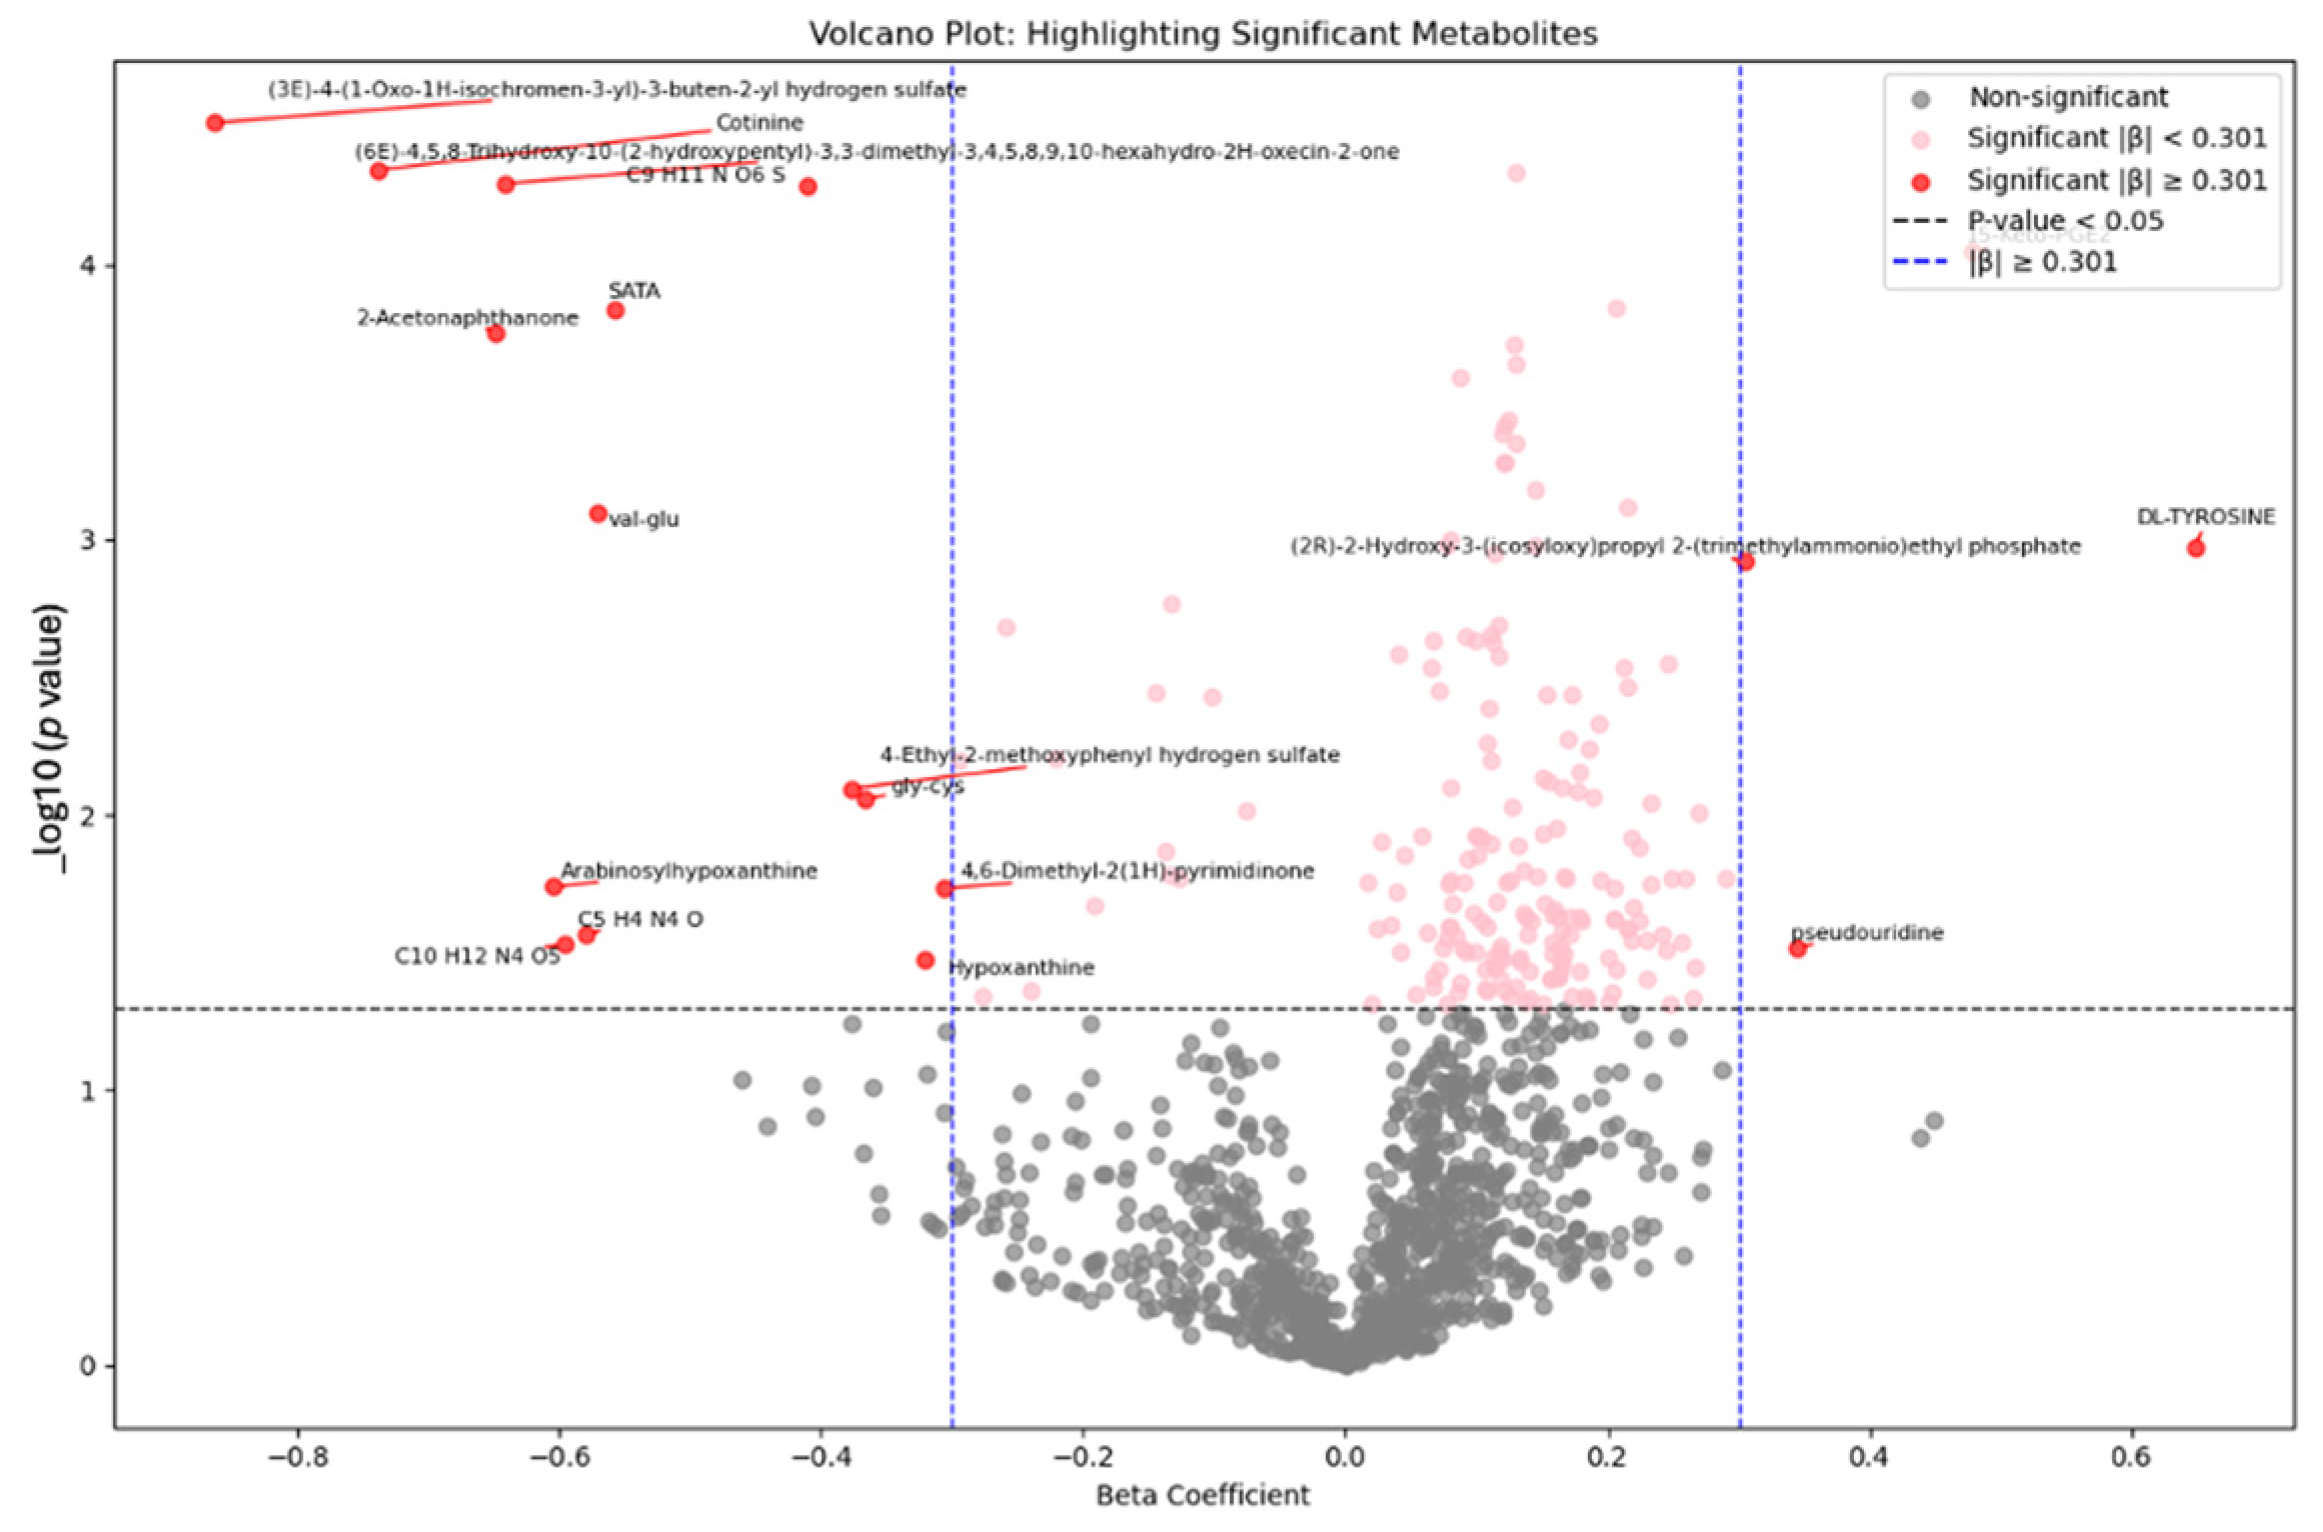
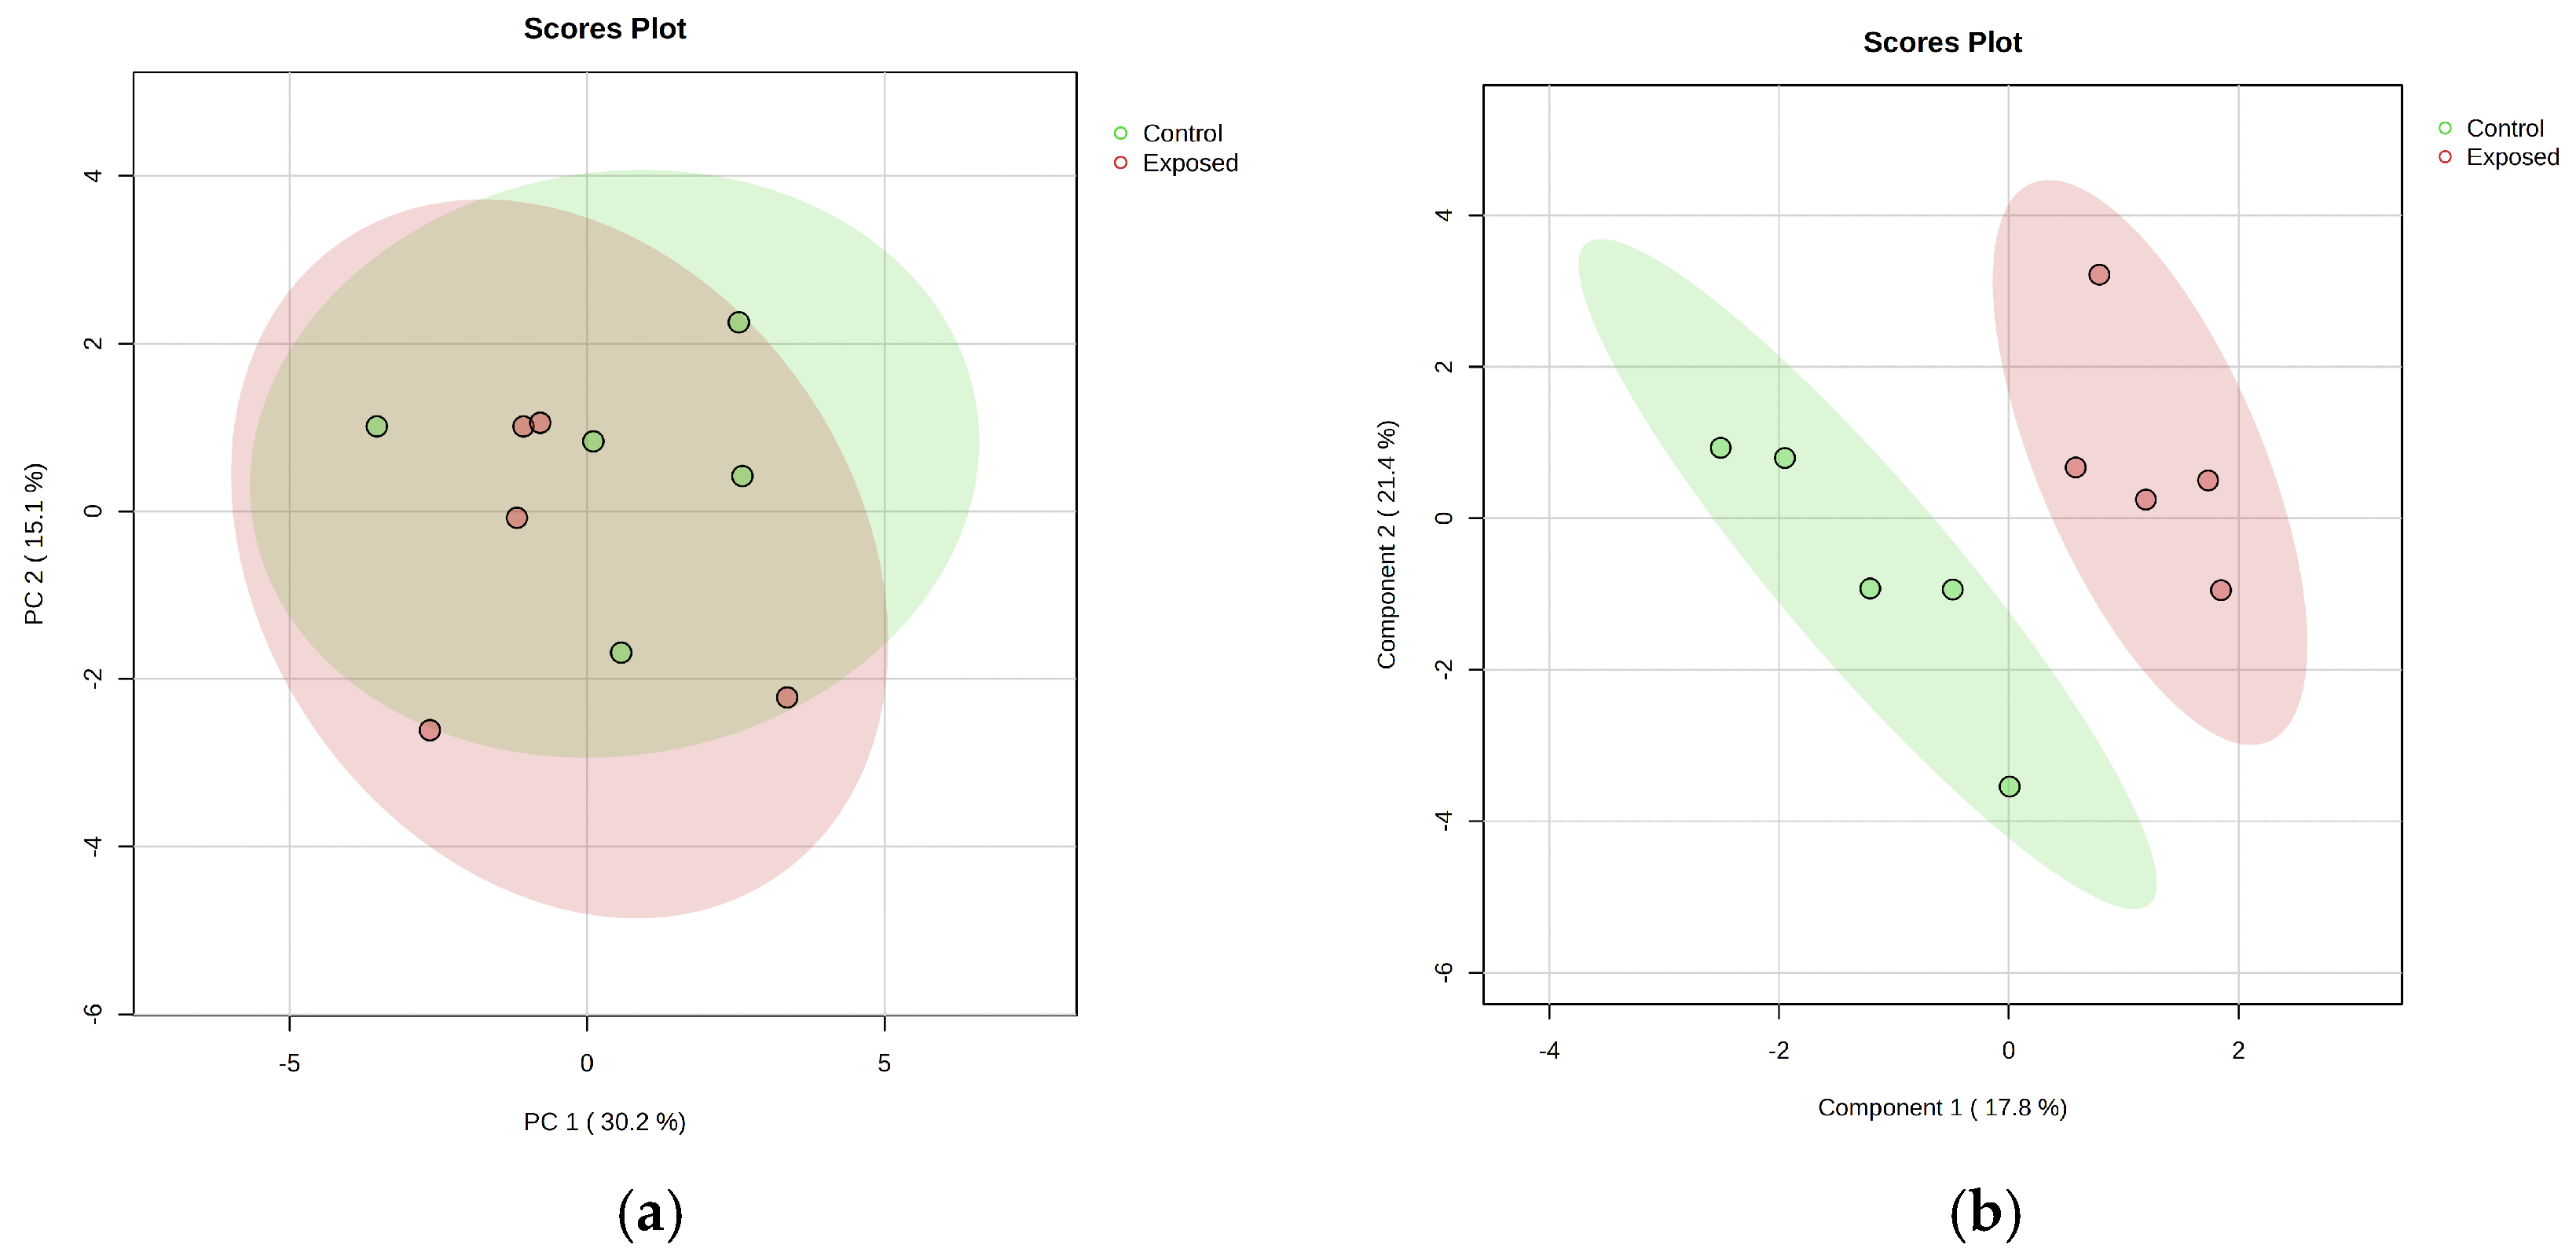
- Metabolomic analysis
- Metabolite Set Enrichment Analysis (MSEA) in Mn-exposed and control workers
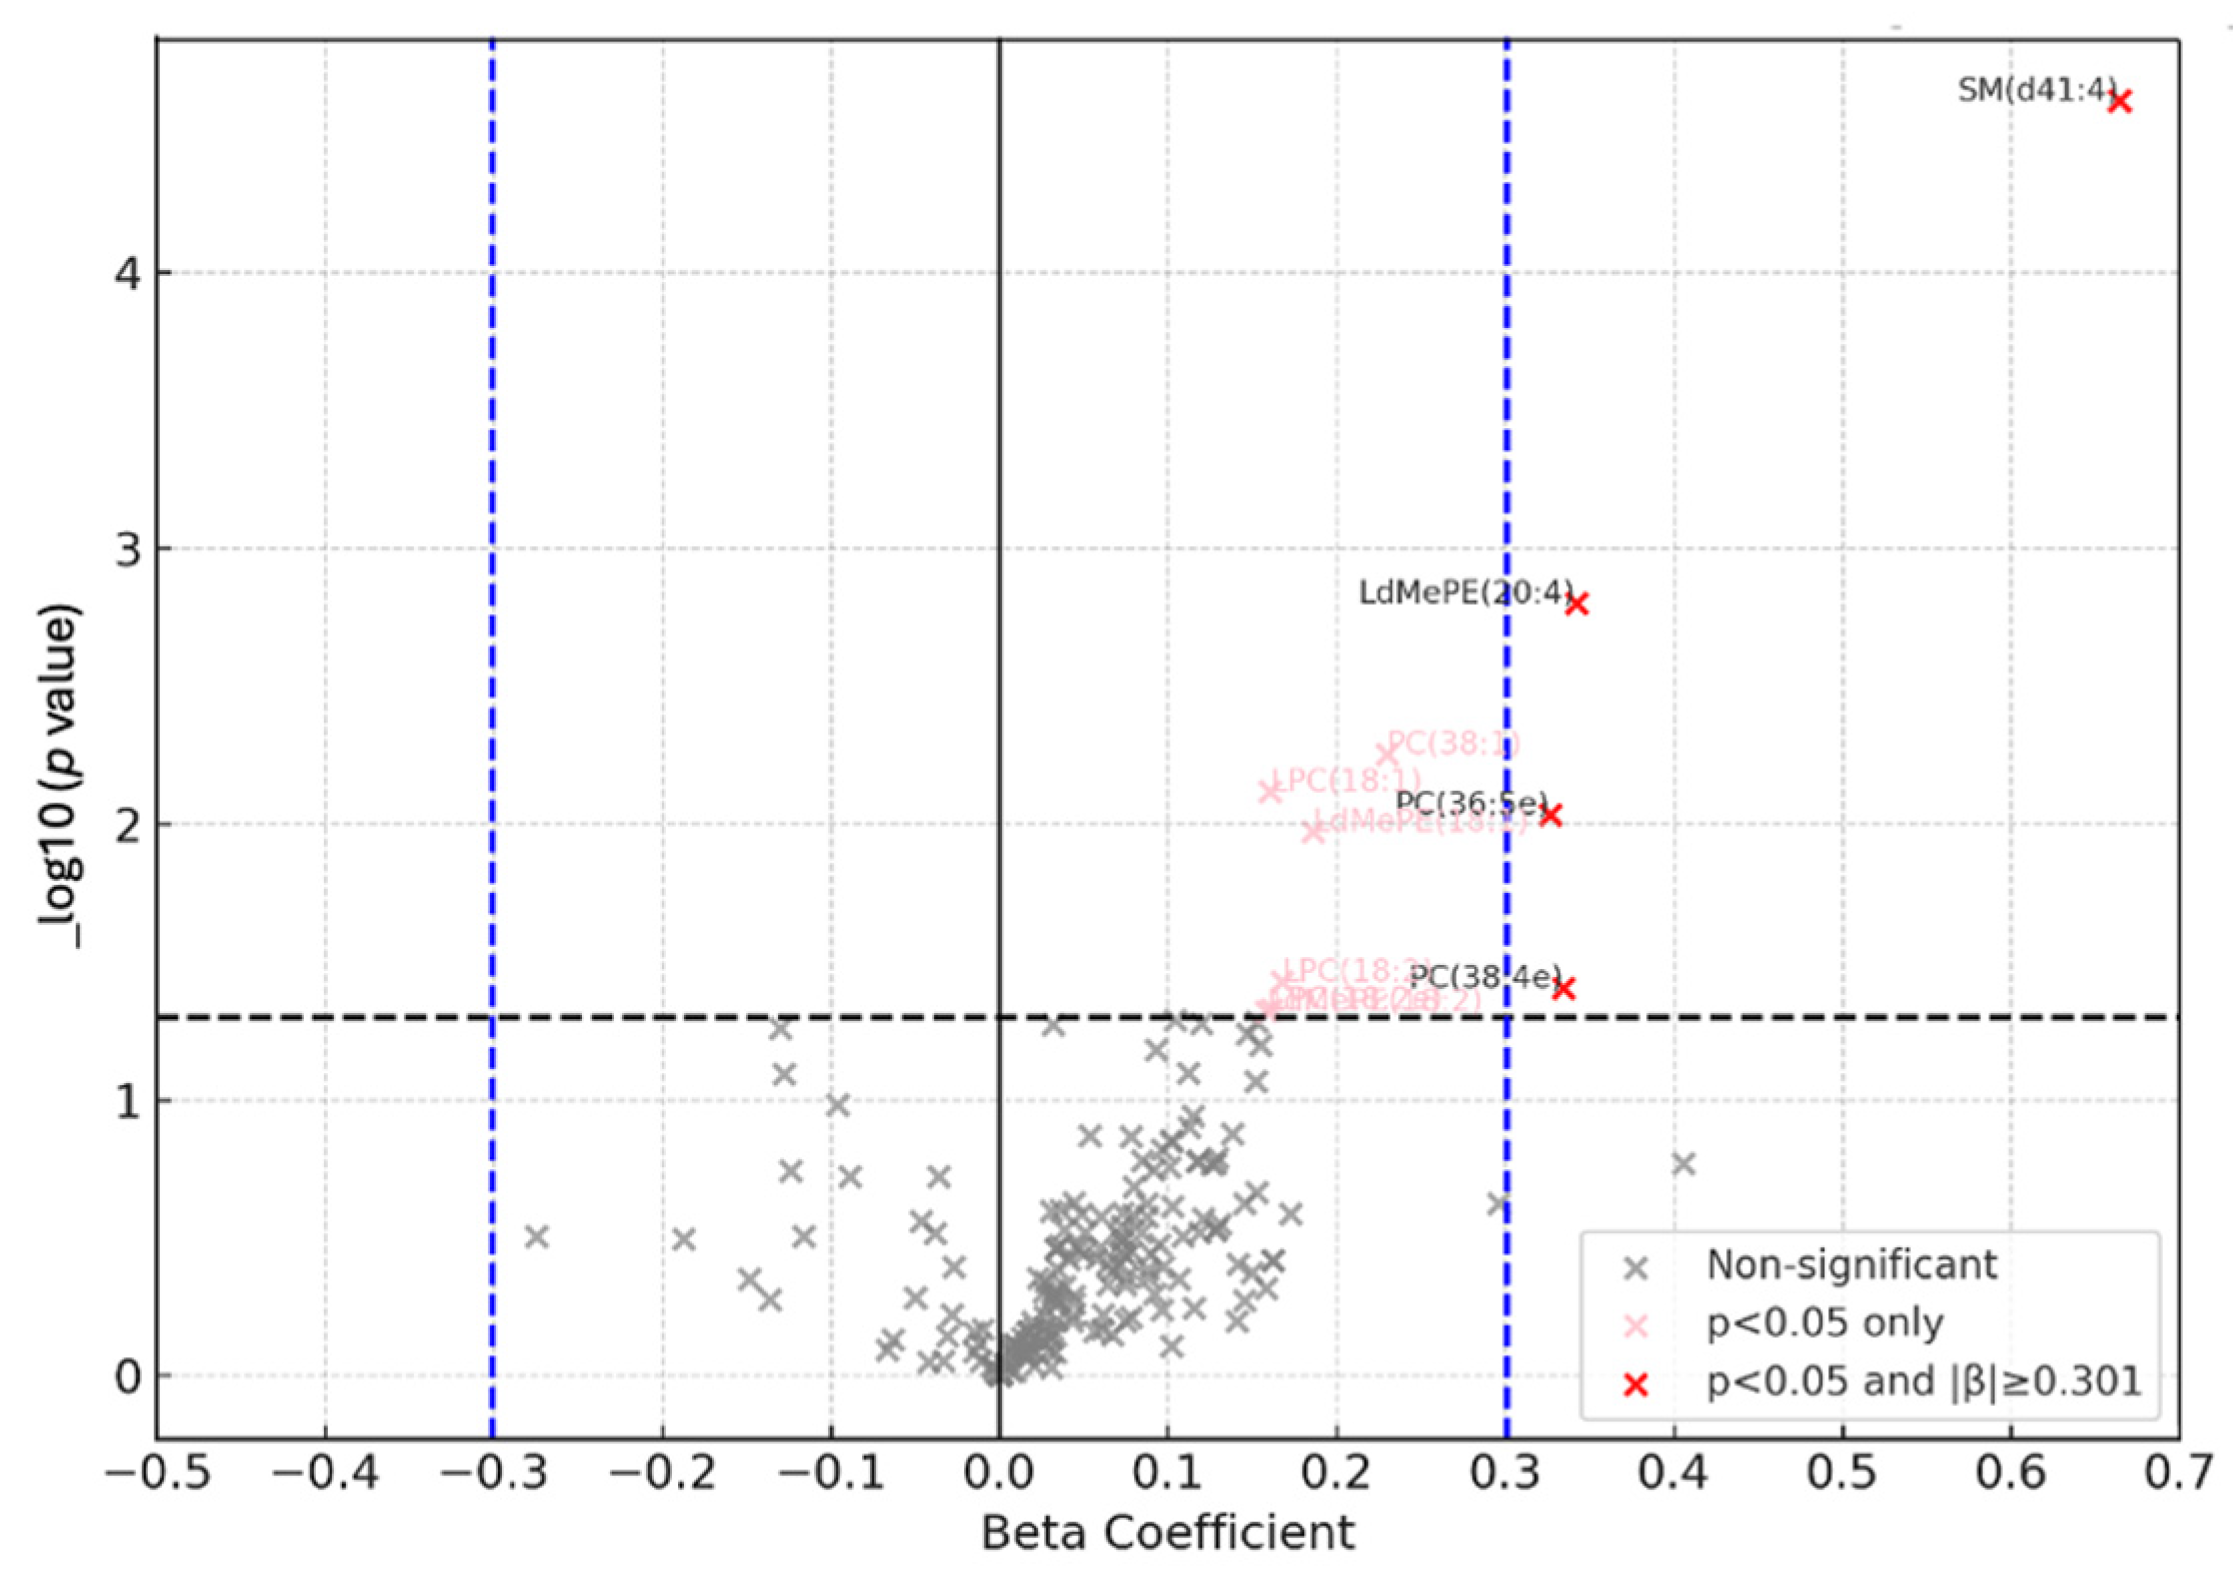
- Lipidomic analysis
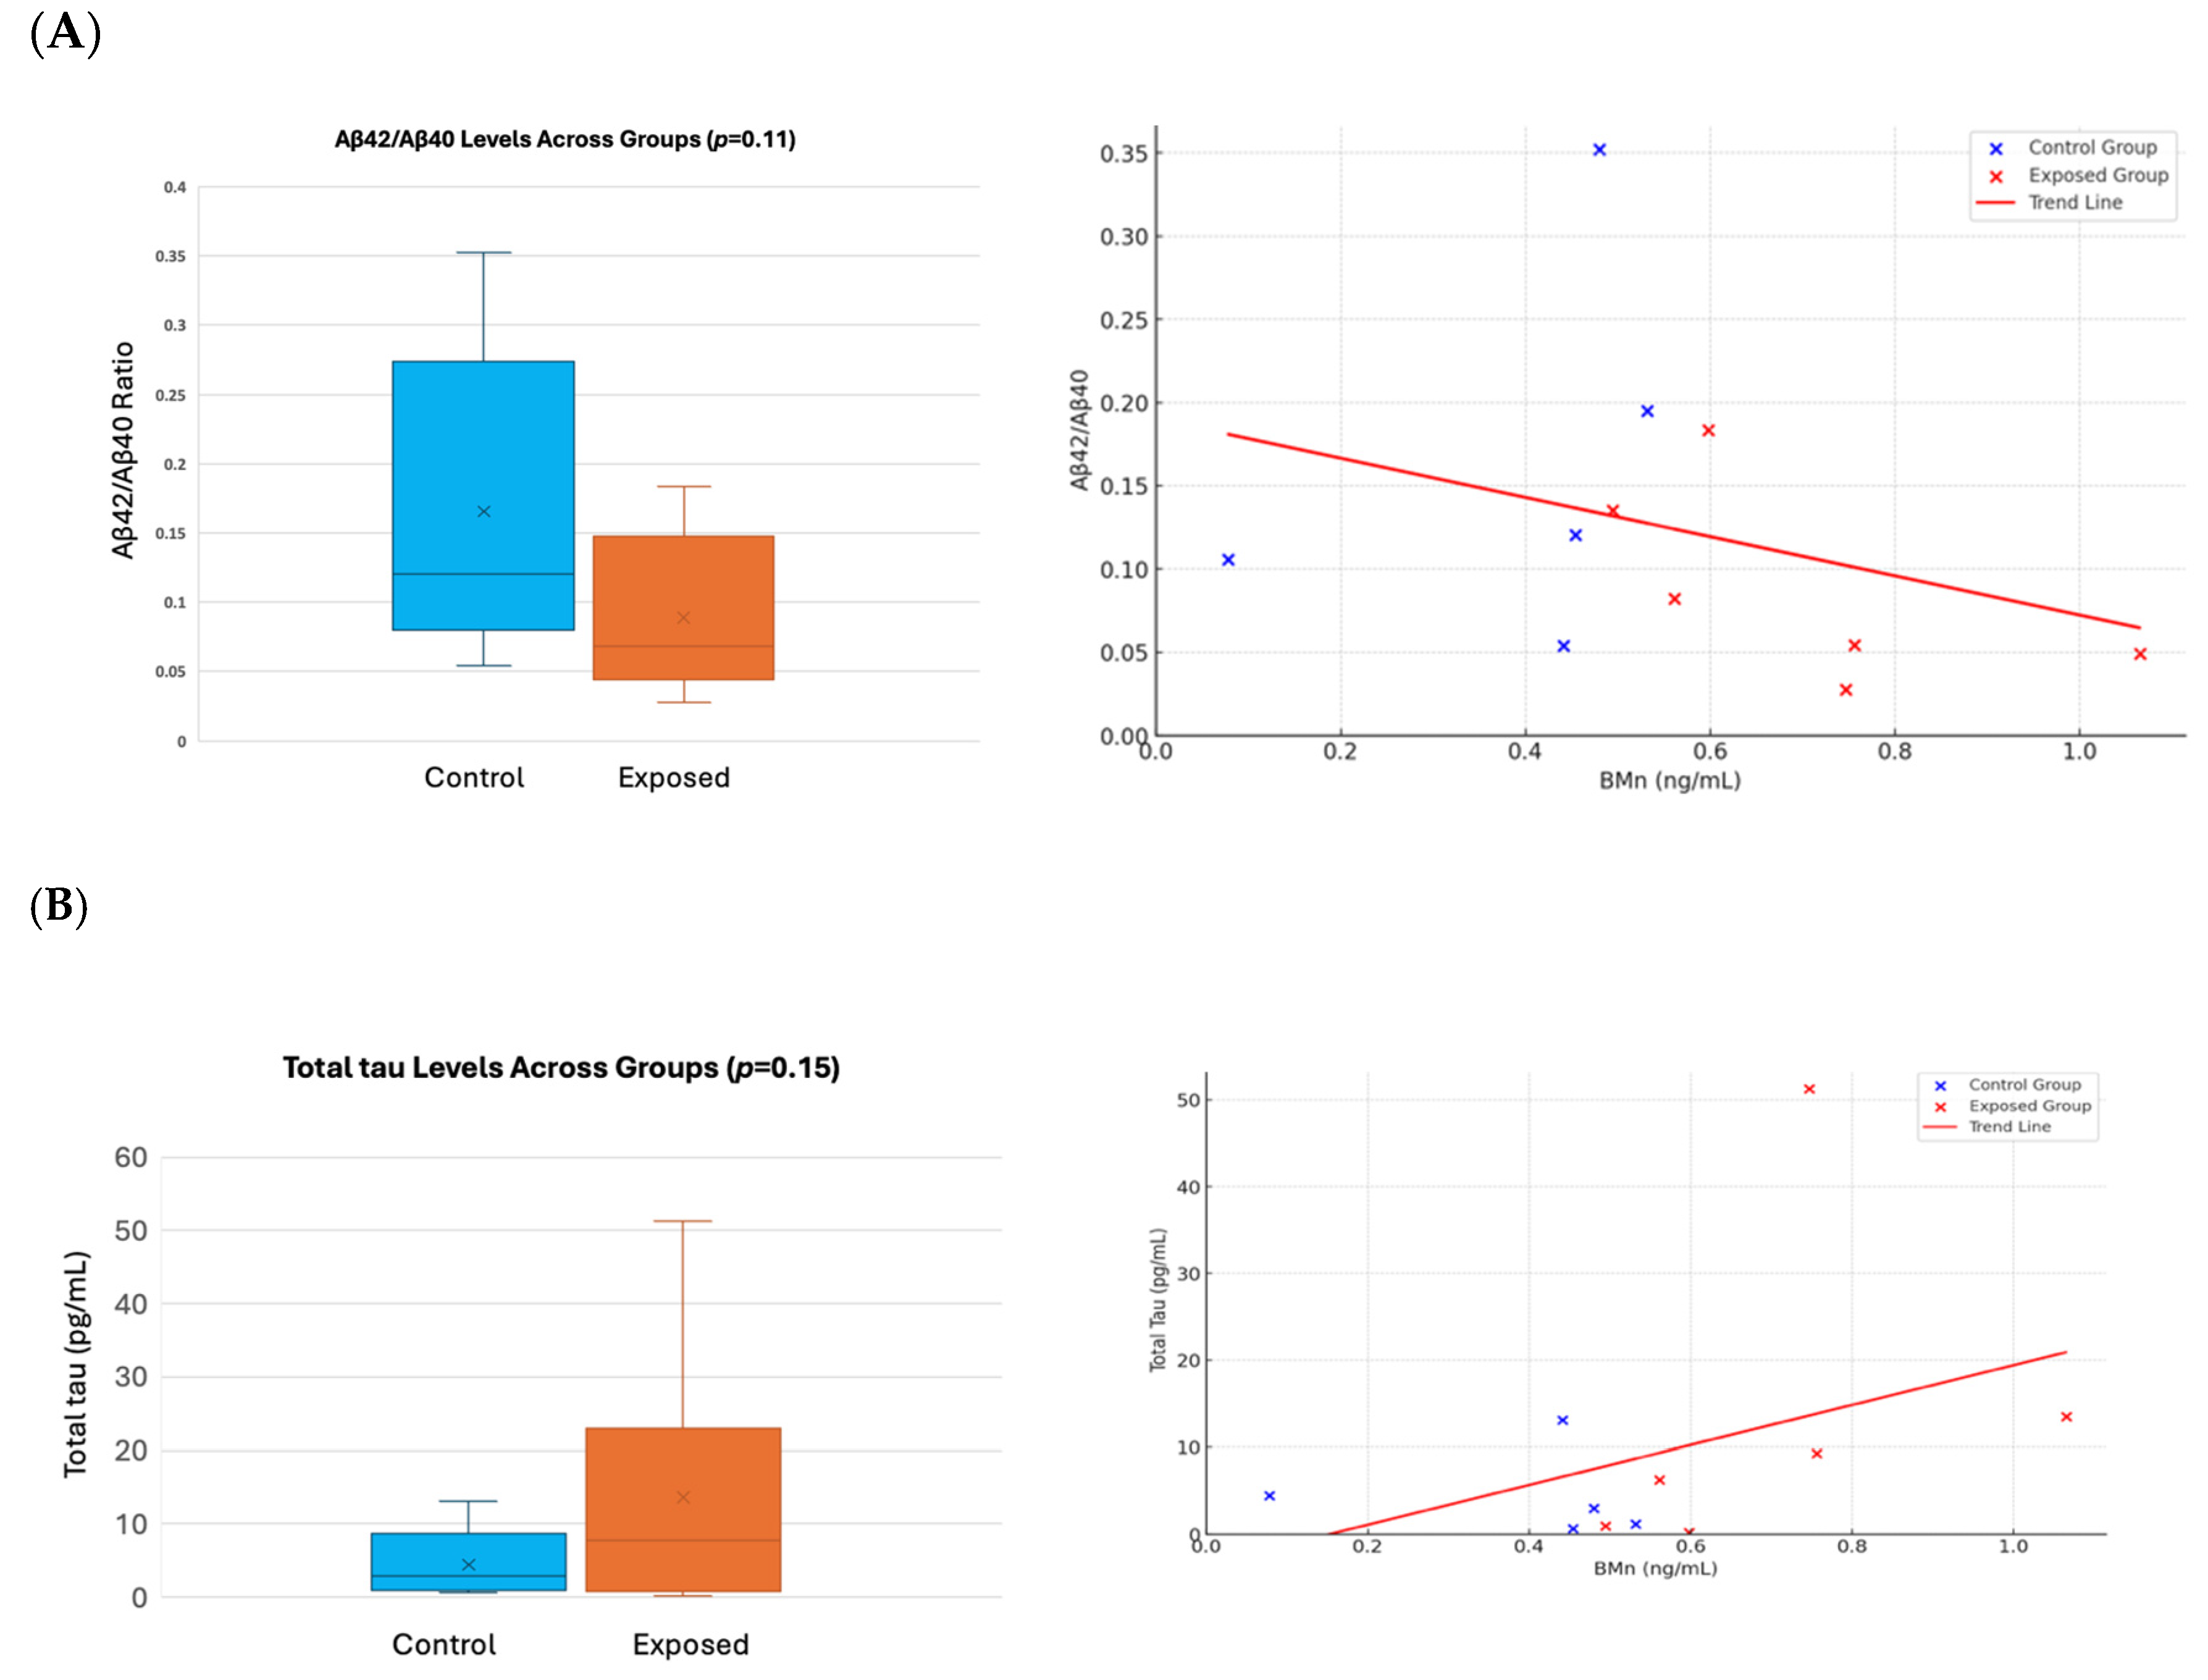
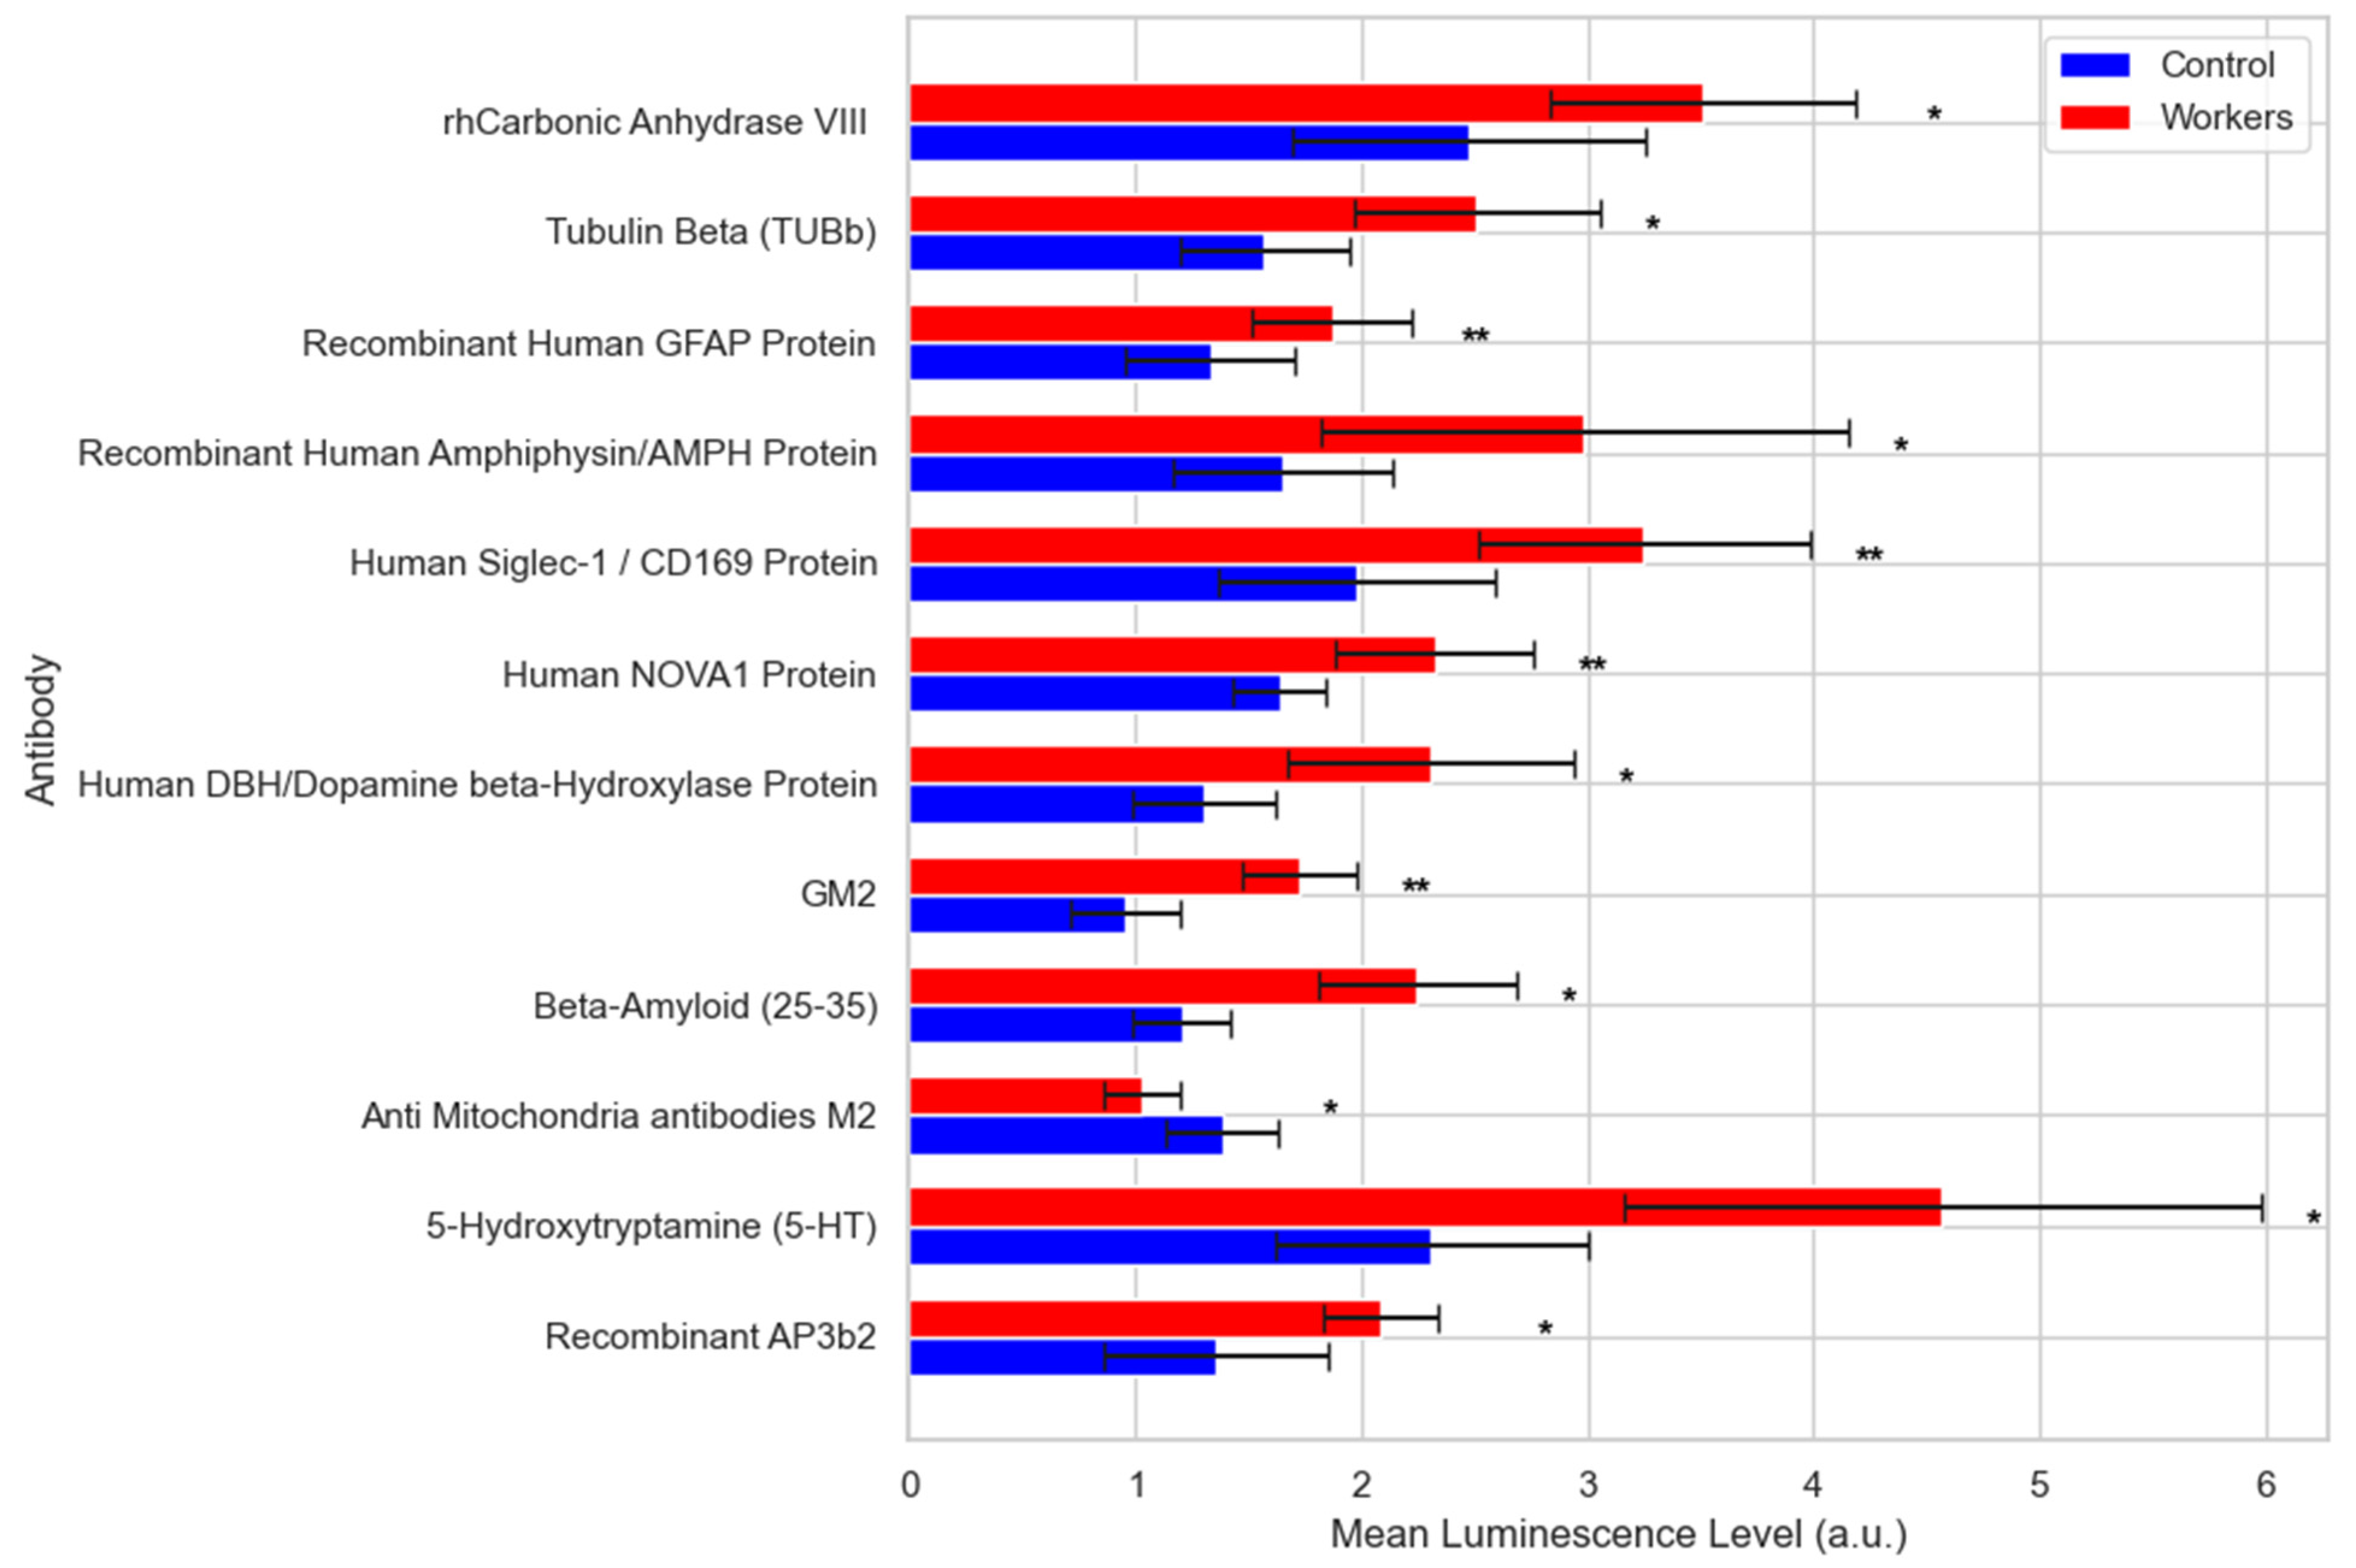
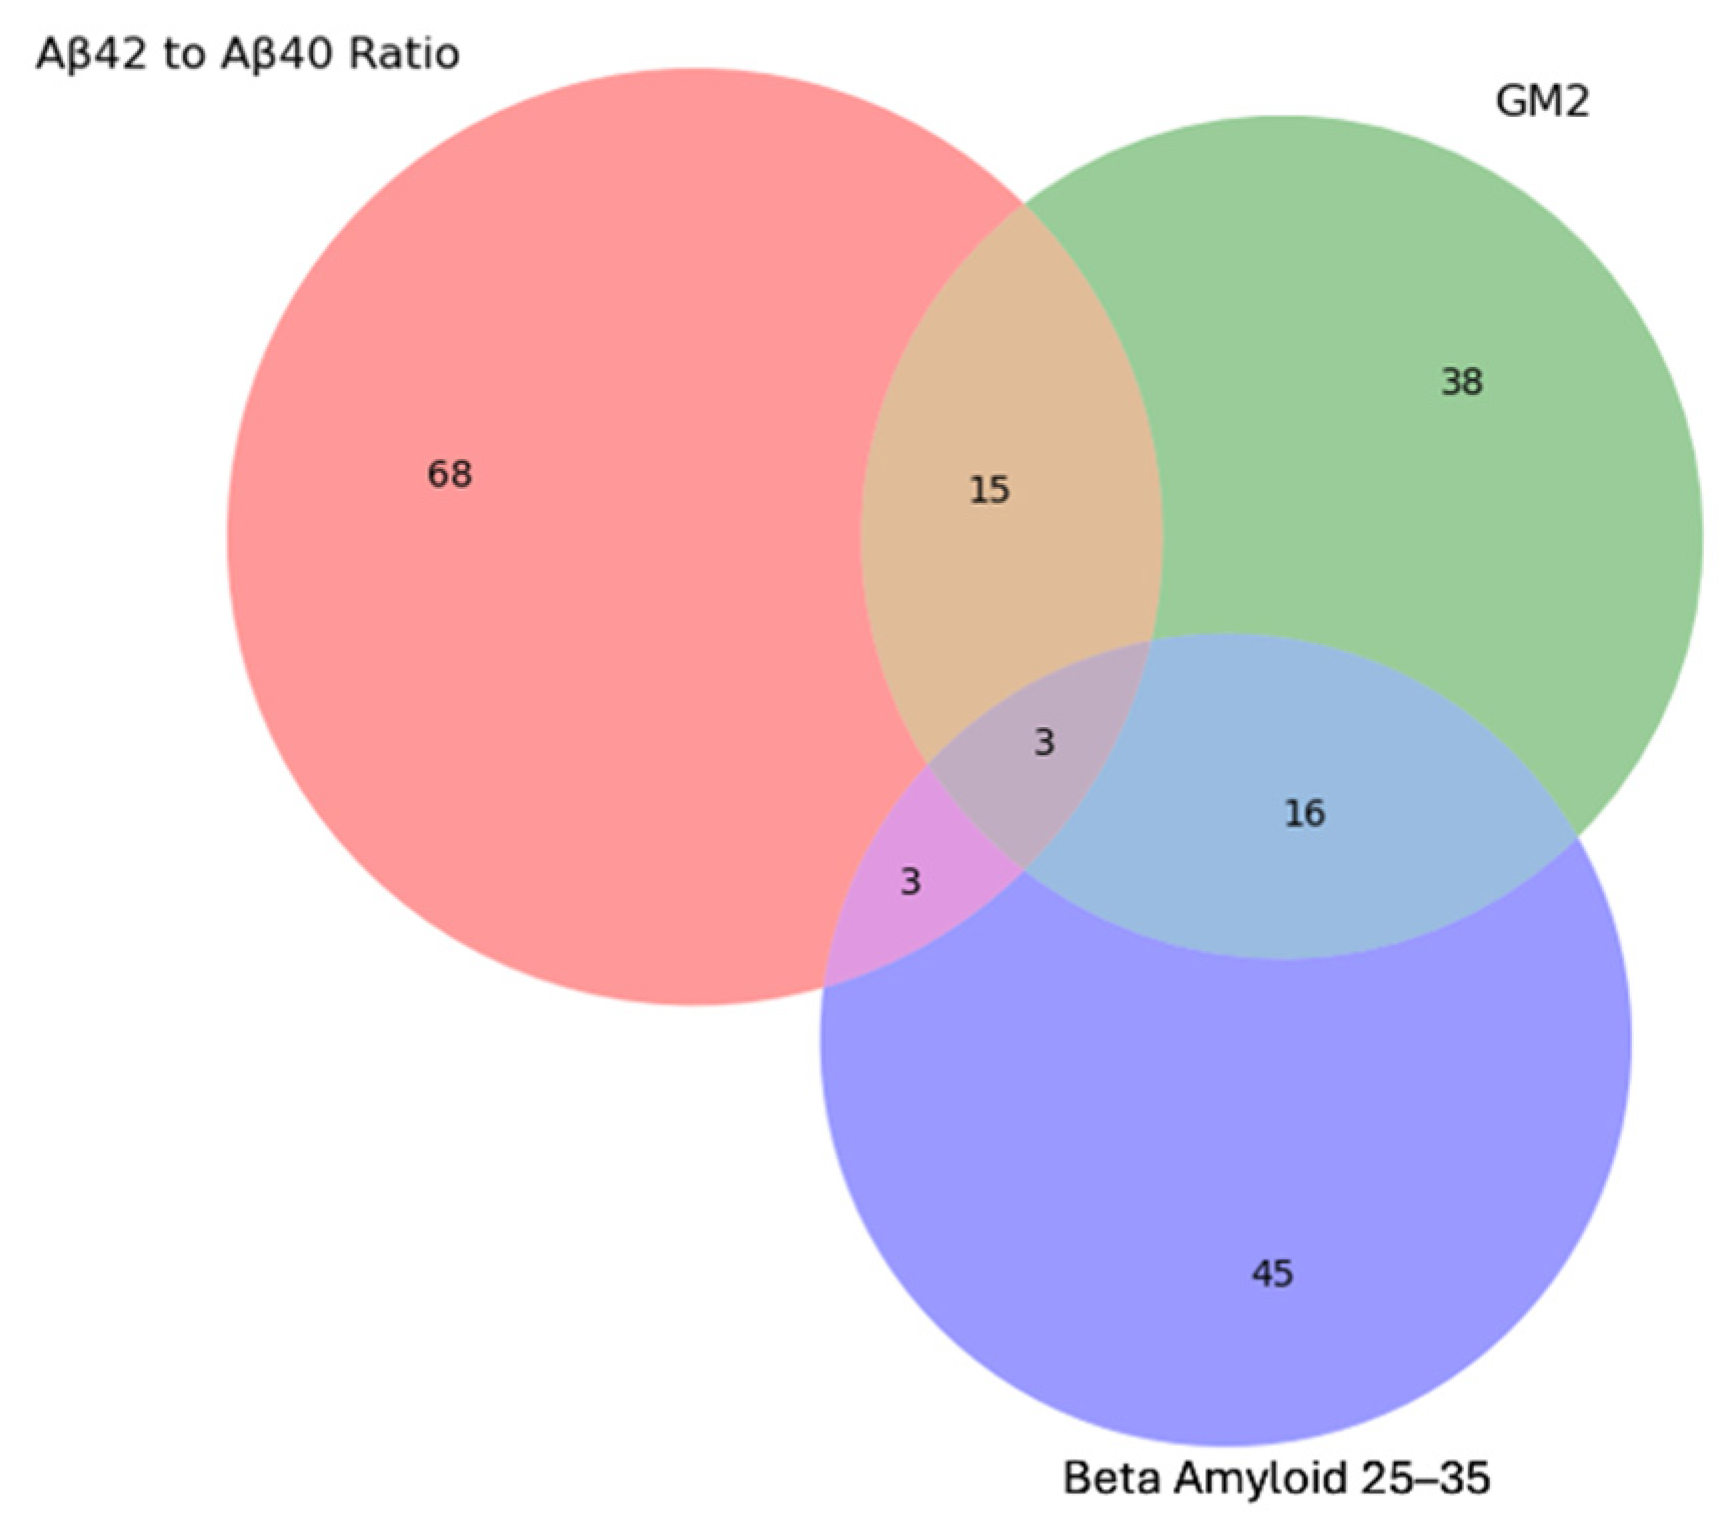
- Proteomics and AD Plasma Biomarkers
4. Discussion
- Metabolomics profiles among exposed and control workers
- Lipidomic analysis
- Proteomics
- Immunosignaturing
5. Conclusions
Supplementary Materials
Author Contributions
Funding
Institutional Review Board Statement
Informed Consent Statement
Data Availability Statement
Acknowledgments
Conflicts of Interest
References
- Martins, A.C., Jr.; Morcillo, P.; Ijomone, O.M.; Venkataramani, V.; Harrison, F.E.; Lee, E.; Bowman, A.B.; Aschner, M. New Insights on the Role of Manganese in Alzheimer’s Disease and Parkinson’s Disease. Int. J. Environ. Res. Public Health 2019, 16, 3546. [Google Scholar] [CrossRef]
- Fitsanakis, V.A.; Au, C.; Erikson, K.M.; Aschner, M. The effects of manganese on glutamate, dopamine and gamma-aminobutyric acid regulation. Neurochem. Int. 2006, 48, 426–433. [Google Scholar] [CrossRef]
- Chen, Y.; Shen, Y.; Wang, W.; Wei, D. Mn(2+) modulates the expression of cellulase genes in Trichoderma reesei Rut-C30 via calcium signaling. Biotechnol. Biofuels 2018, 11, 54. [Google Scholar] [CrossRef]
- Wang, C.; Guan, Y.; Lv, M.; Zhang, R.; Guo, Z.; Wei, X.; Du, X.; Yang, J.; Li, T.; Wan, Y.; et al. Manganese Increases the Sensitivity of the cGAS-STING Pathway for Double-Stranded DNA and Is Required for the Host Defense against DNA Viruses. Immunity 2018, 48, 675–687.e7. [Google Scholar] [CrossRef]
- Balachandran, R.C.; Mukhopadhyay, S.; McBride, D.; Veevers, J.; Harrison, F.E.; Aschner, M.; Haynes, E.N.; Bowman, A.B. Brain manganese and the balance between essential roles and neurotoxicity. J. Biol. Chem. 2020, 295, 6312–6329. [Google Scholar] [CrossRef]
- Andrade, V.M.; Aschner, M.; Marreilha Dos Santos, A.P. Neurotoxicity of Metal Mixtures. Adv. Neurobiol. 2017, 18, 227–265. [Google Scholar] [CrossRef]
- Horning, K.J.; Caito, S.W.; Tipps, K.G.; Bowman, A.B.; Aschner, M. Manganese Is Essential for Neuronal Health. Annu. Rev. Nutr. 2015, 35, 71–108. [Google Scholar] [CrossRef]
- Wang, M.M.; Zheng, X.H.; Zhang, X.; Chao, D.L.; Qiao, S.Z.; Alshareef, H.N.; Cui, Y.; Chen, W. Opportunities of Aqueous Manganese-Based Batteries with Deposition and Stripping Chemistry. Adv. Energy Mater. 2021, 11, 2002904. [Google Scholar] [CrossRef]
- Lucchini, R.; Tieu, K. Manganese-Induced Parkinsonism: Evidence from Epidemiological and Experimental Studies. Biomolecules 2023, 13, 1190. [Google Scholar] [CrossRef]
- Guilarte, T.R.; Yeh, C.L.; McGlothan, J.L.; Perez, J.; Finley, P.; Zhou, Y.; Wong, D.F.; Dydak, U.; Schneider, J.S. PET imaging of dopamine release in the frontal cortex of manganese-exposed non-human primates. J. Neurochem. 2019, 150, 188–201. [Google Scholar] [CrossRef]
- Vlasak, T.; Dujlovic, T.; Barth, A. Manganese exposure and cognitive performance: A meta-analytical approach. Environ. Pollut. 2023, 332, 121884. [Google Scholar] [CrossRef]
- Tinkov, A.A.; Paoliello, M.M.B.; Mazilina, A.N.; Skalny, A.V.; Martins, A.C.; Voskresenskaya, O.N.; Aaseth, J.; Santamaria, A.; Notova, S.V.; Tsatsakis, A.; et al. Molecular Targets of Manganese-Induced Neurotoxicity: A Five-Year Update. Int. J. Mol. Sci. 2021, 22, 4646. [Google Scholar] [CrossRef]
- Mezzaroba, L.; Alfieri, D.F.; Colado Simao, A.N.; Vissoci Reiche, E.M. The role of zinc, copper, manganese and iron in neurodegenerative diseases. Neurotoxicology 2019, 74, 230–241. [Google Scholar] [CrossRef]
- Moyano, P.; Garcia, J.M.; Anadon, M.J.; Lobo, M.; Garcia, J.; Frejo, M.T.; Sola, E.; Pelayo, A.; Pino, J.D. Manganese induced ROS and AChE variants alteration leads to SN56 basal forebrain cholinergic neuronal loss after acute and long-term treatment. Food Chem. Toxicol. 2019, 125, 583–594. [Google Scholar] [CrossRef]
- Dries, D.R.; Yu, G.; Herz, J. Extracting beta-amyloid from Alzheimer’s disease. Proc. Natl. Acad. Sci. USA 2012, 109, 3199–3200. [Google Scholar] [CrossRef]
- Harischandra, D.S.; Ghaisas, S.; Zenitsky, G.; Jin, H.; Kanthasamy, A.; Anantharam, V.; Kanthasamy, A.G. Manganese-Induced Neurotoxicity: New Insights Into the Triad of Protein Misfolding, Mitochondrial Impairment, and Neuroinflammation. Front. Neurosci. 2019, 13, 654. [Google Scholar] [CrossRef]
- DeTure, M.A.; Dickson, D.W. The neuropathological diagnosis of Alzheimer’s disease. Mol. Neurodegener. 2019, 14, 32. [Google Scholar] [CrossRef]
- Garre-Olmo, J. Epidemiology of Alzheimer’s disease and other dementias. Rev. Neurol. 2018, 66, 377–386. [Google Scholar] [PubMed]
- Eid, A.; Mhatre, I.; Richardson, J.R. Gene-environment interactions in Alzheimer’s disease: A potential path to precision medicine. Pharmacol. Ther. 2019, 199, 173–187. [Google Scholar] [CrossRef]
- Sperling, R.A.; Aisen, P.S.; Beckett, L.A.; Bennett, D.A.; Craft, S.; Fagan, A.M.; Iwatsubo, T.; Jack, C.R., Jr.; Kaye, J.; Montine, T.J.; et al. Toward defining the preclinical stages of Alzheimer’s disease: Recommendations from the National Institute on Aging-Alzheimer’s Association workgroups on diagnostic guidelines for Alzheimer’s disease. Alzheimer’s Dement. 2011, 7, 280–292. [Google Scholar] [CrossRef]
- Ray, S.; Britschgi, M.; Herbert, C.; Takeda-Uchimura, Y.; Boxer, A.; Blennow, K.; Friedman, L.F.; Galasko, D.R.; Jutel, M.; Karydas, A.; et al. Classification and prediction of clinical Alzheimer’s diagnosis based on plasma signaling proteins. Nat. Med. 2007, 13, 1359–1362. [Google Scholar] [CrossRef]
- Wyss-Coray, T. Inflammation in Alzheimer disease: Driving force, bystander or beneficial response? Nat. Med. 2006, 12, 1005–1015. [Google Scholar] [CrossRef]
- Steinman, L. Elaborate interactions between the immune and nervous systems. Nat. Immunol. 2004, 5, 575–581. [Google Scholar] [CrossRef]
- Blennow, K.; Zetterberg, H. Biomarkers for Alzheimer’s disease: Current status and prospects for the future. J. Intern. Med. 2018, 284, 643–663. [Google Scholar] [CrossRef]
- Pan, F.; Lu, Y.; Huang, Q.; Xie, F.; Yang, J.; Guo, Q. The potential impact of clinical factors on blood-based biomarkers for Alzheimer’s disease. Transl. Neurodegener. 2023, 12, 39. [Google Scholar] [CrossRef]
- Jasbi, P.; Shi, X.; Chu, P.; Elliott, N.; Hudson, H.; Jones, D.; Serrano, G.; Chow, B.; Beach, T.G.; Liu, L.; et al. Metabolic Profiling of Neocortical Tissue Discriminates Alzheimer’s Disease from Mild Cognitive Impairment, High Pathology Controls, and Normal Controls. J. Proteome. Res. 2021, 20, 4303–4317. [Google Scholar] [CrossRef]
- Wilkins, J.M.; Trushina, E. Application of Metabolomics in Alzheimer’s Disease. Front. Neurol. 2017, 8, 719. [Google Scholar] [CrossRef]
- Azmoun, S.; Diaz, Y.F.; Tang, C.Y.; Horton, M.; Clouston, S.A.P.; Luft, B.J.; Bromet, E.J.; Gandy, S.; Placidi, D.; Ambrosi, C.; et al. Cognitive impact of exposure to airborne particles captured by brain imaging. Adv. Neurotoxicol. 2022, 7, 29–45. [Google Scholar] [CrossRef]
- Lucchini, R.; Albini, E.; Placidi, D.; Gasparotti, R.; Pigozzi, M.G.; Montani, G.; Alessio, L. Brain magnetic resonance imaging and manganese exposure. Neurotoxicology 2000, 21, 769–775. [Google Scholar]
- Lucchini, R.; Apostoli, P.; Perrone, C.; Placidi, D.; Albini, E.; Migliorati, P.; Mergler, D.; Sassine, M.P.; Palmi, S.; Alessio, L. Long-term exposure to “low levels” of manganese oxides and neurofunctional changes in ferroalloy workers. Neurotoxicology 1999, 20, 287–297. [Google Scholar]
- Lucchini, R.; Bergamaschi, E.; Smargiassi, A.; Festa, D.; Apostoli, P. Motor function, olfactory threshold, and hematological indices in manganese-exposed ferroalloy workers. Environ. Res. 1997, 73, 175–180. [Google Scholar] [CrossRef]
- Mutti, A.; Bergamaschi, E.; Alinovi, R.; Lucchini, R.; Vettori, M.V.; Franchini, I. Serum prolactin in subjects occupationally exposed to manganese. Ann. Clin. Lab. Sci. 1996, 26, 10–17. [Google Scholar]
- Smargiassi, A.; Mergler, D.; Bergamaschi, E.; Vettori, M.V.; Lucchini, R.; Apostoli, P. Peripheral markers of catecholamine metabolism among workers occupationally exposed to manganese (Mn). Toxicol. Lett. 1995, 77, 329–333. [Google Scholar] [CrossRef]
- Lucchini, R.; Selis, L.; Folli, D.; Apostoli, P.; Mutti, A.; Vanoni, O.; Iregren, A.; Alessio, L. Neurobehavioral effects of manganese in workers from a ferroalloy plant after temporary cessation of exposure. Scand. J. Work Environ. Health 1995, 21, 143–149. [Google Scholar] [CrossRef]
- India Aldana, S.; Valvi, D.; Joshi, A.; Lucchini, R.G.; Placidi, D.; Petrick, L.; Horton, M.; Niedzwiecki, M.; Colicino, E. Salivary Metabolomic Signatures and Body Mass Index in Italian Adolescents: A Pilot Study. J. Endocr. Soc. 2023, 7, bvad091. [Google Scholar] [CrossRef]
- Invernizzi, A.; Rechtman, E.; Oluyemi, K.; Renzetti, S.; Curtin, P.; Colicino, E.; Ambrosi, C.; Mascaro, L.; Patrono, A.; Corbo, D.; et al. Topological network properties of resting-state functional connectivity patterns are associated with metal mixture exposure in adolescents. Front. Neurosci. 2023, 17, 1098441. [Google Scholar] [CrossRef]
- Schildroth, S.; Friedman, A.; White, R.F.; Kordas, K.; Placidi, D.; Bauer, J.A.; Webster, T.F.; Coull, B.A.; Cagna, G.; Wright, R.O.; et al. Associations of an industry-relevant metal mixture with verbal learning and memory in Italian adolescents: The modifying role of iron status. Environ. Res. 2023, 224, 115457. [Google Scholar] [CrossRef]
- Bauer, J.A.; White, R.F.; Coull, B.A.; Austin, C.; Oppini, M.; Zoni, S.; Fedrighi, C.; Cagna, G.; Placidi, D.; Guazzetti, S.; et al. Critical windows of susceptibility in the association between manganese and neurocognition in Italian adolescents living near ferro-manganese industry. Neurotoxicology 2021, 87, 51–61. [Google Scholar] [CrossRef]
- Levin-Schwartz, Y.; Claus Henn, B.; Gennings, C.; Coull, B.A.; Placidi, D.; Horton, M.K.; Smith, D.R.; Lucchini, R.G.; Wright, R.O. Integrated measures of lead and manganese exposure improve estimation of their joint effects on cognition in Italian school-age children. Environ. Int. 2021, 146, 106312. [Google Scholar] [CrossRef]
- Rechtman, E.; Navarro, E.; de Water, E.; Tang, C.Y.; Curtin, P.; Papazaharias, D.M.; Ambrosi, C.; Mascaro, L.; Cagna, G.; Gasparotti, R.; et al. Early-Life Critical Windows of Susceptibility to Manganese Exposure and Sex-Specific Changes in Brain Connectivity in Late Adolescence. Biol. Psychiatry Glob. Open Sci. 2023, 3, 460–469. [Google Scholar] [CrossRef]
- Lucchini, R.G.; Guazzetti, S.; Zoni, S.; Benedetti, C.; Fedrighi, C.; Peli, M.; Donna, F.; Bontempi, E.; Borgese, L.; Micheletti, S.; et al. Neurofunctional dopaminergic impairment in elderly after lifetime exposure to manganese. Neurotoxicology 2014, 45, 309–317. [Google Scholar] [CrossRef]
- Zoni, S.; Bonetti, G.; Lucchini, R. Olfactory functions at the intersection between environmental exposure to manganese and Parkinsonism. J. Trace Elem. Med. Biol. 2012, 26, 179–182. [Google Scholar] [CrossRef]
- Wahlberg, K.; Kippler, M.; Alhamdow, A.; Rahman, S.M.; Smith, D.R.; Vahter, M.; Lucchini, R.G.; Broberg, K. Common Polymorphisms in the Solute Carrier SLC30A10 are Associated With Blood Manganese and Neurological Function. Toxicol. Sci. 2016, 149, 473–483. [Google Scholar] [CrossRef]
- Rentschler, G.; Covolo, L.; Haddad, A.A.; Lucchini, R.G.; Zoni, S.; Broberg, K. ATP13A2 (PARK9) polymorphisms influence the neurotoxic effects of manganese. Neurotoxicology 2012, 33, 697–702. [Google Scholar] [CrossRef]
- Jayaraman, V.; Krishna, K.; Yang, Y.; Rajasekaran, K.J.; Ou, Y.; Wang, T.; Bei, K.; Krishnamurthy, H.K.; Rajasekaran, J.J.; Rai, A.J.; et al. An ultra-high-density protein microarray for high throughput single-tier serological detection of Lyme disease. Sci. Rep. 2020, 10, 18085. [Google Scholar] [CrossRef]
- Pederson, W.P.; Ellerman, L.M.; Jin, Y.; Gu, H.; Ledford, J.G. Metabolomic Profiling in Mouse Model of Menopause-Associated Asthma. Metabolites 2023, 13, 546. [Google Scholar] [CrossRef]
- Xia, J.; Wishart, D.S. Web-based inference of biological patterns, functions and pathways from metabolomic data using MetaboAnalyst. Nat. Protoc. 2011, 6, 743–760. [Google Scholar] [CrossRef]
- Liu, W.; Wang, Q.; Chang, J. Global metabolomic profiling of trastuzumab resistant gastric cancer cells reveals major metabolic pathways and metabolic signatures based on UHPLC-Q exactive-MS/MS. RSC Adv. 2019, 9, 41192–41208. [Google Scholar] [CrossRef]
- Pausova, Z.; Sliz, E. Large-Scale Population-Based Studies of Blood Metabolome and Brain Health. In Current Topics in Behavioral Neurosciences; Springer: Berlin/Heidelberg, Germany, 2024. [Google Scholar] [CrossRef]
- Lucchini, R.G.; Guazzetti, S.; Zoni, S.; Donna, F.; Peter, S.; Zacco, A.; Salmistraro, M.; Bontempi, E.; Zimmerman, N.J.; Smith, D.R. Tremor, olfactory and motor changes in Italian adolescents exposed to historical ferro-manganese emission. Neurotoxicology 2012, 33, 687–696. [Google Scholar] [CrossRef]
- Kivity, S.; Tsarfaty, G.; Agmon-Levin, N.; Blank, M.; Manor, D.; Konen, E.; Chapman, J.; Reichlin, M.; Wasson, C.; Shoenfeld, Y.; et al. Abnormal olfactory function demonstrated by manganese-enhanced MRI in mice with experimental neuropsychiatric lupus. Ann. N. Y. Acad. Sci. 2010, 1193, 70–77. [Google Scholar] [CrossRef]
- Werner, S.; Nies, E. Olfactory dysfunction revisited: A reappraisal of work-related olfactory dysfunction caused by chemicals. J. Occup. Med. Toxicol. 2018, 13, 28. [Google Scholar] [CrossRef]
- Fu, S.; Jiang, W.; Gao, X.; Zeng, A.; Cholger, D.; Cannon, J.; Chen, J.; Zheng, W. Aberrant Adult Neurogenesis in the Subventricular Zone-Rostral Migratory Stream-Olfactory Bulb System Following Subchronic Manganese Exposure. Toxicol. Sci. 2016, 150, 347–368. [Google Scholar] [CrossRef]
- Guilarte, T.R.; Burton, N.C.; McGlothan, J.L.; Verina, T.; Zhou, Y.; Alexander, M.; Pham, L.; Griswold, M.; Wong, D.F.; Syversen, T.; et al. Impairment of nigrostriatal dopamine neurotransmission by manganese is mediated by pre-synaptic mechanism(s): Implications to manganese-induced parkinsonism. J. Neurochem. 2008, 107, 1236–1247. [Google Scholar] [CrossRef]
- Moberly, A.H.; Czarnecki, L.A.; Pottackal, J.; Rubinstein, T.; Turkel, D.J.; Kass, M.D.; McGann, J.P. Intranasal exposure to manganese disrupts neurotransmitter release from glutamatergic synapses in the central nervous system in vivo. Neurotoxicology 2012, 33, 996–1004. [Google Scholar] [CrossRef]
- Perez Ortiz, J.M.; Swerdlow, R.H. Mitochondrial dysfunction in Alzheimer’s disease: Role in pathogenesis and novel therapeutic opportunities. Br. J. Pharmacol. 2019, 176, 3489–3507. [Google Scholar] [CrossRef]
- Wang, X.; Su, B.; Zheng, L.; Perry, G.; Smith, M.A.; Zhu, X. The role of abnormal mitochondrial dynamics in the pathogenesis of Alzheimer’s disease. J. Neurochem. 2009, 109 (Suppl. S1), 153–159. [Google Scholar] [CrossRef]
- Wang, X.L.; Wang, W.Z.; Li, L.; Perry, G.; Lee, H.G.; Zhu, X.W. Oxidative stress and mitochondrial dysfunction in Alzheimer’s disease. BBA-Mol. Basis. Dis. 2014, 1842, 1240–1247. [Google Scholar] [CrossRef]
- Morcillo, P.; Cordero, H.; Ijomone, O.M.; Ayodele, A.; Bornhorst, J.; Gunther, L.; Macaluso, F.P.; Bowman, A.B.; Aschner, M. Defective Mitochondrial Dynamics Underlie Manganese-Induced Neurotoxicity. Mol. Neurobiol. 2021, 58, 3270–3289. [Google Scholar] [CrossRef]
- Bhatia, V.; Sharma, S. Role of mitochondrial dysfunction, oxidative stress and autophagy in progression of Alzheimer’s disease. J. Neurol. Sci. 2021, 421, 117253. [Google Scholar] [CrossRef]
- Morello, M.; Canini, A.; Mattioli, P.; Sorge, R.P.; Alimonti, A.; Bocca, B.; Forte, G.; Martorana, A.; Bemardi, G.; Sancesario, G. Sub-cellular localization of manganese in the basal ganglia of normal and manganese-treated rats—An electron spectroscopy imaging and electron energy-loss spectroscopy study. Neurotoxicology 2008, 29, 60–72. [Google Scholar] [CrossRef]
- Brichta, L.; Greengard, P.; Flajolet, M. Advances in the pharmacological treatment of Parkinson’s disease: Targeting neurotransmitter systems. Trends Neurosci. 2013, 36, 543–554. [Google Scholar] [CrossRef]
- Vermeiren, Y.; Le Bastard, N.; Van Hemelrijck, A.; Drinkenburg, W.H.; Engelborghs, S.; De Deyn, P.P. Behavioral correlates of cerebrospinal fluid amino acid and biogenic amine neurotransmitter alterations in dementia. Alzheimer’s Dement. 2013, 9, 488–498. [Google Scholar] [CrossRef]
- Nimgampalle, M.; Chakravarthy, H.; Sharma, S.; Shree, S.; Bhat, A.R.; Pradeepkiran, J.A.; Devanathan, V. Neurotransmitter systems in the etiology of major neurological disorders: Emerging insights and therapeutic implications. Ageing Res. Rev. 2023, 89, 101994. [Google Scholar] [CrossRef]
- Simic, G.; Babic Leko, M.; Wray, S.; Harrington, C.R.; Delalle, I.; Jovanov-Milosevic, N.; Bazadona, D.; Buee, L.; de Silva, R.; Di Giovanni, G.; et al. Monoaminergic neuropathology in Alzheimer’s disease. Prog. Neurobiol. 2017, 151, 101–138. [Google Scholar] [CrossRef]
- Roy, J.; Tsui, K.C.; Ng, J.; Fung, M.L.; Lim, L.W. Regulation of Melatonin and Neurotransmission in Alzheimer’s Disease. Int. J. Mol. Sci. 2021, 22, 6841. [Google Scholar] [CrossRef]
- Lasley, S.M.; Fornal, C.A.; Mandal, S.; Strupp, B.J.; Beaudin, S.A.; Smith, D.R. Early Postnatal Manganese Exposure Reduces Rat Cortical and Striatal Biogenic Amine Activity in Adulthood. Toxicol. Sci. 2020, 173, 144–155. [Google Scholar] [CrossRef]
- Chandra, S.V.; Srivastava, R.S.; Shukla, G.S. Regional Distribution of Metals and Biogenic-Amines in the Brain of Monkeys Exposed to Manganese. Toxicol. Lett. 1979, 4, 189–192. [Google Scholar] [CrossRef]
- Plenis, A.; Oledzka, I.; Kowalski, P.; Miekus, N.; Baczek, T. Recent Trends in the Quantification of Biogenic Amines in Biofluids as Biomarkers of Various Disorders: A Review. J. Clin. Med. 2019, 8, 640. [Google Scholar] [CrossRef]
- Friedman, A.; Schildroth, S.; Bauer, J.A.; Coull, B.A.; Smith, D.R.; Placidi, D.; Cagna, G.; Krengel, M.H.; Tripodis, Y.; White, R.F.; et al. Early-life manganese exposure during multiple developmental periods and adolescent verbal learning and memory. Neurotoxicol. Teratol. 2023, 100, 107307. [Google Scholar] [CrossRef]
- Soares, A.T.G.; Silva, A.C.; Tinkov, A.A.; Khan, H.; Santamaria, A.; Skalnaya, M.G.; Skalny, A.V.; Tsatsakis, A.; Bowman, A.B.; Aschner, M.; et al. The impact of manganese on neurotransmitter systems. J. Trace Elem. Med. Biol. 2020, 61, 126554. [Google Scholar] [CrossRef]
- Hu, C.; Tao, L.; Cao, X.; Chen, L. The solute carrier transporters and the brain: Physiological and pharmacological implications. Asian J. Pharm. Sci. 2020, 15, 131–144. [Google Scholar] [CrossRef]
- Liu, Y.; Liu, F.; Iqbal, K.; Grundke-Iqbal, I.; Gong, C.X. Decreased glucose transporters correlate to abnormal hyperphosphorylation of tau in Alzheimer disease. FEBS Lett. 2008, 582, 359–364. [Google Scholar] [CrossRef]
- Piert, M.; Koeppe, R.A.; Giordani, B.; Berent, S.; Kuhl, D.E. Diminished glucose transport and phosphorylation in Alzheimer’s disease determined by dynamic FDG-PET. J. Nucl. Med. 1996, 37, 201–208. [Google Scholar]
- Hooijmans, C.R.; Graven, C.; Dederen, P.J.; Tanila, H.; van Groen, T.; Kiliaan, A.J. Amyloid beta deposition is related to decreased glucose transporter-1 levels and hippocampal atrophy in brains of aged APP/PS1 mice. Brain Res. 2007, 1181, 93–103. [Google Scholar] [CrossRef]
- Shah, K.; Desilva, S.; Abbruscato, T. The role of glucose transporters in brain disease: Diabetes and Alzheimer’s Disease. Int. J. Mol. Sci. 2012, 13, 12629–12655. [Google Scholar] [CrossRef]
- Kim, B.Y.; Lee, S.H.; Graham, P.L.; Angelucci, F.; Lucia, A.; Pareja-Galeano, H.; Leyhe, T.; Turana, Y.; Lee, I.R.; Yoon, J.H.; et al. Peripheral Brain-Derived Neurotrophic Factor Levels in Alzheimer’s Disease and Mild Cognitive Impairment: A Comprehensive Systematic Review and Meta-analysis. Mol. Neurobiol. 2017, 54, 7297–7311. [Google Scholar] [CrossRef]
- Butterfield, D.A.; Pocernich, C.B. The glutamatergic system and Alzheimer’s disease: Therapeutic implications. CNS Drugs 2003, 17, 641–652. [Google Scholar] [CrossRef]
- Woltjer, R.L.; Duerson, K.; Fullmer, J.M.; Mookherjee, P.; Ryan, A.M.; Montine, T.J.; Kaye, J.A.; Quinn, J.F.; Silbert, L.; Erten-Lyons, D.; et al. Aberrant detergent-insoluble excitatory amino acid transporter 2 accumulates in Alzheimer disease. J. Neuropathol. Exp. Neurol. 2010, 69, 667–676. [Google Scholar] [CrossRef]
- Abdul, H.M.; Sama, M.A.; Furman, J.L.; Mathis, D.M.; Beckett, T.L.; Weidner, A.M.; Patel, E.S.; Baig, I.; Murphy, M.P.; LeVine, H., 3rd; et al. Cognitive decline in Alzheimer’s disease is associated with selective changes in calcineurin/NFAT signaling. J. Neurosci. 2009, 29, 12957–12969. [Google Scholar] [CrossRef]
- Park, J.H.; Hogrebe, M.; Gruneberg, M.; DuChesne, I.; von der Heiden, A.L.; Reunert, J.; Schlingmann, K.P.; Boycott, K.M.; Beaulieu, C.L.; Mhanni, A.A.; et al. SLC39A8 Deficiency: A Disorder of Manganese Transport and Glycosylation. Am. J. Hum. Genet. 2015, 97, 894–903. [Google Scholar] [CrossRef]
- Broberg, K.; Taj, T.; Guazzetti, S.; Peli, M.; Cagna, G.; Pineda, D.; Placidi, D.; Wright, R.O.; Smith, D.R.; Lucchini, R.G.; et al. Manganese transporter genetics and sex modify the association between environmental manganese exposure and neurobehavioral outcomes in children. Environ. Int. 2019, 130, 104908. [Google Scholar] [CrossRef]
- Wahlberg, K.E.; Guazzetti, S.; Pineda, D.; Larsson, S.C.; Fedrighi, C.; Cagna, G.; Zoni, S.; Placidi, D.; Wright, R.O.; Smith, D.R.; et al. Polymorphisms in Manganese Transporters SLC30A10 and SLC39A8 Are Associated With Children’s Neurodevelopment by Influencing Manganese Homeostasis. Front. Genet. 2018, 9, 664. [Google Scholar] [CrossRef]
- Chen, P.; Chakraborty, S.; Mukhopadhyay, S.; Lee, E.; Paoliello, M.M.; Bowman, A.B.; Aschner, M. Manganese homeostasis in the nervous system. J. Neurochem. 2015, 134, 601–610. [Google Scholar] [CrossRef]
- Nho, K.; Kueider-Paisley, A.; Arnold, M.; MahmoudianDehkordi, S.; Risacher, S.L.; Louie, G.; Blach, C.; Baillie, R.; Han, X.; Kastenmuller, G.; et al. Serum metabolites associated with brain amyloid beta deposition, cognition and dementia progression. Brain Commun. 2021, 3, fcab139. [Google Scholar] [CrossRef]
- Huo, Z.; Yu, L.; Yang, J.; Zhu, Y.; Bennett, D.A.; Zhao, J. Brain and blood metabolome for Alzheimer’s dementia: Findings from a targeted metabolomics analysis. Neurobiol. Aging 2020, 86, 123–133. [Google Scholar] [CrossRef]
- Llano, D.A.; Devanarayan, V.; Alzheimer’s Disease Neuroimaging, I. Serum Phosphatidylethanolamine and Lysophosphatidylethanolamine Levels Differentiate Alzheimer’s Disease from Controls and Predict Progression from Mild Cognitive Impairment. J. Alzheimer’s Dis. 2021, 80, 311–319. [Google Scholar] [CrossRef]
- Guan, Z.; Wang, Y.; Cairns, N.J.; Lantos, P.L.; Dallner, G.; Sindelar, P.J. Decrease and structural modifications of phosphatidylethanolamine plasmalogen in the brain with Alzheimer disease. J. Neuropathol. Exp. Neurol. 1999, 58, 740–747. [Google Scholar] [CrossRef]
- Whiley, L.; Sen, A.; Heaton, J.; Proitsi, P.; Garcia-Gomez, D.; Leung, R.; Smith, N.; Thambisetty, M.; Kloszewska, I.; Mecocci, P.; et al. Evidence of altered phosphatidylcholine metabolism in Alzheimer’s disease. Neurobiol. Aging 2014, 35, 271–278. [Google Scholar] [CrossRef]
- He, X.; Huang, Y.; Li, B.; Gong, C.X.; Schuchman, E.H. Deregulation of sphingolipid metabolism in Alzheimer’s disease. Neurobiol. Aging 2010, 31, 398–408. [Google Scholar] [CrossRef]
- Caccamo, A.; Branca, C.; Piras, I.S.; Ferreira, E.; Huentelman, M.J.; Liang, W.S.; Readhead, B.; Dudley, J.T.; Spangenberg, E.E.; Green, K.N.; et al. Necroptosis activation in Alzheimer’s disease. Nat. Neurosci. 2017, 20, 1236–1246. [Google Scholar] [CrossRef]
- Li, J.; McQuade, T.; Siemer, A.B.; Napetschnig, J.; Moriwaki, K.; Hsiao, Y.S.; Damko, E.; Moquin, D.; Walz, T.; McDermott, A.; et al. The RIP1/RIP3 necrosome forms a functional amyloid signaling complex required for programmed necrosis. Cell 2012, 150, 339–350. [Google Scholar] [CrossRef]
- Khoury, M.K.; Gupta, K.; Franco, S.R.; Liu, B. Necroptosis in the Pathophysiology of Disease. Am. J. Pathol. 2020, 190, 272–285. [Google Scholar] [CrossRef]
- Akyol, S.; Ugur, Z.; Yilmaz, A.; Ustun, I.; Gorti, S.K.K.; Oh, K.; McGuinness, B.; Passmore, P.; Kehoe, P.G.; Maddens, M.E.; et al. Lipid Profiling of Alzheimer’s Disease Brain Highlights Enrichment in Glycerol(phospho)lipid, and Sphingolipid Metabolism. Cells 2021, 10, 2591. [Google Scholar] [CrossRef]
- Frisardi, V.; Panza, F.; Seripa, D.; Farooqui, T.; Farooqui, A.A. Glycerophospholipids and glycerophospholipid-derived lipid mediators: A complex meshwork in Alzheimer’s disease pathology. Prog. Lipid. Res. 2011, 50, 313–330. [Google Scholar] [CrossRef]
- Gonzalez-Dominguez, R.; Garcia-Barrera, T.; Gomez-Ariza, J.L. Combination of metabolomic and phospholipid-profiling approaches for the study of Alzheimer’s disease. J. Proteom. 2014, 104, 37–47. [Google Scholar] [CrossRef]
- Finkelstein, Y.; Milatovic, D.; Aschner, M. Modulation of cholinergic systems by manganese. Neurotoxicology 2007, 28, 1003–1014. [Google Scholar] [CrossRef]
- Chib, S.; Singh, S. Manganese and related neurotoxic pathways: A potential therapeutic target in neurodegenerative diseases. Neurotoxicol. Teratol. 2022, 94, 107124. [Google Scholar] [CrossRef]
- Teunissen, C.E.; Verberk, I.M.W.; Thijssen, E.H.; Vermunt, L.; Hansson, O.; Zetterberg, H.; van der Flier, W.M.; Mielke, M.M.; Del Campo, M. Blood-based biomarkers for Alzheimer’s disease: Towards clinical implementation. Lancet. Neurol. 2022, 21, 66–77. [Google Scholar] [CrossRef]
- Tong, Y.; Yang, H.; Tian, X.; Wang, H.; Zhou, T.; Zhang, S.; Yu, J.; Zhang, T.; Fan, D.; Guo, X.; et al. High manganese, a risk for Alzheimer’s disease: High manganese induces amyloid-beta related cognitive impairment. J. Alzheimer’s Dis. 2014, 42, 865–878. [Google Scholar] [CrossRef]
- Mohammed, R.S.; Ibrahim, W.; Sabry, D.; El-Jaafary, S.I. Occupational metals exposure and cognitive performance among foundry workers using tau protein as a biomarker. Neurotoxicology 2020, 76, 10–16. [Google Scholar] [CrossRef]
- Leuzy, A.; Mattsson-Carlgren, N.; Palmqvist, S.; Janelidze, S.; Dage, J.L.; Hansson, O. Blood-based biomarkers for Alzheimer’s disease. EMBO Mol. Med. 2022, 14, e14408. [Google Scholar] [CrossRef]
- Mattsson, N.; Zetterberg, H.; Janelidze, S.; Insel, P.S.; Andreasson, U.; Stomrud, E.; Palmqvist, S.; Baker, D.; Tan Hehir, C.A.; Jeromin, A.; et al. Plasma tau in Alzheimer disease. Neurology 2016, 87, 1827–1835. [Google Scholar] [CrossRef]
- Griffin, W.S. Inflammation and neurodegenerative diseases. Am. J. Clin. Nutr. 2006, 83, 470S–474S. [Google Scholar] [CrossRef]
- Leng, F.; Edison, P. Neuroinflammation and microglial activation in Alzheimer disease: Where do we go from here? Nat. Rev. Neurol. 2021, 17, 157–172. [Google Scholar] [CrossRef]
- McGeer, P.L.; Akiyama, H.; Itagaki, S.; McGeer, E.G. Immune system response in Alzheimer’s disease. Can. J. Neurol. Sci. 1989, 16, 516–527. [Google Scholar] [CrossRef]
- Bonifati, D.M.; Kishore, U. Role of complement in neurodegeneration and neuroinflammation. Mol. Immunol. 2007, 44, 999–1010. [Google Scholar] [CrossRef]
- Leung, R.; Proitsi, P.; Simmons, A.; Lunnon, K.; Guntert, A.; Kronenberg, D.; Pritchard, M.; Tsolaki, M.; Mecocci, P.; Kloszewska, I.; et al. Inflammatory proteins in plasma are associated with severity of Alzheimer’s disease. PLoS ONE 2013, 8, e64971. [Google Scholar] [CrossRef]
- Soares, H.D.; Potter, W.Z.; Pickering, E.; Kuhn, M.; Immermann, F.W.; Shera, D.M.; Ferm, M.; Dean, R.A.; Simon, A.J.; Swenson, F.; et al. Plasma biomarkers associated with the apolipoprotein E genotype and Alzheimer disease. Arch. Neurol. 2012, 69, 1310–1317. [Google Scholar] [CrossRef]
- Lin, G.; Li, X.; Cheng, X.; Zhao, N.; Zheng, W. Manganese Exposure Aggravates beta-Amyloid Pathology by Microglial Activation. Front. Aging Neurosci. 2020, 12, 556008. [Google Scholar] [CrossRef]
- Ehtewish, H.; Mesleh, A.; Ponirakis, G.; Lennard, K.; Al Hamad, H.; Chandran, M.; Parray, A.; Abdesselem, H.; Wijten, P.; Decock, J.; et al. Profiling the autoantibody repertoire reveals autoantibodies associated with mild cognitive impairment and dementia. Front. Neurol. 2023, 14, 1256745. [Google Scholar] [CrossRef]
- San Segundo-Acosta, P.; Montero-Calle, A.; Jernbom-Falk, A.; Alonso-Navarro, M.; Pin, E.; Andersson, E.; Hellstrom, C.; Sanchez-Martinez, M.; Rabano, A.; Solis-Fernandez, G.; et al. Multiomics Profiling of Alzheimer’s Disease Serum for the Identification of Autoantibody Biomarkers. J. Proteome. Res. 2021, 20, 5115–5130. [Google Scholar] [CrossRef]
- Hu, W.T.; Holtzman, D.M.; Fagan, A.M.; Shaw, L.M.; Perrin, R.; Arnold, S.E.; Grossman, M.; Xiong, C.; Craig-Schapiro, R.; Clark, C.M.; et al. Plasma multianalyte profiling in mild cognitive impairment and Alzheimer disease. Neurology 2012, 79, 897–905. [Google Scholar] [CrossRef]
- Shi, M.; Chu, F.; Zhu, F.; Zhu, J. Impact of Anti-amyloid-beta Monoclonal Antibodies on the Pathology and Clinical Profile of Alzheimer’s Disease: A Focus on Aducanumab and Lecanemab. Front. Aging Neurosci. 2022, 14, 870517. [Google Scholar] [CrossRef]
- Shim, S.M.; Koh, Y.H.; Kim, J.H.; Jeon, J.P. A combination of multiple autoantibodies is associated with the risk of Alzheimer’s disease and cognitive impairment. Sci. Rep. 2022, 12, 1312. [Google Scholar] [CrossRef]
- Song, M.S.; Mook-Jung, I.; Lee, H.J.; Min, J.Y.; Park, M.H. Serum anti-amyloid-beta antibodies and Alzheimer’s disease in elderly Korean patients. J. Int. Med. Res. 2007, 35, 301–306. [Google Scholar] [CrossRef]
- Liu, Y.H.; Wang, J.; Li, Q.X.; Fowler, C.J.; Zeng, F.; Deng, J.; Xu, Z.Q.; Zhou, H.D.; Doecke, J.D.; Villemagne, V.L.; et al. Association of naturally occurring antibodies to beta-amyloid with cognitive decline and cerebral amyloidosis in Alzheimer’s disease. Sci. Adv. 2021, 7, eabb0457. [Google Scholar] [CrossRef]
- Shir, D.; Graff-Radford, J.; Hofrenning, E.I.; Lesnick, T.G.; Przybelski, S.A.; Lowe, V.J.; Knopman, D.S.; Petersen, R.C.; Jack, C.R., Jr.; Vemuri, P.; et al. Association of plasma glial fibrillary acidic protein (GFAP) with neuroimaging of Alzheimer’s disease and vascular pathology. Alzheimer’s Dement. 2022, 14, e12291. [Google Scholar] [CrossRef]
- Chatterjee, P.; Pedrini, S.; Stoops, E.; Goozee, K.; Villemagne, V.L.; Asih, P.R.; Verberk, I.M.W.; Dave, P.; Taddei, K.; Sohrabi, H.R.; et al. Plasma glial fibrillary acidic protein is elevated in cognitively normal older adults at risk of Alzheimer’s disease. Transl. Psychiatry 2021, 11, 27. [Google Scholar] [CrossRef]
- Salama, M.; Shalash, A.; Magdy, A.; Makar, M.; Roushdy, T.; Elbalkimy, M.; Elrassas, H.; Elkafrawy, P.; Mohamed, W.; Abou Donia, M.B. Tubulin and Tau: Possible targets for diagnosis of Parkinson’s and Alzheimer’s diseases. PLoS ONE 2018, 13, e0196436. [Google Scholar] [CrossRef]
- Ariga, T. The Pathogenic Role of Ganglioside Metabolism in Alzheimer’s Disease-Cholinergic Neuron-Specific Gangliosides and Neurogenesis. Mol. Neurobiol. 2017, 54, 623–638. [Google Scholar] [CrossRef]
- Wu, J.; Li, L. Autoantibodies in Alzheimer’s disease: Potential biomarkers, pathogenic roles, and therapeutic implications. J. Biomed. Res. 2016, 30, 361–372. [Google Scholar] [CrossRef]
- Myagkova, M.A.; Gavrilova, S.I.; Lermontova, N.N.; Kalyn, Y.B.; Selezneva, N.D.; Zharikov, G.A.; Kolykhalov, I.V.; Abramenko, T.V.; Serkova, T.P.; Bachurin, S.O. Autoantibodies to beta-amyloid and neurotransmitters in patients with Alzheimer’s disease and senile dementia of the Alzheimer type. Bull Exp. Biol. Med. 2001, 131, 127–129. [Google Scholar] [CrossRef]
- Gruden, M.A.; Davidova, T.B.; Malisauskas, M.; Sewell, R.D.; Voskresenskaya, N.I.; Wilhelm, K.; Elistratova, E.I.; Sherstnev, V.V.; Morozova-Roche, L.A. Differential neuroimmune markers to the onset of Alzheimer’s disease neurodegeneration and dementia: Autoantibodies to Abeta((25-35)) oligomers, S100b and neurotransmitters. J. Neuroimmunol. 2007, 186, 181–192. [Google Scholar] [CrossRef]
- Biamonti, G.; Amato, A.; Belloni, E.; Di Matteo, A.; Infantino, L.; Pradella, D.; Ghigna, C. Alternative splicing in Alzheimer’s disease. Aging Clin. Exp. Res. 2021, 33, 747–758. [Google Scholar] [CrossRef]
- Ule, J.; Ule, A.; Spencer, J.; Williams, A.; Hu, J.S.; Cline, M.; Wang, H.; Clark, T.; Fraser, C.; Ruggiu, M.; et al. Nova regulates brain-specific splicing to shape the synapse. Nat. Genet. 2005, 37, 844–852. [Google Scholar] [CrossRef]
- Linnartz-Gerlach, B.; Kopatz, J.; Neumann, H. Siglec functions of microglia. Glycobiology 2014, 24, 794–799. [Google Scholar] [CrossRef]
- Siddiqui, S.S.; Matar, R.; Merheb, M.; Hodeify, R.; Vazhappilly, C.G.; Marton, J.; Shamsuddin, S.A.; Al Zouabi, H. Siglecs in Brain Function and Neurological Disorders. Cells 2019, 8, 1125. [Google Scholar] [CrossRef]
- Hansen, N.; Fitzner, D.; Stocker, W.; Wiltfang, J.; Bartels, C. Mild Cognitive Impairment in Chronic Brain Injury Associated with Serum Anti-AP3B2 Autoantibodies: Report and Literature Review. Brain Sci. 2021, 11, 1208. [Google Scholar] [CrossRef]
- Nakatsu, F.; Okada, M.; Mori, F.; Kumazawa, N.; Iwasa, H.; Zhu, G.; Kasagi, Y.; Kamiya, H.; Harada, A.; Nishimura, K.; et al. Defective function of GABA-containing synaptic vesicles in mice lacking the AP-3B clathrin adaptor. J. Cell Biol. 2004, 167, 293–302. [Google Scholar] [CrossRef]
- Tomizawa, M.; Shinozaki, F.; Fugo, K.; Motoyoshi, Y.; Sugiyama, T.; Yamamoto, S.; Kishimoto, T.; Ishige, N. Anti-mitochondrial M2 antibody-positive autoimmune hepatitis. Exp. Ther. Med. 2015, 10, 1419–1422. [Google Scholar] [CrossRef]
- Guilarte, T.R. Manganese and Parkinson’s disease: A critical review and new findings. Environ. Health Perspect. 2011, 16, 4549–4566. [Google Scholar] [CrossRef]
- Kaplan, M.M.; Gershwin, M.E. Primary biliary cirrhosis. N. Engl. J. Med. 2005, 353, 1261–1273. [Google Scholar] [CrossRef]
- Bergstrom, S.; Remnestal, J.; Yousef, J.; Olofsson, J.; Markaki, I.; Carvalho, S.; Corvol, J.C.; Kultima, K.; Kilander, L.; Lowenmark, M.; et al. Multi-cohort profiling reveals elevated CSF levels of brain-enriched proteins in Alzheimer’s disease. Ann. Clin. Transl. Neurol. 2021, 8, 1456–1470. [Google Scholar] [CrossRef]
- De Jesus-Cortes, H.J.; Nogueras-Ortiz, C.J.; Gearing, M.; Arnold, S.E.; Vega, I.E. Amphiphysin-1 protein level changes associated with tau-mediated neurodegeneration. Neuroreport 2012, 23, 942–946. [Google Scholar] [CrossRef] [PubMed]
- Schmidt, S.D.; Nachtigall, E.G.; Marcondes, L.A.; Zanluchi, A.; Furini, C.R.G.; Passani, M.B.; Supuran, C.T.; Blandina, P.; Izquierdo, I.; Provensi, G.; et al. Modulation of Carbonic Anhydrases Activity in the Hippocampus or Prefrontal Cortex Differentially Affects Social Recognition Memory in Rats. Neuroscience 2022, 497, 184–195. [Google Scholar] [CrossRef] [PubMed]
- Blandina, P.; Provensi, G.; Passsani, M.B.; Capasso, C.; Supuran, C.T. Carbonic anhydrase modulation of emotional memory. Implications for the treatment of cognitive disorders. J. Enzym. Inhib. Med. Chem. 2020, 35, 1206–1214. [Google Scholar] [CrossRef] [PubMed]
- Jiao, Y.; Yan, J.; Zhao, Y.; Donahue, L.R.; Beamer, W.G.; Li, X.; Roe, B.A.; Ledoux, M.S.; Gu, W. Carbonic anhydrase-related protein VIII deficiency is associated with a distinctive lifelong gait disorder in waddles mice. Genetics 2005, 171, 1239–1246. [Google Scholar] [CrossRef]
- Zhuang, G.Z.; Upadhyay, U.; Tong, X.; Kang, Y.; Erasso, D.M.; Fu, E.S.; Sarantopoulos, K.D.; Martin, E.R.; Wiltshire, T.; Diatchenko, L.; et al. Human carbonic anhydrase-8 AAV8 gene therapy inhibits nerve growth factor signaling producing prolonged analgesia and anti-hyperalgesia in mice. Gene. Ther. 2018, 25, 297–311. [Google Scholar] [CrossRef]


| Characteristics | Exposed N (%) | Controls N (%) | Statistic | p Value |
|---|---|---|---|---|
| Age (years) | ||||
| 54–61 | 3 (50%) | 3 (60%) | Chi2 = 0.0 | 1.00 |
| 62–69 | 3 (50%) | 2 (40%) | ||
| Smoking Consumption | ||||
| YES | 3 (50%) | 3 (60%) | Chi2 = 0.0 | 1.00 |
| NO | 3 (50%) | 2 (40%) | ||
| Alcohol Consumption | ||||
| YES | 5 (83%) | 3 (60%) | Chi2 = 0.03 | 0.85 |
| NO | 1 (17%) | 2 (40%) | ||
| Comorbidity | ||||
| YES | 5 (83%). | 4 (80%) | Chi2 = 0.0 | 1.00 |
| NO | 1 (17%) | 2 (20%) | ||
| ND Family History * | ||||
| YES | 3 (50%) | 2 (40%) | Chi2 = 0.0 | 1.00 |
| NO | 3 (50%) | 3 (60%) |
| Pathway Name | Pathway Lipids | p-Value | Benjamini Correction |
|---|---|---|---|
| Glycerophospholipid metabolism | 26 | 0.00039213 | 0.0018621 |
| Choline metabolism in cancer Necroptosis | 5 4 | 0.0004138 0.02954564 | 0.0018621 0.0886369 |
| Retrograde endocannabinoid signaling | 8 | 0.05843168 | 0.1179923 |
Disclaimer/Publisher’s Note: The statements, opinions and data contained in all publications are solely those of the individual author(s) and contributor(s) and not of MDPI and/or the editor(s). MDPI and/or the editor(s) disclaim responsibility for any injury to people or property resulting from any ideas, methods, instructions or products referred to in the content. |
© 2025 by the authors. Licensee MDPI, Basel, Switzerland. This article is an open access article distributed under the terms and conditions of the Creative Commons Attribution (CC BY) license (https://creativecommons.org/licenses/by/4.0/).
Share and Cite
Azmoun, S.; Lewis, F.C.; Shoieb, D.; Jin, Y.; Colicino, E.; Mhatre-Winters, I.; Gu, H.; Krishnamurthy, H.; Richardson, J.R.; Placidi, D.; et al. Impact of Manganese on Neuronal Function: An Exploratory Multi-Omics Study on Ferroalloy Workers in Brescia, Italy. Brain Sci. 2025, 15, 829. https://doi.org/10.3390/brainsci15080829
Azmoun S, Lewis FC, Shoieb D, Jin Y, Colicino E, Mhatre-Winters I, Gu H, Krishnamurthy H, Richardson JR, Placidi D, et al. Impact of Manganese on Neuronal Function: An Exploratory Multi-Omics Study on Ferroalloy Workers in Brescia, Italy. Brain Sciences. 2025; 15(8):829. https://doi.org/10.3390/brainsci15080829
Chicago/Turabian StyleAzmoun, Somaiyeh, Freeman C. Lewis, Daniel Shoieb, Yan Jin, Elena Colicino, Isha Mhatre-Winters, Haiwei Gu, Hari Krishnamurthy, Jason R. Richardson, Donatella Placidi, and et al. 2025. "Impact of Manganese on Neuronal Function: An Exploratory Multi-Omics Study on Ferroalloy Workers in Brescia, Italy" Brain Sciences 15, no. 8: 829. https://doi.org/10.3390/brainsci15080829
APA StyleAzmoun, S., Lewis, F. C., Shoieb, D., Jin, Y., Colicino, E., Mhatre-Winters, I., Gu, H., Krishnamurthy, H., Richardson, J. R., Placidi, D., Lambertini, L., & Lucchini, R. G. (2025). Impact of Manganese on Neuronal Function: An Exploratory Multi-Omics Study on Ferroalloy Workers in Brescia, Italy. Brain Sciences, 15(8), 829. https://doi.org/10.3390/brainsci15080829