
AI-Assisted Edema Map Optimization Improves Infarction Detection in Twin-Spiral Dual-Energy CT
 , ,
, ,
Abstract
1. Introduction
2. Materials and Methods
2.1. Patients
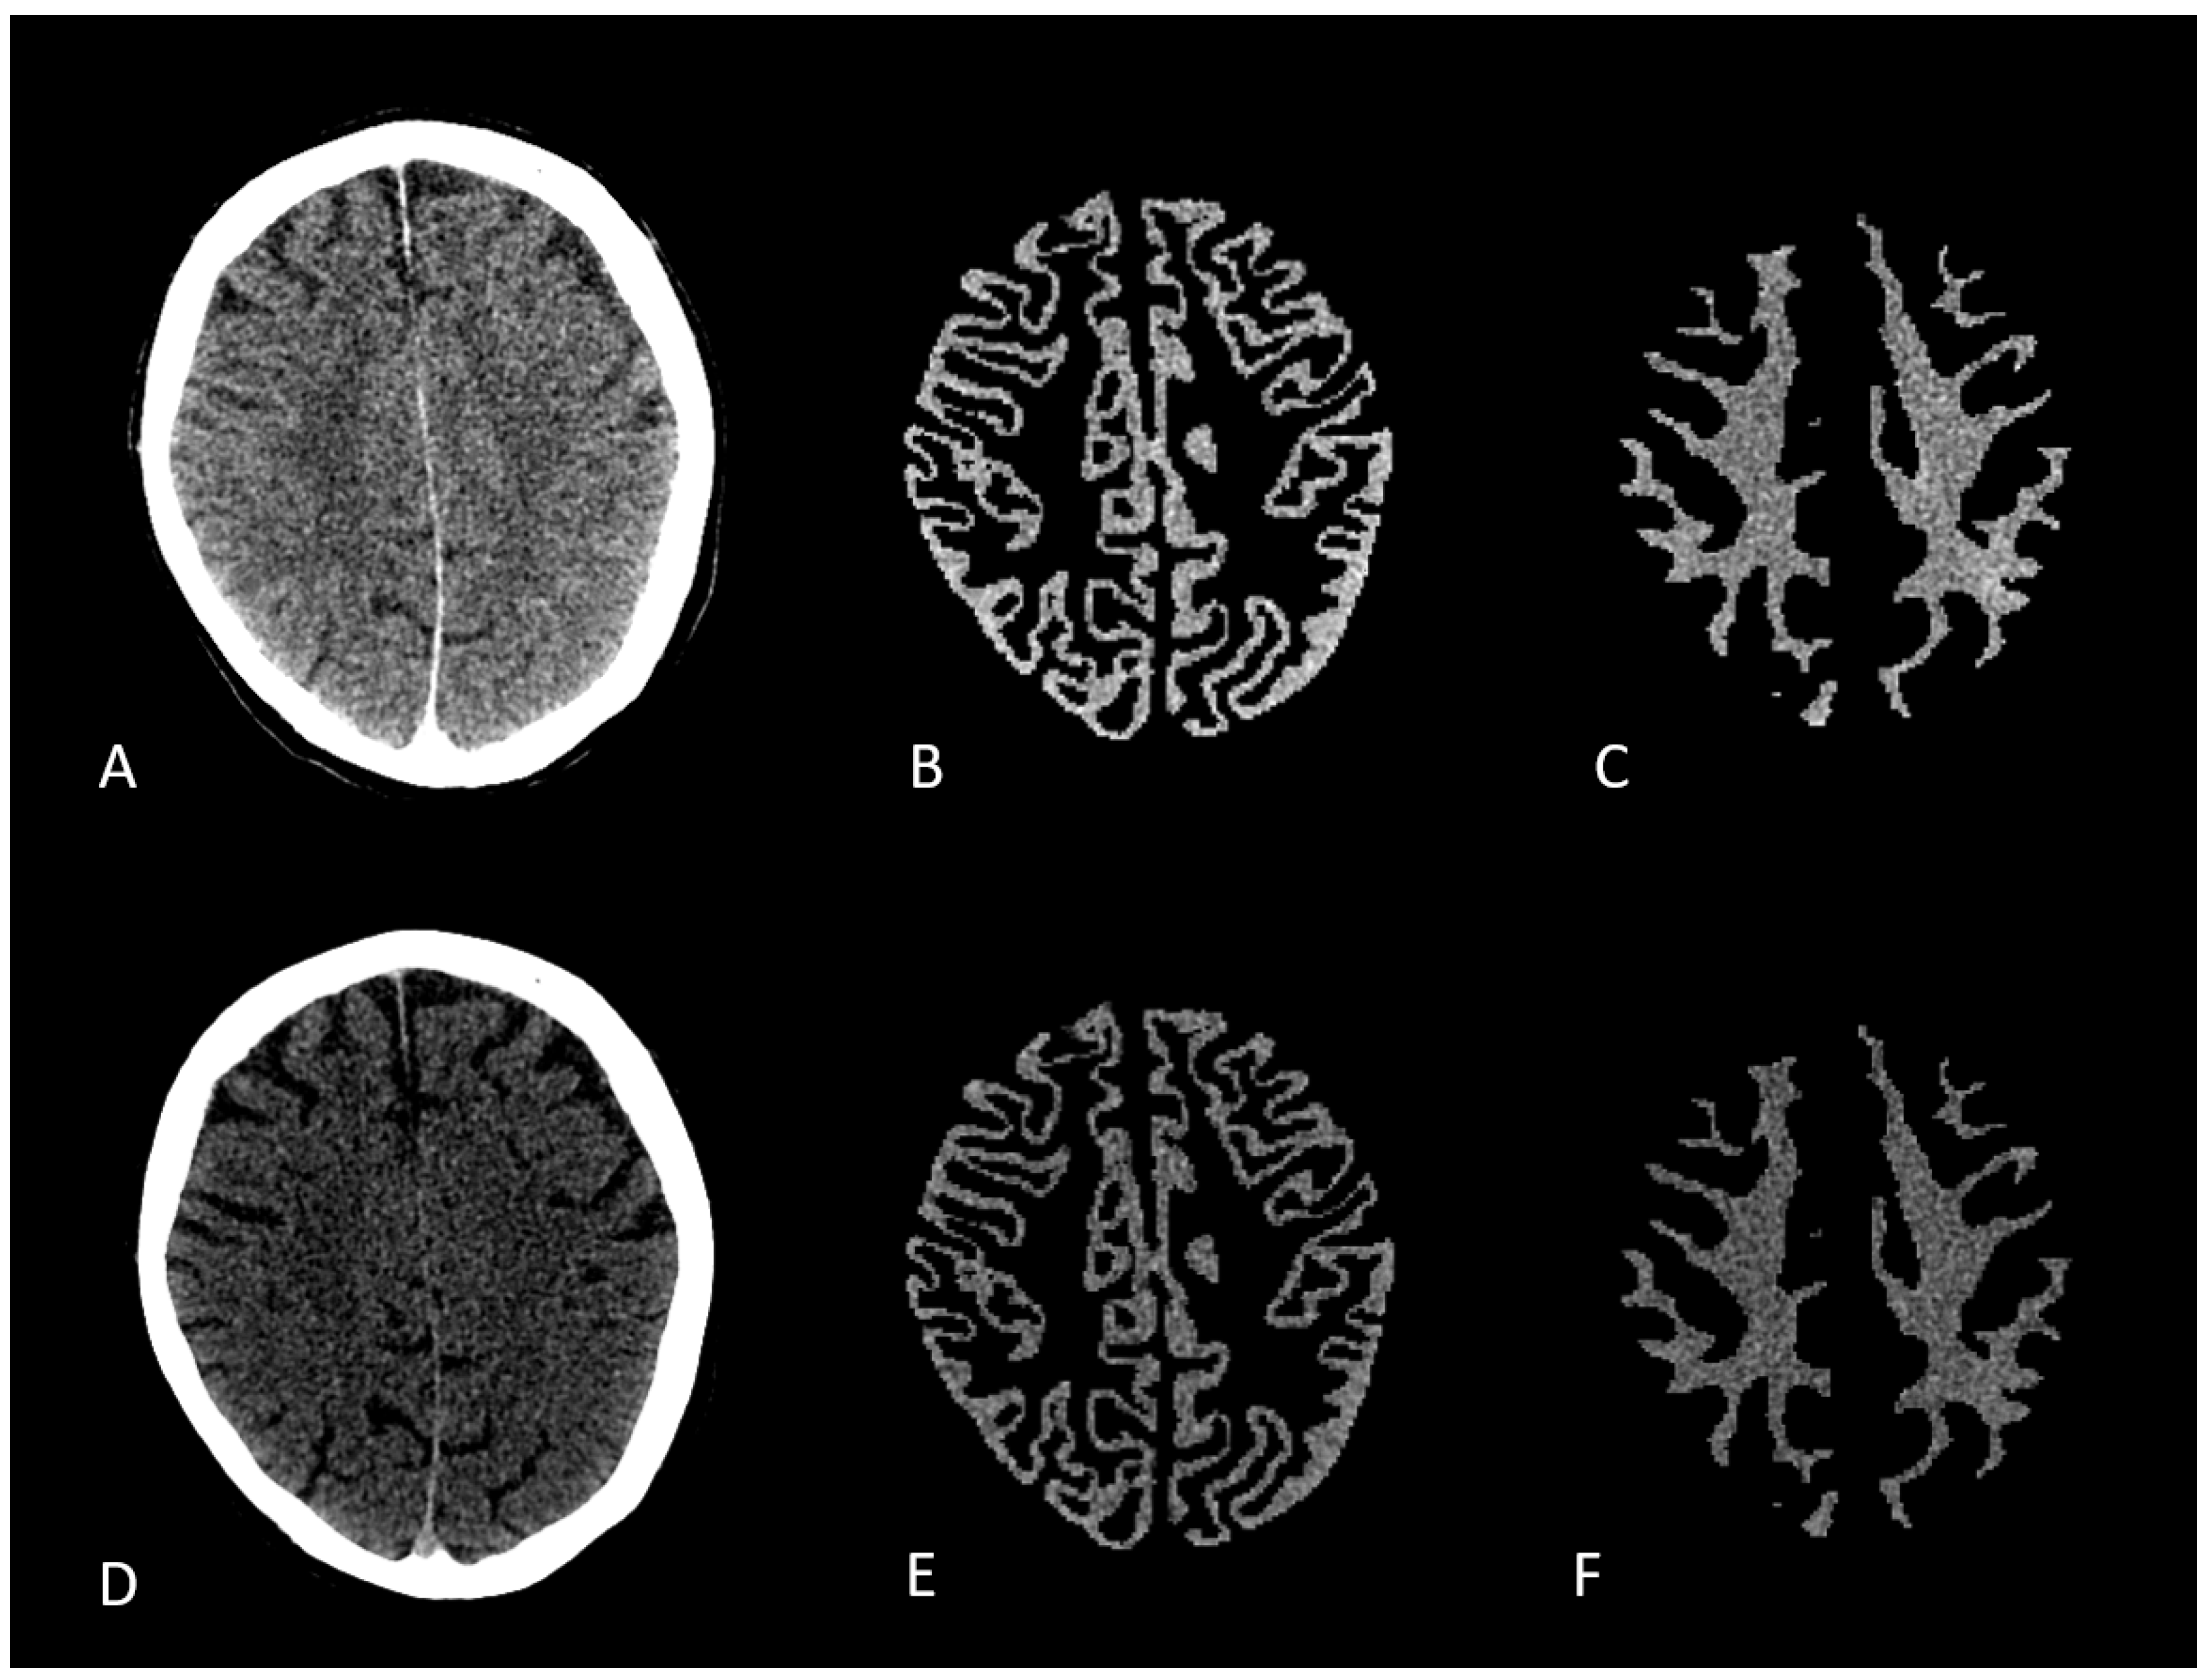
2.2. Image Acquisition and Post Processing
2.3. Image Conversion
2.4. Image and Statistical Analysis
3. Results
4. Discussion
5. Conclusions
Author Contributions
Funding
Institutional Review Board Statement
Informed Consent Statement
Data Availability Statement
Conflicts of Interest
Abbreviations
| AI | Artificial Intelligence |
| CNN | Convolutional Neural Network |
| CT | Computed Tomography |
| DECT | Dual-Energy Computed Tomography |
| DWI | Diffusion-Weighted Imaging |
| EVT | Endovascular Stroke Therapy |
| GM | Gray Matter |
| HU | Hounsfield Unit |
| ICA | Internal Carotid Artery |
| ICH | Intracranial Hemorrhage |
| LVO | Large Vessel Occlusion |
| MCA | Middle Cerebral Artery |
| MPRAGE | Magnetization Prepared Rapid Acquisition Gradient Echo |
| MRI | Magnetic Resonance Imaging |
| PACS | Picture Archiving and Communication System |
| ROI | Region of Interest |
| SECT | Single-Energy Computed Tomography |
| VNC | Virtual Non-Contrast |
| WM | White Matter |
References
- Katan, M.; Luft, A. Global burden of stroke. In Seminars in Neurology; Thieme Medical Publishers: Stuttgart, Germany, 2018; Volume 38, pp. 208–211. [Google Scholar]
- Albers, G.W.; Marks, M.P.; Kemp, S.; Christensen, S.; Tsai, J.P.; Ortega-Gutierrez, S.; McTaggart, R.A.; Torbey, M.T.; Kim-Tenser, M.; Leslie-Mazwi, T.; et al. Thrombectomy for stroke at 6 to 16 hours with selection by perfusion imaging. N. Engl. J. Med. 2018, 378, 708–718. [Google Scholar] [CrossRef] [PubMed]
- Huo, X.; Ma, G.; Tong, X.; Zhang, X.; Pan, Y.; Nguyen, T.N.; Yuan, G.; Han, H.; Chen, W.; Wei, M.; et al. Trial of endovascular therapy for acute ischemic stroke with large infarct. N. Engl. J. Med. 2023, 388, 1272–1283. [Google Scholar] [CrossRef]
- Nogueira, R.G.; Jadhav, A.P.; Haussen, D.C.; Bonafe, A.; Budzik, R.F.; Bhuva, P.; Yavagal, D.R.; Ribo, M.; Cognard, C.; Hanel, R.A.; et al. Thrombectomy 6 to 24 hours after stroke with a mismatch between deficit and infarct. N. Engl. J. Med. 2018, 378, 11–21. [Google Scholar] [CrossRef]
- Sarraj, A.; Hassan, A.E.; Abraham, M.G.; Ortega-Gutierrez, S.; Kasner, S.E.; Hussain, M.S.; Chen, M.; Blackburn, S.; Sitton, C.W.; Churilov, L.; et al. Trial of endovascular thrombectomy for large ischemic strokes. N. Engl. J. Med. 2023, 388, 1259–1271. [Google Scholar] [CrossRef]
- Whitney, E.; Khan, Y.R.; Alastra, A.; Schiraldi, M.; Siddiqi, J. Contrast extravasation post thrombectomy in patients with acute cerebral stroke: A review and recommendations for future studies. Cureus 2020, 12, e10616. [Google Scholar] [CrossRef]
- Zidan, M.; Ghaei, S.; Bode, F.J.; Weller, J.M.; Krueger, N.; Lehnen, N.C.; Petzold, G.C.; Radbruch, A.; Dorn, F.; Paech, D. Clinical significance and prevalence of subarachnoid hyperdensities on flat detector CT after mechanical thrombectomy: Does it really matter? J. NeuroInterv. Surg. 2024, 16, 966–973. [Google Scholar] [CrossRef]
- McCollough, C.H.; Leng, S.; Yu, L.; Fletcher, J.G. Dual-and multi-energy CT: Principles, technical approaches, and clinical applications. Radiology 2015, 276, 637–653. [Google Scholar] [CrossRef]
- Wolman, D.N.; Patel, B.P.; Wintermark, M.; Heit, J.J. Dual-energy computed tomography applications in neurointervention. J. Comput. Assist. Tomogr. 2018, 42, 831–839. [Google Scholar] [CrossRef]
- Gupta, R.; Phan, C.M.; Leidecker, C.; Brady, T.J.; Hirsch, J.A.; Nogueira, R.G.; Yoo, A.J. Evaluation of dual-energy CT for differentiating intracerebral hemorrhage from iodinated contrast material staining. Radiology 2010, 257, 205–211. [Google Scholar] [CrossRef] [PubMed]
- Tan, C.O.; Kuppens, D.; Gupta, R. Dual-energy CT. In Neuroimaging Techniques in Clinical Practice: Physical Concepts and Clinical Applications; Springer: Berlin/Heidelberg, Germany, 2020; pp. 69–86. [Google Scholar]
- Wolman, D.N.; van Ommen, F.; Tong, E.; Kauw, F.; Dankbaar, J.W.; Bennink, E.; de Jong, H.W.; Molvin, L.; Wintermark, M.; Heit, J.J. Non-contrast dual-energy CT virtual ischemia maps accurately estimate ischemic core size in large-vessel occlusive stroke. Sci. Rep. 2021, 11, 6745. [Google Scholar] [CrossRef] [PubMed]
- Omoumi, P.; Becce, F.; Racine, D.; Ott, J.G.; Andreisek, G.; Verdun, F.R. Dual-energy CT: Basic principles, technical approaches, and applications in musculoskeletal imaging (part 1). In Seminars in Musculoskeletal Radiology; Thieme Medical Publishers: Stuttgart, Germany, 2015; Volume 19, pp. 431–437. [Google Scholar]
- Renú, A.; Laredo, C.; Rodríguez-Vázquez, A.; Santana, D.; Werner, M.; Llull, L.; Lopez-Rueda, A.; Urra, X.; Rudilosso, S.; Obach, V.; et al. Characterization of subarachnoid hyperdensities after thrombectomy for acute stroke using dual-energy CT. Neurology 2022, 98, e601–e611. [Google Scholar] [CrossRef]
- Grkovski, R.; Acu, L.; Ahmadli, U.; Terziev, R.; Schubert, T.; Wegener, S.; Kulcsar, Z.; Husain, S.; Alkadhi, H.; Winklhofer, S. A novel dual-energy CT method for detection and differentiation of intracerebral hemorrhage from contrast extravasation in stroke patients after endovascular thrombectomy: Feasibility and first results. Clin. Neuroradiol. 2023, 33, 171–177. [Google Scholar] [CrossRef]
- Grkovski, R.; Acu, L.; Ahmadli, U.; Nakhostin, D.; Thurner, P.; Wacht, L.; Kulcsár, Z.; Alkadhi, H.; Winklhofer, S. Dual-energy computed tomography in stroke imaging: Value of a new image acquisition technique for ischemia detection after mechanical thrombectomy. Clin. Neuroradiol. 2023, 33, 747–754. [Google Scholar] [CrossRef]
- Al-Janabi, O.M.; El Refaei, A.; Elgazzar, T.; Mahmood, Y.M.; Bakir, D.; Gajjar, A.; Alateya, A.; Jha, S.K.; Ghozy, S.; Kallmes, D.F.; et al. Current stroke solutions using artificial intelligence: A review of the literature. Brain Sci. 2024, 14, 1182. [Google Scholar] [CrossRef]
- Mouridsen, K.; Thurner, P.; Zaharchuk, G. Artificial intelligence applications in stroke. Stroke 2020, 51, 2573–2579. [Google Scholar] [CrossRef] [PubMed]
- Pham, C.H.; Tor-Díez, C.; Meunier, H.; Bednarek, N.; Fablet, R.; Passat, N.; Rousseau, F. Multiscale brain MRI super-resolution using deep 3D convolutional networks. Comput. Med. Imaging Graph. 2019, 77, 101647. [Google Scholar] [CrossRef]
- McCann, M.T.; Jin, K.H.; Unser, M. Convolutional neural networks for inverse problems in imaging: A review. IEEE Signal Process. Mag. 2017, 34, 85–95. [Google Scholar] [CrossRef]
- Mohammed, M.F.; Marais, O.; Min, A.; Ferguson, D.; Jalal, S.; Khosa, F.; O’Keeffe, M.; O’Connell, T.; Schmiedeskamp, H.; Krauss, B.; et al. Unenhanced dual-energy computed tomography: Visualization of brain edema. Investig. Radiol. 2018, 53, 63–69. [Google Scholar] [CrossRef] [PubMed]
- Grams, A.E.; Djurdjevic, T.; Rehwald, R.; Schiestl, T.; Dazinger, F.; Steiger, R.; Knoflach, M.; Gizewski, E.R.; Glodny, B. Improved visualisation of early cerebral infarctions after endovascular stroke therapy using dual-energy computed tomography oedema maps. Eur. Radiol. 2018, 28, 4534–4541. [Google Scholar] [CrossRef] [PubMed]
- Iglesias, J.E.; Billot, B.; Balbastre, Y.; Magdamo, C.; Arnold, S.E.; Das, S.; Edlow, B.L.; Alexander, D.C.; Golland, P.; Fischl, B. SynthSR: A public AI tool to turn heterogeneous clinical brain scans into high-resolution T1-weighted images for 3D morphometry. Sci. Adv. 2023, 9, eadd3607. [Google Scholar] [CrossRef]
- McKinney, W. Data structures for statistical computing in Python. In Proceedings of the SciPy, Austin, TX, USA, 28 June–3 July 2010; Volume 445, pp. 51–56. [Google Scholar]
- R Core Team. R: A Language and Environment for Statistical Computing; The R Foundation for Statistical Computing: Vienna, Austria, 2020. [Google Scholar]
- Mokin, M.; Kan, P.; Kass-Hout, T.; Abla, A.A.; Dumont, T.M.; Snyder, K.V.; Hopkins, L.N.; Siddiqui, A.H.; Levy, E.I. Intracerebral hemorrhage secondary to intravenous and endovascular intraarterial revascularization therapies in acute ischemic stroke: An update on risk factors, predictors, and management. Neurosurg. Focus 2012, 32, E2. [Google Scholar] [CrossRef]
- Postma, A.A.; Das, M.; Stadler, A.A.; Wildberger, J.E. Dual-energy CT: What the neuroradiologist should know. Curr. Radiol. Rep. 2015, 3, 16. [Google Scholar] [CrossRef] [PubMed]
- Zhang, X.; Xie, Y.; Wang, H.; Yang, D.; Jiang, T.; Yuan, K.; Gong, P.; Xu, P.; Li, Y.; Chen, J.; et al. Symptomatic intracranial hemorrhage after mechanical thrombectomy in Chinese ischemic stroke patients: The ASIAN score. Stroke 2020, 51, 2690–2696. [Google Scholar] [CrossRef] [PubMed]
- Puntonet, J.; Richard, M.E.; Edjlali, M.; Ben Hassen, W.; Legrand, L.; Benzakoun, J.; Rodriguez-Régent, C.; Trystram, D.; Naggara, O.; Méder, J.F.; et al. Imaging findings after mechanical thrombectomy in acute ischemic stroke: Clinical implications and perspectives. Stroke 2019, 50, 1618–1625. [Google Scholar] [CrossRef]
- Phan, C.; Yoo, A.; Hirsch, J.; Nogueira, R.; Gupta, R. Differentiation of hemorrhage from iodinated contrast in different intracranial compartments using dual-energy head CT. Am. J. Neuroradiol. 2012, 33, 1088–1094. [Google Scholar] [CrossRef]
- Taguchi, K.; Itoh, T.; Fuld, M.K.; Fournie, E.; Lee, O.; Noguchi, K. “X-map 2.0” for edema signal enhancement for acute ischemic stroke using non–contrast-enhanced dual-energy computed tomography. Investig. Radiol. 2018, 53, 432–439. [Google Scholar] [CrossRef] [PubMed]
- Kimura, S.; Toyoda, K.; Yoshimura, S.; Minematsu, K.; Yasaka, M.; Paciaroni, M.; Werring, D.J.; Yamagami, H.; Nagao, T.; Yoshimura, S.; et al. Practical “1-2-3-4-day” rule for starting direct oral anticoagulants after ischemic stroke with atrial fibrillation: Combined hospital-based cohort study. Stroke 2022, 53, 1540–1549. [Google Scholar] [CrossRef]
- Fischer, U.; Koga, M.; Strbian, D.; Branca, M.; Abend, S.; Trelle, S.; Paciaroni, M.; Thomalla, G.; Michel, P.; Nedeltchev, K.; et al. Early versus later anticoagulation for stroke with atrial fibrillation. N. Engl. J. Med. 2023, 388, 2411–2421. [Google Scholar] [CrossRef]
- van Ommen, F.; Dankbaar, J.W.; Zhu, G.; Wolman, D.N.; Heit, J.J.; Kauw, F.; Bennink, E.; de Jong, H.W.; Wintermark, M. Virtual monochromatic dual-energy CT reconstructions improve detection of cerebral infarct in patients with suspicion of stroke. Neuroradiology 2021, 63, 41–49. [Google Scholar] [CrossRef]
- Chen, H.; Bodanapally, U.K.; Colasurdo, M.; Malhotra, A.; Gandhi, D. Clinical Applications of Dual-Energy Computed Tomography for Acute Ischemic Stroke. Stroke: Vasc. Interv. Neurol. 2024, 4, e001193. [Google Scholar] [CrossRef]


| Scan Type | Number of Analyzed Voxels | Median HU (SD) |
|---|---|---|
| High-Energy CT (GM) | 7,277,096 | 32 (2.19) |
| High-Energy CT (WM) | 7,108,959 | 27.95 (1.27) |
| Low-Energy CT (GM) | 7,291,076 | 47.84 (3.25) |
| Low-Energy CT (WM) | 7,122,897 | 39.92 (2.25) |
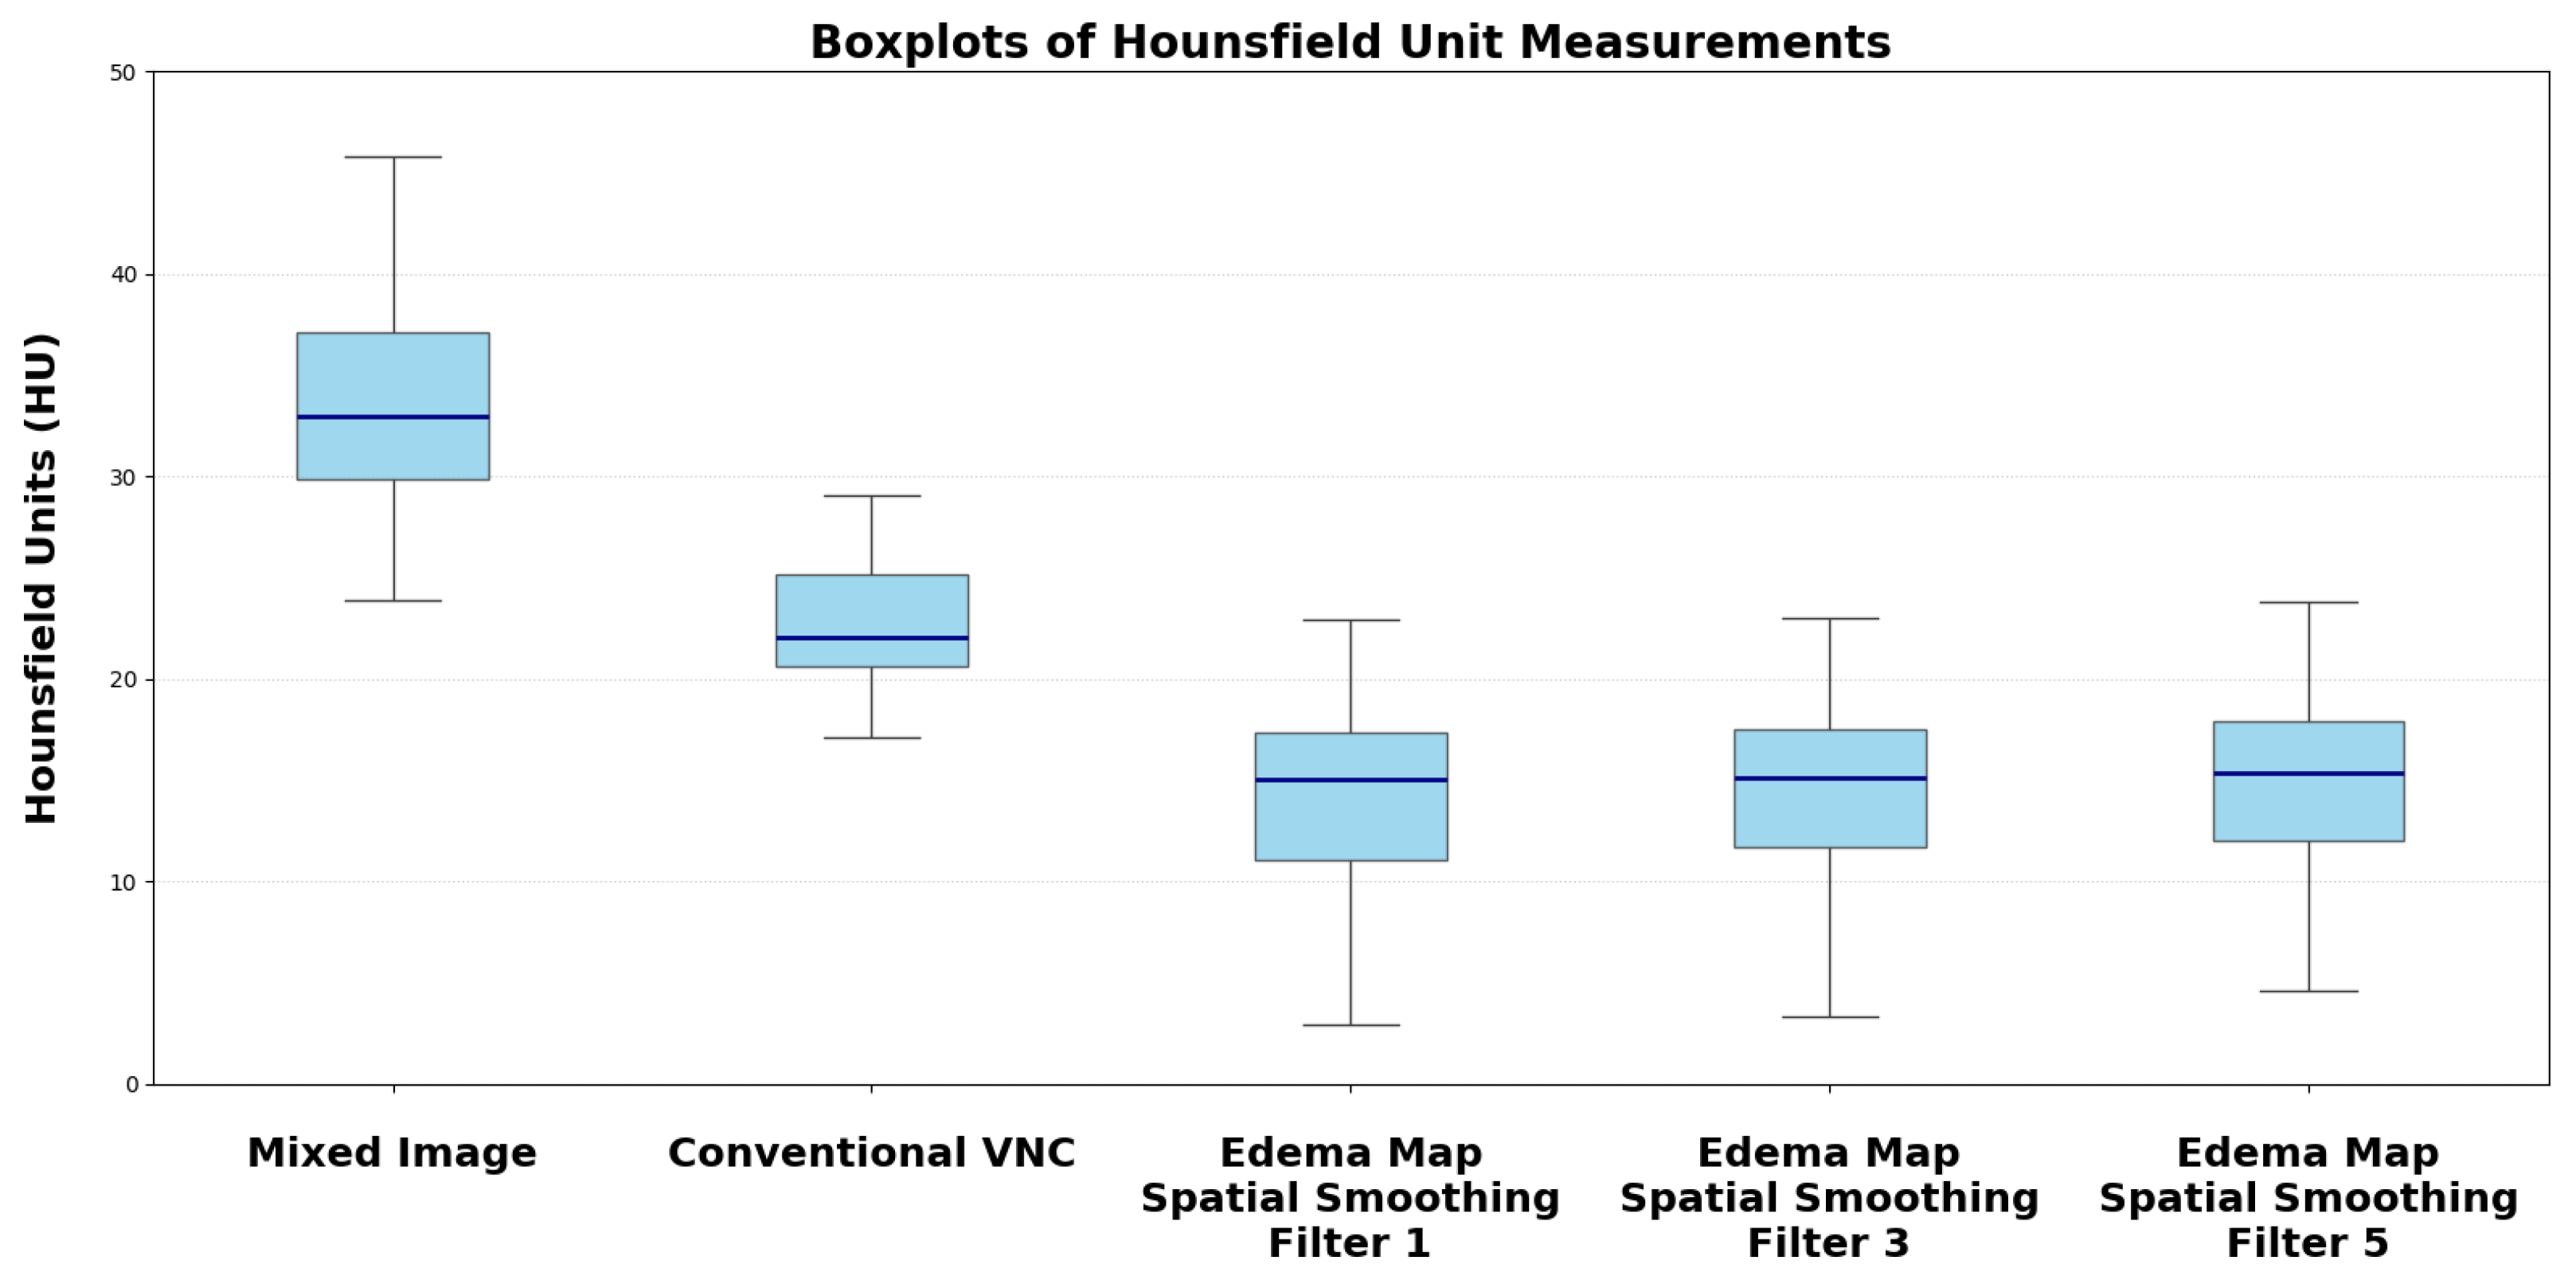
| Reconstruction | Median HU (SD) | p-Value vs. Mixed Image/VNC |
|---|---|---|
| Conventional Mixed Image | 33.73 (4.58) | |
| Default VNC | 22.96 (3.85) | |
| Edema Map Resolution 1 | 14.39 (4.98) | |
| Edema Map Resolution 3 | 14.50 (3.75) | |
| Edema Map Resolution 5 | 15.05 (2.65) |
Disclaimer/Publisher’s Note: The statements, opinions and data contained in all publications are solely those of the individual author(s) and contributor(s) and not of MDPI and/or the editor(s). MDPI and/or the editor(s) disclaim responsibility for any injury to people or property resulting from any ideas, methods, instructions or products referred to in the content. |
© 2025 by the authors. Licensee MDPI, Basel, Switzerland. This article is an open access article distributed under the terms and conditions of the Creative Commons Attribution (CC BY) license (https://creativecommons.org/licenses/by/4.0/).
Share and Cite
Singer, L.; Heinze, D.; Möhle, T.A.; Sekita, A.; Mennecke, A.; Lang, S.; Gerner, S.T.; Schwab, S.; Dörfler, A.; Schmidt, M.A. AI-Assisted Edema Map Optimization Improves Infarction Detection in Twin-Spiral Dual-Energy CT. Brain Sci. 2025, 15, 821. https://doi.org/10.3390/brainsci15080821
Singer L, Heinze D, Möhle TA, Sekita A, Mennecke A, Lang S, Gerner ST, Schwab S, Dörfler A, Schmidt MA. AI-Assisted Edema Map Optimization Improves Infarction Detection in Twin-Spiral Dual-Energy CT. Brain Sciences. 2025; 15(8):821. https://doi.org/10.3390/brainsci15080821
Chicago/Turabian StyleSinger, Ludwig, Daniel Heinze, Tim Alexius Möhle, Alexander Sekita, Angelika Mennecke, Stefan Lang, Stefan T. Gerner, Stefan Schwab, Arnd Dörfler, and Manuel Alexander Schmidt. 2025. "AI-Assisted Edema Map Optimization Improves Infarction Detection in Twin-Spiral Dual-Energy CT" Brain Sciences 15, no. 8: 821. https://doi.org/10.3390/brainsci15080821
APA StyleSinger, L., Heinze, D., Möhle, T. A., Sekita, A., Mennecke, A., Lang, S., Gerner, S. T., Schwab, S., Dörfler, A., & Schmidt, M. A. (2025). AI-Assisted Edema Map Optimization Improves Infarction Detection in Twin-Spiral Dual-Energy CT. Brain Sciences, 15(8), 821. https://doi.org/10.3390/brainsci15080821