
Empathic Traits Modulate Oscillatory Dynamics Revealed by Time–Frequency Analysis During Body Language Reading


Abstract

1. Introduction
1.1. Study Aim and Hypotheses
1.2. Background and Theoretical Framework
1.3. Methodological Approach and Rationale
2. Materials and Methods
2.1. Participants
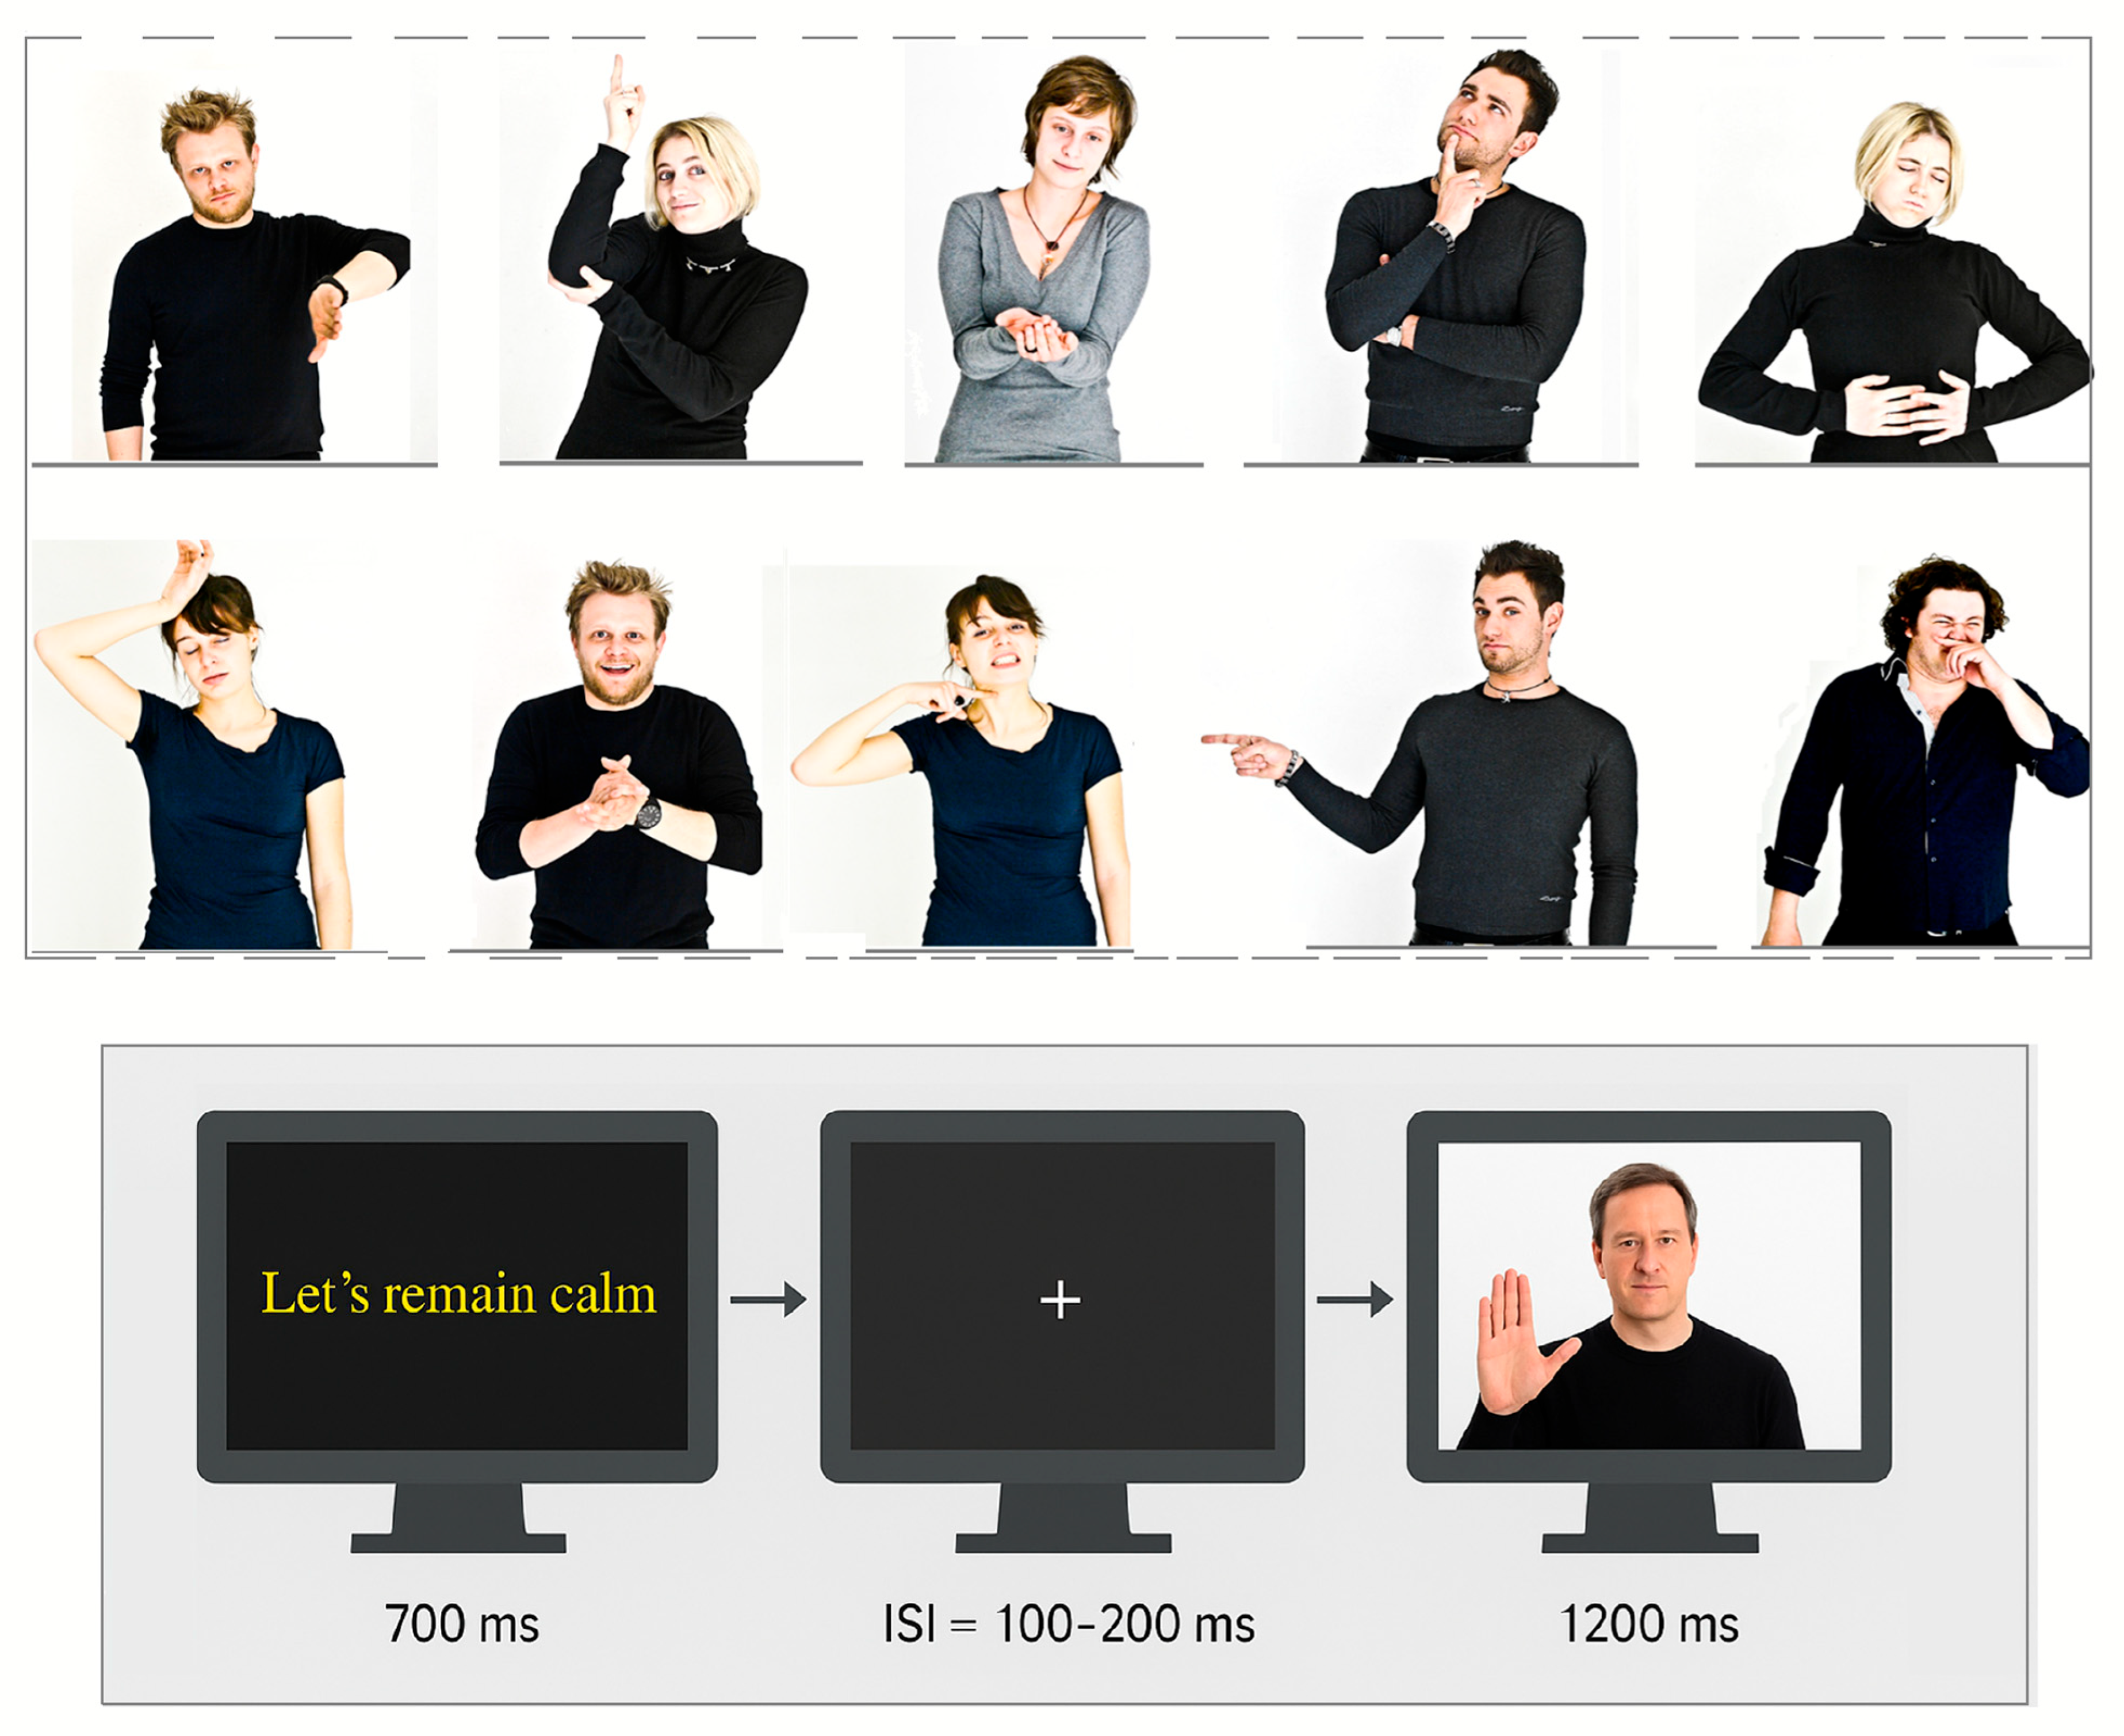
2.2. Stimuli
2.3. Procedure
2.4. EEG Recordings and Analysis
3. Results
3.1. Behavioral Data
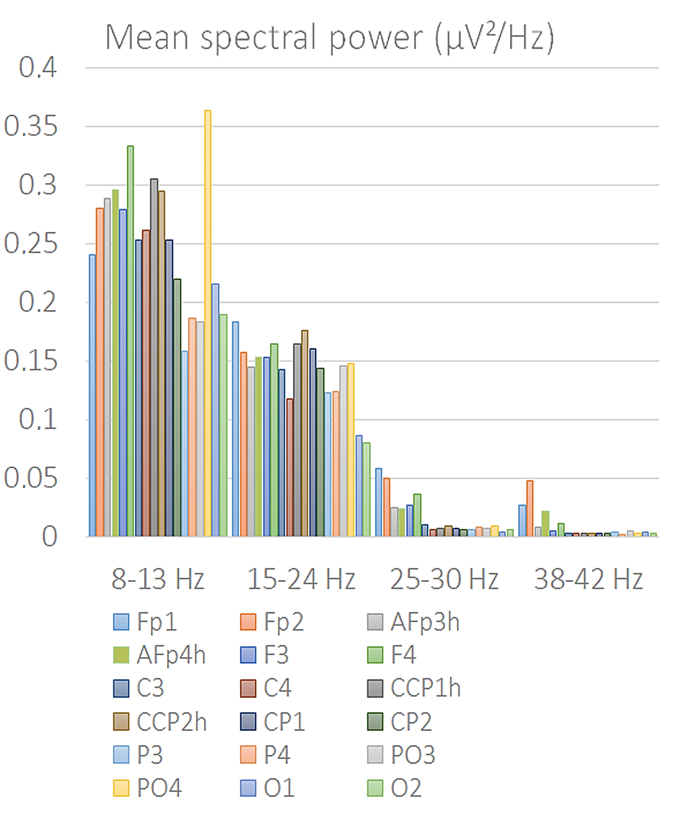
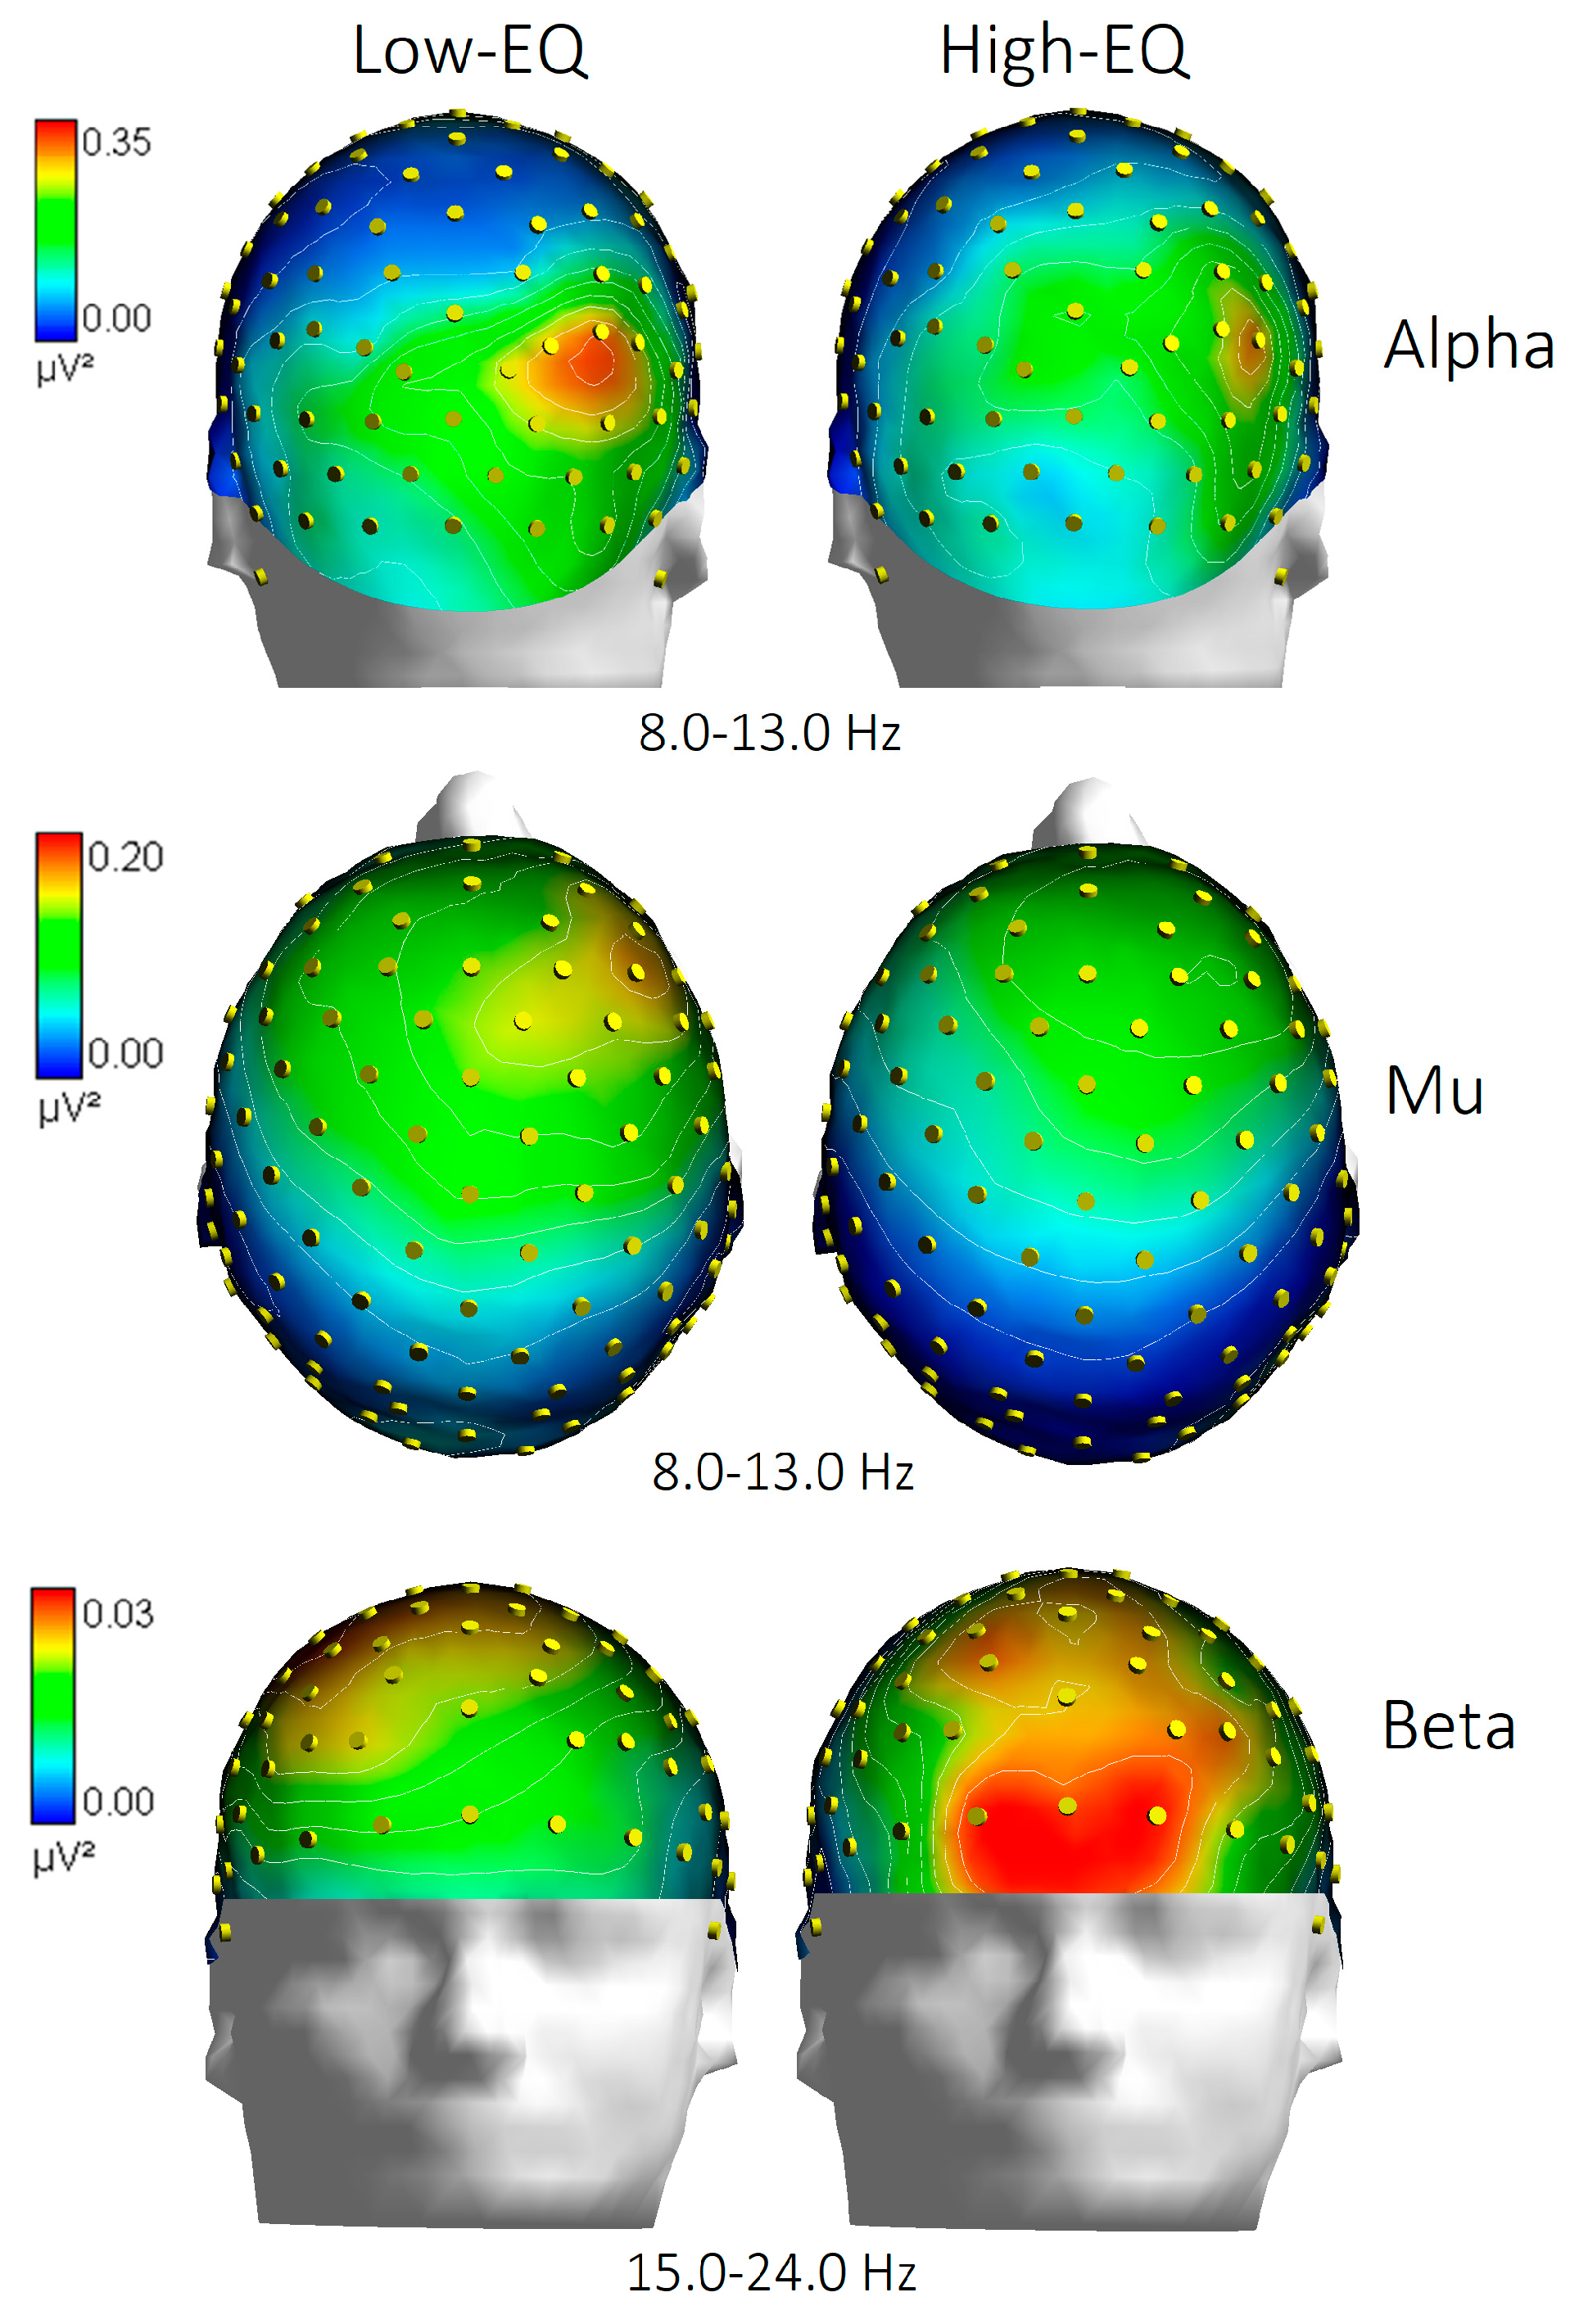
3.2. Fast Fourier Frequency Analysis (FFT)
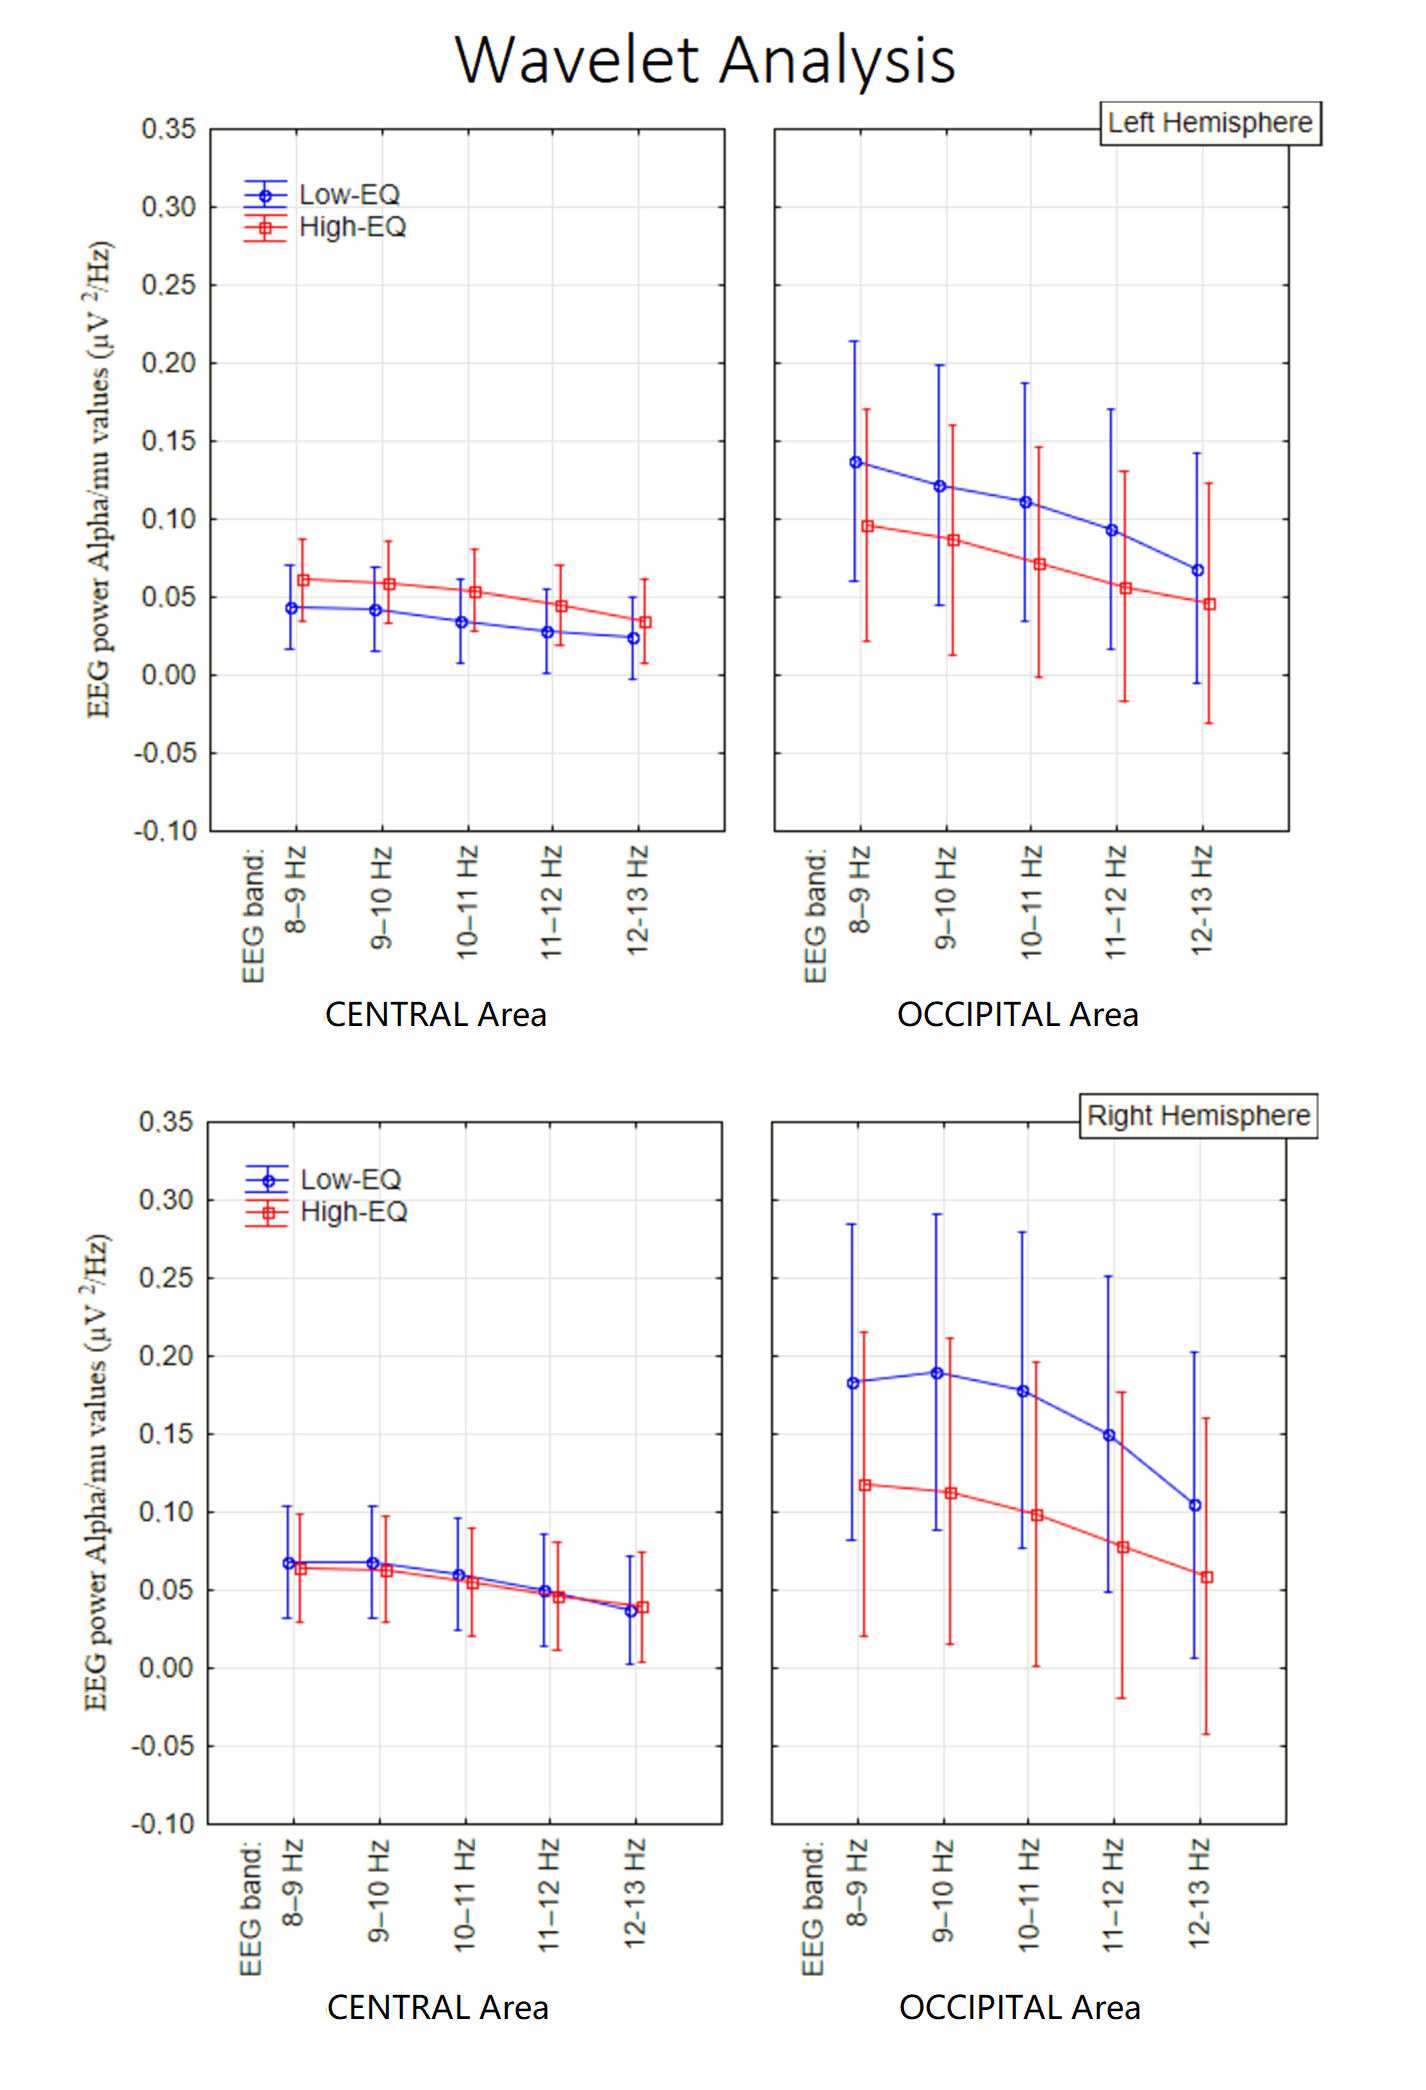
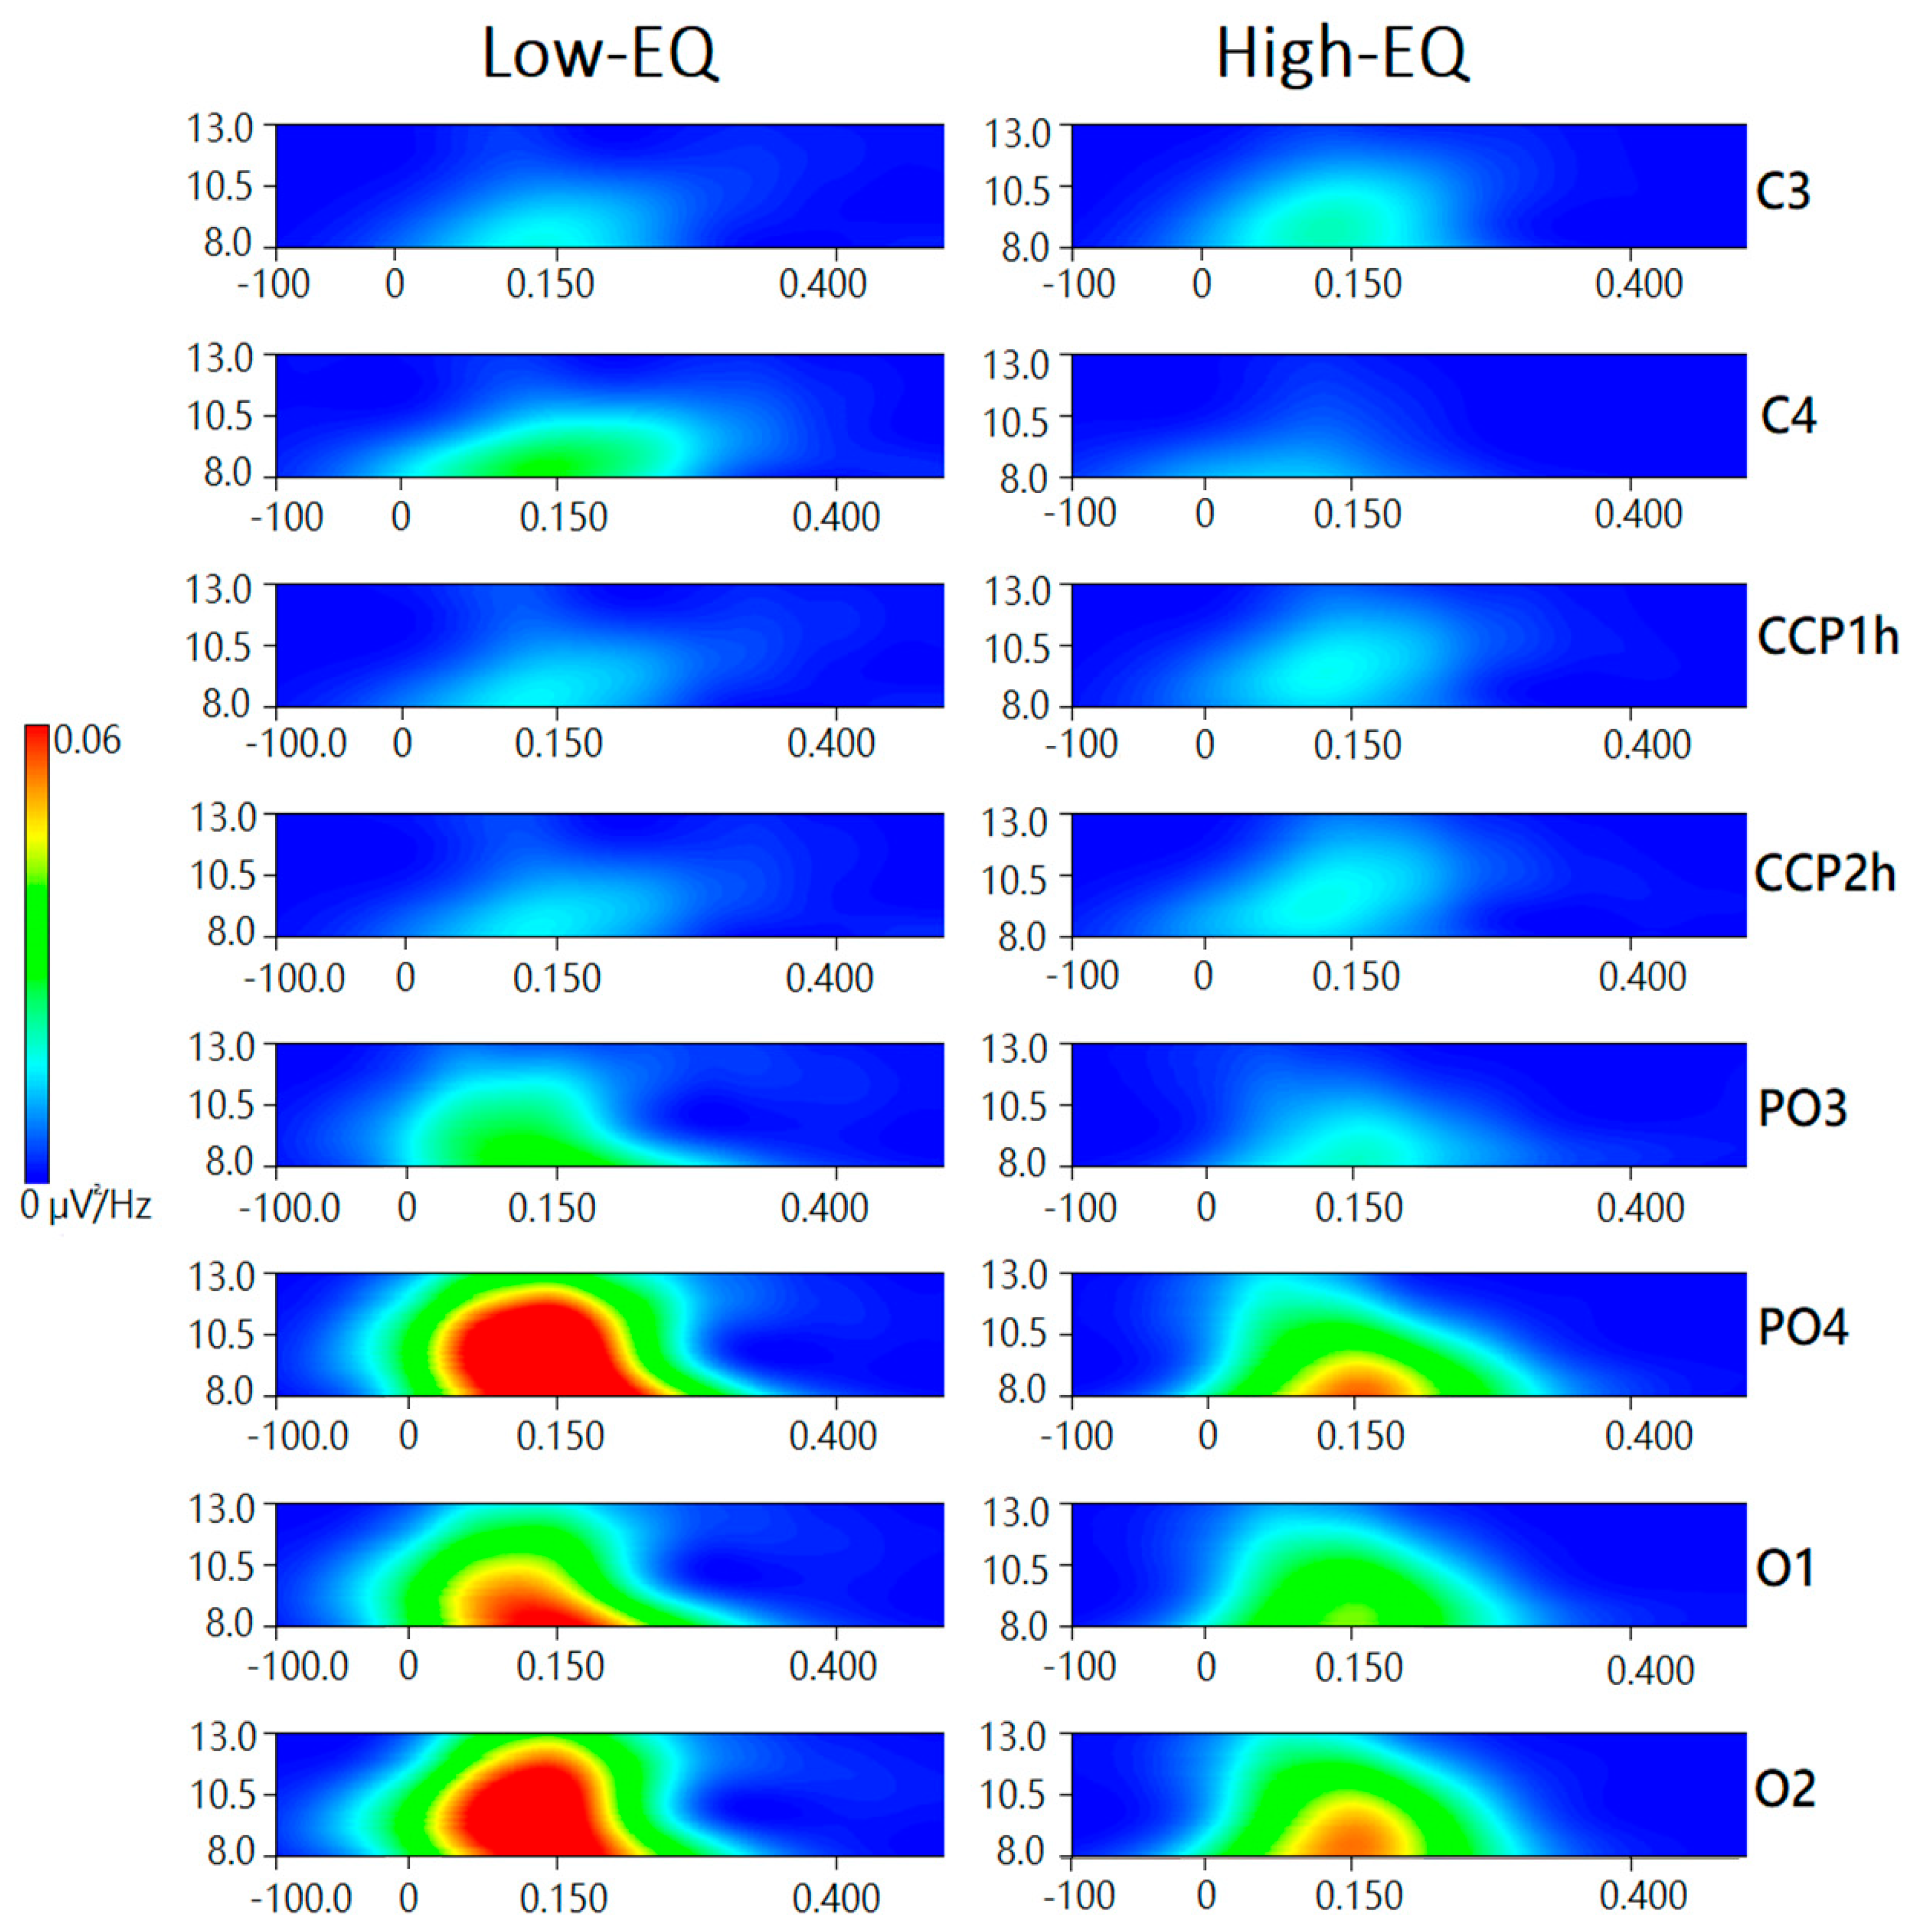
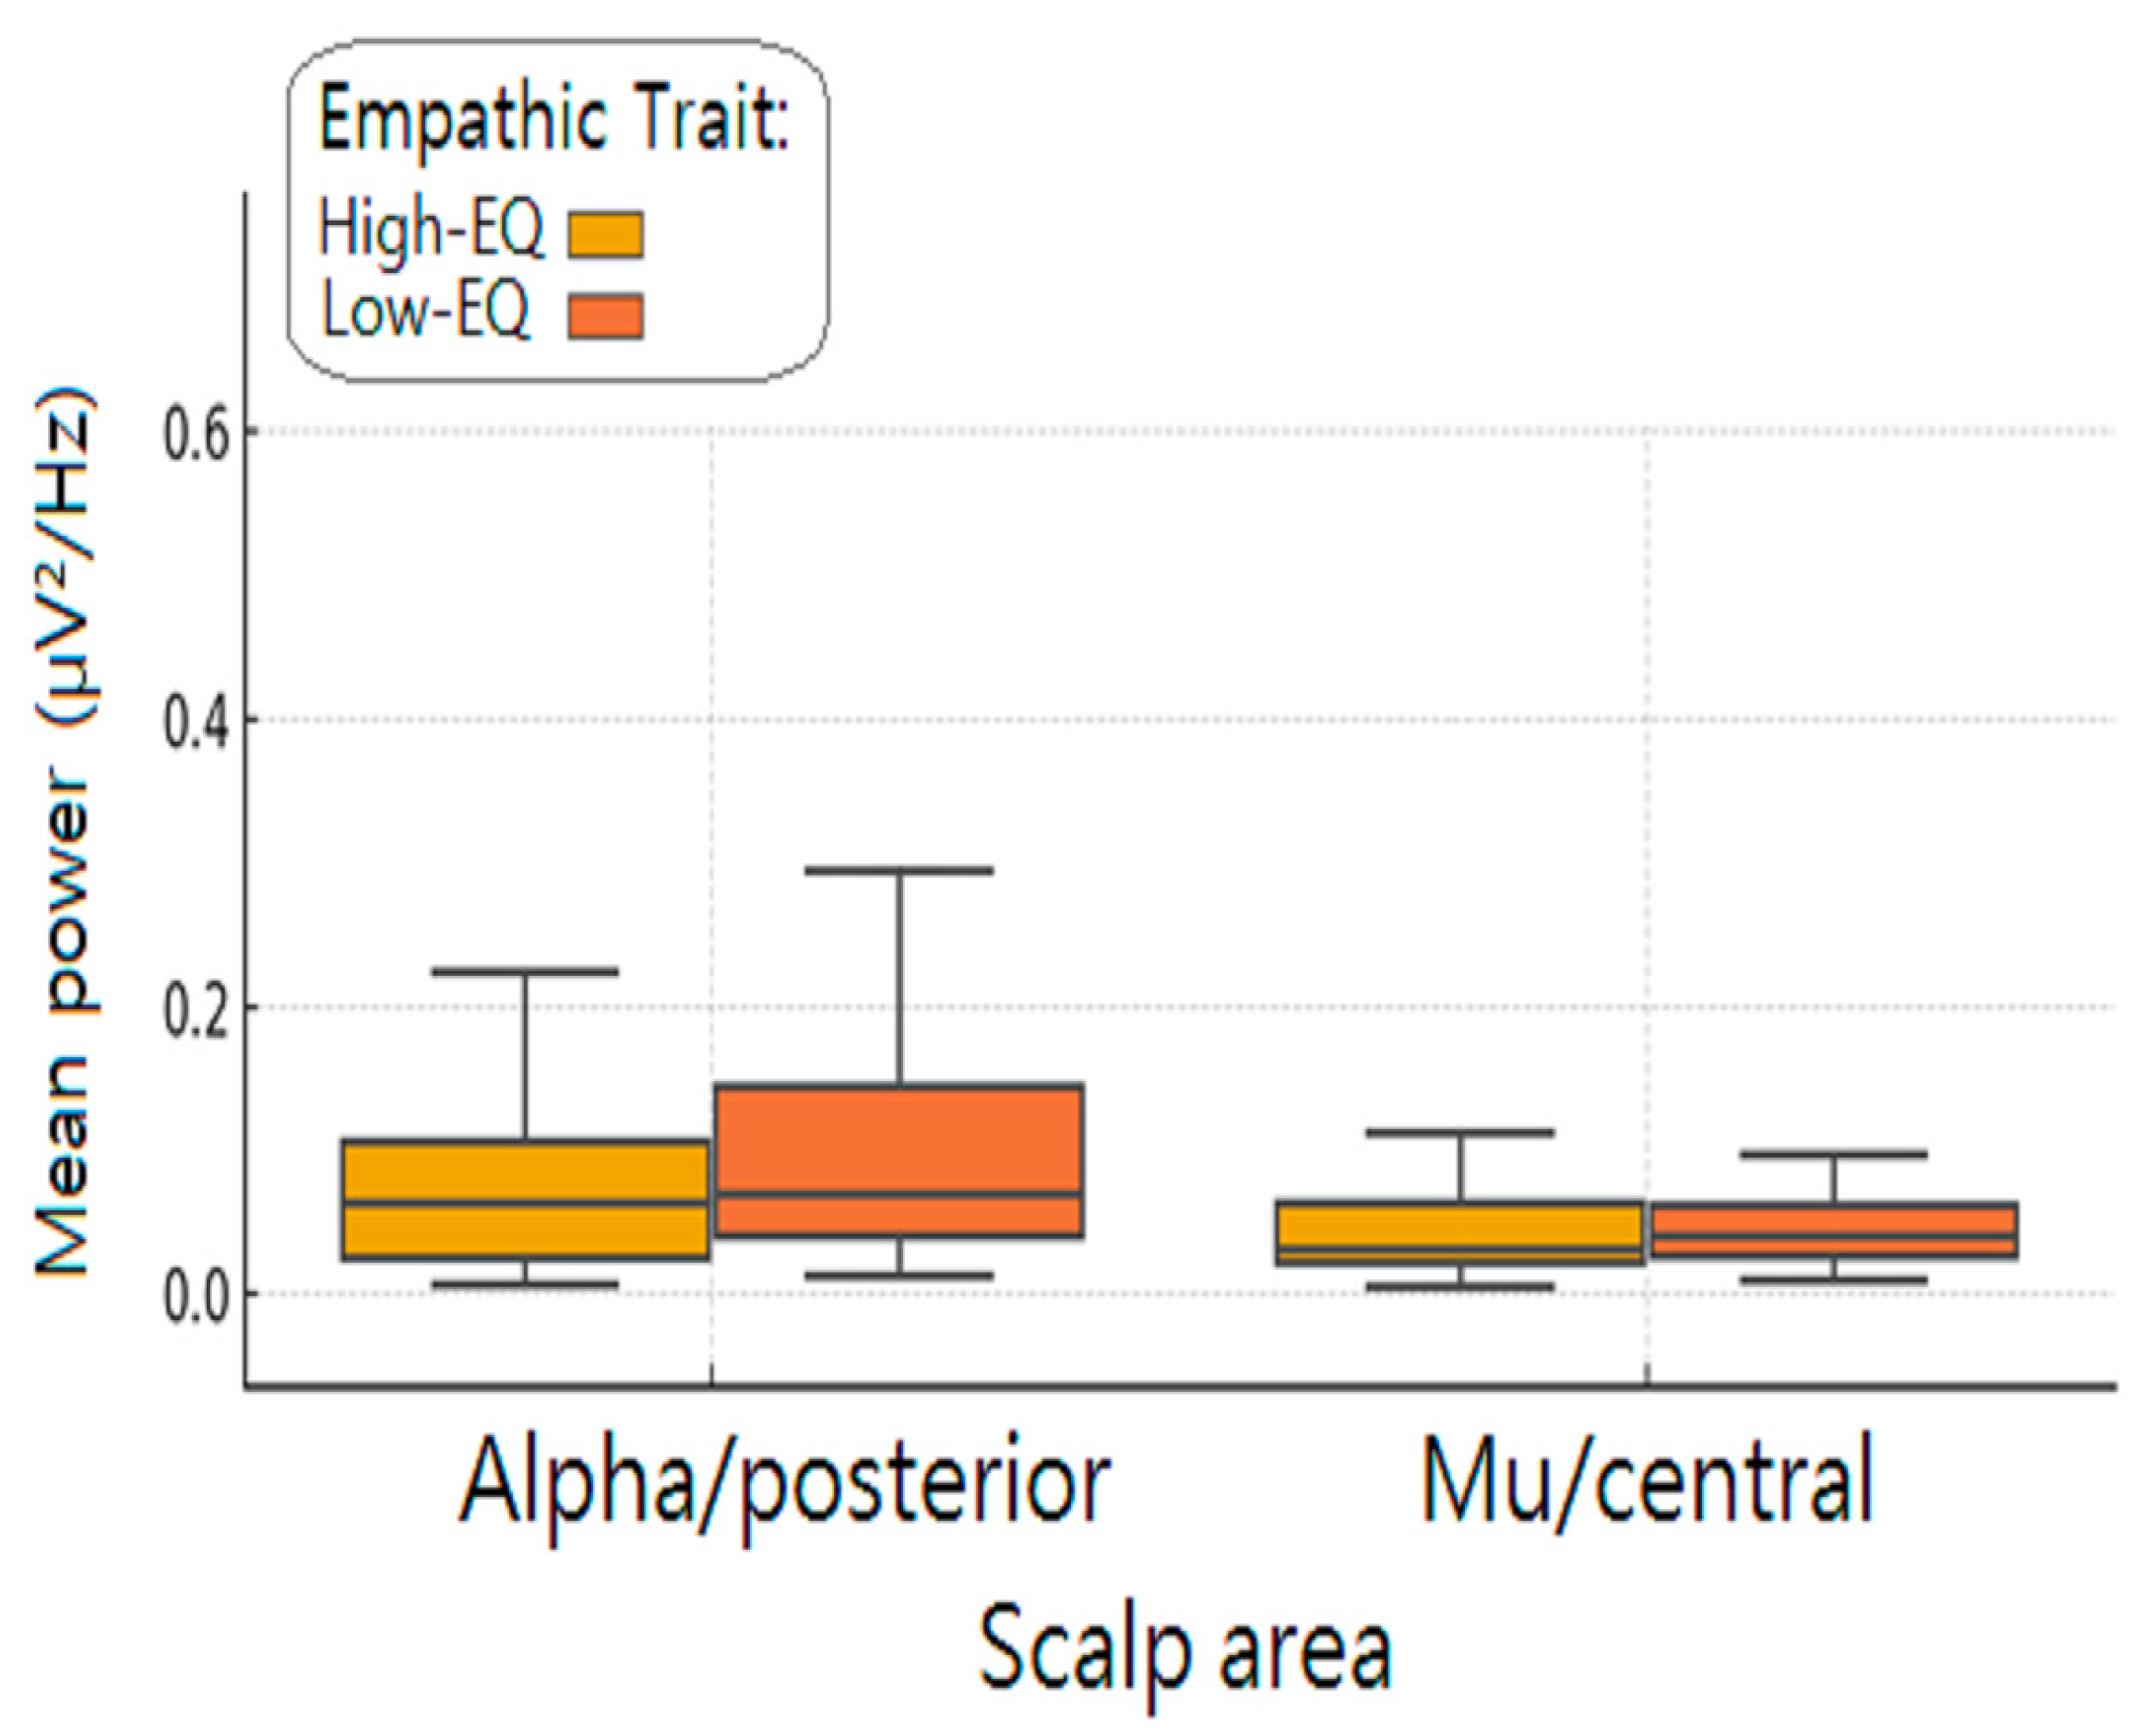
3.3. Wavelet Analysis
4. Discussion
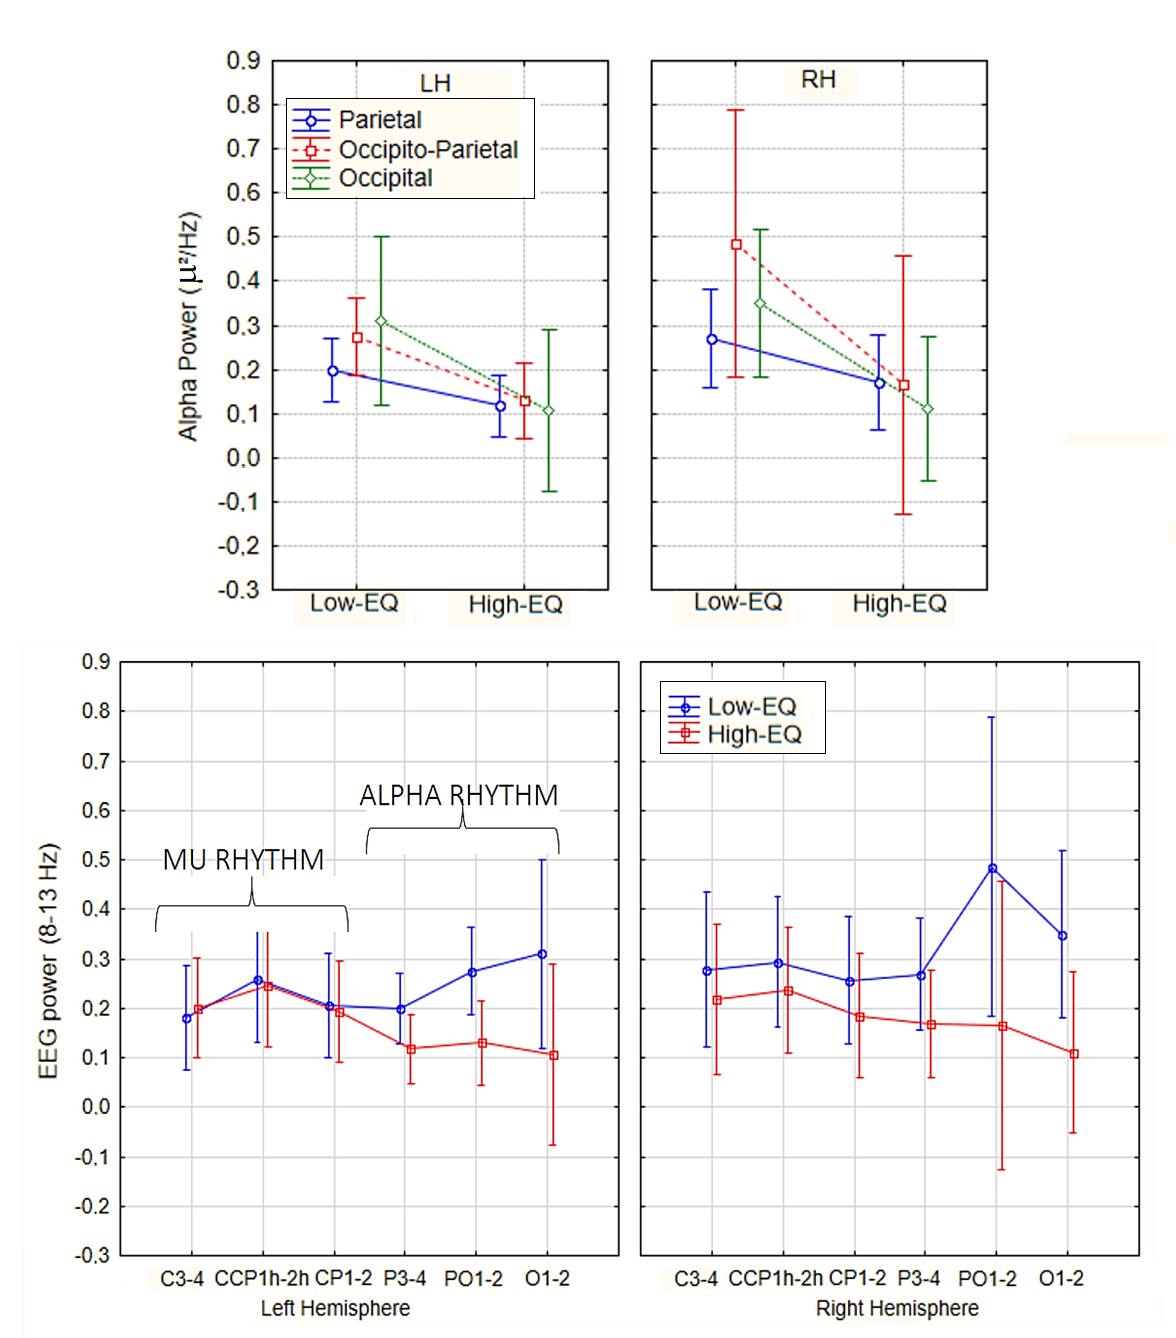
4.1. Alpha Power (Occipito-Parietal)
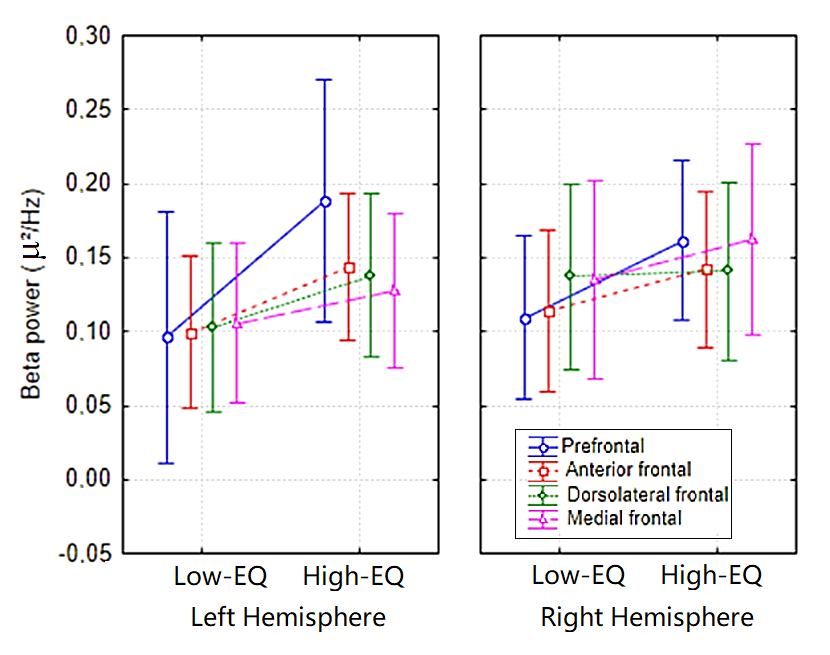
4.2. Frontal Beta Activity
4.3. Mu Suppression (or Lack Thereof)
4.4. Integration with ERP Findings and Broader Implications
5. Conclusions
6. Limitations and Future Directions
Author Contributions
Funding
Institutional Review Board Statement
Informed Consent Statement
Data Availability Statement
Acknowledgments
Conflicts of Interest
Abbreviations
| ANOVA | Analysis of Variance |
| EEG | Electroencephalogram |
| EOG | Electro-oculogram |
| ERD | Event-related desynchronization |
| ERP | Event-Related Potential |
| FFT | Fast Fourier Transform |
| High-EQ | High empathy quotient |
| Low-EQ | Low empathy quotient |
References
- Singer, T. The neuronal basis and ontogeny of empathy and mind reading: Review of literature and implications for future research. Neurosci. Biobehav. Rev. 2006, 30, 855–863. [Google Scholar] [CrossRef] [PubMed]
- Shamay-Tsoory, S.G. The neural bases for empathy. Neuroscientist 2011, 17, 18–24. [Google Scholar] [CrossRef] [PubMed]
- Zebarjadi, N.; Levy, J. Neural shifts in alpha rhythm’s dual functioning during empathy maturation. Brain Behav. 2023, 13, e3110. [Google Scholar] [CrossRef] [PubMed]
- Grove, R.; Baillie, A.; Allison, C.; Baron-Cohen, S.; Hoekstra, R.A. Empathizing, systemizing, and autistic traits: Latent structure in individuals with autism, their parents, and general population controls. J. Abnorm. Psychol. 2013, 122, 600–609. [Google Scholar] [CrossRef]
- Bellebaum, C.; Ghio, M.; Wollmer, M.; Weismüller, B.; Thoma, P. The role of trait empathy in the processing of observed actions in a false-belief task. Soc. Cogn. Affect. Neurosci. 2020, 15, 53–61. [Google Scholar] [CrossRef]
- Falcon, M.; Martikainen, S.; Wikström, V.; Makkonen, T.; Hari, R. Dispositional empathy as a driver of inter-individual neural phase synchrony. Sci. Rep. 2025, 15, 12345. [Google Scholar] [CrossRef]
- Matsuoka, T.; Shimode, T.; Ota, T.; Matsuo, K. Event-Related Alpha-Band Power Changes During Self-reflection and Working Memory Tasks in Healthy Individuals. Front. Hum. Neurosci. 2021, 14, 570279. [Google Scholar] [CrossRef]
- Rana, K.D.; Vaina, L.M. Functional roles of 10 Hz alpha-band power modulating engagement and disengagement of cortical networks in a complex visual motion task. PLoS ONE 2014, 9, e107715. [Google Scholar] [CrossRef]
- Wan, W.; Cui, X.; Gao, Z.; Gu, Z. Frontal EEG-Based Multi-Level Attention States Recognition Using Dynamical Complexity and Extreme Gradient Boosting. Front. Hum. Neurosci. 2021, 15, 673955. [Google Scholar] [CrossRef]
- Pineda, J.A. The functional significance of mu rhythms: Translating “seeing” and “hearing” into “doing”. Brain Res. Rev. 2005, 50, 57–68. [Google Scholar] [CrossRef]
- Woodruff, C.C.; Martin, T.; Bilyk, N. Differences in self- and other-induced Mu suppression are correlated with empathic abilities. Brain Res. 2011, 1405, 69–76. [Google Scholar] [CrossRef] [PubMed]
- Hoenen, M.; Schain, C.; Pause, B.M. Down-modulation of mu-activity through empathic top-down processes. Soc. Neurosci. 2013, 8, 515–524. [Google Scholar] [CrossRef] [PubMed]
- Peled-Avron, L.; Levy-Gigi, E.; Richter-Levin, G.; Korem, N.; Shamay-Tsoory, S.G. The role of empathy in the neural responses to observed human social touch. Cogn. Affect. Behav. Neurosci. 2016, 16, 802–813. [Google Scholar] [CrossRef]
- DiGirolamo, M.A.; Simon, J.C.; Hubley, K.M.; Kopulsky, A.; Gutsell, J.N. Clarifying the relationship between trait empathy and action-based resonance indexed by EEG mu-rhythm suppression. Neuropsychologia 2019, 133, 107172. [Google Scholar] [CrossRef]
- Goodarzi, N.; Azma, K.; Tavakolian, E.; Peyvand, P. Association of Nurses’ Self-Reported Empathy and Mu Suppression with Patients’ Satisfaction. J. Caring Sci. 2015, 4, 197–205. [Google Scholar] [CrossRef] [PubMed]
- Hobson, H.M.; Bishop, D.V. The interpretation of mu suppression as an index of mirror neuron activity: Past, present and future. R. Soc. Open Sci. 2017, 4, 160662. [Google Scholar] [CrossRef]
- Başar, E.; Güntekin, B.; Oniz, A. Principles of oscillatory brain dynamics and a treatise of recognition of faces and facial expressions. Prog. Brain Res. 2006, 159, 43–62. [Google Scholar]
- Debnath, R.; Salo, V.C.; Buzzell, G.A.; Yoo, K.H.; Fox, N.A. Mu rhythm desynchronization is specific to action execution and observation: Evidence from time-frequency and connectivity analysis. Neuroimage 2019, 184, 496–507. [Google Scholar] [CrossRef]
- Herrmann, C.S.; Mecklinger, A.; Pfeifer, E. Gamma responses and ERPs in a visual classification task. Clin. Neurophysiol. 1999, 110, 636–642. [Google Scholar] [CrossRef]
- Güntekin, B.; Başar, E. A review of brain oscillations in perception of faces and emotional pictures. Neuropsychologia 2014, 58, 33–51. [Google Scholar] [CrossRef]
- Proverbio, A.M.; Baraldi, B. Empathy boosts the comprehension of nonverbal behavior. Soc. Neurosci. 2025. in revision. [Google Scholar]
- Senese, V.P.; De Nicola, A.; Passaro, A.; Ruggiero, G. The factorial structure of a 15-item version of the Italian Empathy Quotient Scale. Eur. J. Psychol. Assess. 2016, 34, 344–351. [Google Scholar] [CrossRef]
- Baron-Cohen, S.; Wheelwright, S. The empathy quotient: An investigation of adults with Asperger syndrome or high functioning autism, and normal sex differences. J. Autism Dev. Disord. 2004, 34, 163–175. [Google Scholar] [CrossRef]
- Proverbio, A.M.; Gabaro, V.; Orlandi, A.; Zani, A. Semantic brain areas are involved in gesture comprehension: An electrical neuroimaging study. Brain Lang. 2015, 147, 30–40. [Google Scholar] [CrossRef]
- Samar, V.J.; Swartz, K.P.; Raghuveer, M.R. Multiresolution analysis of event-related potentials by wavelet decomposition. Brain Cogn. 1995, 27, 398–438. [Google Scholar] [CrossRef] [PubMed]
- Herrmann, C.S.; Demiralp, T. Human EEG gamma oscillations in neuropsychiatric disorders. Clin. Neurophysiol. 2005, 116, 2719–2733. [Google Scholar] [CrossRef] [PubMed]
- Herrmann, C.S.; Rach, S.; Vosskuhl, J.; Strüber, D. Time-frequency analysis of event-related potentials: A brief tutorial. Brain Topogr. 2014, 27, 438–450. [Google Scholar] [CrossRef]
- Romei, V.; Rihs, T.; Brodbeck, V.; Thut, G. Resting electroencephalogram alpha-power over posterior sites indexes baseline visual cortex excitability. NeuroReport 2008, 19, 203–208. [Google Scholar] [CrossRef]
- Gibbings, A.; Ray, L.B.; Berberian, N.; Nguyen, T.; Shahidi Zandi, A.; Owen, A.M.; Comeau, F.J.E.; Fogel, S.M. EEG and behavioural correlates of mild sleep deprivation and vigilance. Clin. Neurophysiol. 2021, 132, 45–55. [Google Scholar] [CrossRef]
- Pershin, I.; Candrian, G.; Münger, M.; Baschera, G.M.; Rostami, M.; Eich, D.; Müller, A. Vigilance described by the time-on-task effect in EEG activity during a cued Go/NoGo task. Int. J. Psychophysiol. 2023, 183, 92–102. [Google Scholar] [CrossRef]
- Benedek, M.; Schickel, R.J.; Jauk, E.; Fink, A.; Neubauer, A.C. Alpha power increases in right parietal cortex reflects focused internal attention. Neuropsychologia 2014, 56, 393–400. [Google Scholar] [CrossRef]
- Zani, A.; Tumminelli, C.; Proverbio, A.M. Electroencephalogram (EEG) Alpha Power as a Marker of Visuospatial Attention Orienting and Suppression in Normoxia and Hypoxia. An Exploratory Study. Brain Sci. 2020, 10, 140. [Google Scholar] [CrossRef]
- Kornrumpf, B.; Dimigen, O.; Sommer, W. Lateralization of posterior alpha EEG reflects the distribution of spatial attention during saccadic reading. Psychophysiology 2017, 54, 809–823. [Google Scholar] [CrossRef] [PubMed]
- Maffei, A.; Coccaro, A.; Jaspers-Fayer, F.; Goertzen, J.; Sessa, P.; Liotti, M. EEG alpha band functional connectivity reveals distinct cortical dynamics for overt and covert emotional face processing. Sci. Rep. 2023, 13, 9951. [Google Scholar] [CrossRef] [PubMed]
- Basharpoor, S.; Heidari, F.; Molavi, P. EEG coherence in theta, alpha, and beta bands in frontal regions and executive functions. Appl. Neuropsychol. Adult. 2021, 28, 310–317. [Google Scholar] [CrossRef] [PubMed]
- Angelidis, A.; van der Does, W.; Schakel, L.; Putman, P. Frontal EEG theta/beta ratio as an electrophysiological marker for attentional control and its test-retest reliability. Biol. Psychol. 2016, 121 Pt A, 49–52. [Google Scholar] [CrossRef]
- Palacios-García, I.; Silva, J.; Villena-González, M.; Campos-Arteaga, G.; Artigas-Vergara, C.; Luarte, N.; Rodríguez, E.; Bosman, C.A. Increase in Beta Power Reflects Attentional Top-Down Modulation After Psychosocial Stress Induction. Front. Hum. Neurosci. 2021, 15, 630813. [Google Scholar] [CrossRef]
- Fernández-Abascal, E.G.; Martín-Díaz, M.D. Relations Between Dimensions of Emotional Intelligence, Specific Aspects of Empathy, and Non-verbal Sensitivity. Front. Psychol. 2019, 10, 1066. [Google Scholar] [CrossRef]
- Cabrera, M.E.; Novak, K.; Foti, D.; Voyles, R.; Wachs, J.P. Electrophysiological indicators of gesture perception. Exp. Brain Res. 2020, 238, 537–550. [Google Scholar] [CrossRef]
- Hervault, M.; Zanone, P.G.; Buisson, J.C.; Huys, R. Cortical sensorimotor activity in the execution and suppression of discrete and rhythmic movements. Sci. Rep. 2021, 11, 22364. [Google Scholar] [CrossRef]
- Neuper, C.; Wörtz, M.; Pfurtscheller, G. ERD/ERS patterns reflecting sensorimotor activation and deactivation. Prog. Brain Res. 2006, 159, 211–222. [Google Scholar] [CrossRef] [PubMed]
- Nyström, P.; Ljunghammar, T.; Rosander, K.; von Hofsten, C. Using mu rhythm desynchronization to measure mirror neuron activity in infants. Dev. Sci. 2011, 14, 327–335. [Google Scholar] [CrossRef] [PubMed]
- Choi, D.; Nishimura, T.; Motoi, M.; Egashira, Y.; Matsumoto, R.; Watanuki, S. Effect of empathy trait on attention to various facial expressions: Evidence from N170 and late positive potential (LPP). J. Physiol. Anthropol. 2014, 33, 18. [Google Scholar] [CrossRef] [PubMed]
- Balconi, M.; Canavesio, Y. Is empathy necessary to comprehend the emotional faces? The empathic effect on attentional mechanisms (eye movements), cortical correlates (N200 event-related potentials) and facial behaviour (electromyography) in face processing. Cogn. Emot. 2016, 30, 210–224. [Google Scholar] [CrossRef]
- Proverbio, A.M.; Gabaro, V. A Nonverbal Signs Dataset for the Italian Population. In Bicocca Open Archive Research Data; V1; University of Milano-Bicocca: Milan, Italy, 2025. [Google Scholar]

| Groups | Norm. Score | N° SS | MIN | MAX | SD | Mean Score |
|---|---|---|---|---|---|---|
| Low-ES | 0.51 | 14 | 0.27 | 0.60 | 0.091 | 15.28 |
| High-ES | 0.73 | 15 | 0.63 | 0.90 | 0103 | 21.9 |
Disclaimer/Publisher’s Note: The statements, opinions and data contained in all publications are solely those of the individual author(s) and contributor(s) and not of MDPI and/or the editor(s). MDPI and/or the editor(s) disclaim responsibility for any injury to people or property resulting from any ideas, methods, instructions or products referred to in the content. |
© 2025 by the authors. Licensee MDPI, Basel, Switzerland. This article is an open access article distributed under the terms and conditions of the Creative Commons Attribution (CC BY) license (https://creativecommons.org/licenses/by/4.0/).
Share and Cite
Proverbio, A.M.; Scognamiglio, P. Empathic Traits Modulate Oscillatory Dynamics Revealed by Time–Frequency Analysis During Body Language Reading. Brain Sci. 2025, 15, 673. https://doi.org/10.3390/brainsci15070673
Proverbio AM, Scognamiglio P. Empathic Traits Modulate Oscillatory Dynamics Revealed by Time–Frequency Analysis During Body Language Reading. Brain Sciences. 2025; 15(7):673. https://doi.org/10.3390/brainsci15070673
Chicago/Turabian StyleProverbio, Alice Mado, and Pasquale Scognamiglio. 2025. "Empathic Traits Modulate Oscillatory Dynamics Revealed by Time–Frequency Analysis During Body Language Reading" Brain Sciences 15, no. 7: 673. https://doi.org/10.3390/brainsci15070673
APA StyleProverbio, A. M., & Scognamiglio, P. (2025). Empathic Traits Modulate Oscillatory Dynamics Revealed by Time–Frequency Analysis During Body Language Reading. Brain Sciences, 15(7), 673. https://doi.org/10.3390/brainsci15070673