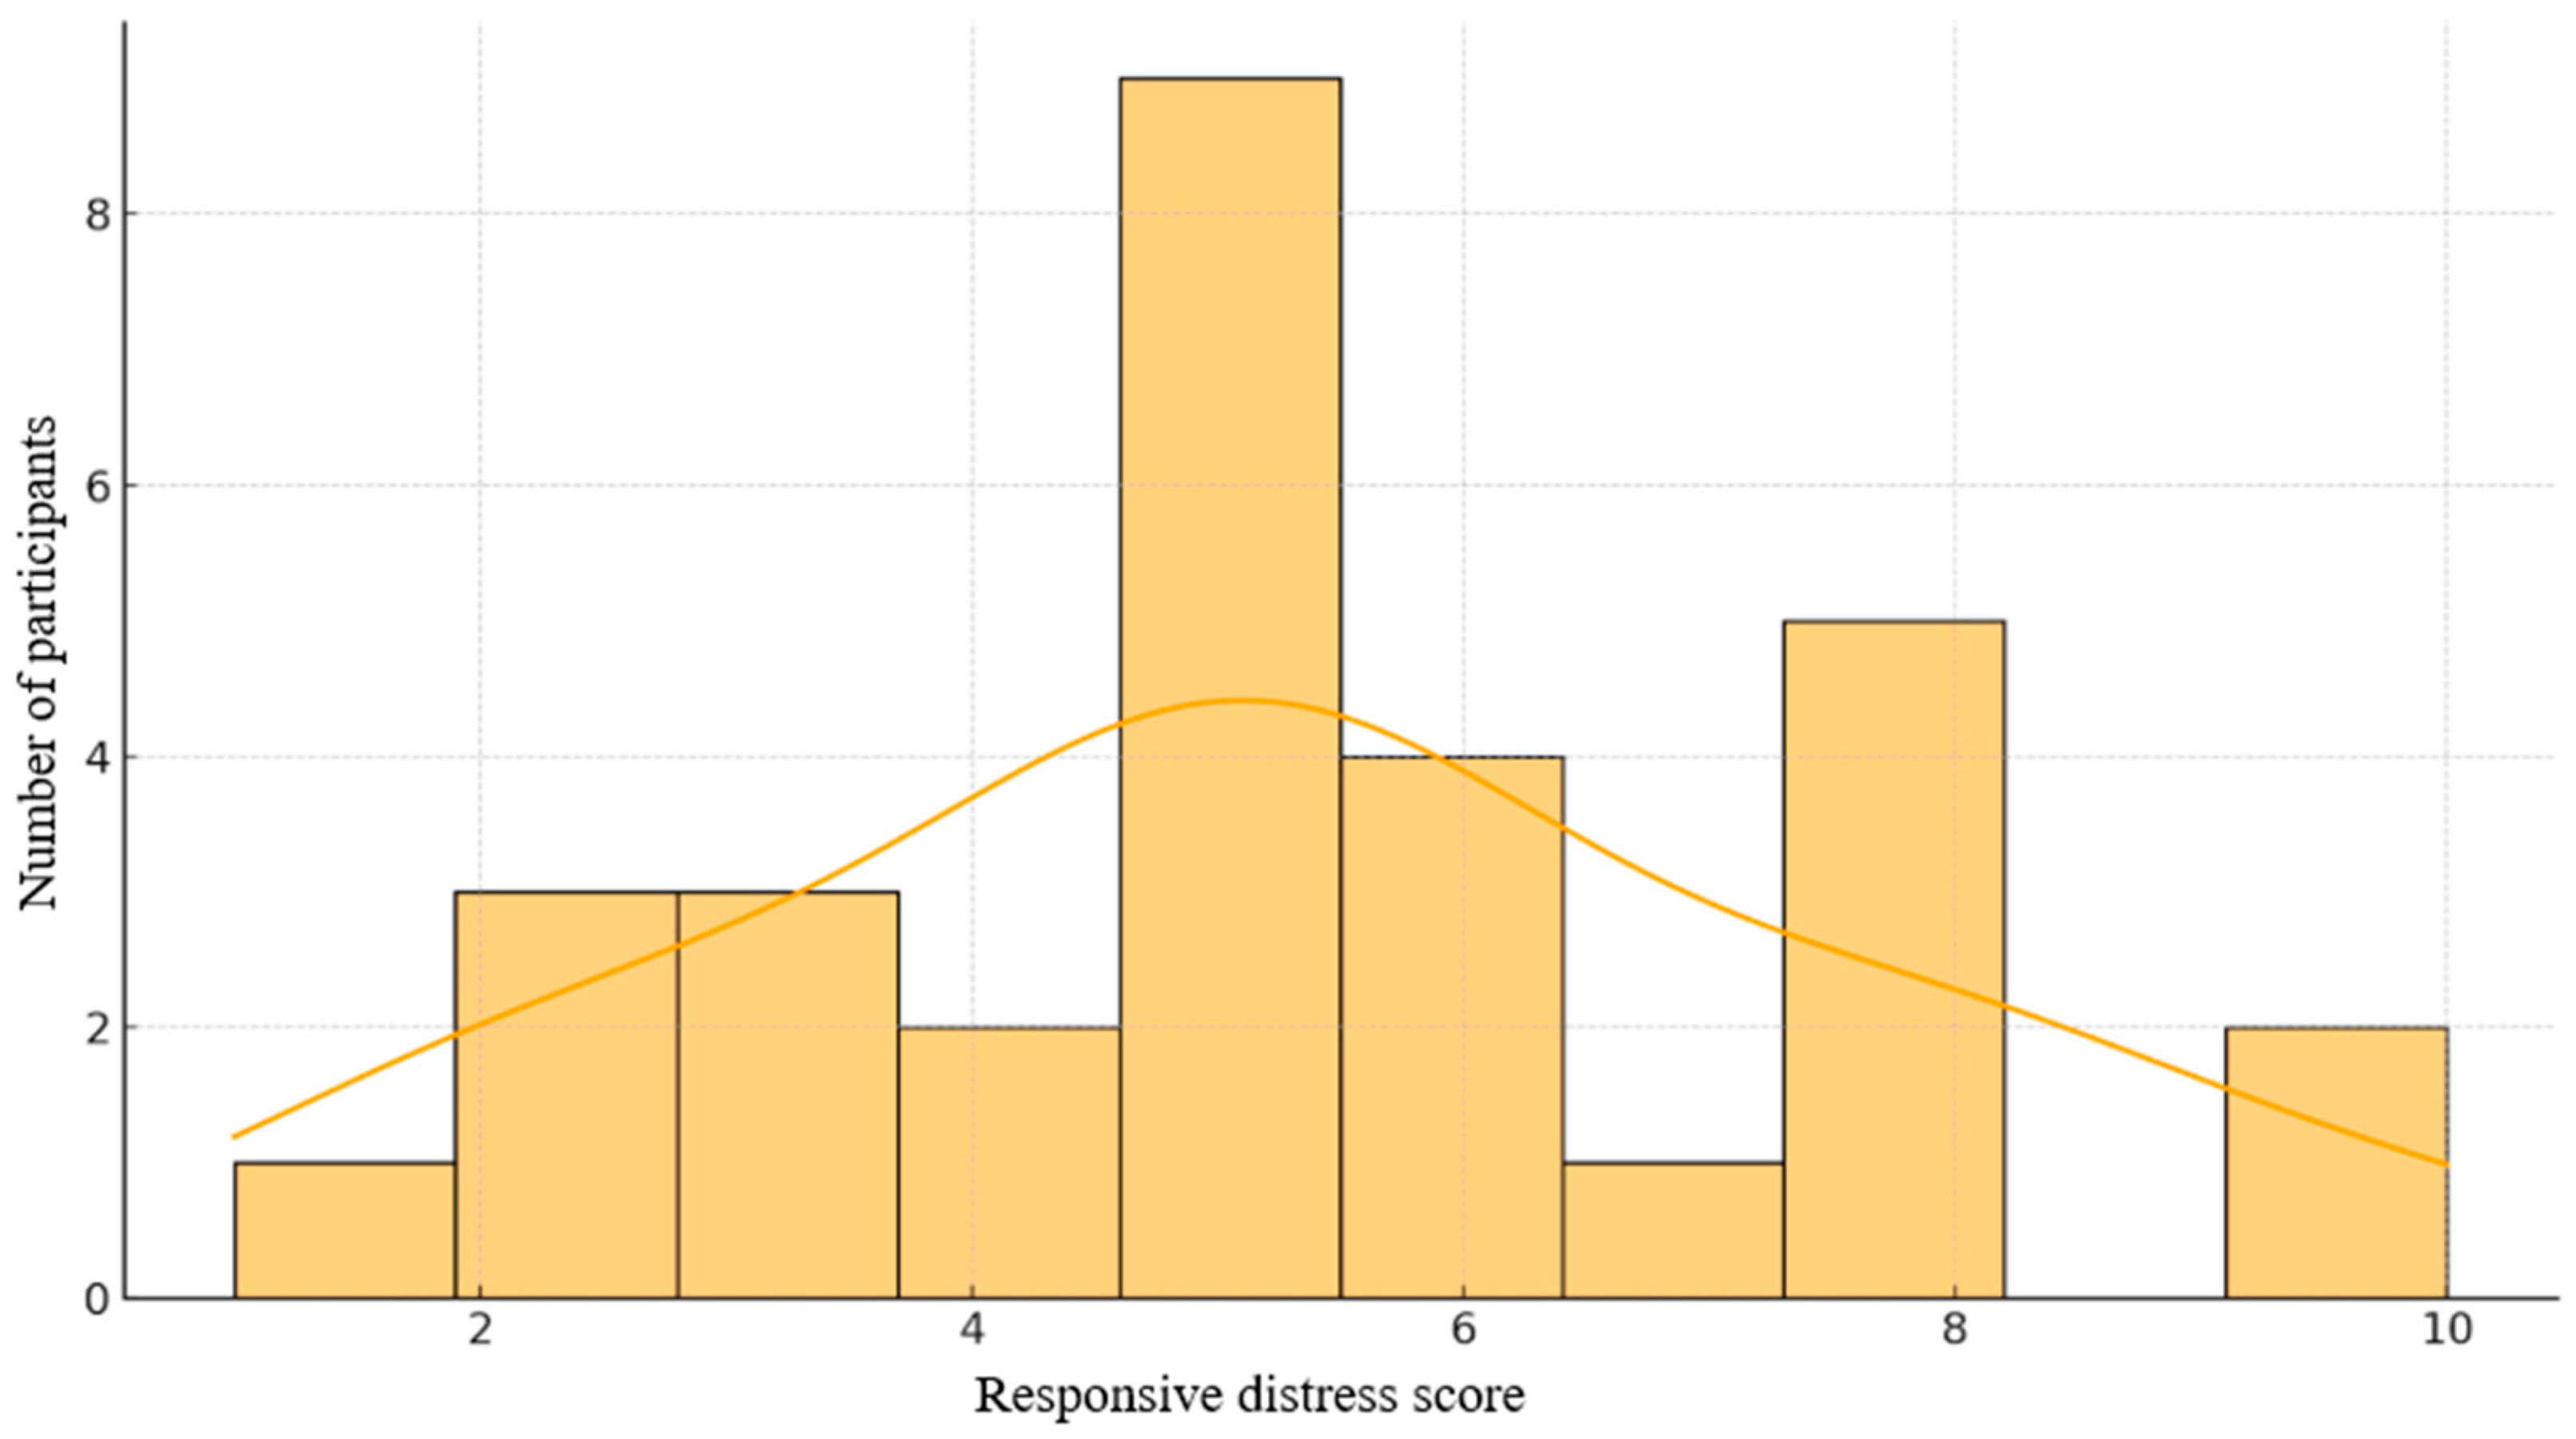
Figure 1.
Distribution of scores on the Responsive Distress Scale.
Figure 1.
Distribution of scores on the Responsive Distress Scale.
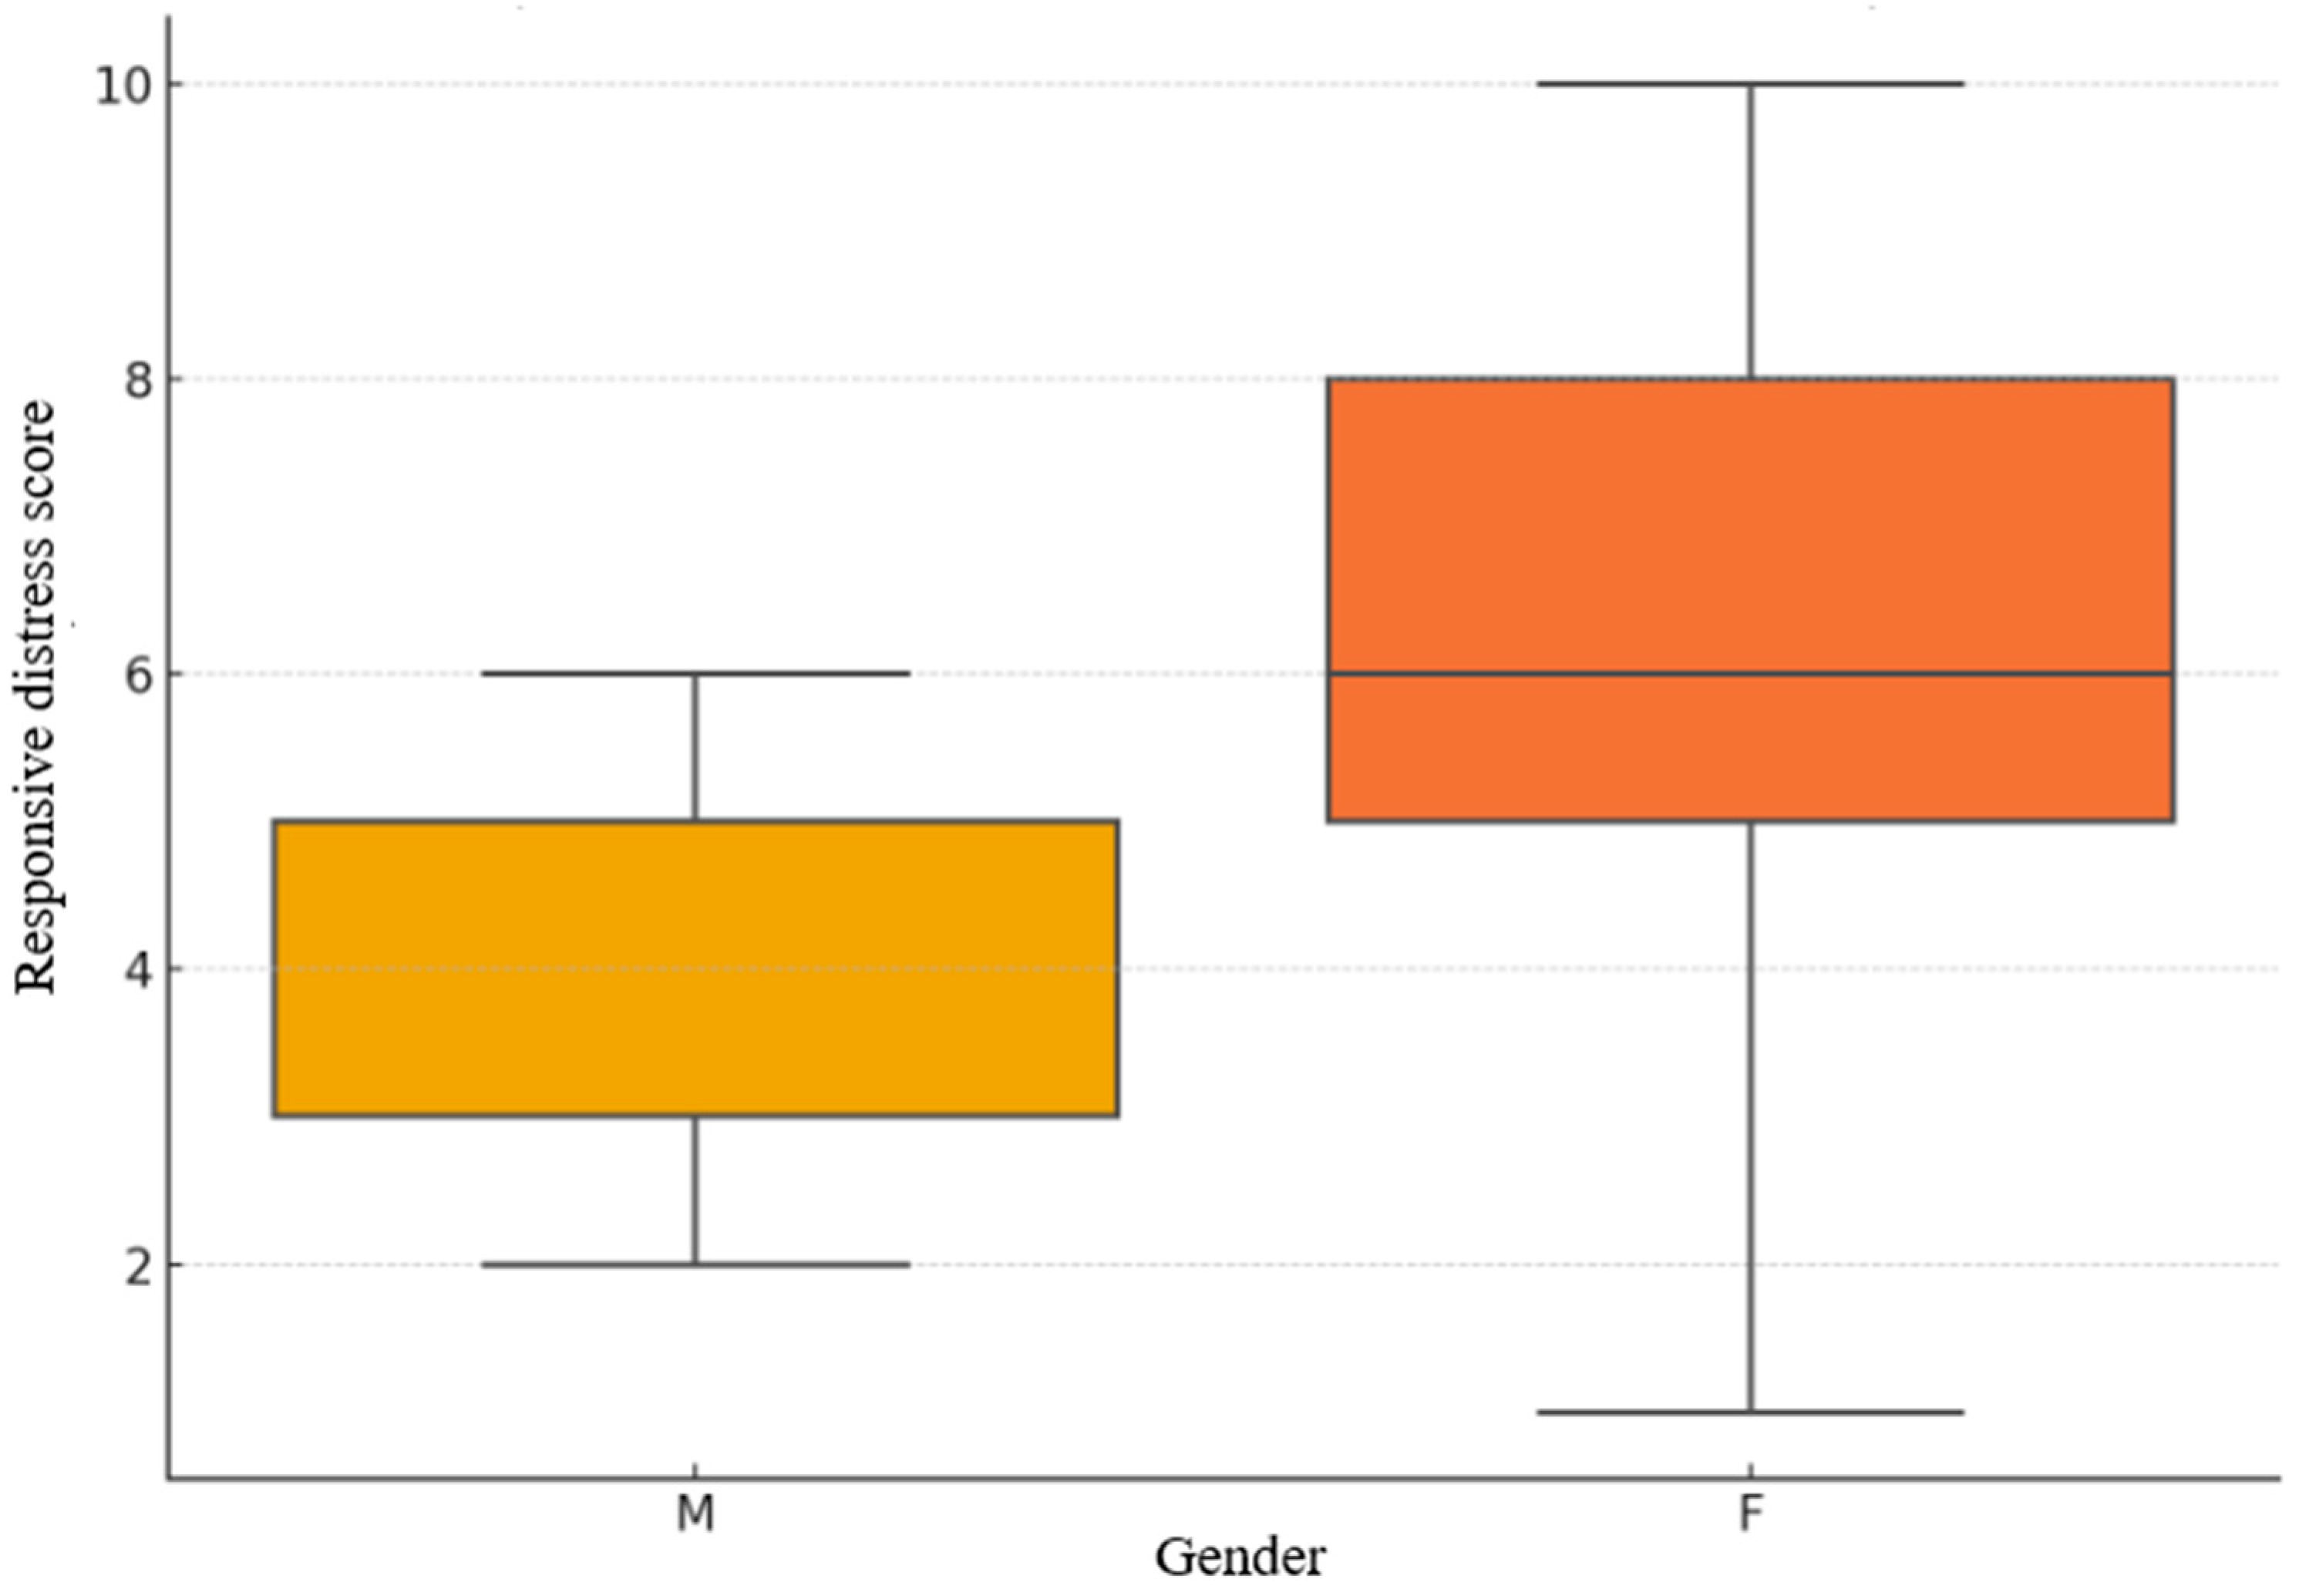
Figure 2.
Gender-based distribution of Responsive Distress scores.
Figure 2.
Gender-based distribution of Responsive Distress scores.
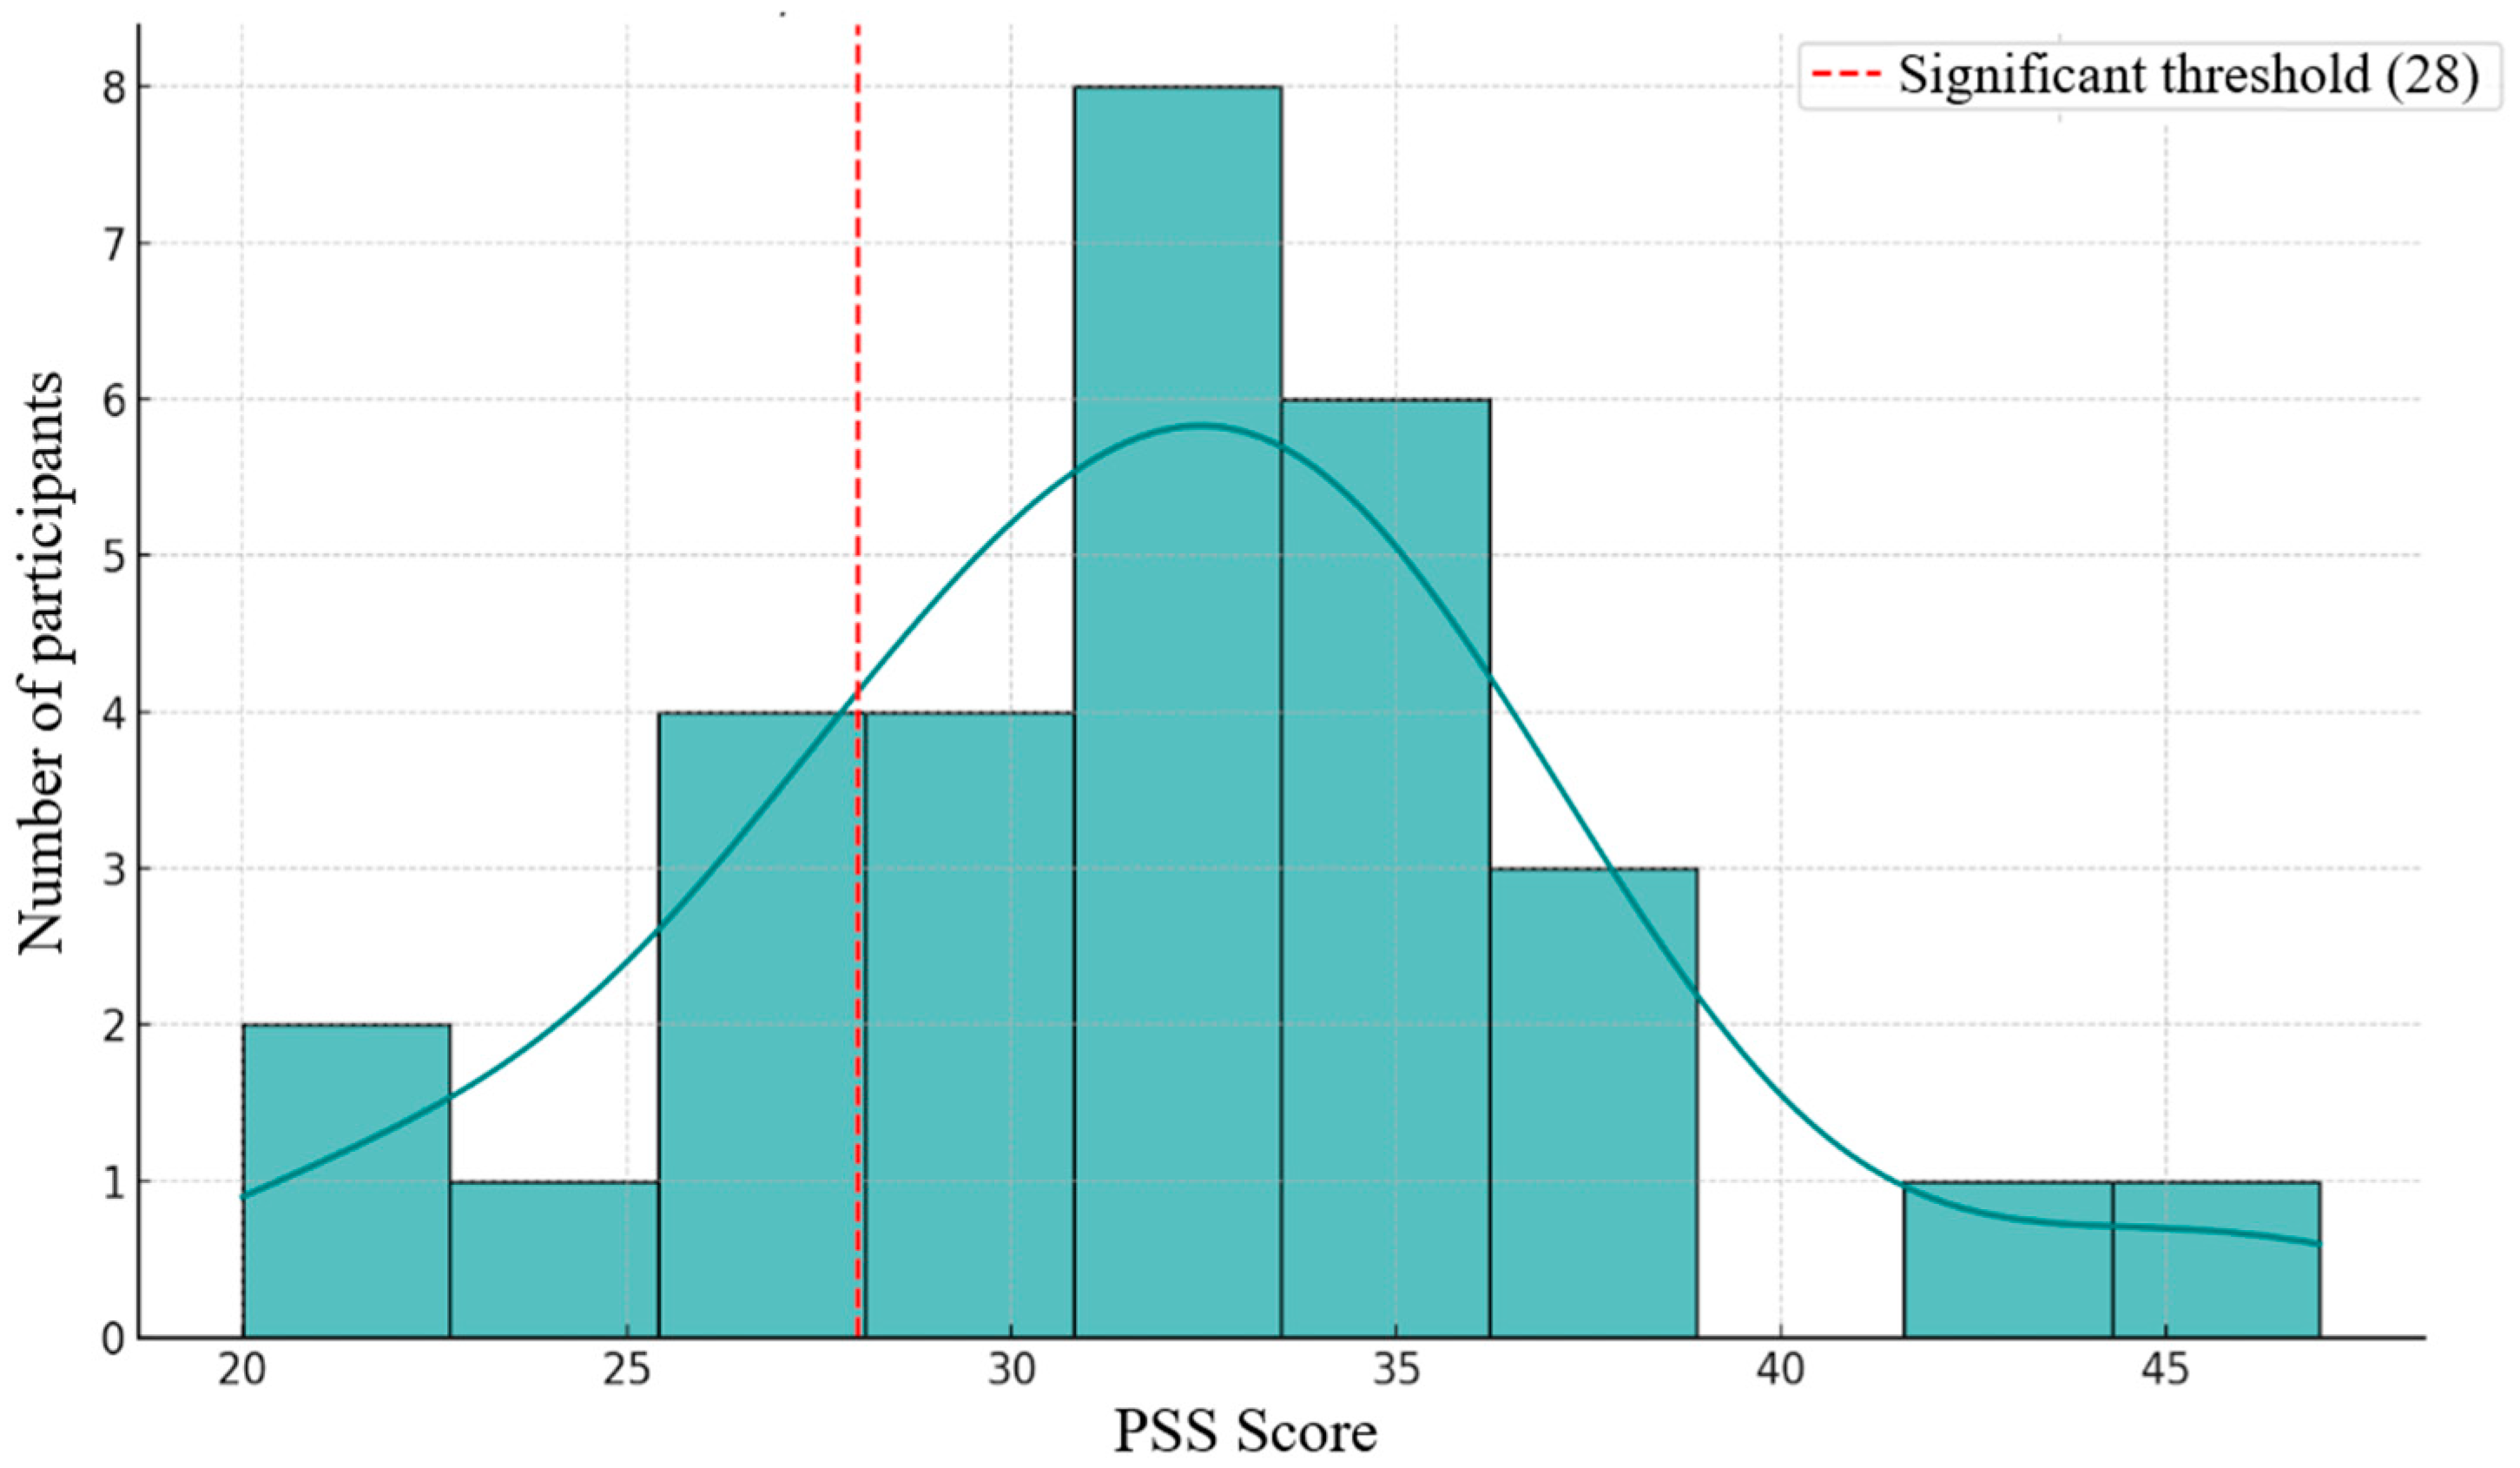
Figure 3.
Distribution of scores on the Perceived Stress Scale (PSS).
Figure 3.
Distribution of scores on the Perceived Stress Scale (PSS).
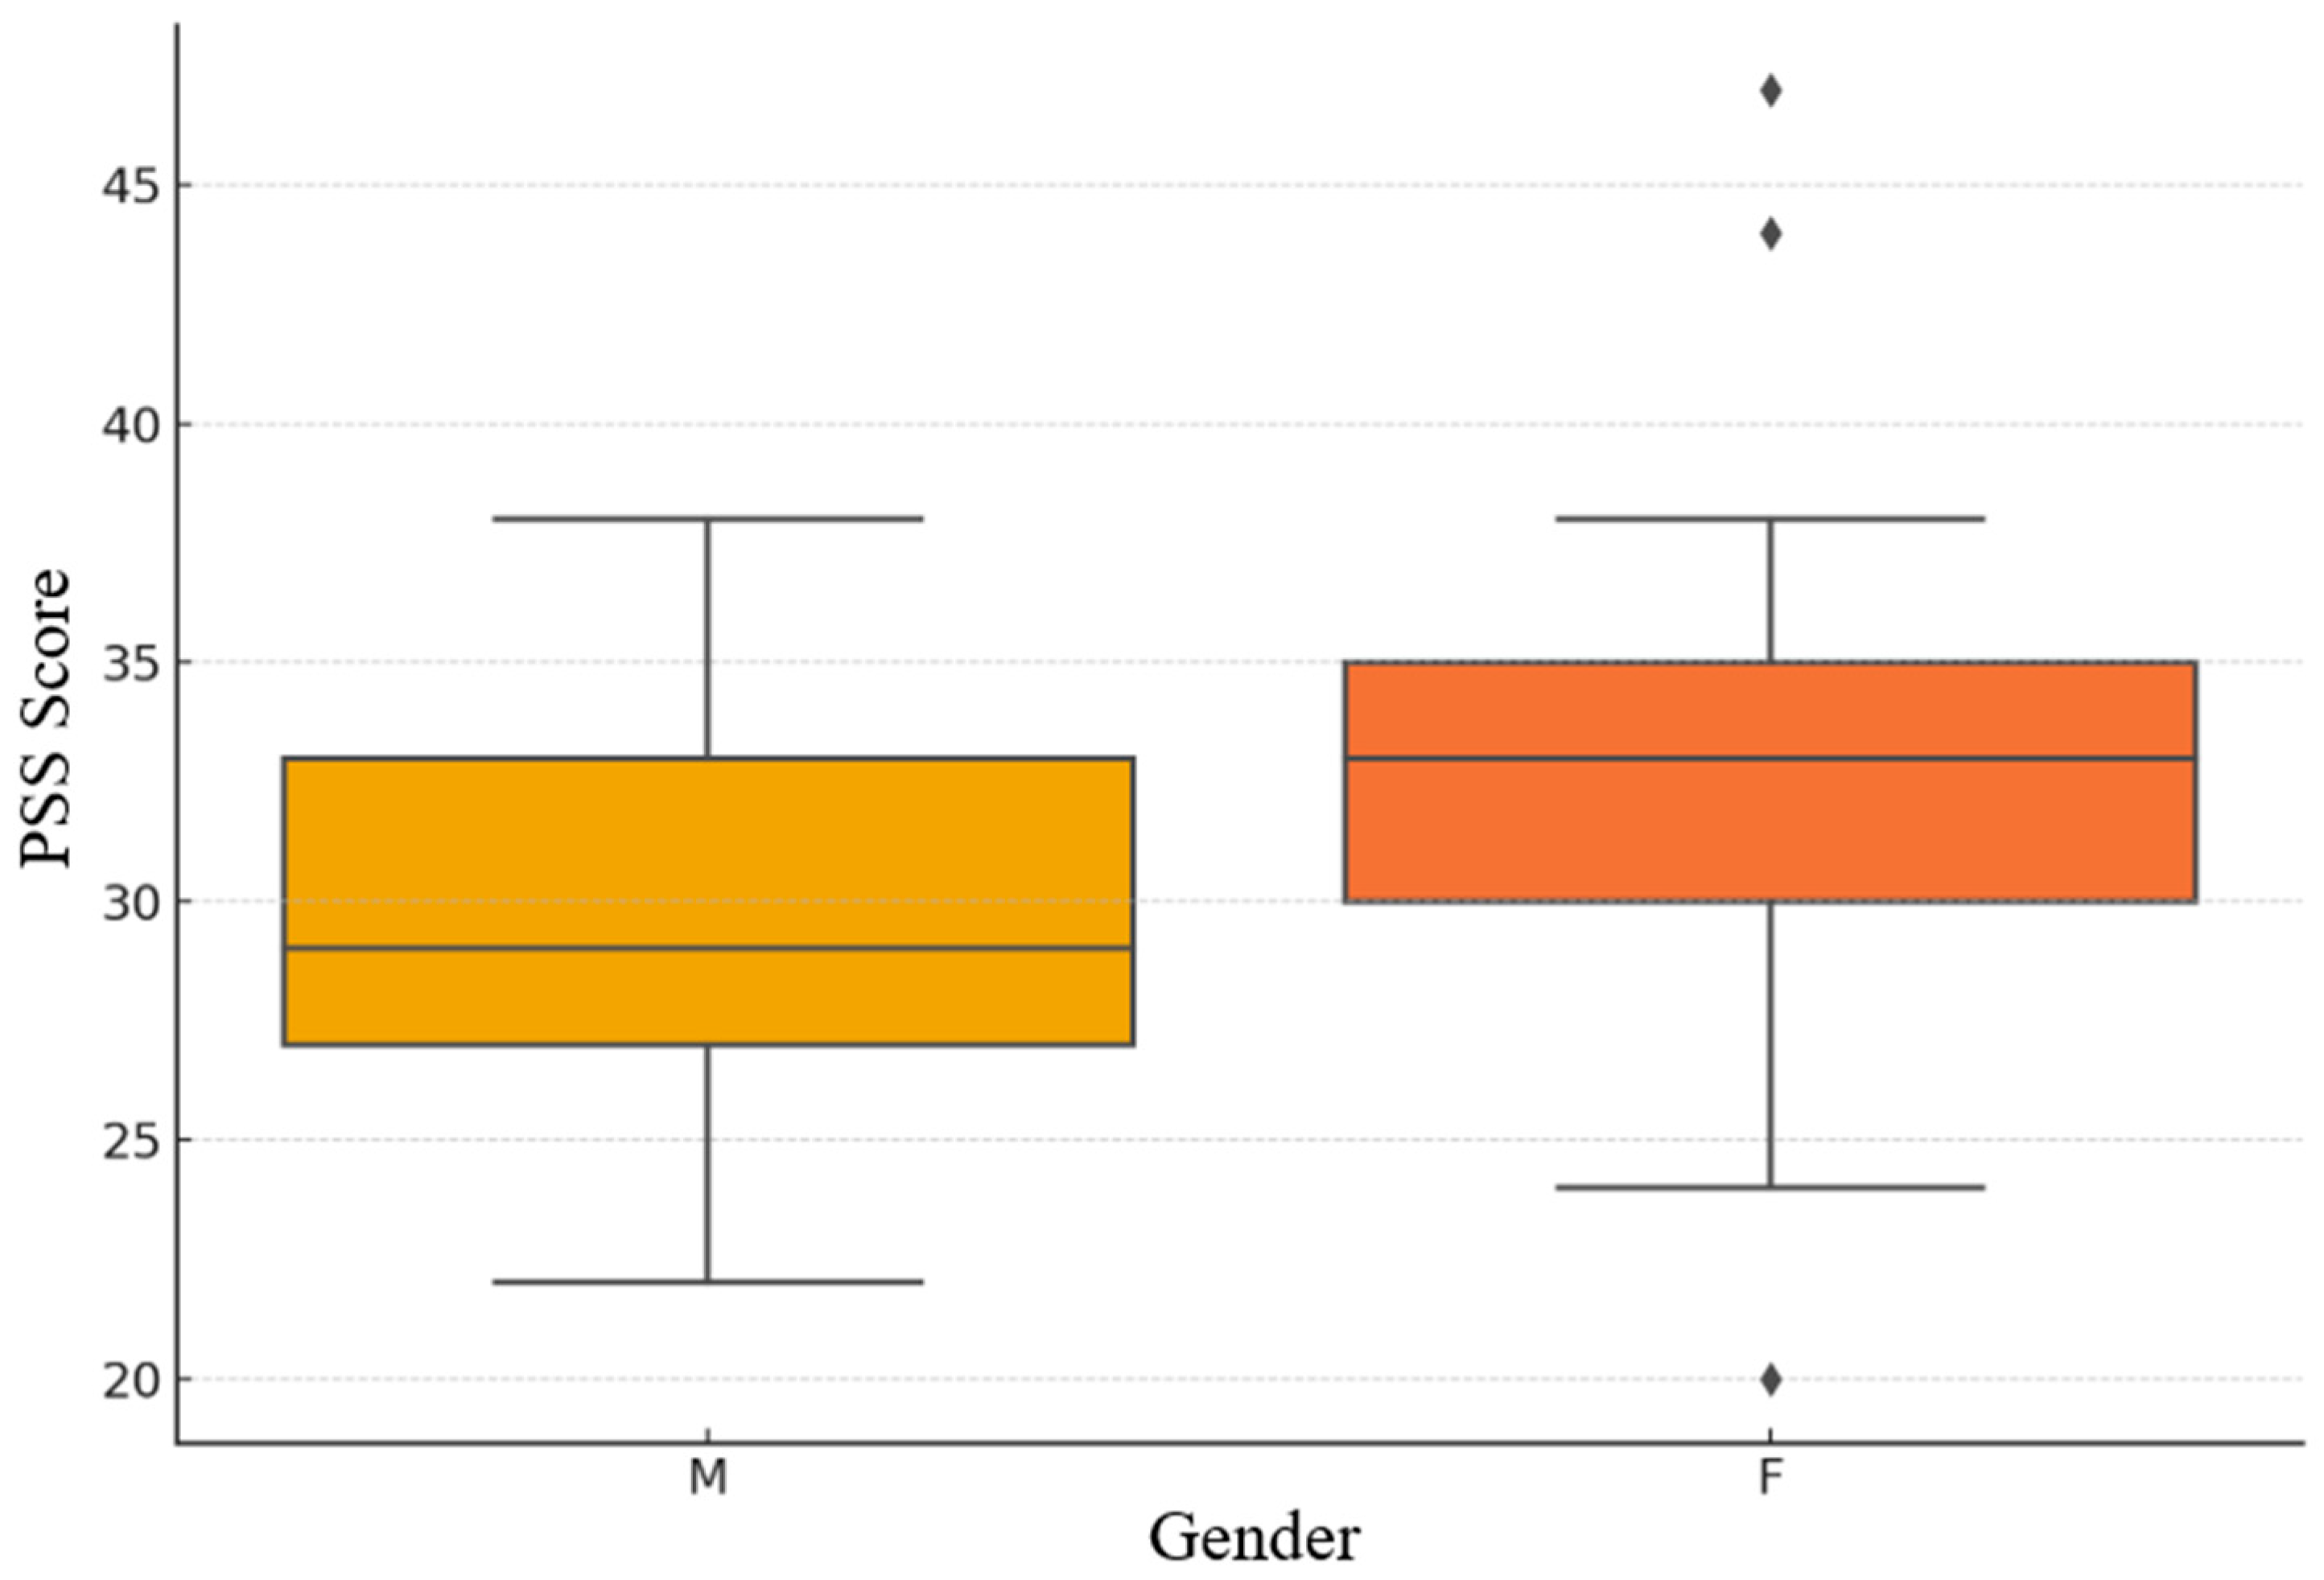
Figure 4.
Gender-based distribution of PSS scores.
Figure 4.
Gender-based distribution of PSS scores.
Figure 5.
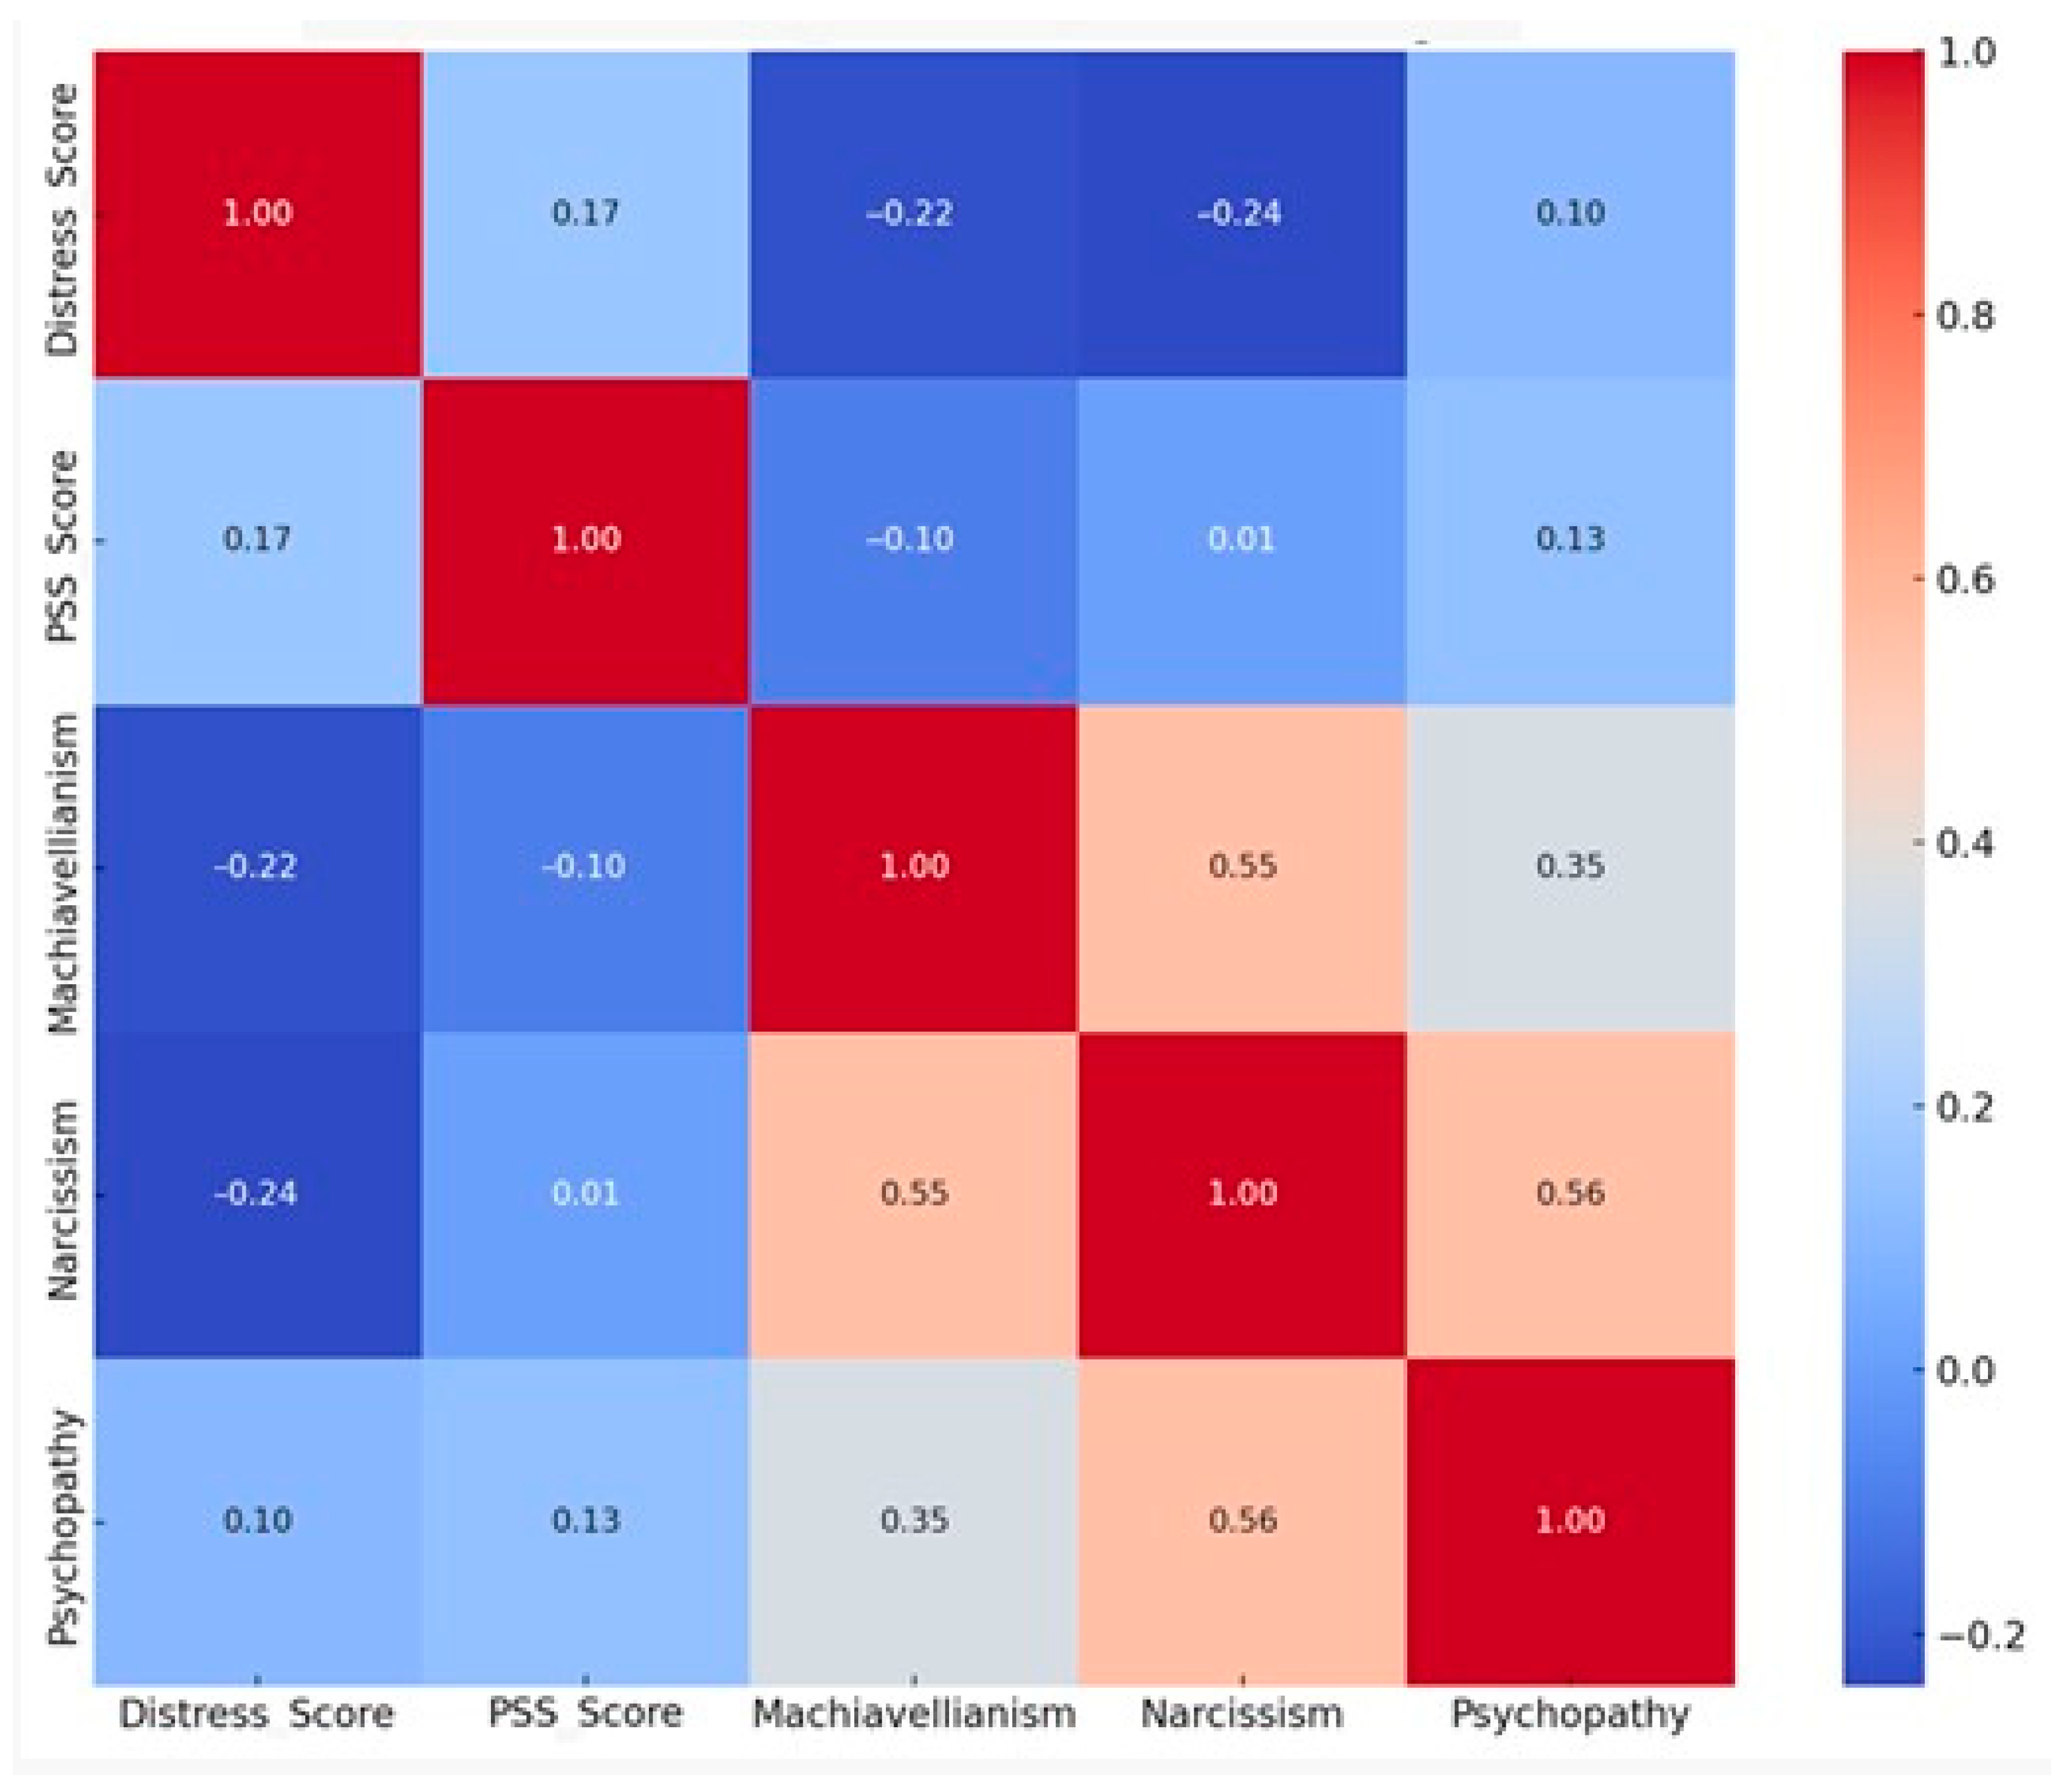
Correlation matrix among psychological scores.
Figure 5.
Correlation matrix among psychological scores.
Figure 6.
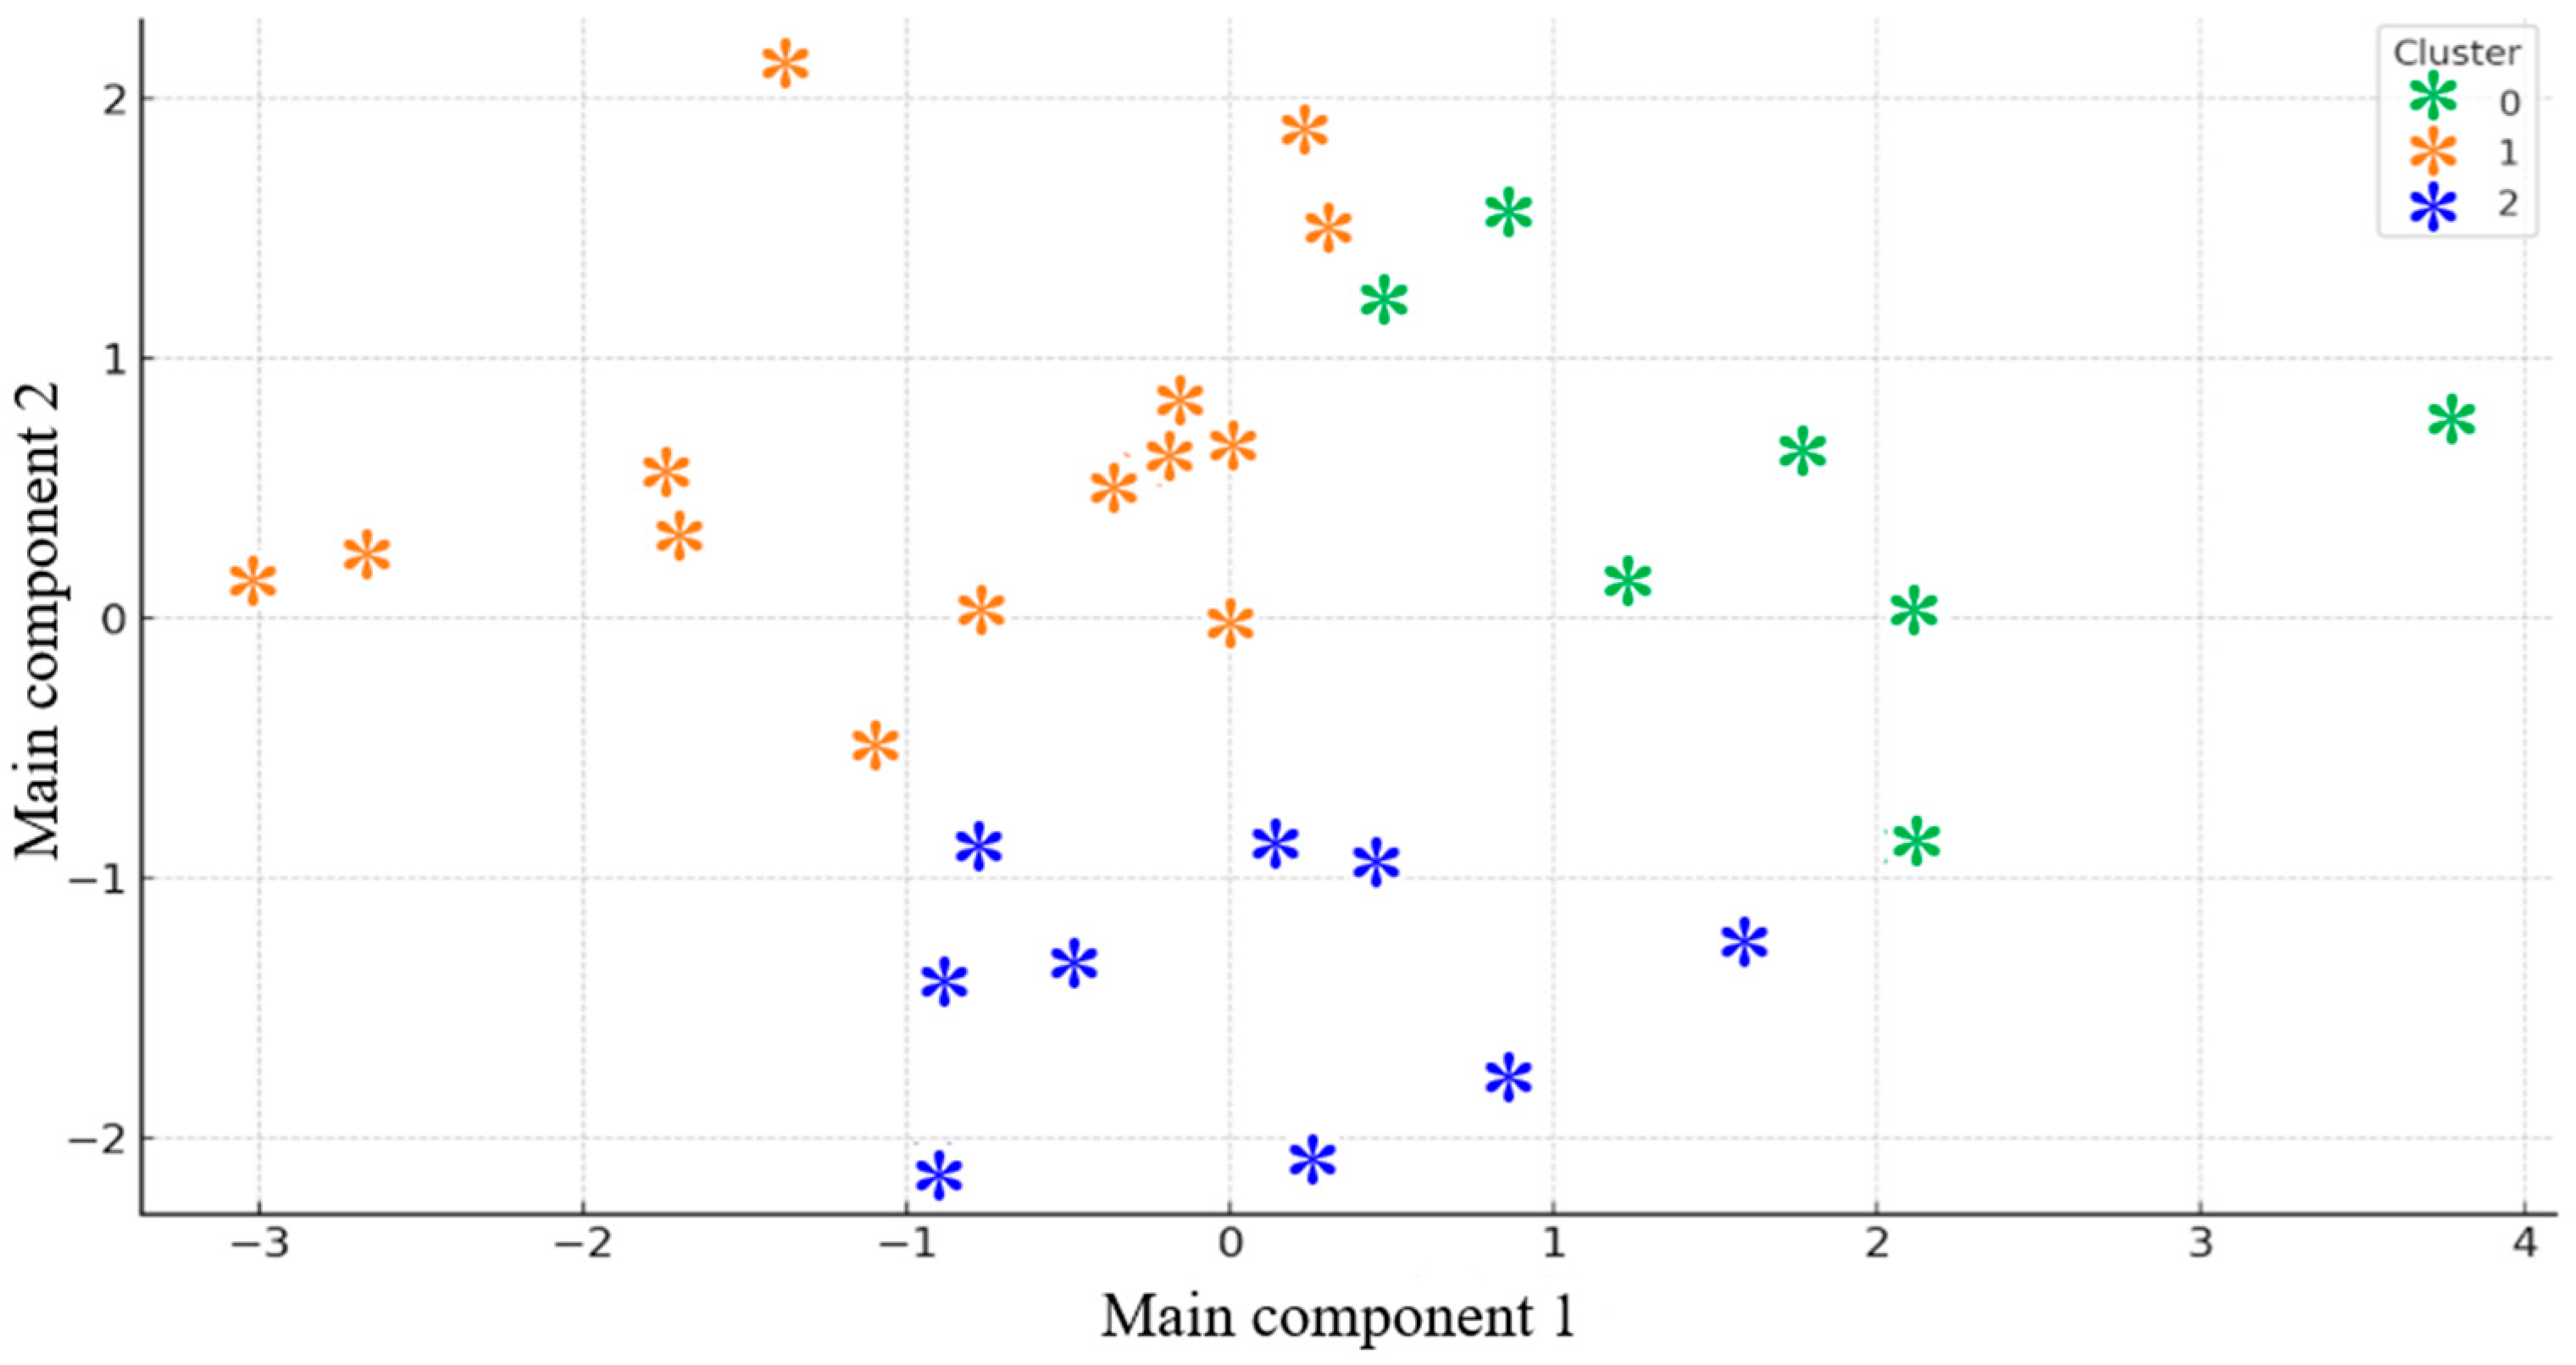
Clusters of participants based on psychological scores (PCA + K-means).
Figure 6.
Clusters of participants based on psychological scores (PCA + K-means).
Figure 7.
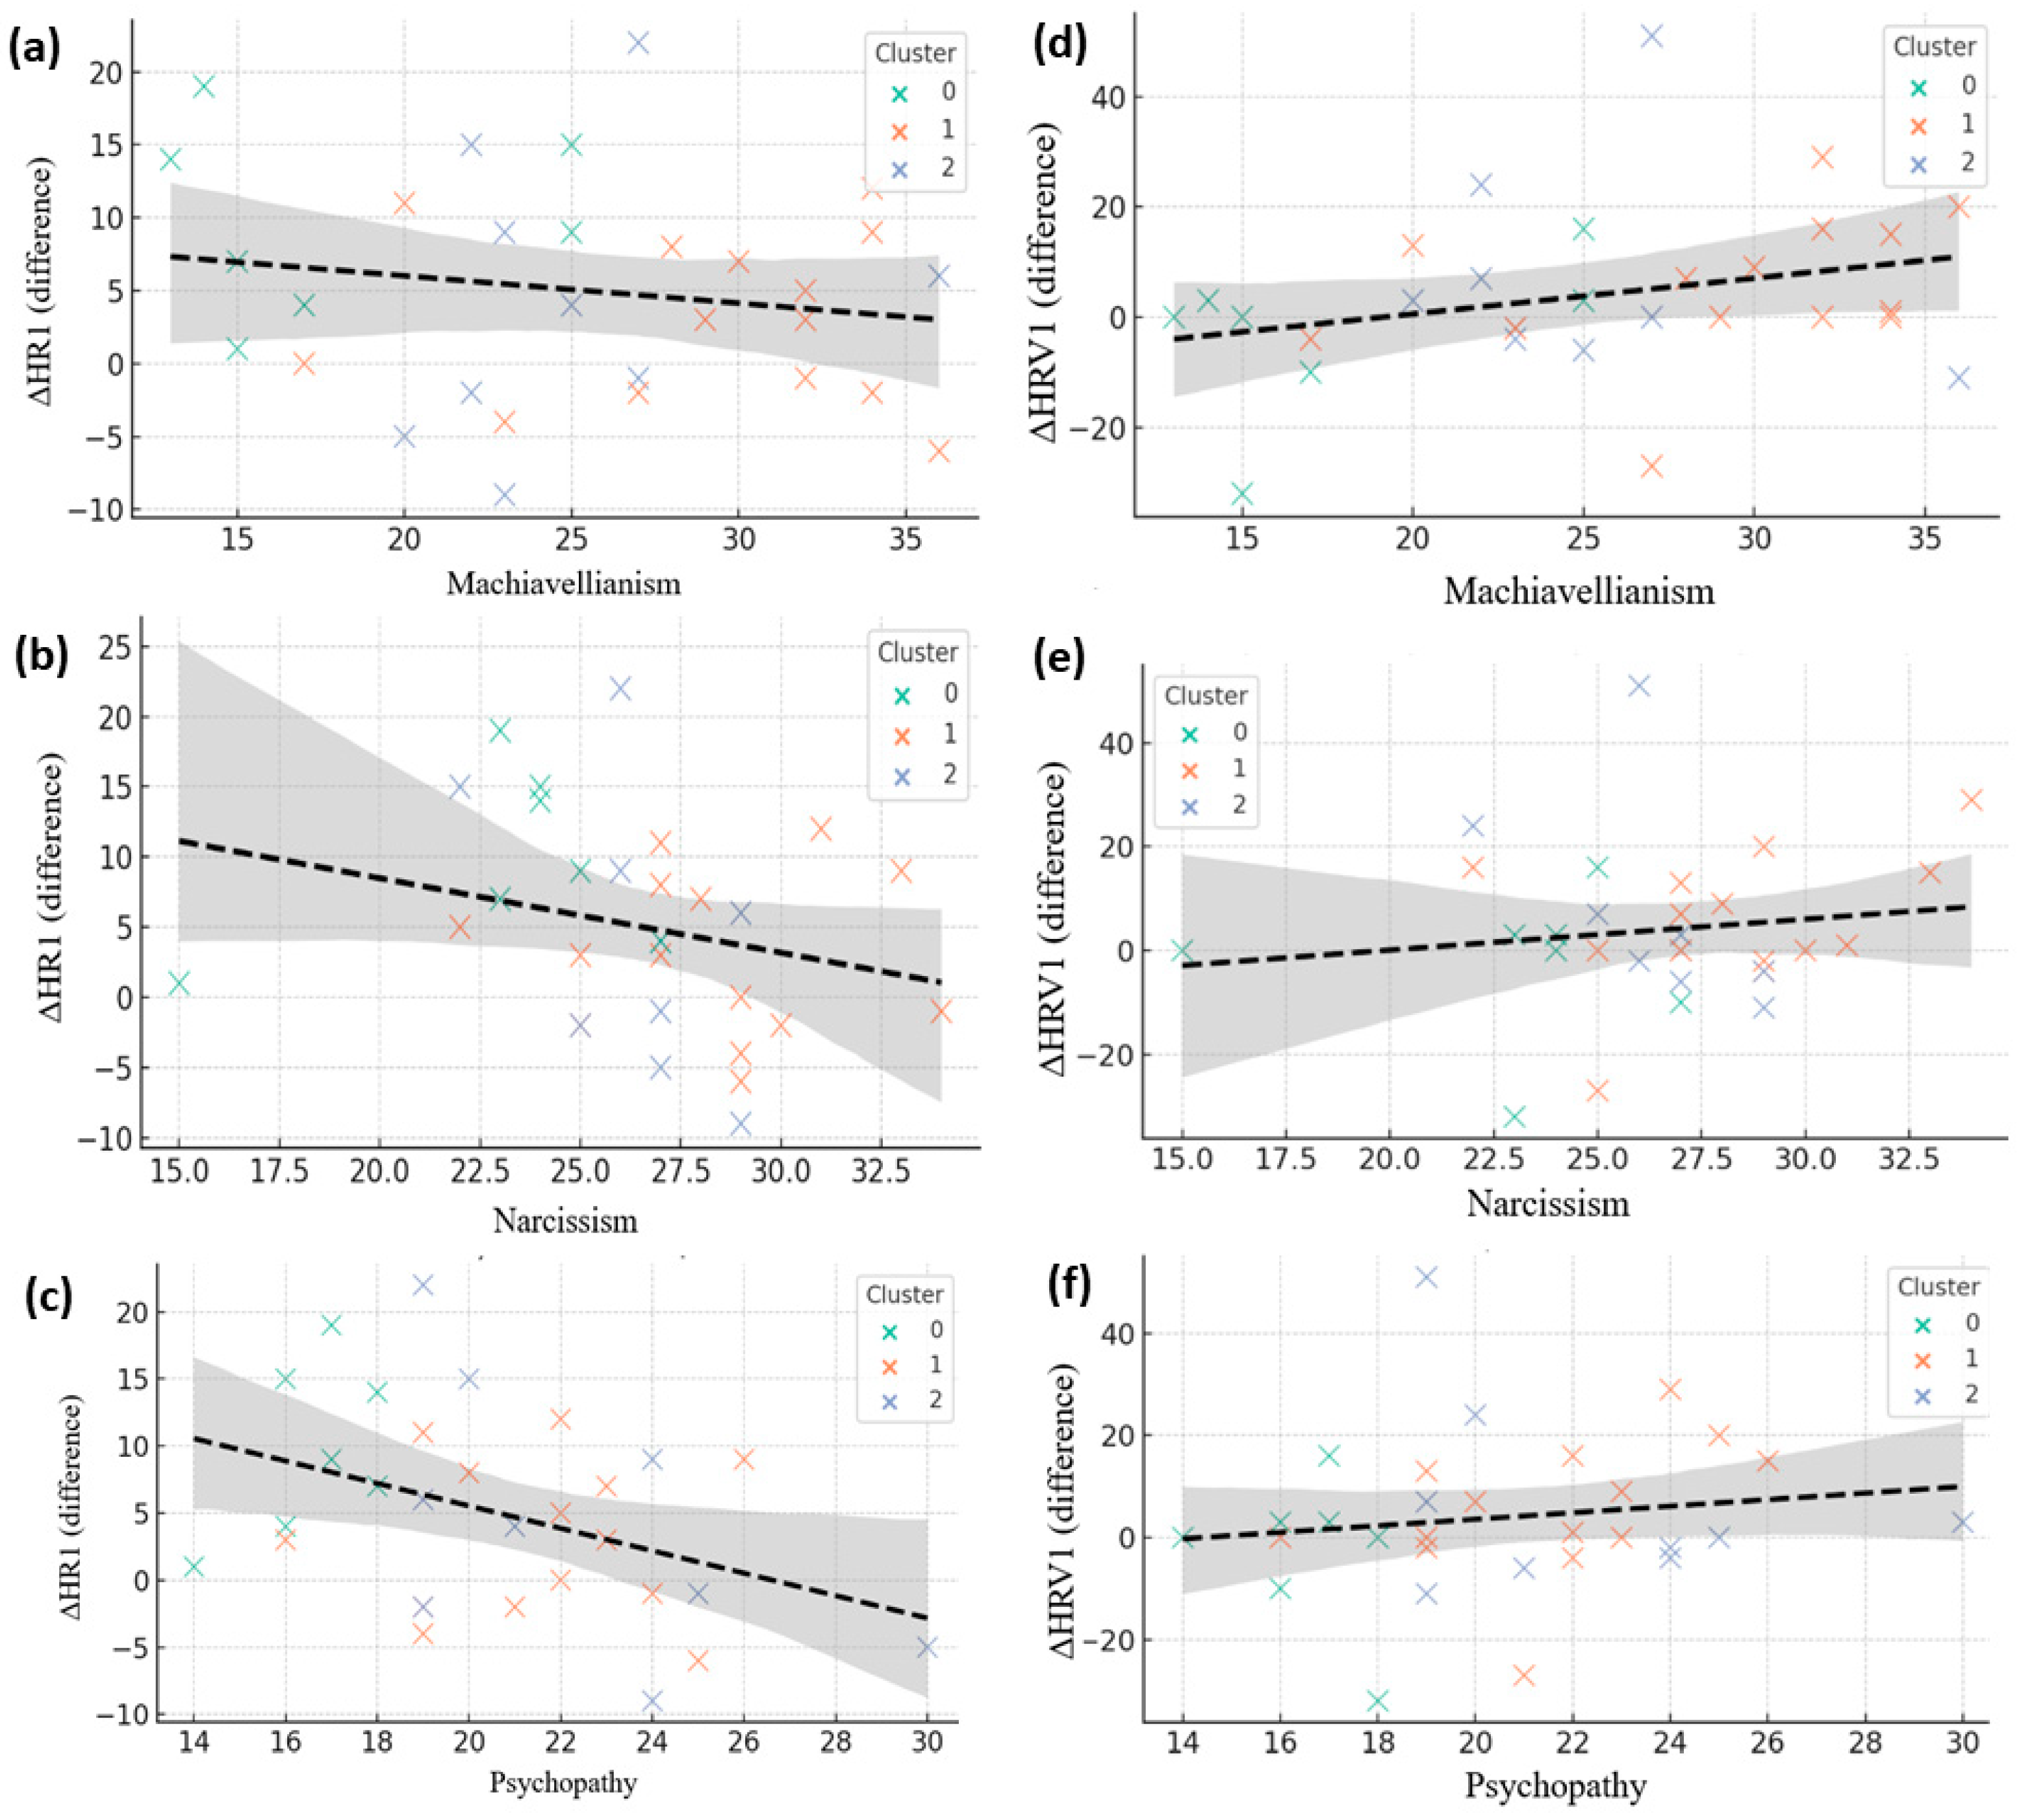
Correlations between Dark Triad traits and autonomic reactivity in neutral conditions. (a–c) Associations between Machiavellianism, Narcissism, and Psychopathy with heart rate change (ΔHR). (d–f) Corresponding associations with heart rate variability change (ΔHRV). Each point represents a participant, color-coded by psychological cluster (green = Cluster 0, orange = Cluster 1, blue = Cluster 2). Dashed lines indicate linear regression fits with shaded 95% confidence intervals.
Figure 8.
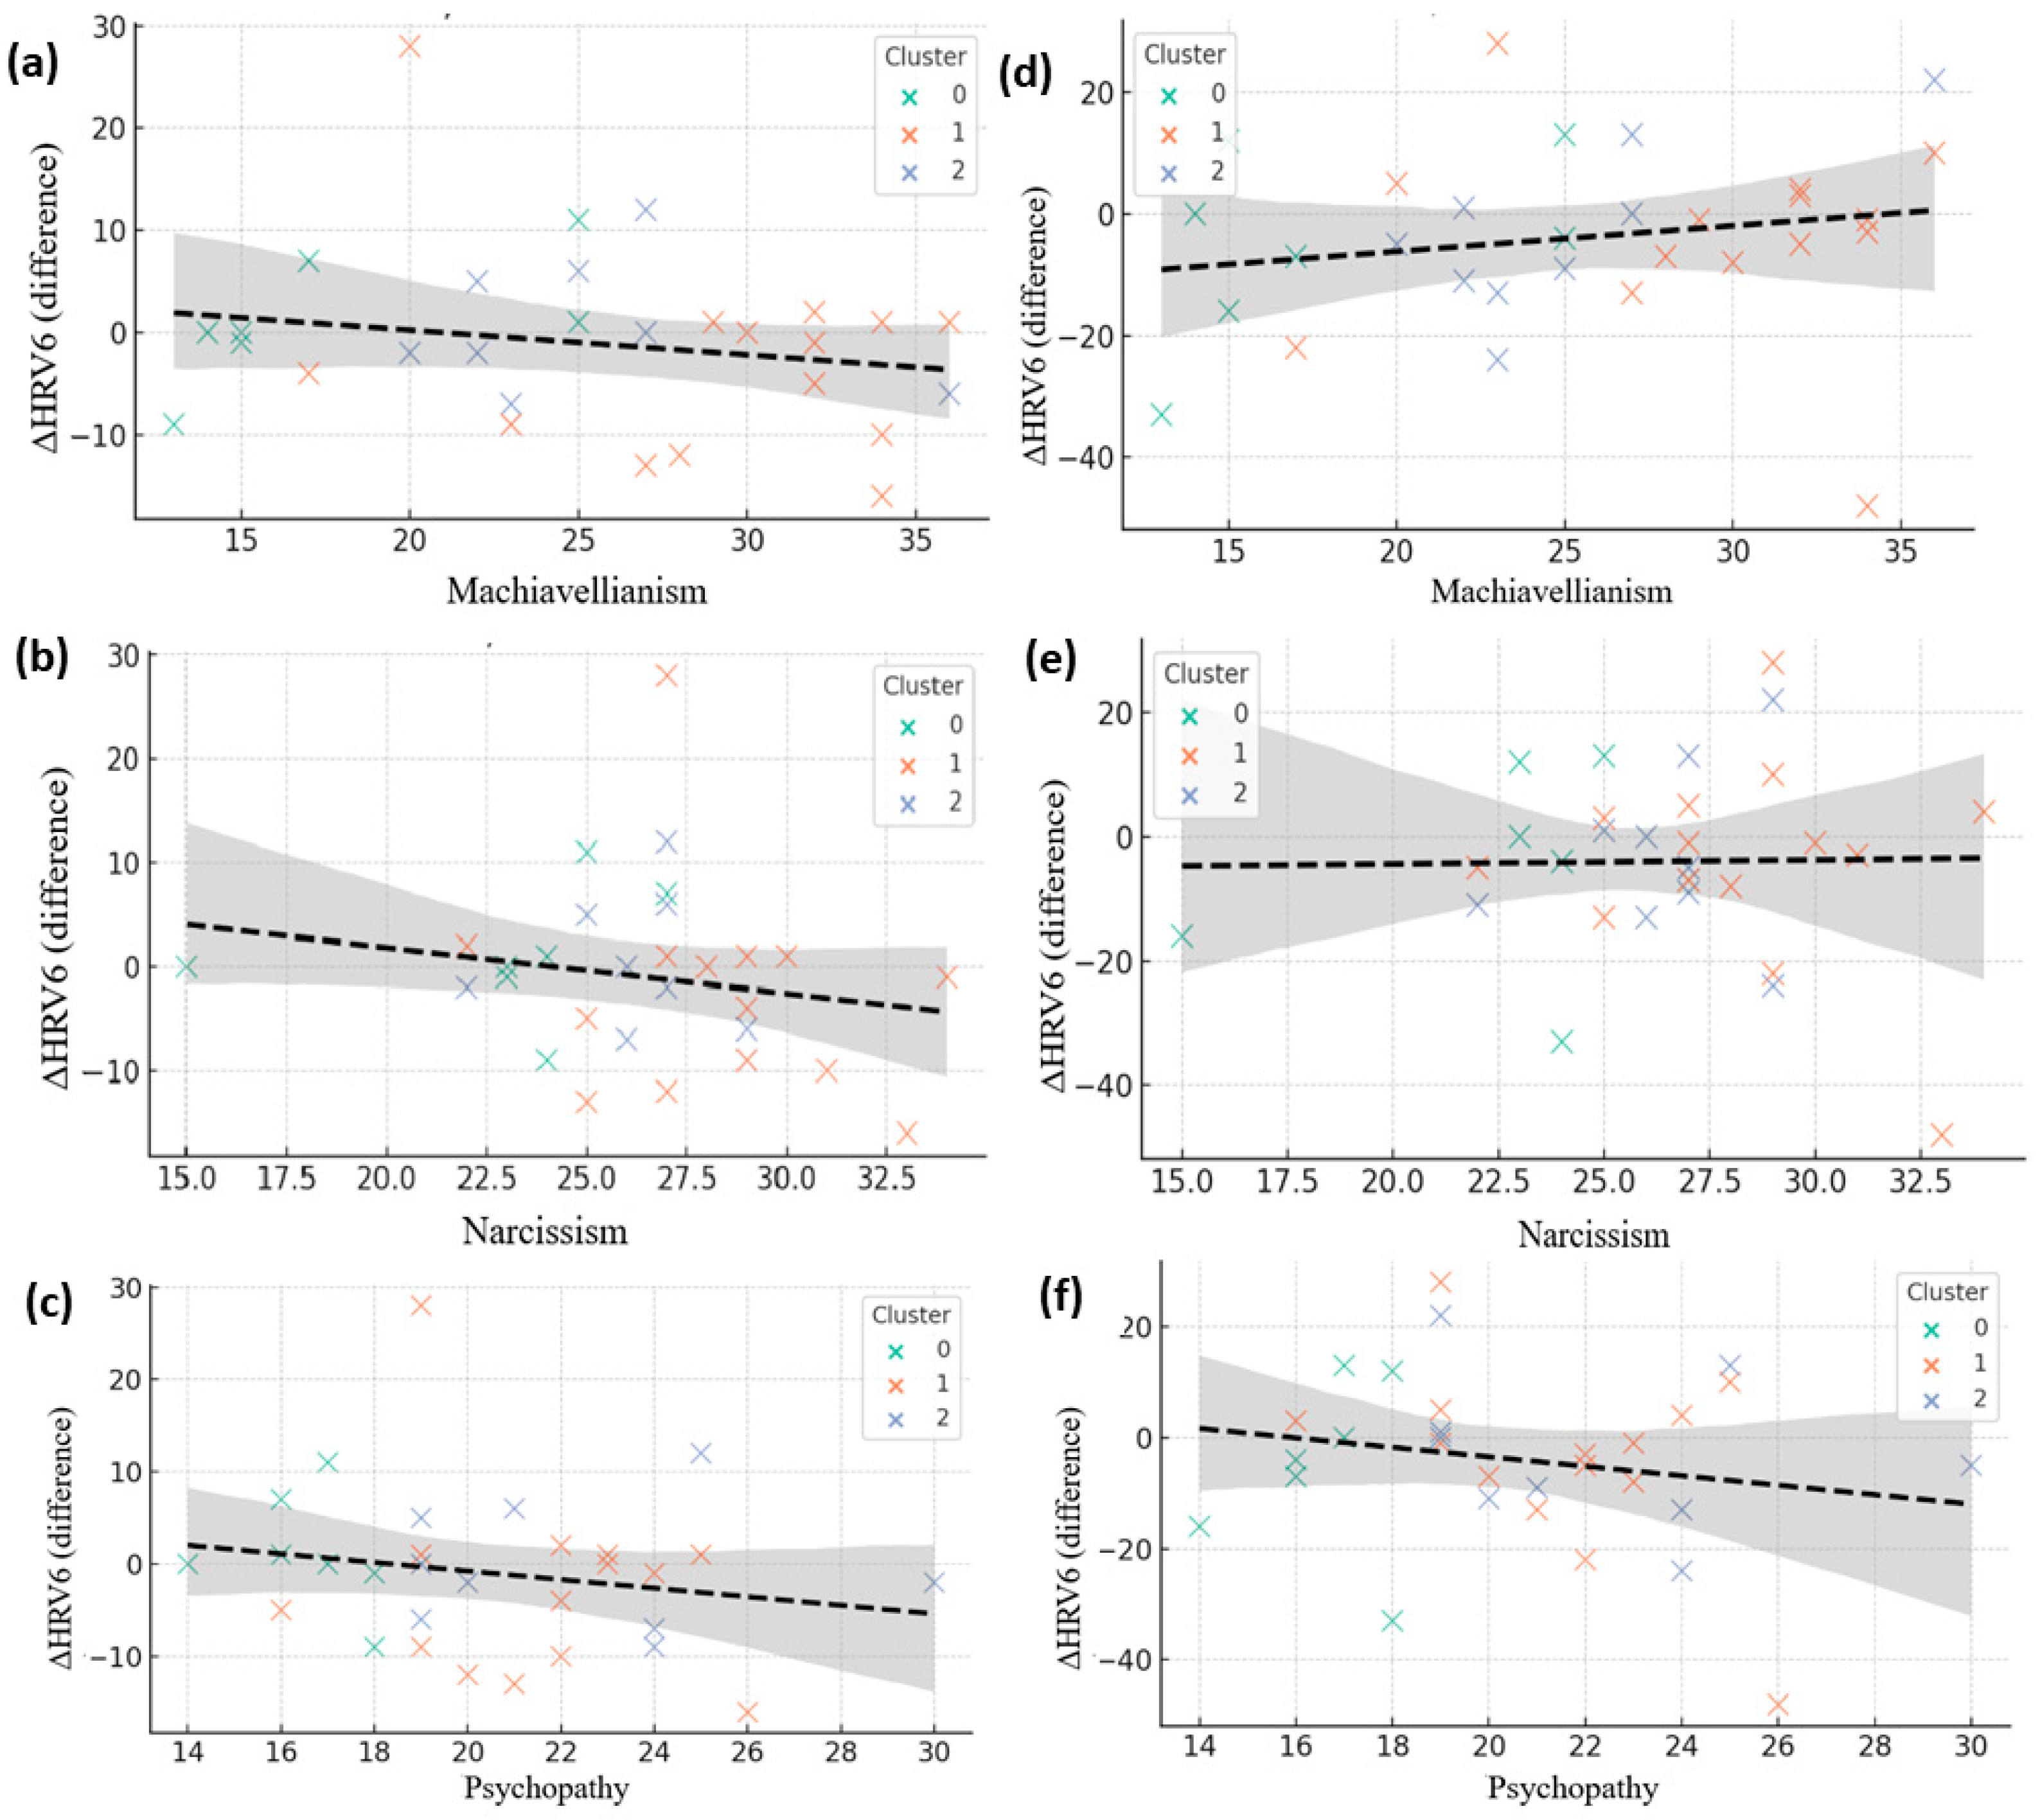
Correlations between Dark Triad traits and autonomic reactivity during deceptive conditions. (a–c) Associations between Machiavellianism, Narcissism, and Psychopathy with heart rate change (ΔHR). (d–f) Corresponding associations with heart rate variability change (ΔHRV). Each point represents a participant, color-coded by psychological cluster (green = Cluster 0, orange = Cluster 1, blue = Cluster 2). Dashed lines indicate linear regression fits with shaded 95% confidence intervals.
Figure 9.
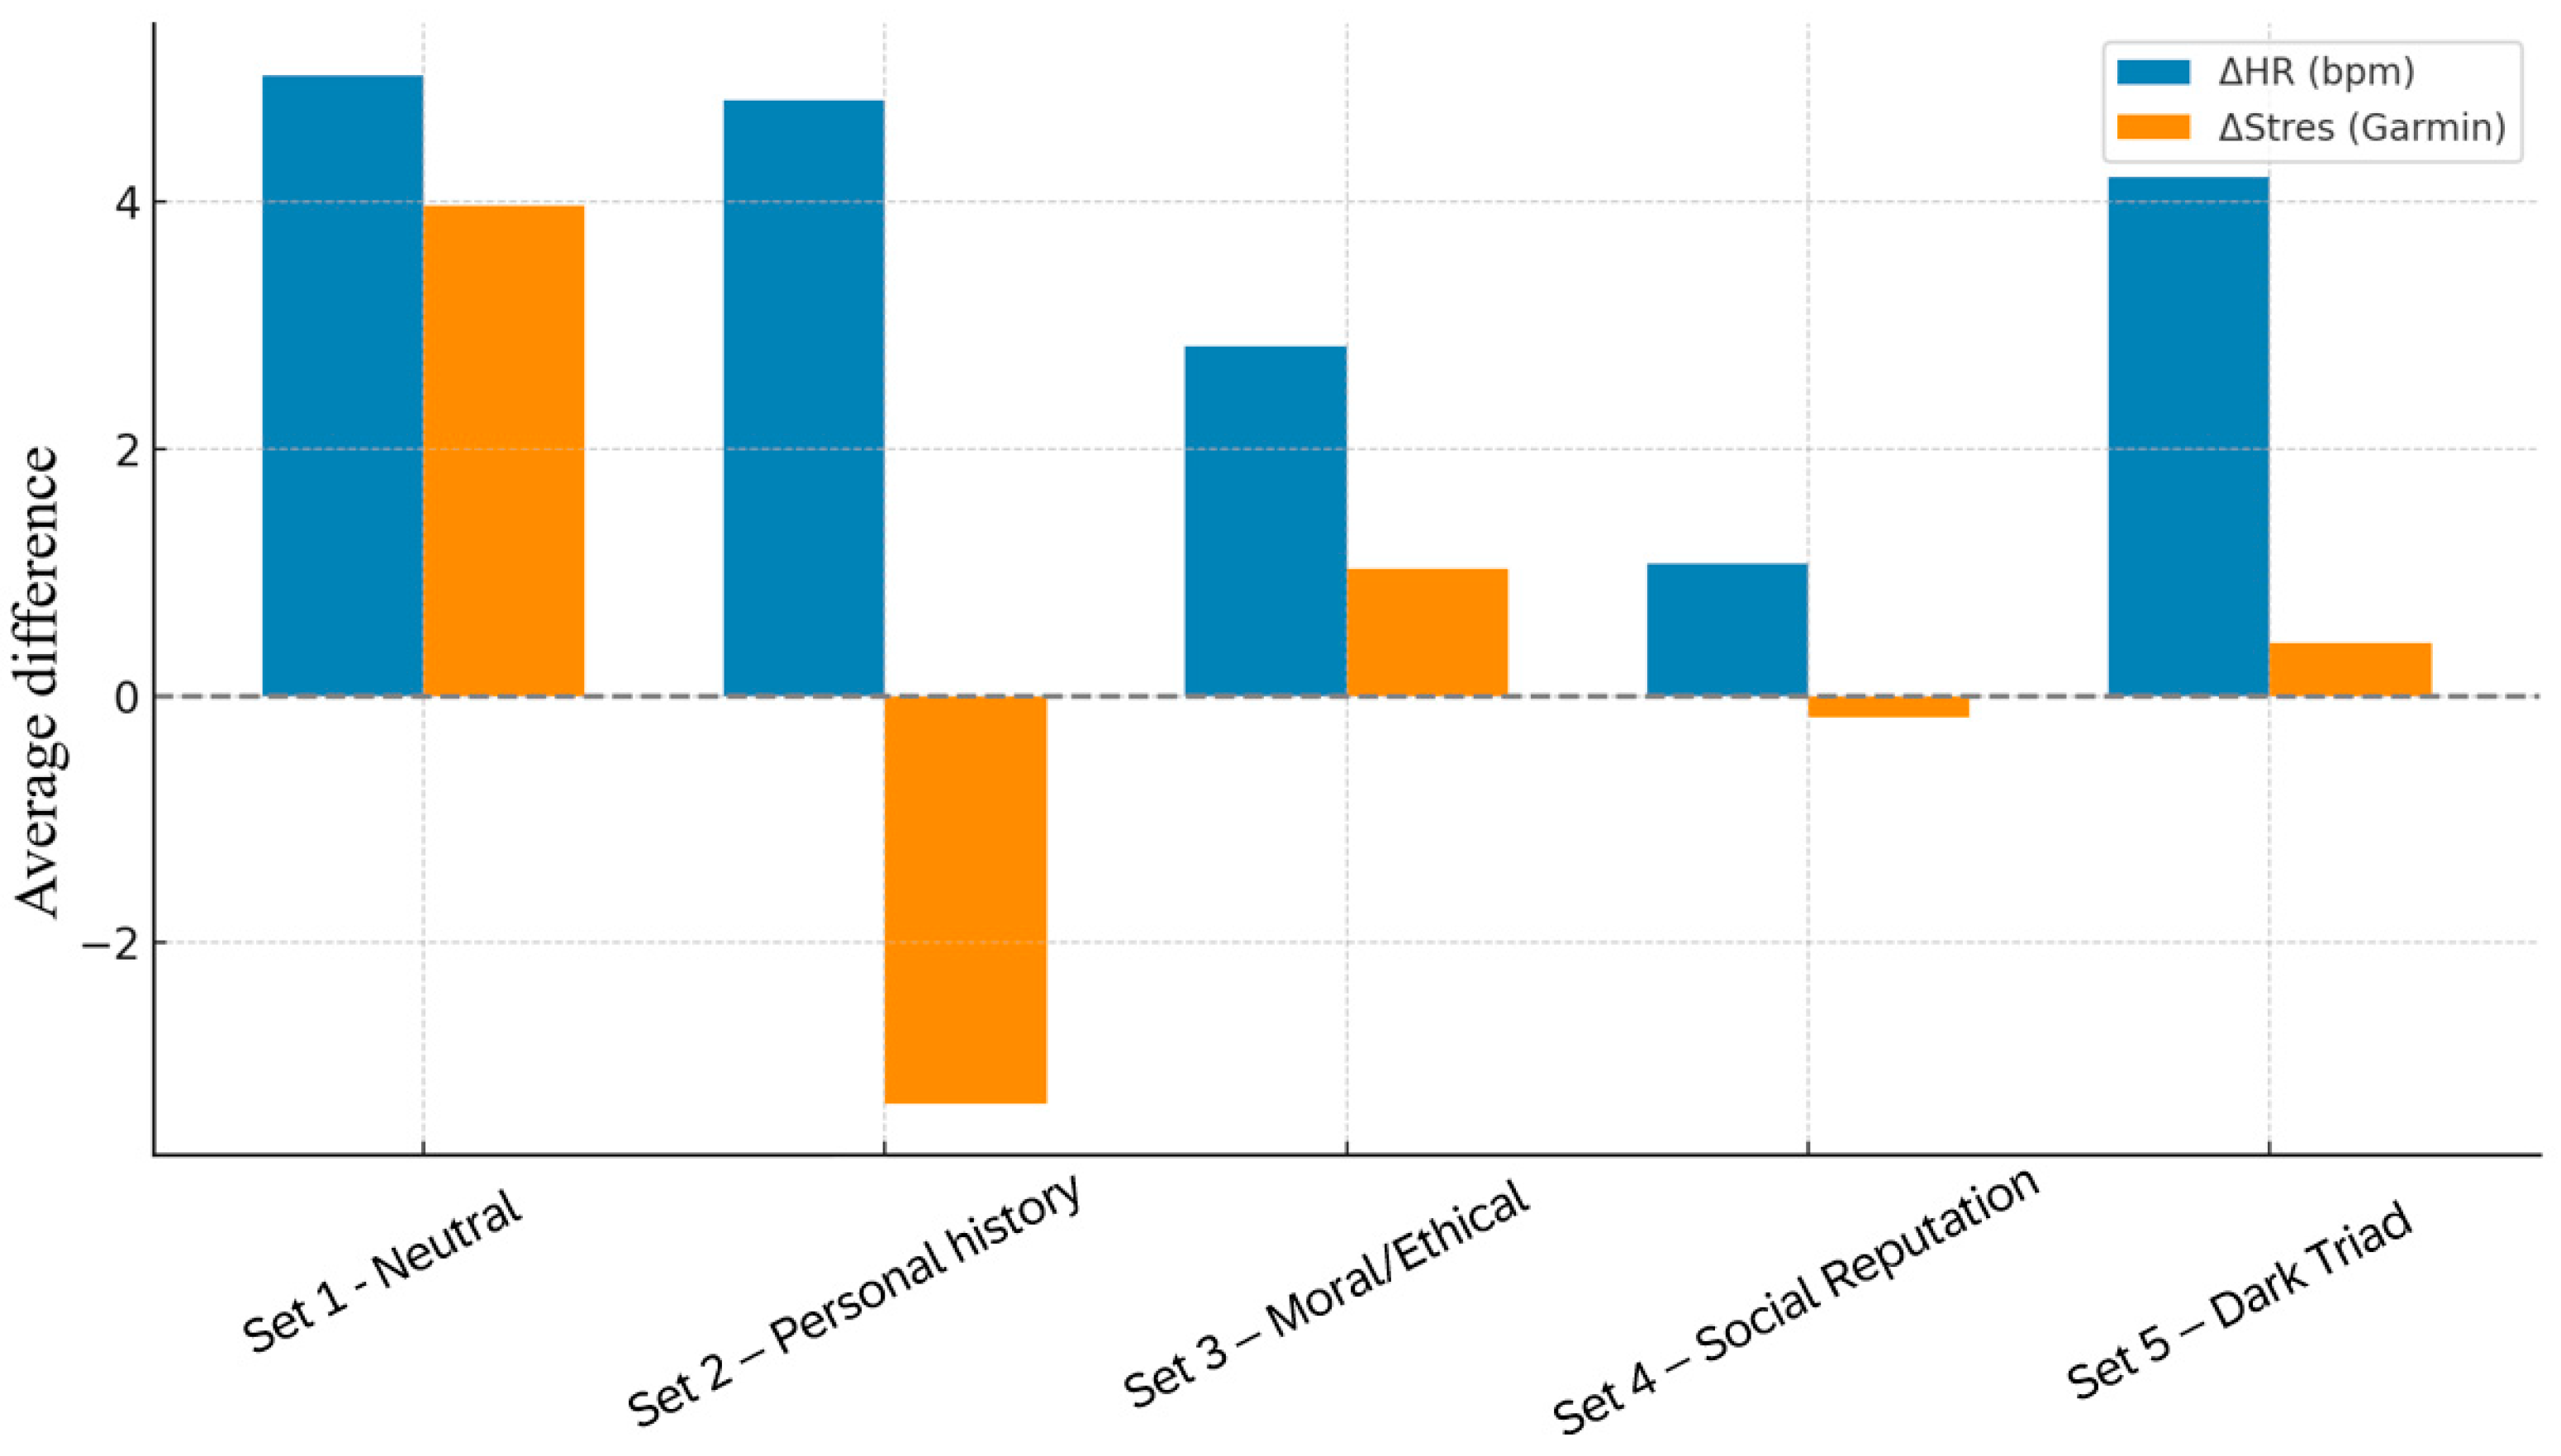
Comparative visualization of mean changes in heart rate (ΔHR, bpm) and HRV-derived stress (ΔStress) across all five question sets.
Figure 9.
Comparative visualization of mean changes in heart rate (ΔHR, bpm) and HRV-derived stress (ΔStress) across all five question sets.
Figure 10.
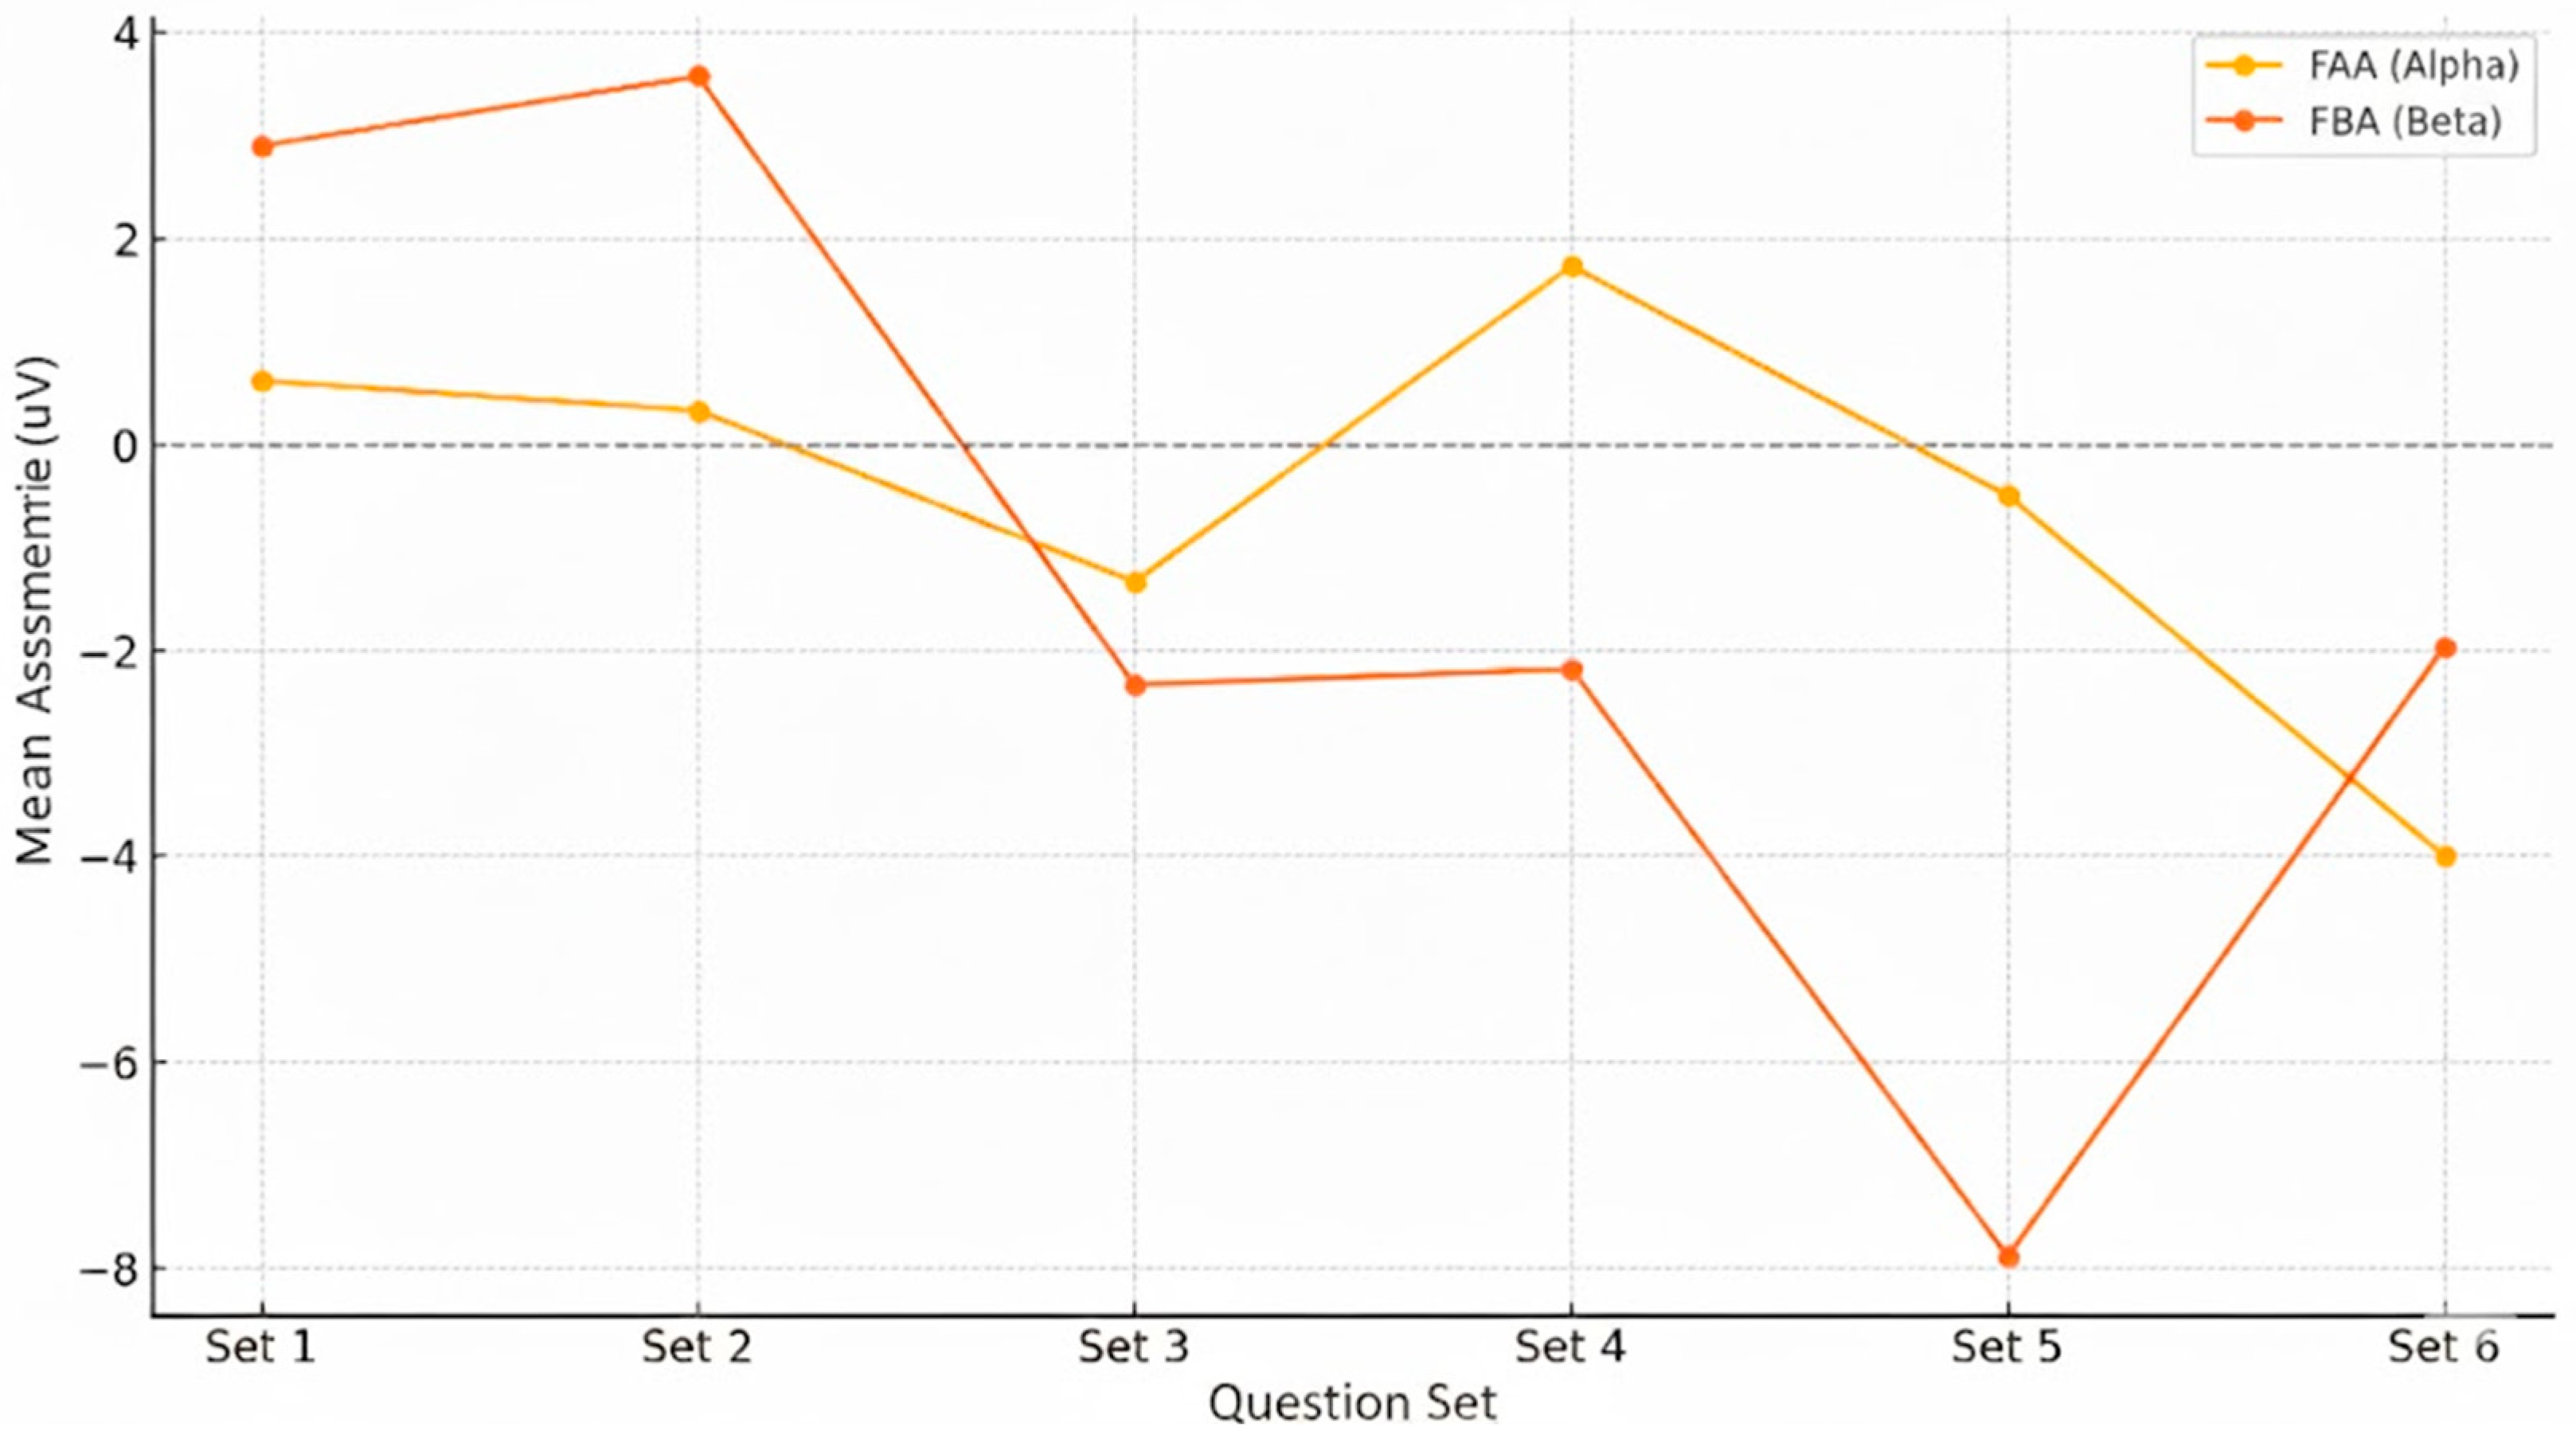
Evolution of frontal EEG asymmetry in Alpha (FAA) and Beta (FBA) across the six question sets. Values are mean right–left differences (μV) over frontal sites; positive = left dominance (reduced right activation), negative = right dominance (greater right activation).
Figure 10.
Evolution of frontal EEG asymmetry in Alpha (FAA) and Beta (FBA) across the six question sets. Values are mean right–left differences (μV) over frontal sites; positive = left dominance (reduced right activation), negative = right dominance (greater right activation).
Figure 11.
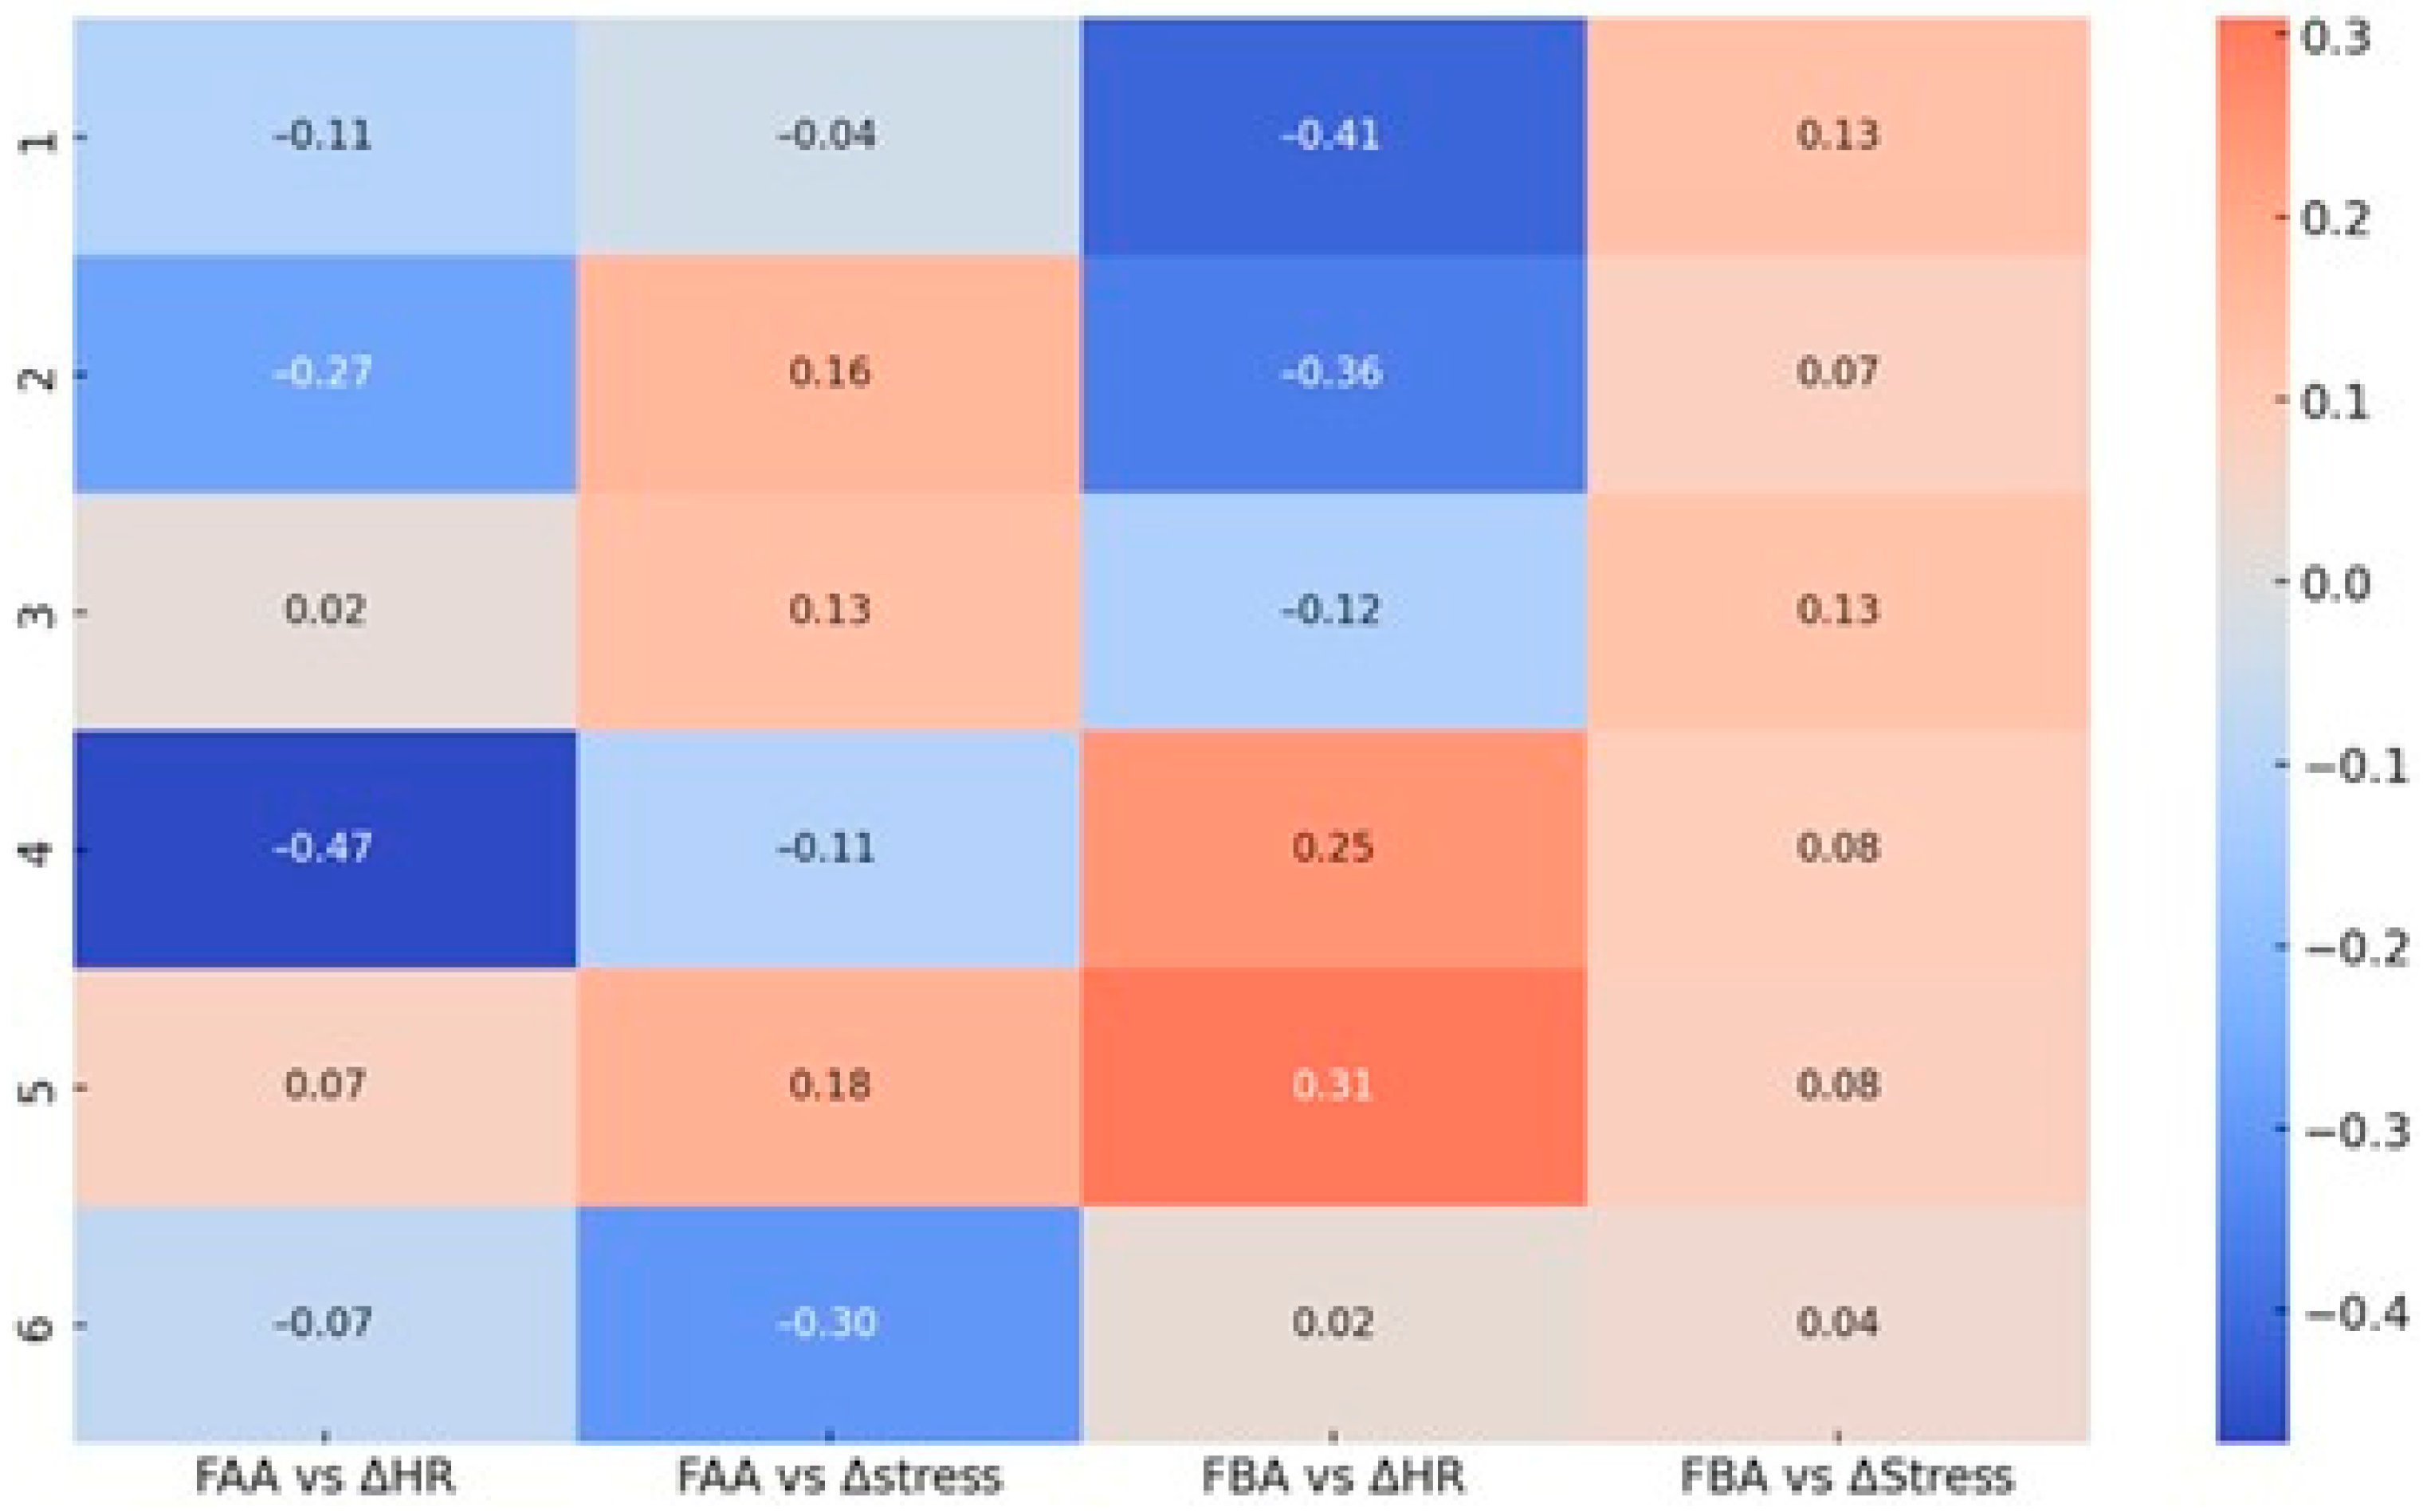
Correlation matrix linking frontal asymmetry (FAA—Alpha; FBA—Beta) with autonomic indices (ΔHR, ΔStress) for each question set. Cells display Pearson r; blue = negative, red = positive.
Figure 11.
Correlation matrix linking frontal asymmetry (FAA—Alpha; FBA—Beta) with autonomic indices (ΔHR, ΔStress) for each question set. Cells display Pearson r; blue = negative, red = positive.
Figure 12.
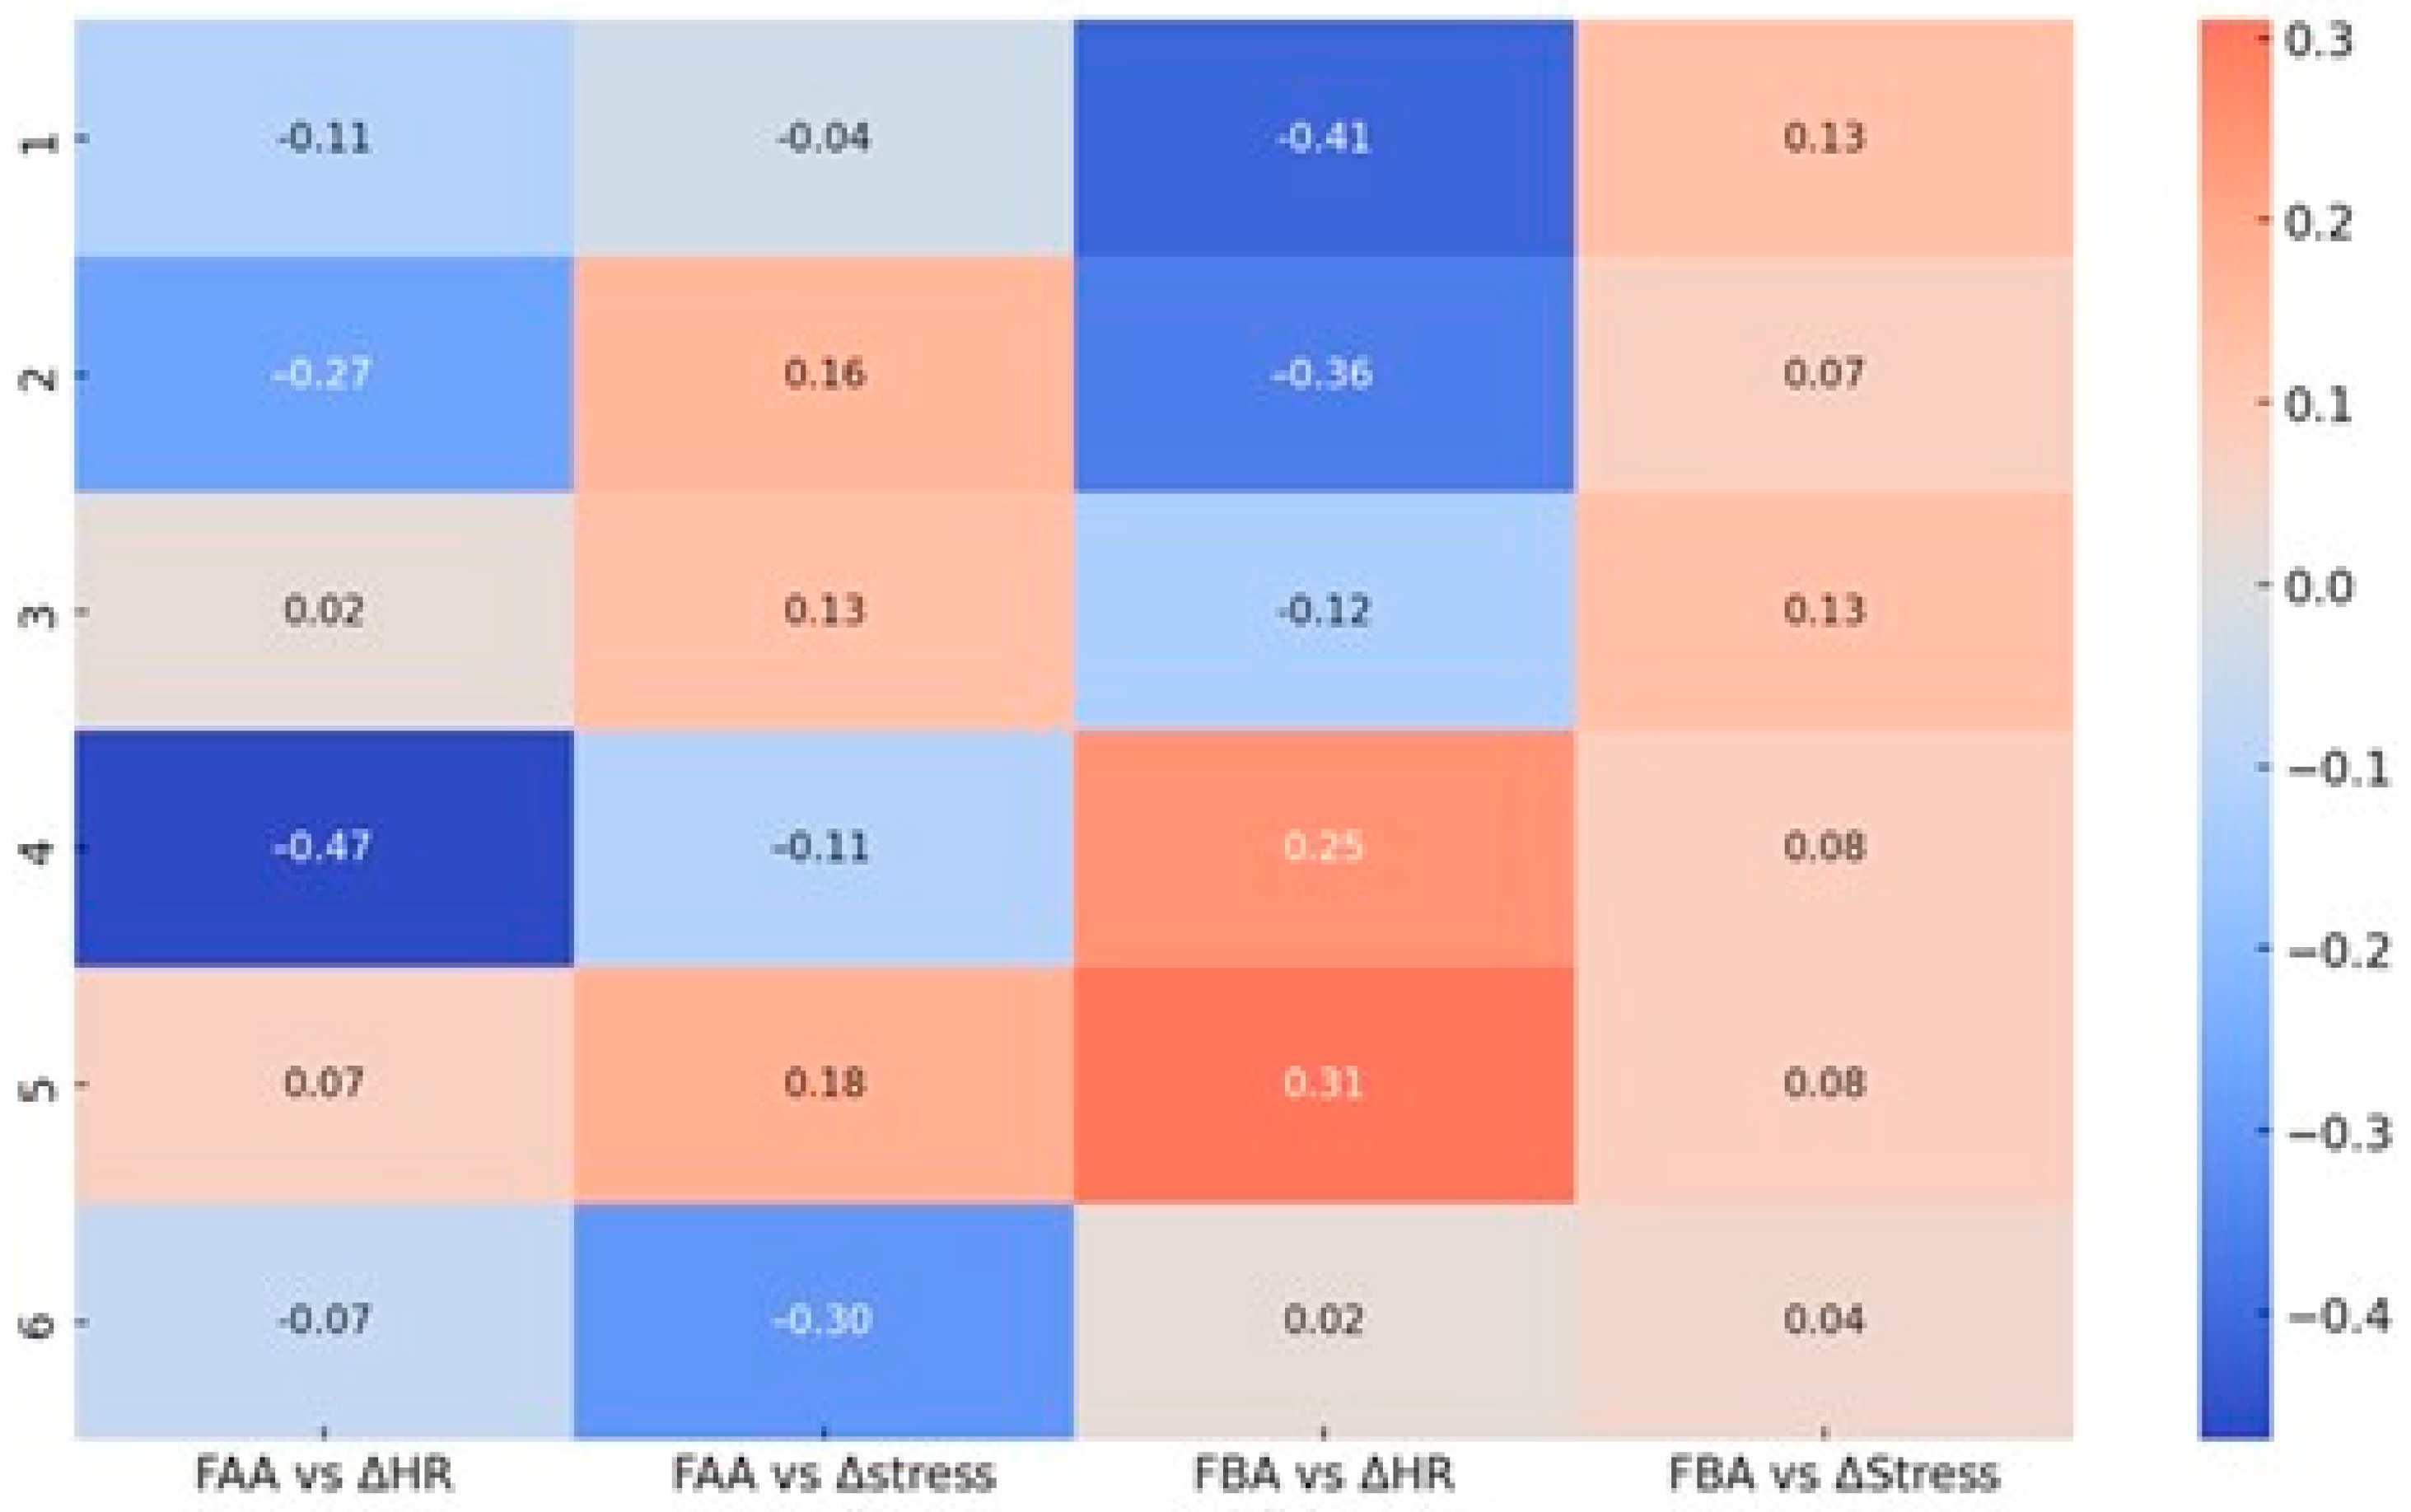
Correlation matrix between frontal EEG asymmetry (FAA—Alpha and FBA—Beta) and autonomic physiological parameters (ΔHR—heart rate, ΔStress—Garmin stress score) across the six question sets. Displayed values represent Pearson correlation coefficients, color-coded by the direction and magnitude of the relationship (red—positive, blue—negative).
Figure 13.
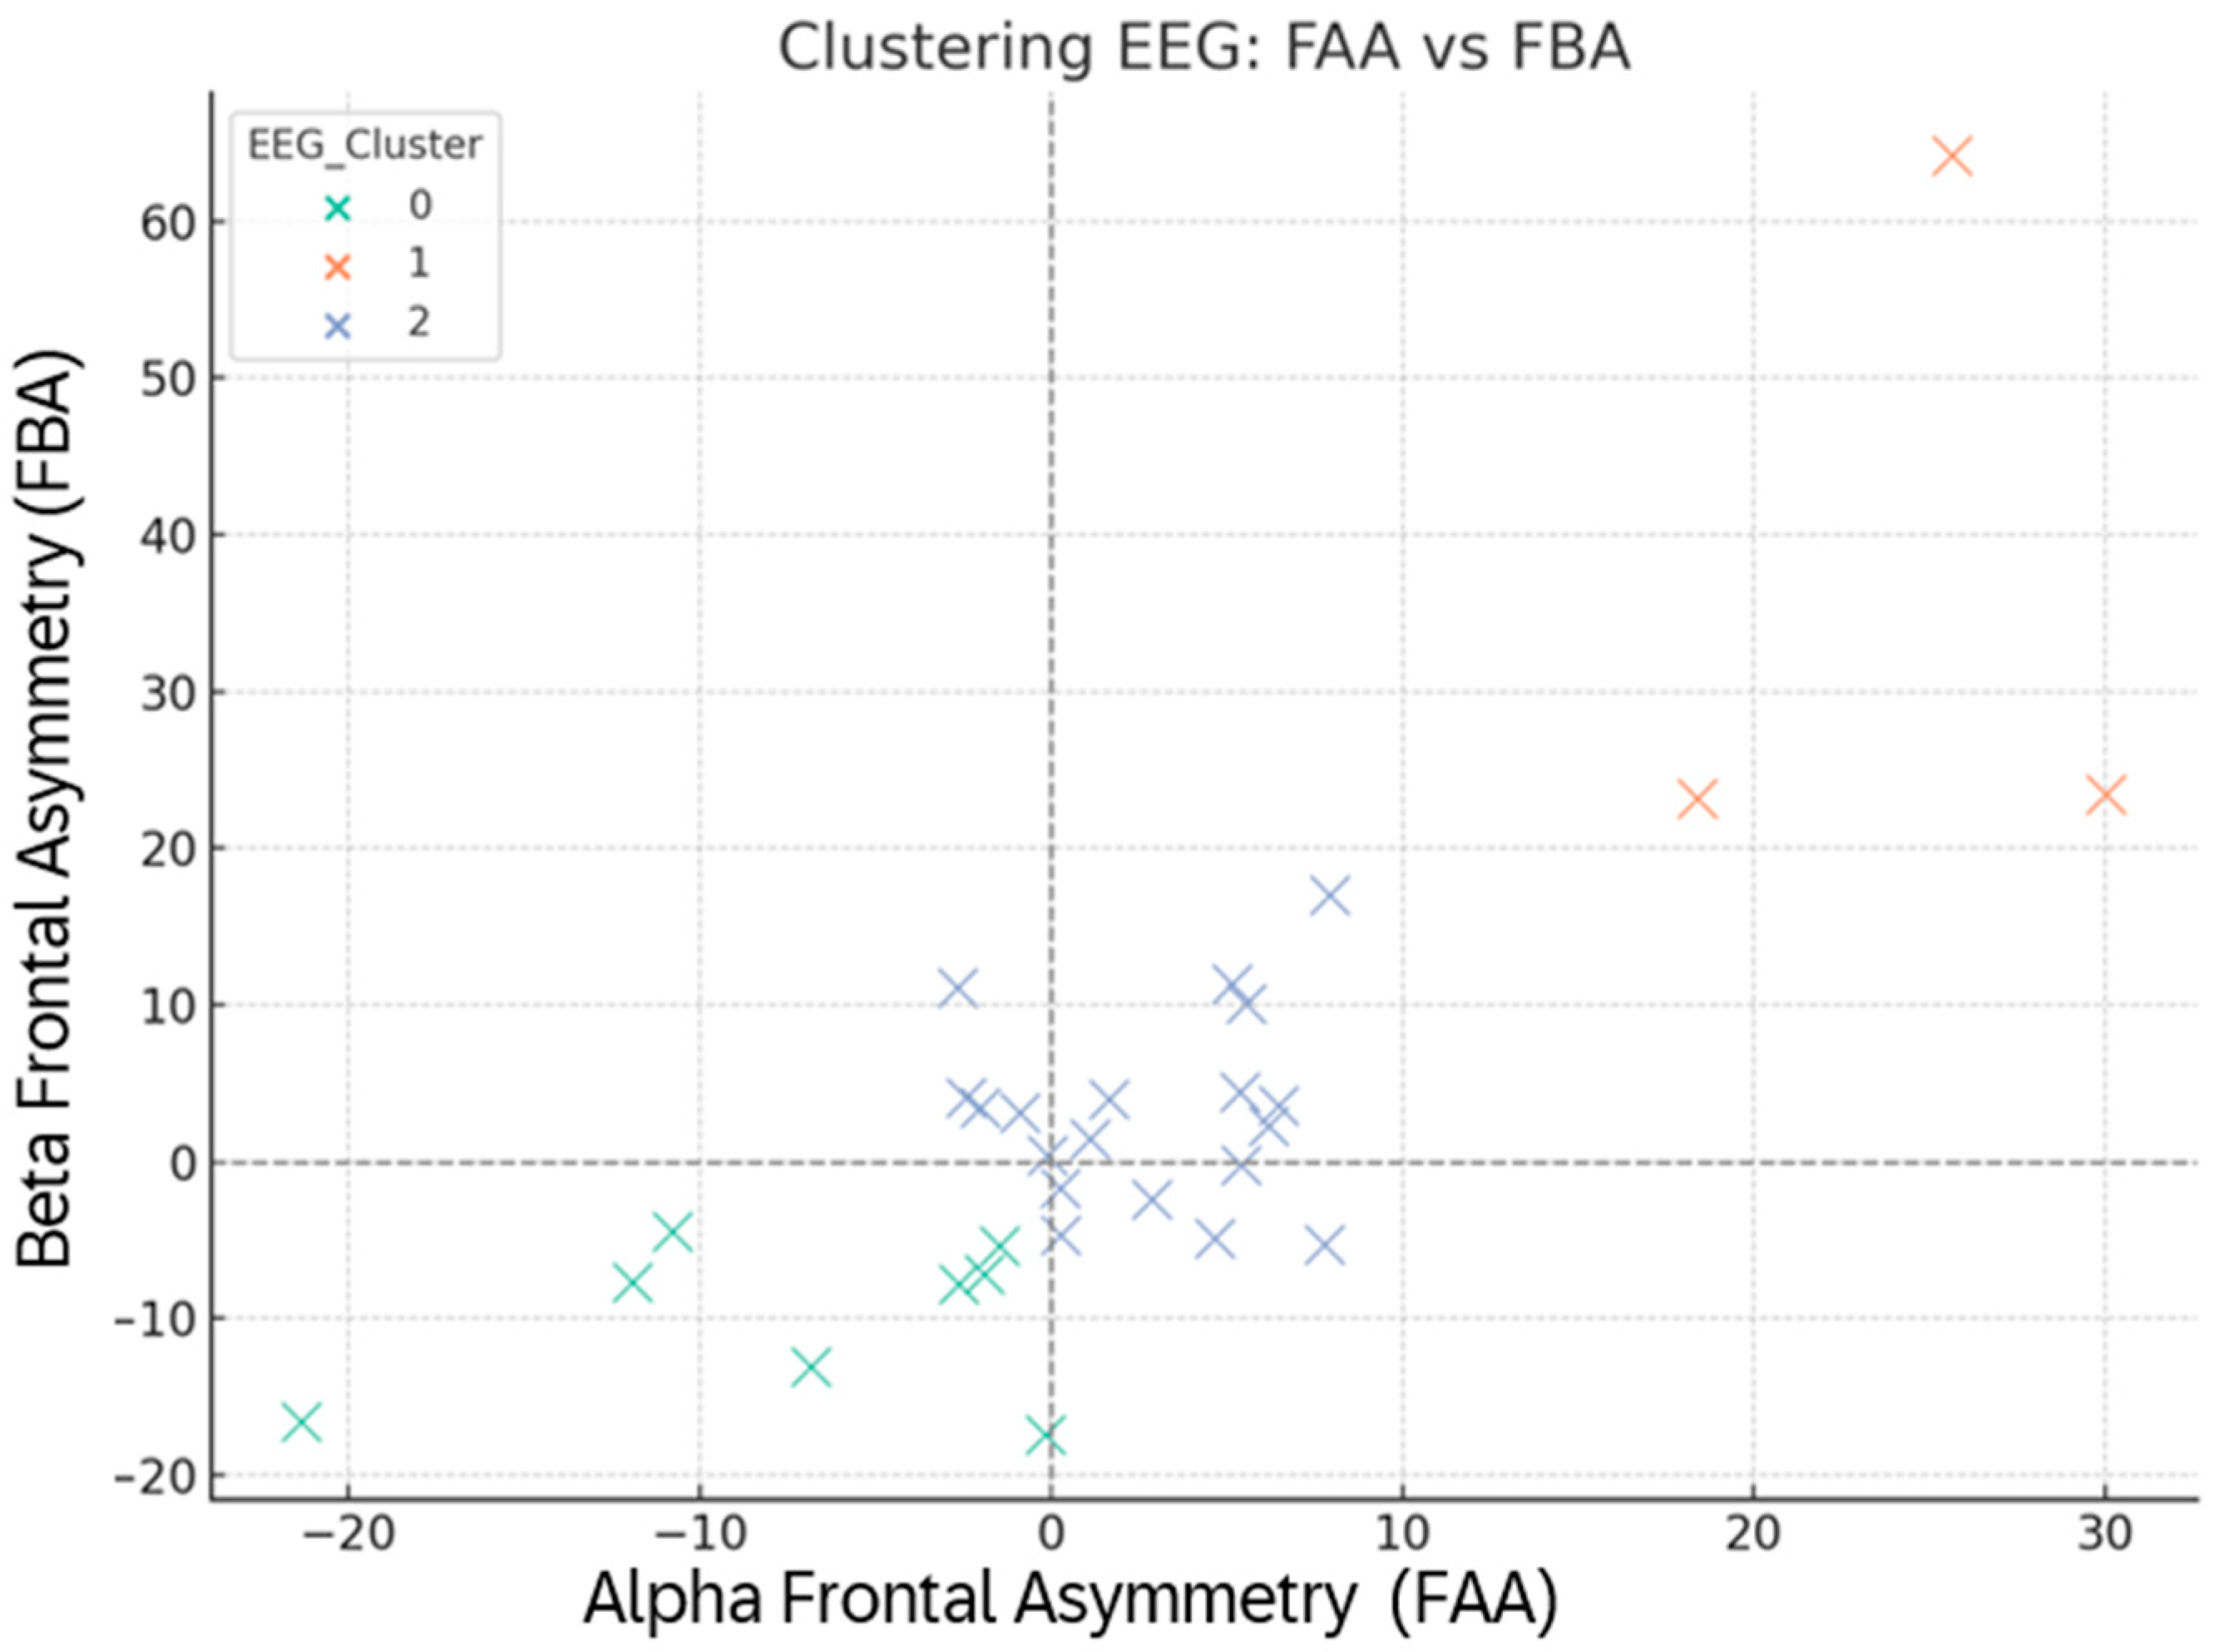
EEG clustering based on mean frontal asymmetry (FAA, FBA) across Sets 1–6. Points = participants, colored by EEG cluster (0/1/2). Dashed axes mark zero-dominance lines.
Figure 13.
EEG clustering based on mean frontal asymmetry (FAA, FBA) across Sets 1–6. Points = participants, colored by EEG cluster (0/1/2). Dashed axes mark zero-dominance lines.
Figure 14.
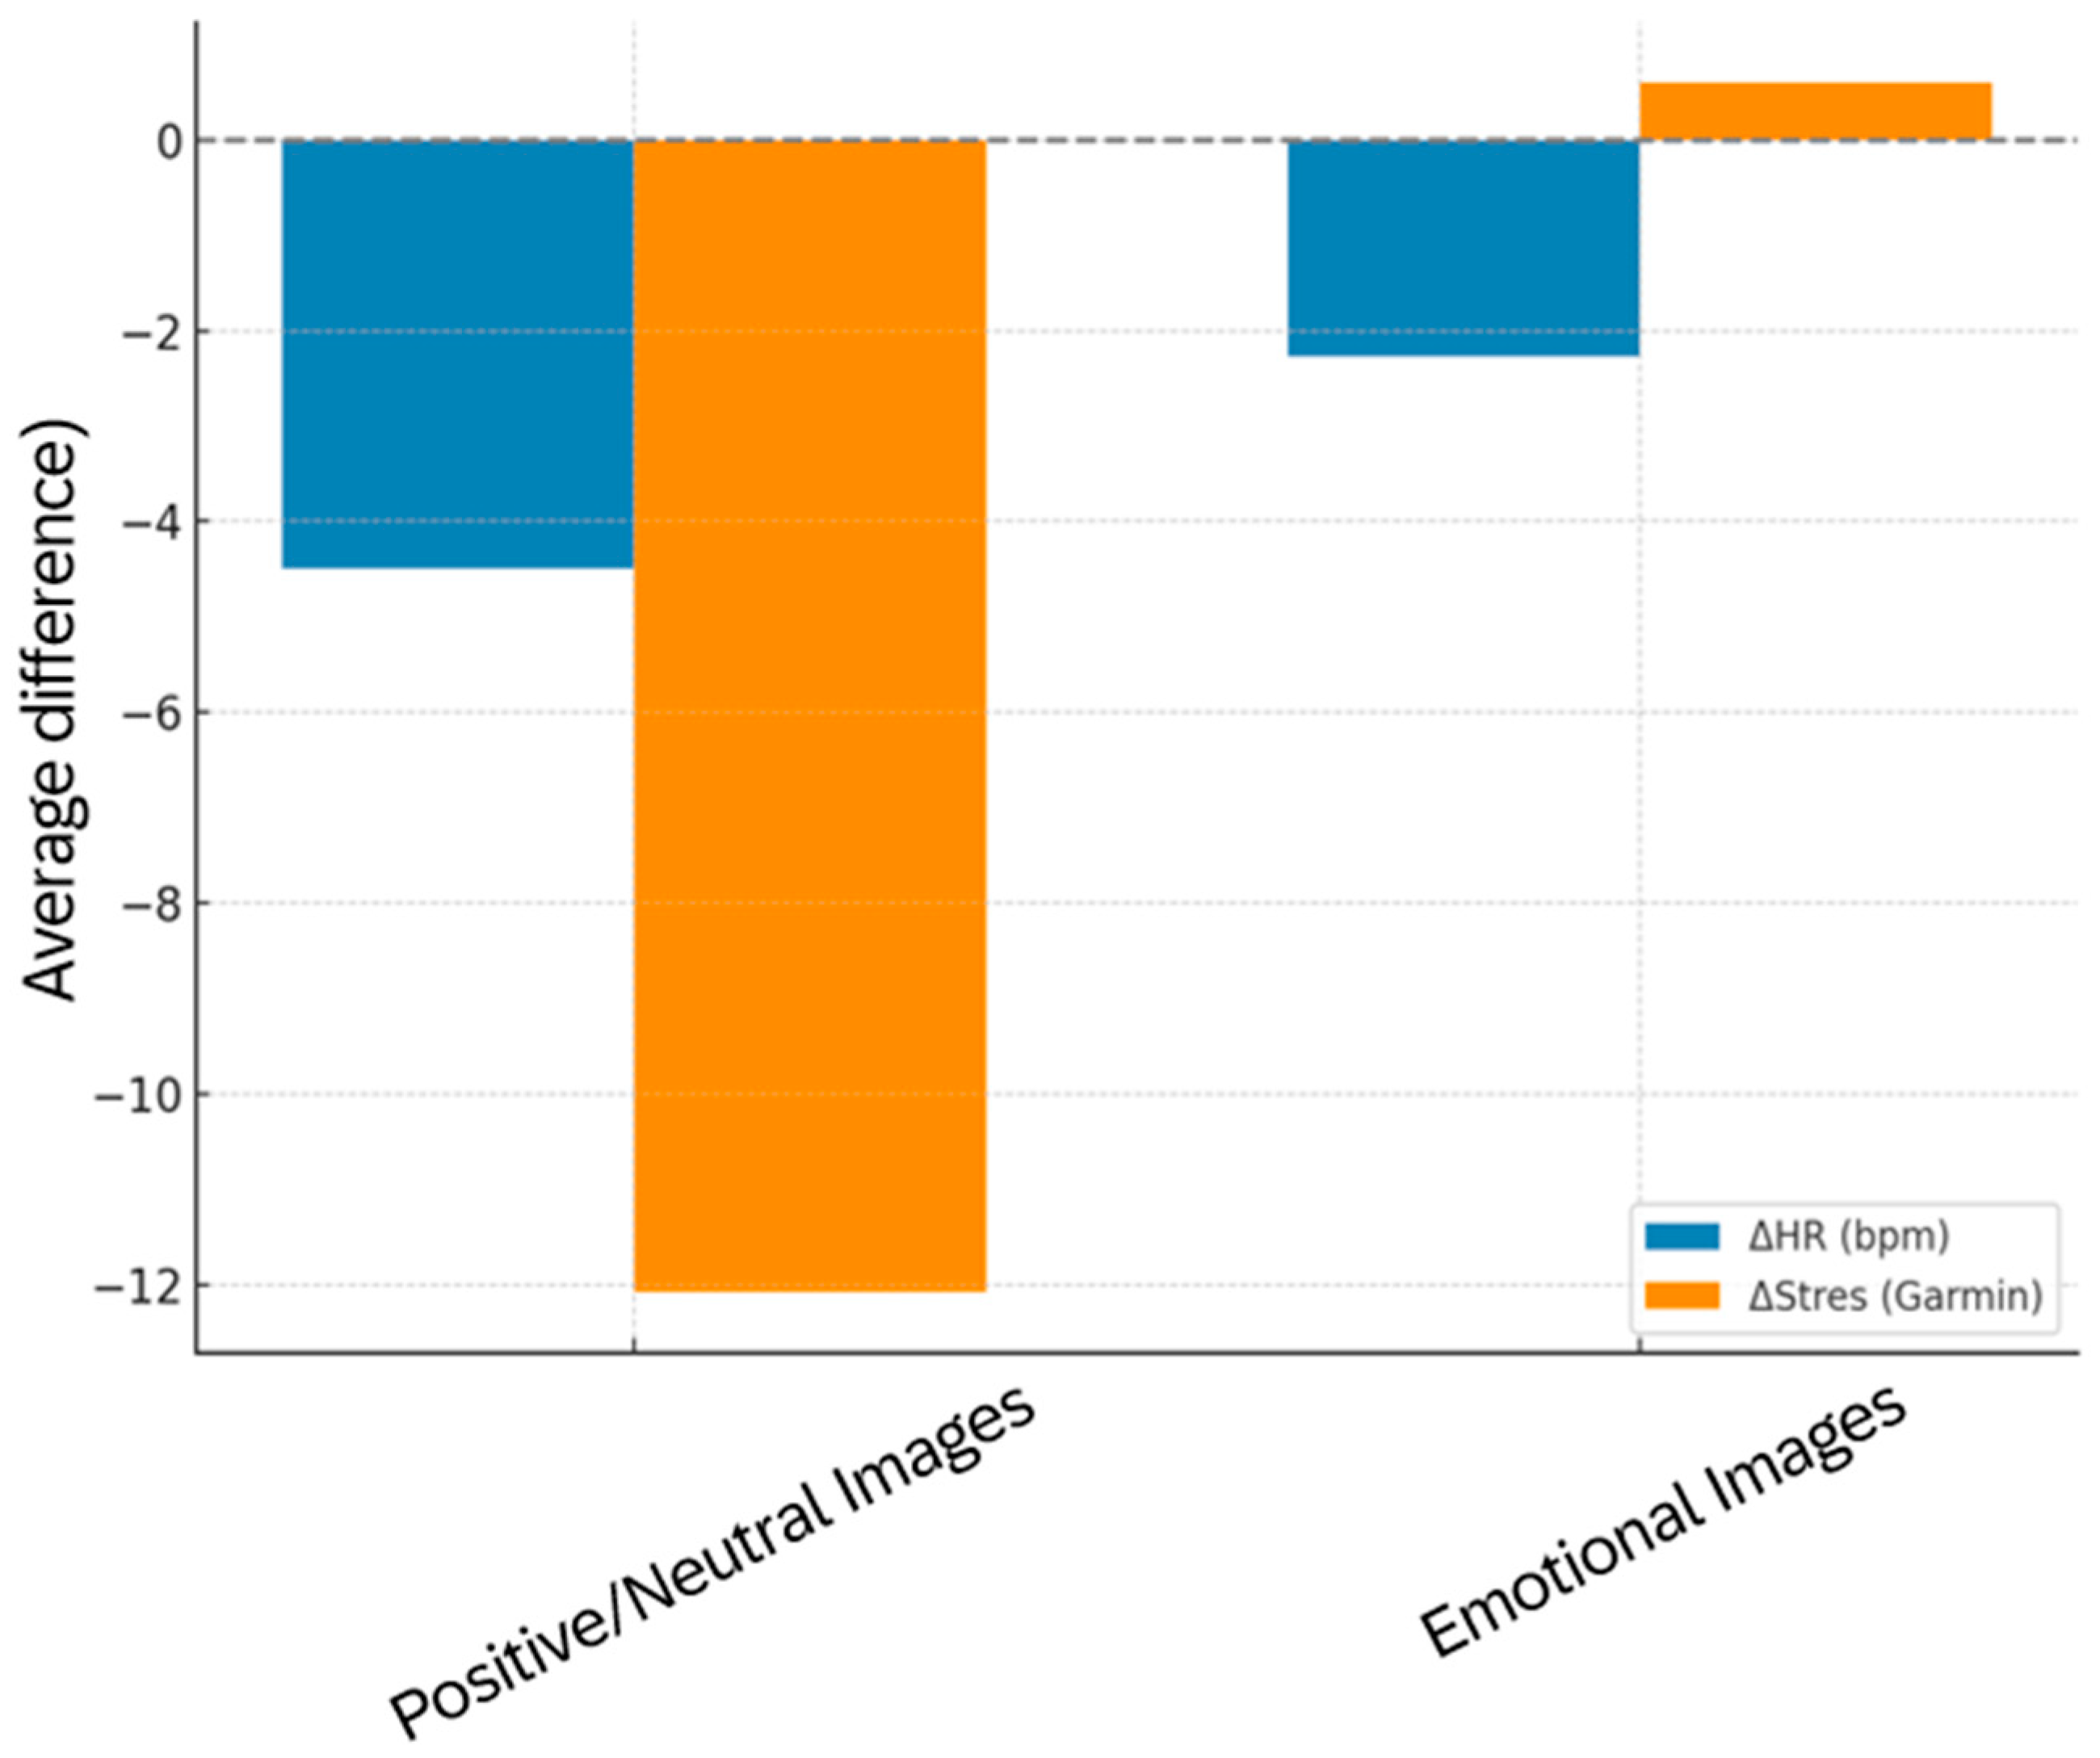
Bar plot of ΔHR (bpm) and ΔStress during exposure to positive/neutral vs. negative images. Negative values indicate reductions from baseline.
Figure 14.
Bar plot of ΔHR (bpm) and ΔStress during exposure to positive/neutral vs. negative images. Negative values indicate reductions from baseline.
Figure 15.
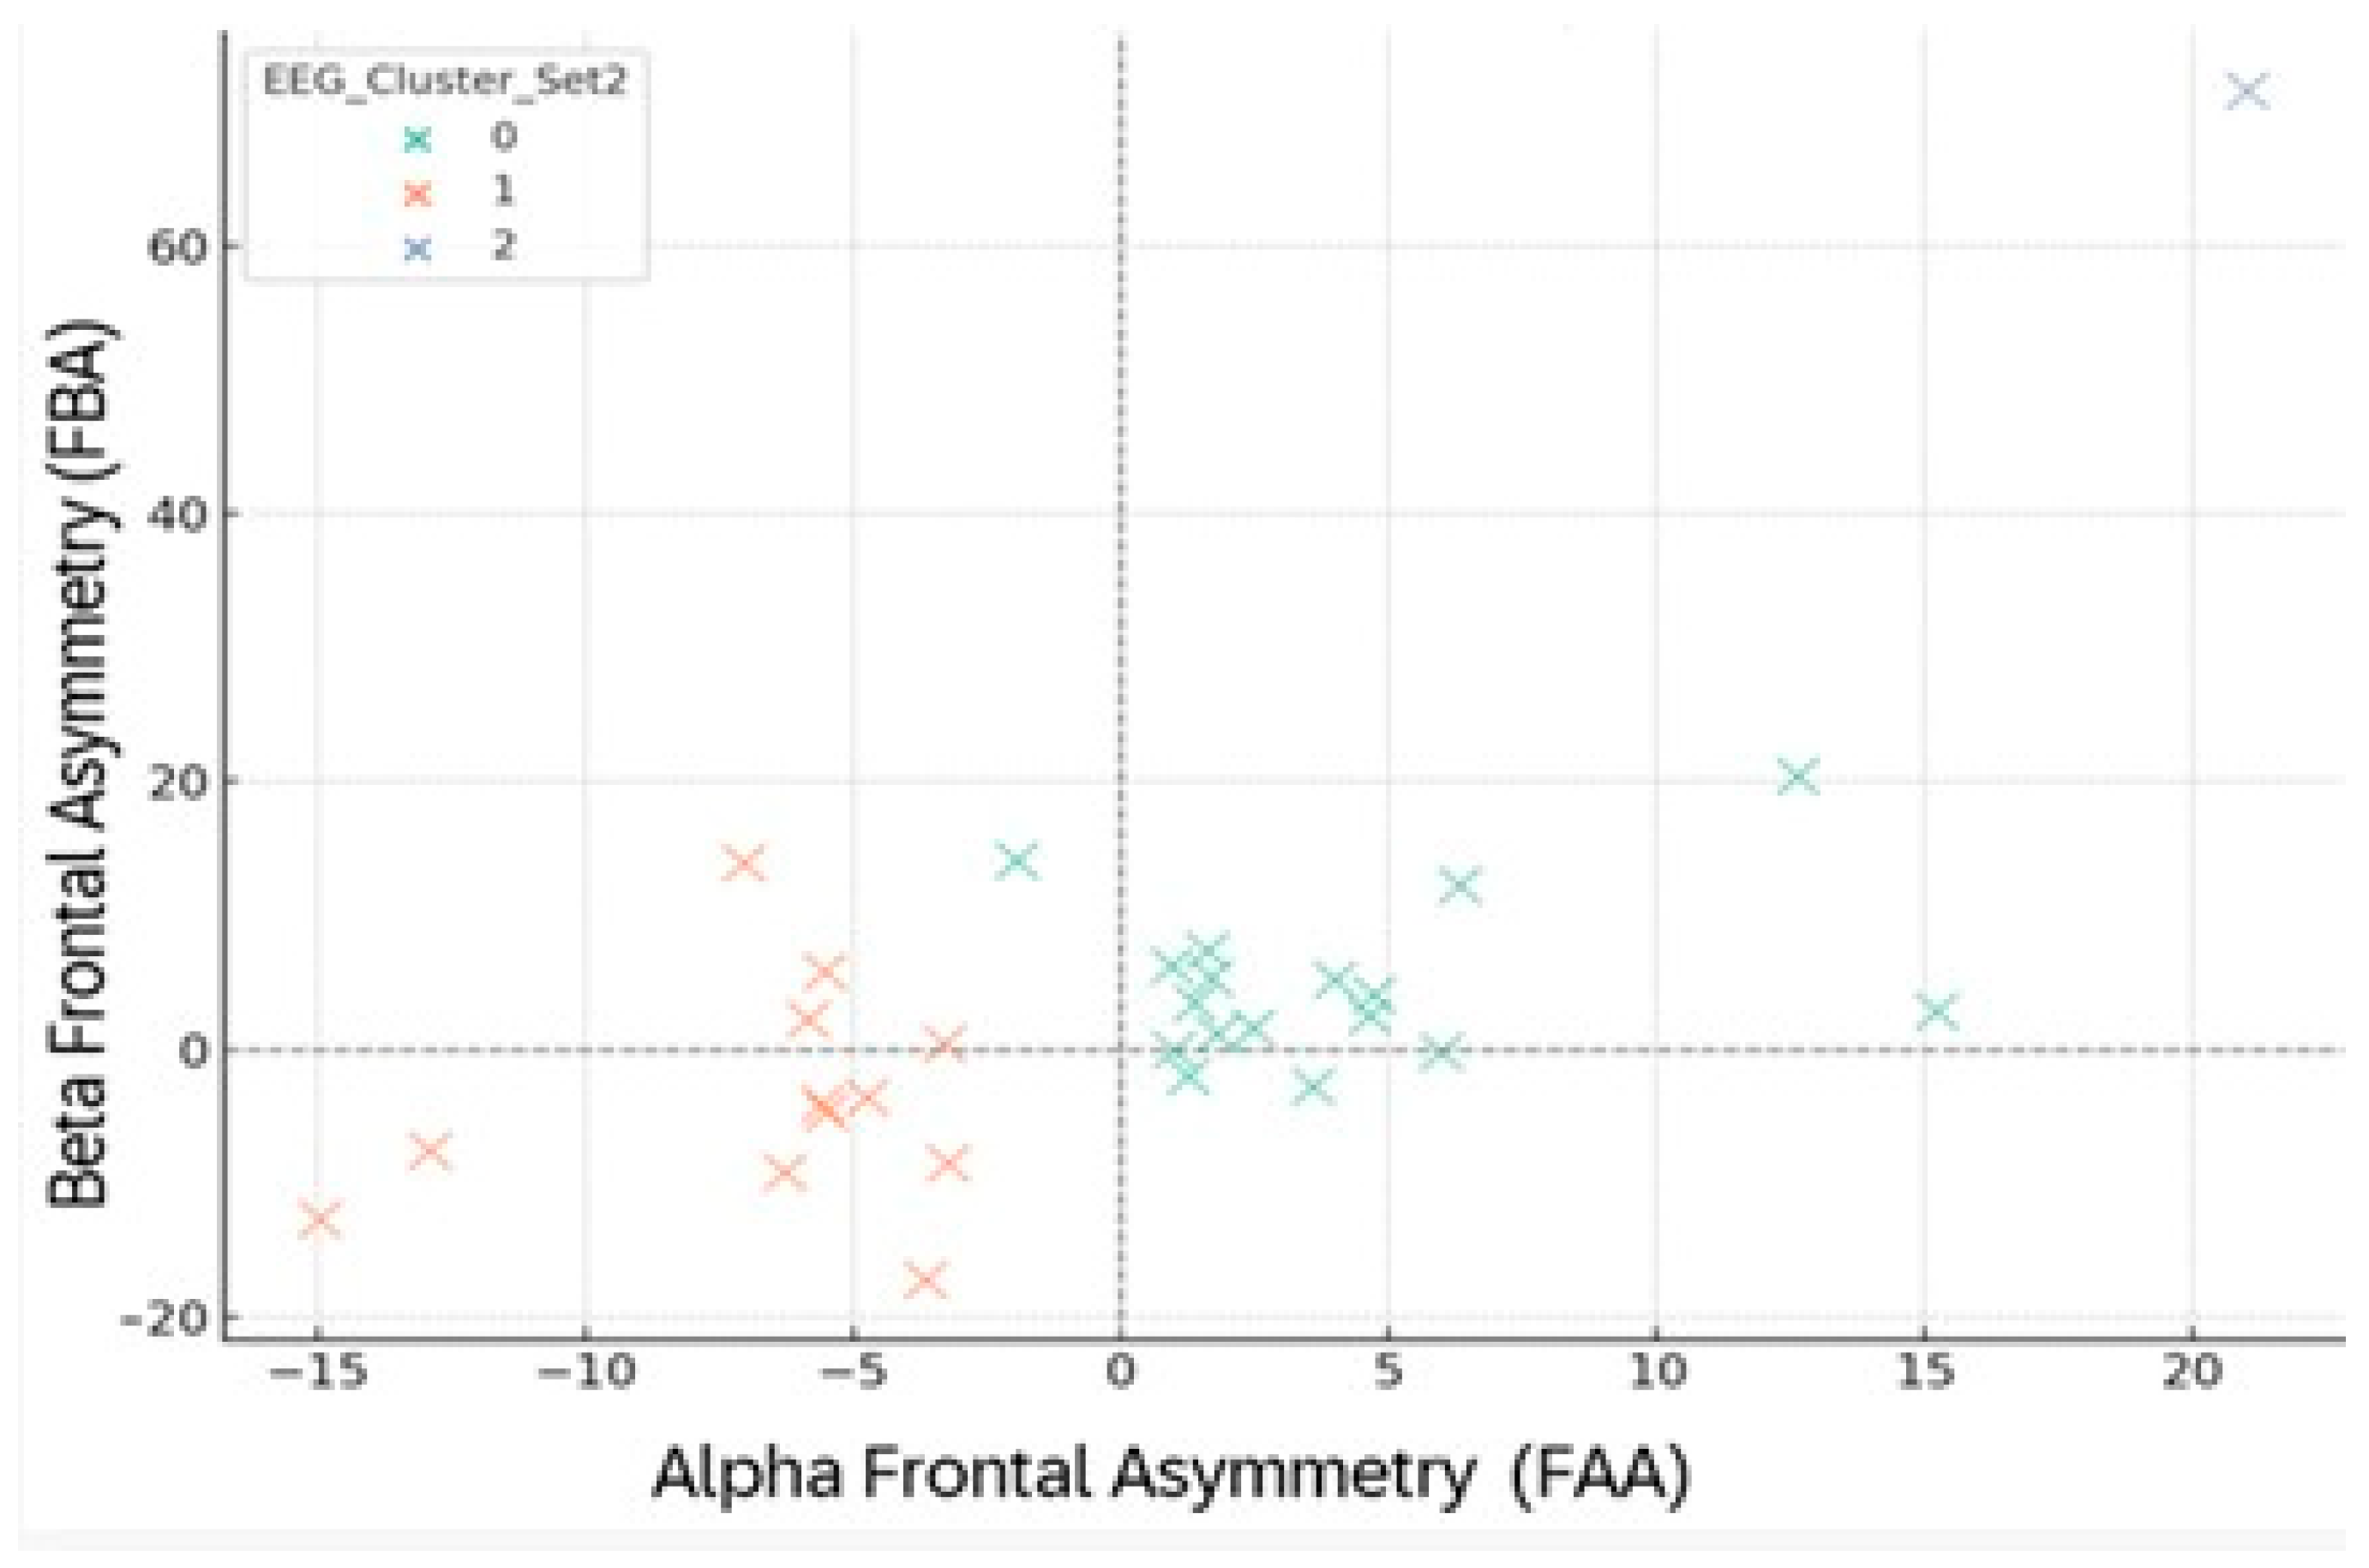
FAA–FBA clustering during negative images (Set 2). Colors: 0 = green, 1 = orange, 2 = blue. Dashed lines mark zero points on each axis.
Figure 15.
FAA–FBA clustering during negative images (Set 2). Colors: 0 = green, 1 = orange, 2 = blue. Dashed lines mark zero points on each axis.
Figure 16.
Two-dimensional representation of EEG clustering based on frontal Alpha (FAA) and Beta (FBA) asymmetry during the viewing of emotional images (Set 2). Each point represents a participant, color-coded according to EEG cluster membership (0—green, 1—orange, 2—blue). The axes indicate the mean FAA and FBA values, expressed in microvolts (μV). The dotted lines mark the zero reference thresholds, delineating the balance point between left and right hemispheric activation.
Table 1.
Pearson correlation coefficients (r) and p-values for psychological measures.
Table 1.
Pearson correlation coefficients (r) and p-values for psychological measures.
| Correlation | R | p |
|---|
| Distress ↔ PSS | 0.17 | 0.382 |
| Distress ↔ Machiavellianism | –0.22 | 0.240 |
| Distress ↔ Narcissism | –0.24 | 0.201 |
| Narcissism ↔ Psychopathy | 0.56 | 0.001 |
| Machiavellianism ↔ Narcissism | 0.55 | 0.001 |
Table 2.
Average demographic and psychological characteristics of participants by cluster (K-means analysis).
Table 2.
Average demographic and psychological characteristics of participants by cluster (K-means analysis).
| Cluster | Age | Mean | Distress | PSS | Machiavellianism | Narcissism
Psychopathy |
|---|
| 0 | 28.7 | 4.86 | 31.9 | 17.7 | 23.0 | 16.6 |
| 1 | 23.7 | 4.07 | 29.1 | 29.1 | 28.3 | 21.5 |
| 2 | 22.8 | 7.67 | 36.9 | 25.0 | 26.4 | 22.3 |
Table 3.
Mean changes in HR and HRV following presentation of neutral questions.
Table 3.
Mean changes in HR and HRV following presentation of neutral questions.
| Parameter | Baseline Mean | Post-Stimulus Mean | Mean Change | t | p |
|---|
| HR (bpm) | 85.20 | 90.23 | +5.03 bpm | 3.617 | 0.001 |
| HRV (ms) | 51.57 | 55.53 | +3.97 ms | 1.388 | 0.176 |
Table 4.
Mean changes in HR and HRV following presentation of deceptive responses.
Table 4.
Mean changes in HR and HRV following presentation of deceptive responses.
| Parameter | Baseline Mean | Post-Stimulus Mean | Mean Change | t | p |
|---|
| HR (bpm) | 89.03 | 88.00 | −1.03 bpm | −0.652 | 0.519 |
| HRV (ms) | 58.23 | 54.27 | −3.97 ms | −1.407 | 0.170 |
Table 5.
Mean changes in HR (ΔHR) and HRV (ΔHRV) across experimental conditions neutral questions (set 1) and deceptive responses (set 6), stratified by psychological clusters.
Table 5.
Mean changes in HR (ΔHR) and HRV (ΔHRV) across experimental conditions neutral questions (set 1) and deceptive responses (set 6), stratified by psychological clusters.
| Cluster | ΔHR1 | ΔHRV1 | ΔHR6 | ΔHRV6 |
|---|
| 0 | +9.86 | −2.86 | +1.29 | −5.00 |
| 1 | +3.07 | +5.50 | −2.64 | −4.14 |
| 2 | +4.33 | +6.89 | −0.33 | −2.89 |
Table 6.
Pearson correlations (r) between physiological changes (ΔHR, ΔHRV) and psychological traits across experimental conditions (1 and 6).
Table 6.
Pearson correlations (r) between physiological changes (ΔHR, ΔHRV) and psychological traits across experimental conditions (1 and 6).
| ΔParameter | Trait | R | p |
|---|
| ΔHR1 | Psychopathy | −0.39 | 0.0318 |
| ΔHR1 | Narcissism | −0.25 | 0.176 |
| ΔHRV6 | PSS | +0.20 | 0.287 |
| ΔHRV6 | Machiavellianism | −0.22 | 0.241 |
Table 7.
Mean changes in heart rate (HR) and HRV-derived stress score (Garmin HRV) following exposure to moral and ethical dilemma questions (Set 3).
Table 7.
Mean changes in heart rate (HR) and HRV-derived stress score (Garmin HRV) following exposure to moral and ethical dilemma questions (Set 3).
| Parameter | Baseline Mean | Post-Stimulus Mean | Mean Change | t | p |
|---|
| HR (bpm) | 87.93 | 90.77 | +2.83 | 1.576 | 0.126 |
| HRV Stress Score | 56.10 | 57.13 | +1.03 | 0.427 | 0.673 |
Table 8.
Mean changes in HR and HRV-derived stress score (Garmin HRV) following exposure to socially sensitive questions.
Table 8.
Mean changes in HR and HRV-derived stress score (Garmin HRV) following exposure to socially sensitive questions.
| Parameter | Baseline Mean | Post-Stimulus Mean | Mean Change | t | p |
|---|
| HR (bpm) | 86.77 | 87.83 | +1.07 | 1.068 | 0.294 |
| HRV Stress Score | 56.43 | 56.27 | −0.17 | −0.072 | 0.943 |
Table 9.
Mean changes in HR and HRV-derived stress score (Garmin HRV) following exposure to questions on Dark Triad traits.
Table 9.
Mean changes in HR and HRV-derived stress score (Garmin HRV) following exposure to questions on Dark Triad traits.
| Parameter | Baseline Mean | Post-Stimulus Mean | Mean Change | t | p |
|---|
| HR (bpm) | 86.40 | 90.60 | +4.20 | 3.401 | .002 |
| HRV Stress Score | 54.27 | 54.70 | +0.43 | 0.264 | .793 |
Table 10.
Comparative summary of mean HR and HRV-derived stress changes (Garmin HRV Stress Score) across the five stimulus sets.
Table 10.
Comparative summary of mean HR and HRV-derived stress changes (Garmin HRV Stress Score) across the five stimulus sets.
| Set | ΔHR (bpm) | p (HR) | ΔStress (Garmin) | p (Stress) |
|---|
| Neutral Questions | +5.03 | 0.001 | +3.97 | 0.176 |
| Personal History | +4.83 | 0.025 | −3.30 | 0.103 |
| Moral/Ethical Dilemmas | +2.83 | 0.126 | +1.03 | 0.673 |
| Social Image | +1.07 | 0.294 | −0.17 | 0.943 |
| Dark Triad Traits | +4.20 | 0.002 | +0.43 | 0.793 |
Table 11.
Mean changes in heart rate (ΔHR, bpm) and stress index (ΔStress, Garmin) across the five question sets, along with their corresponding p-values.
Table 11.
Mean changes in heart rate (ΔHR, bpm) and stress index (ΔStress, Garmin) across the five question sets, along with their corresponding p-values.
| Set | ΔHR (bpm) | p (HR) | ΔStress (Garmin) | p (Stress) |
|---|
| Set 1—Neutral Questions | +5.03 | 0.001 | +3.97 | 0.176 |
| Set 2—Personal History | +4.83 | 0.025 | −3.30 | 0.103 |
| Set 3—Moral/Ethical Dilemmas | +2.83 | 0.126 | +1.03 | 0.673 |
| Set 4—Social Image | +1.07 | 0.294 | −0.17 | 0.943 |
| Set 5—Dark Triad Traits | +4.20 | 0.002 | +0.43 | 0.793 |
Table 12.
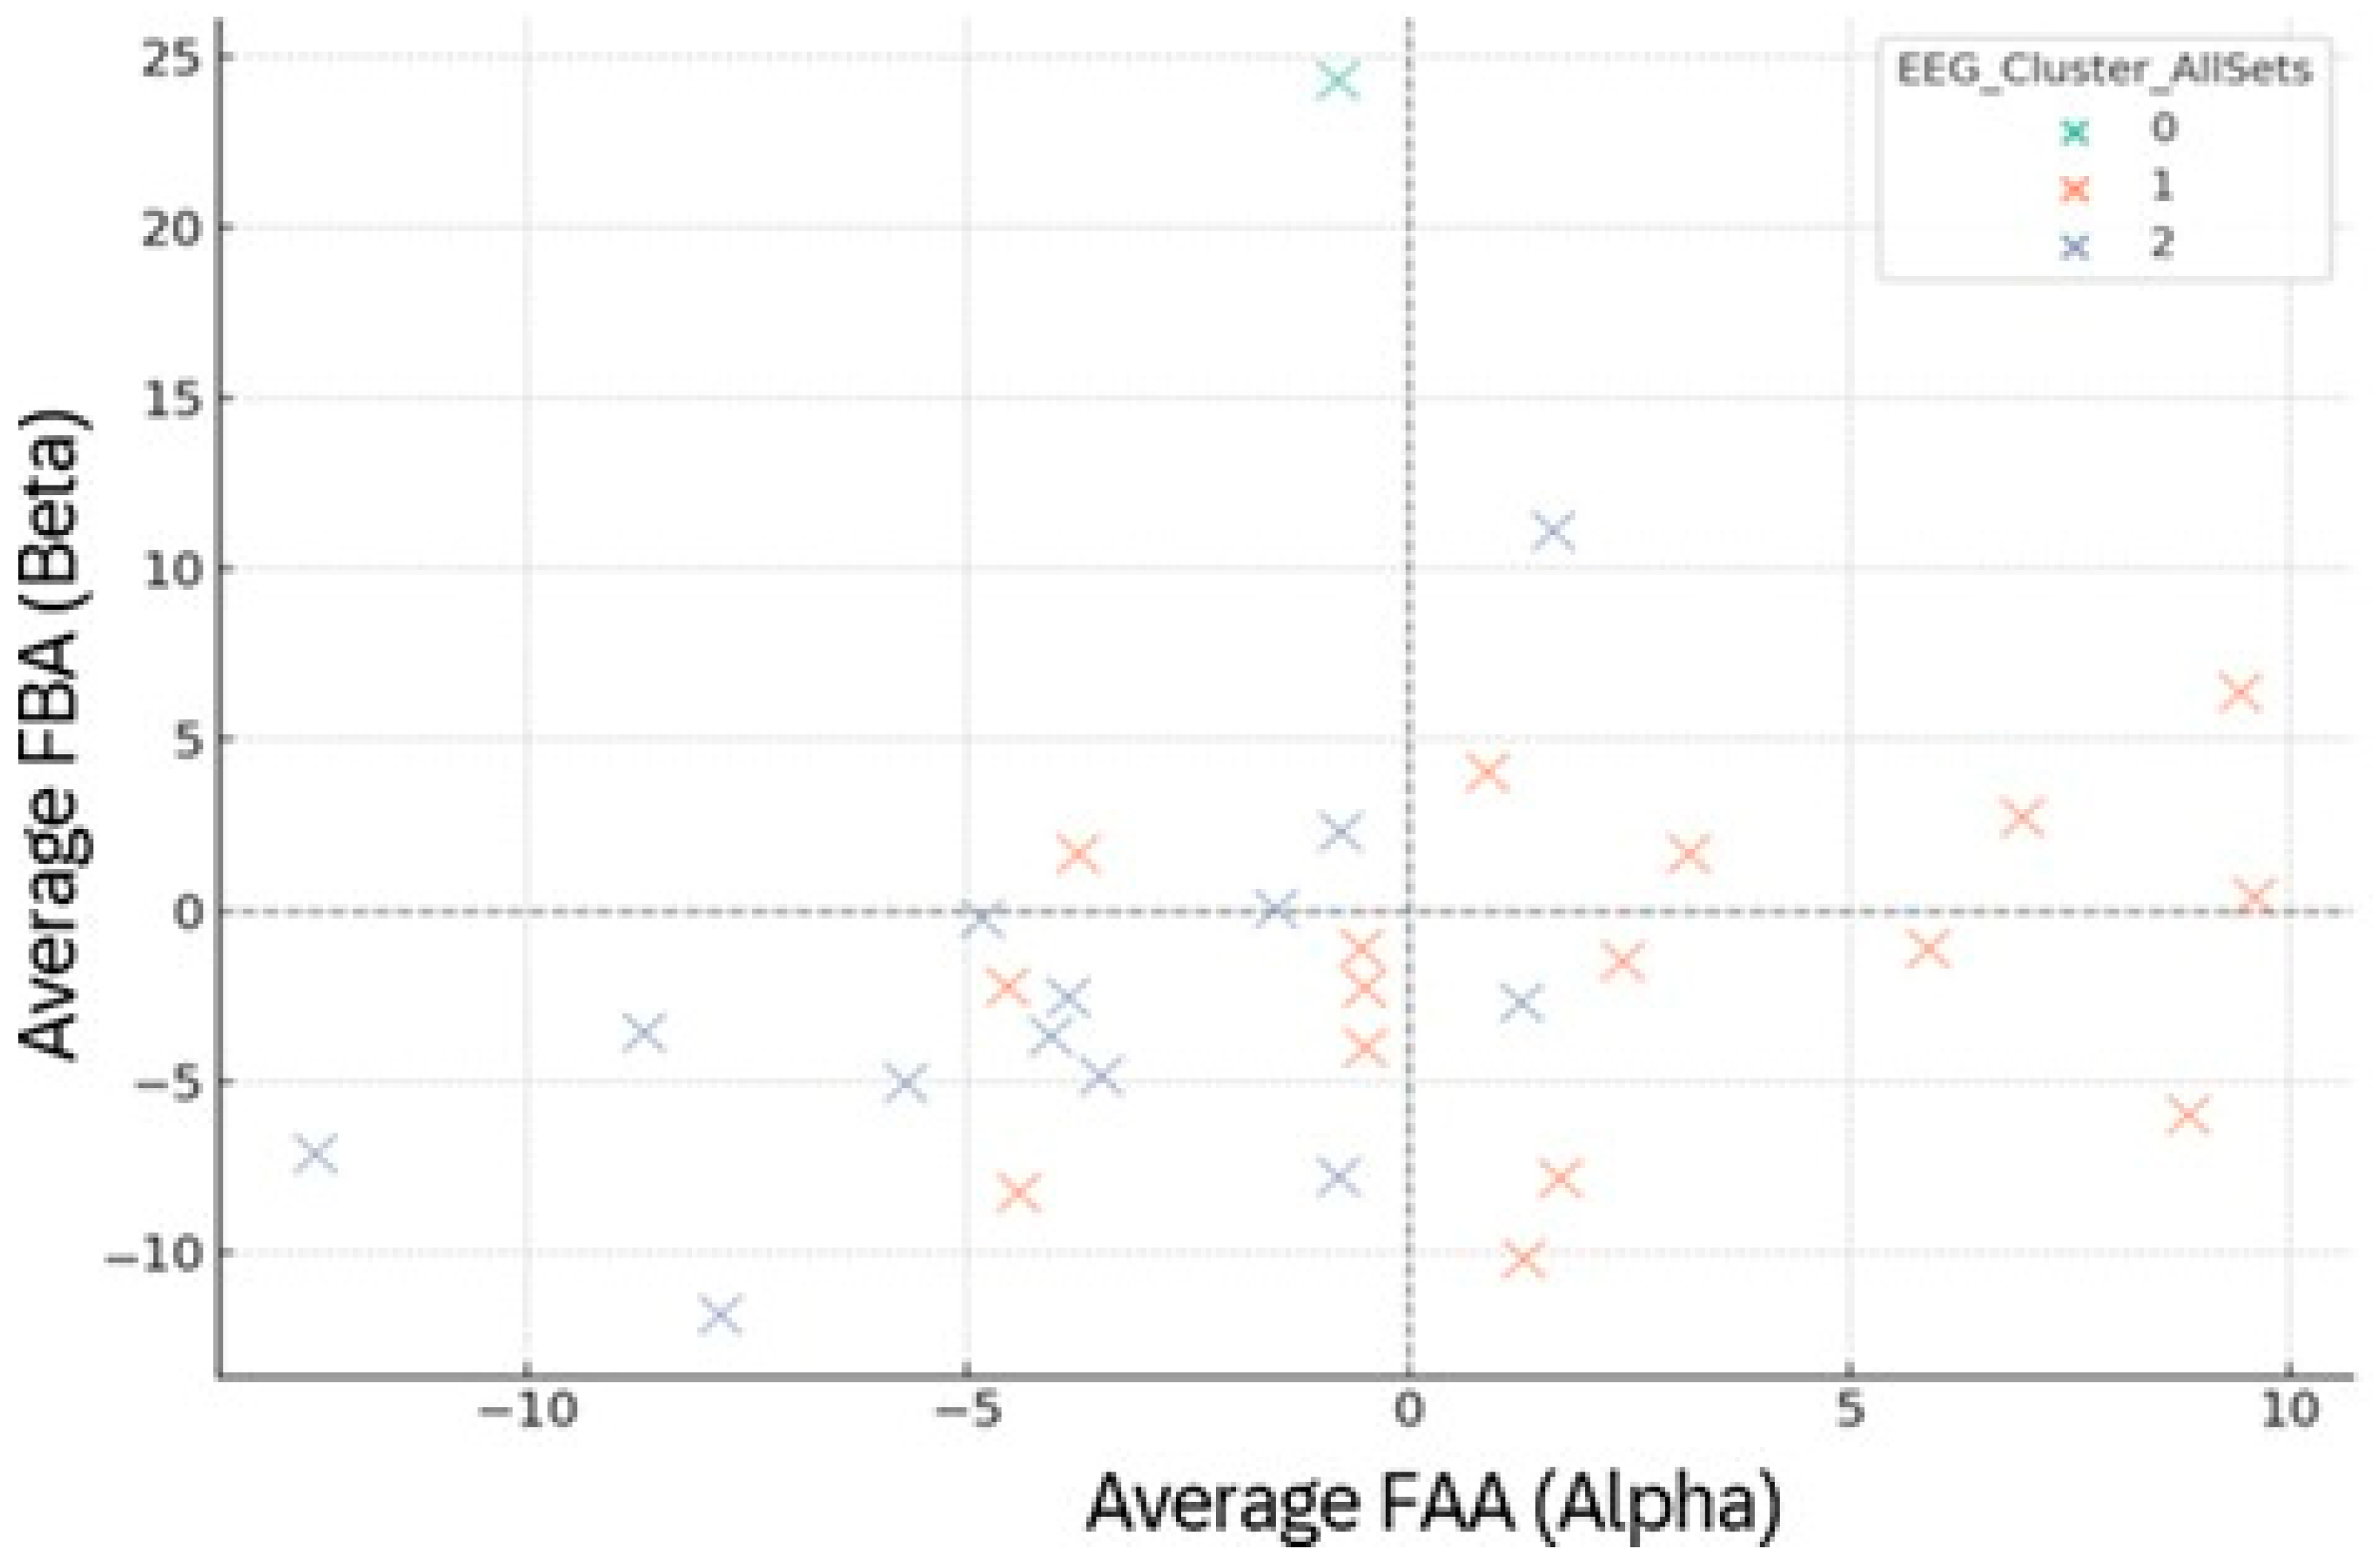
Aggregated physiological profile (ΔHR_total, ΔStress_total) for EEG clusters across all sets.
Table 12.
Aggregated physiological profile (ΔHR_total, ΔStress_total) for EEG clusters across all sets.
| EEG_Cluster_AllSets | ΔHR_Total (bpm) | ΔStress_Total |
|---|
| 0 | −9.00 | +15.00 |
| 1 | +2.88 | +9.12 |
| 2 | +6.92 | +6.08 |
Table 13.
Mean autonomic changes while viewing positive/neutral vs. negative emotional images.
Table 13.
Mean autonomic changes while viewing positive/neutral vs. negative emotional images.
| Set | ΔHR (bpm) | p (HR) | ΔStress | p (Stress) |
|---|
| Positive/Neutral | −4.50 | 0.04 | −12.07 | 0.001 |
| Emotional-Negative | −2.27 | 0.04 | +0.60 | 0.770 |
Table 14.
Pearson correlations between frontal asymmetry (FAA, FBA) and autonomic indices (ΔHR, ΔStress), pooled across sets.
Table 14.
Pearson correlations between frontal asymmetry (FAA, FBA) and autonomic indices (ΔHR, ΔStress), pooled across sets.
| Correlation | R |
|---|
| FAA vs. ΔHR | +0.19 |
| FAA vs. Δstress | −0.09 |
| FBA vs. ΔHR | +0.22 |
| FBA vs. Δstress | −0.11 |
Table 15.
Mean frontal asymmetry (μV) and autonomic change during positive/neutral images (Set 1).
Table 15.
Mean frontal asymmetry (μV) and autonomic change during positive/neutral images (Set 1).
| EEG Cluster | FAA (α, μV) | FBA (β, μV) | ΔHR (bpm) | ΔStress |
|---|
| Cluster 0 | −7.12 | −9.99 | +0.75 | −8.25 |
| Cluster 1 | +24.70 | +36.89 | +7.33 | −24.67 |
| Cluster 2 | +2.78 | +2.97 | −8.58 | −11.68 |
Table 16.
Correlations between frontal asymmetry (FAA, FBA) and autonomic change (ΔHR, ΔStress) during positive/neutral images (Set 1).
Table 16.
Correlations between frontal asymmetry (FAA, FBA) and autonomic change (ΔHR, ΔStress) during positive/neutral images (Set 1).
| Correlation | R |
|---|
| FAA vs. ΔHR | −0.24 |
| FAA vs. Δstress | −0.16 |
| FBA vs. ΔHR | +0.02 |
| FBA vs. Δstress | +0.23 |
Table 17.
Mean EEG asymmetry and autonomic change by EEG cluster during negative images (Set 2).
Table 17.
Mean EEG asymmetry and autonomic change by EEG cluster during negative images (Set 2).
| EEG Cluster | FAA (α, μV) | FBA (β, μV) | ΔHR (bpm) | ΔStress |
|---|
| Cluster 0 | +3.97 | +4.78 | −3.35 | −3.53 |
| Cluster 1 | −6.54 | −3.78 | −0.50 | +4.67 |
| Cluster 2 | +21.02 | +71.56 | −5.00 | +22.00 |
Table 18.
Transitions between EEG clusters from Set 1 (neutral) to Set 2 (emotional).
Table 18.
Transitions between EEG clusters from Set 1 (neutral) to Set 2 (emotional).
| Set-1 Cluster | Set-2 Cluster 0 | Set-2 Cluster 1 | Set-2 Cluster 2 |
|---|
| Cluster 0 | 14 | 12 | 0 |
| Cluster 1 | 0 | 0 | 1 |
| Cluster 2 | 3 | 0 | 0 |
