
EEG in Down Syndrome—A Review and Insights into Potential Neural Mechanisms


Abstract
1. Introduction
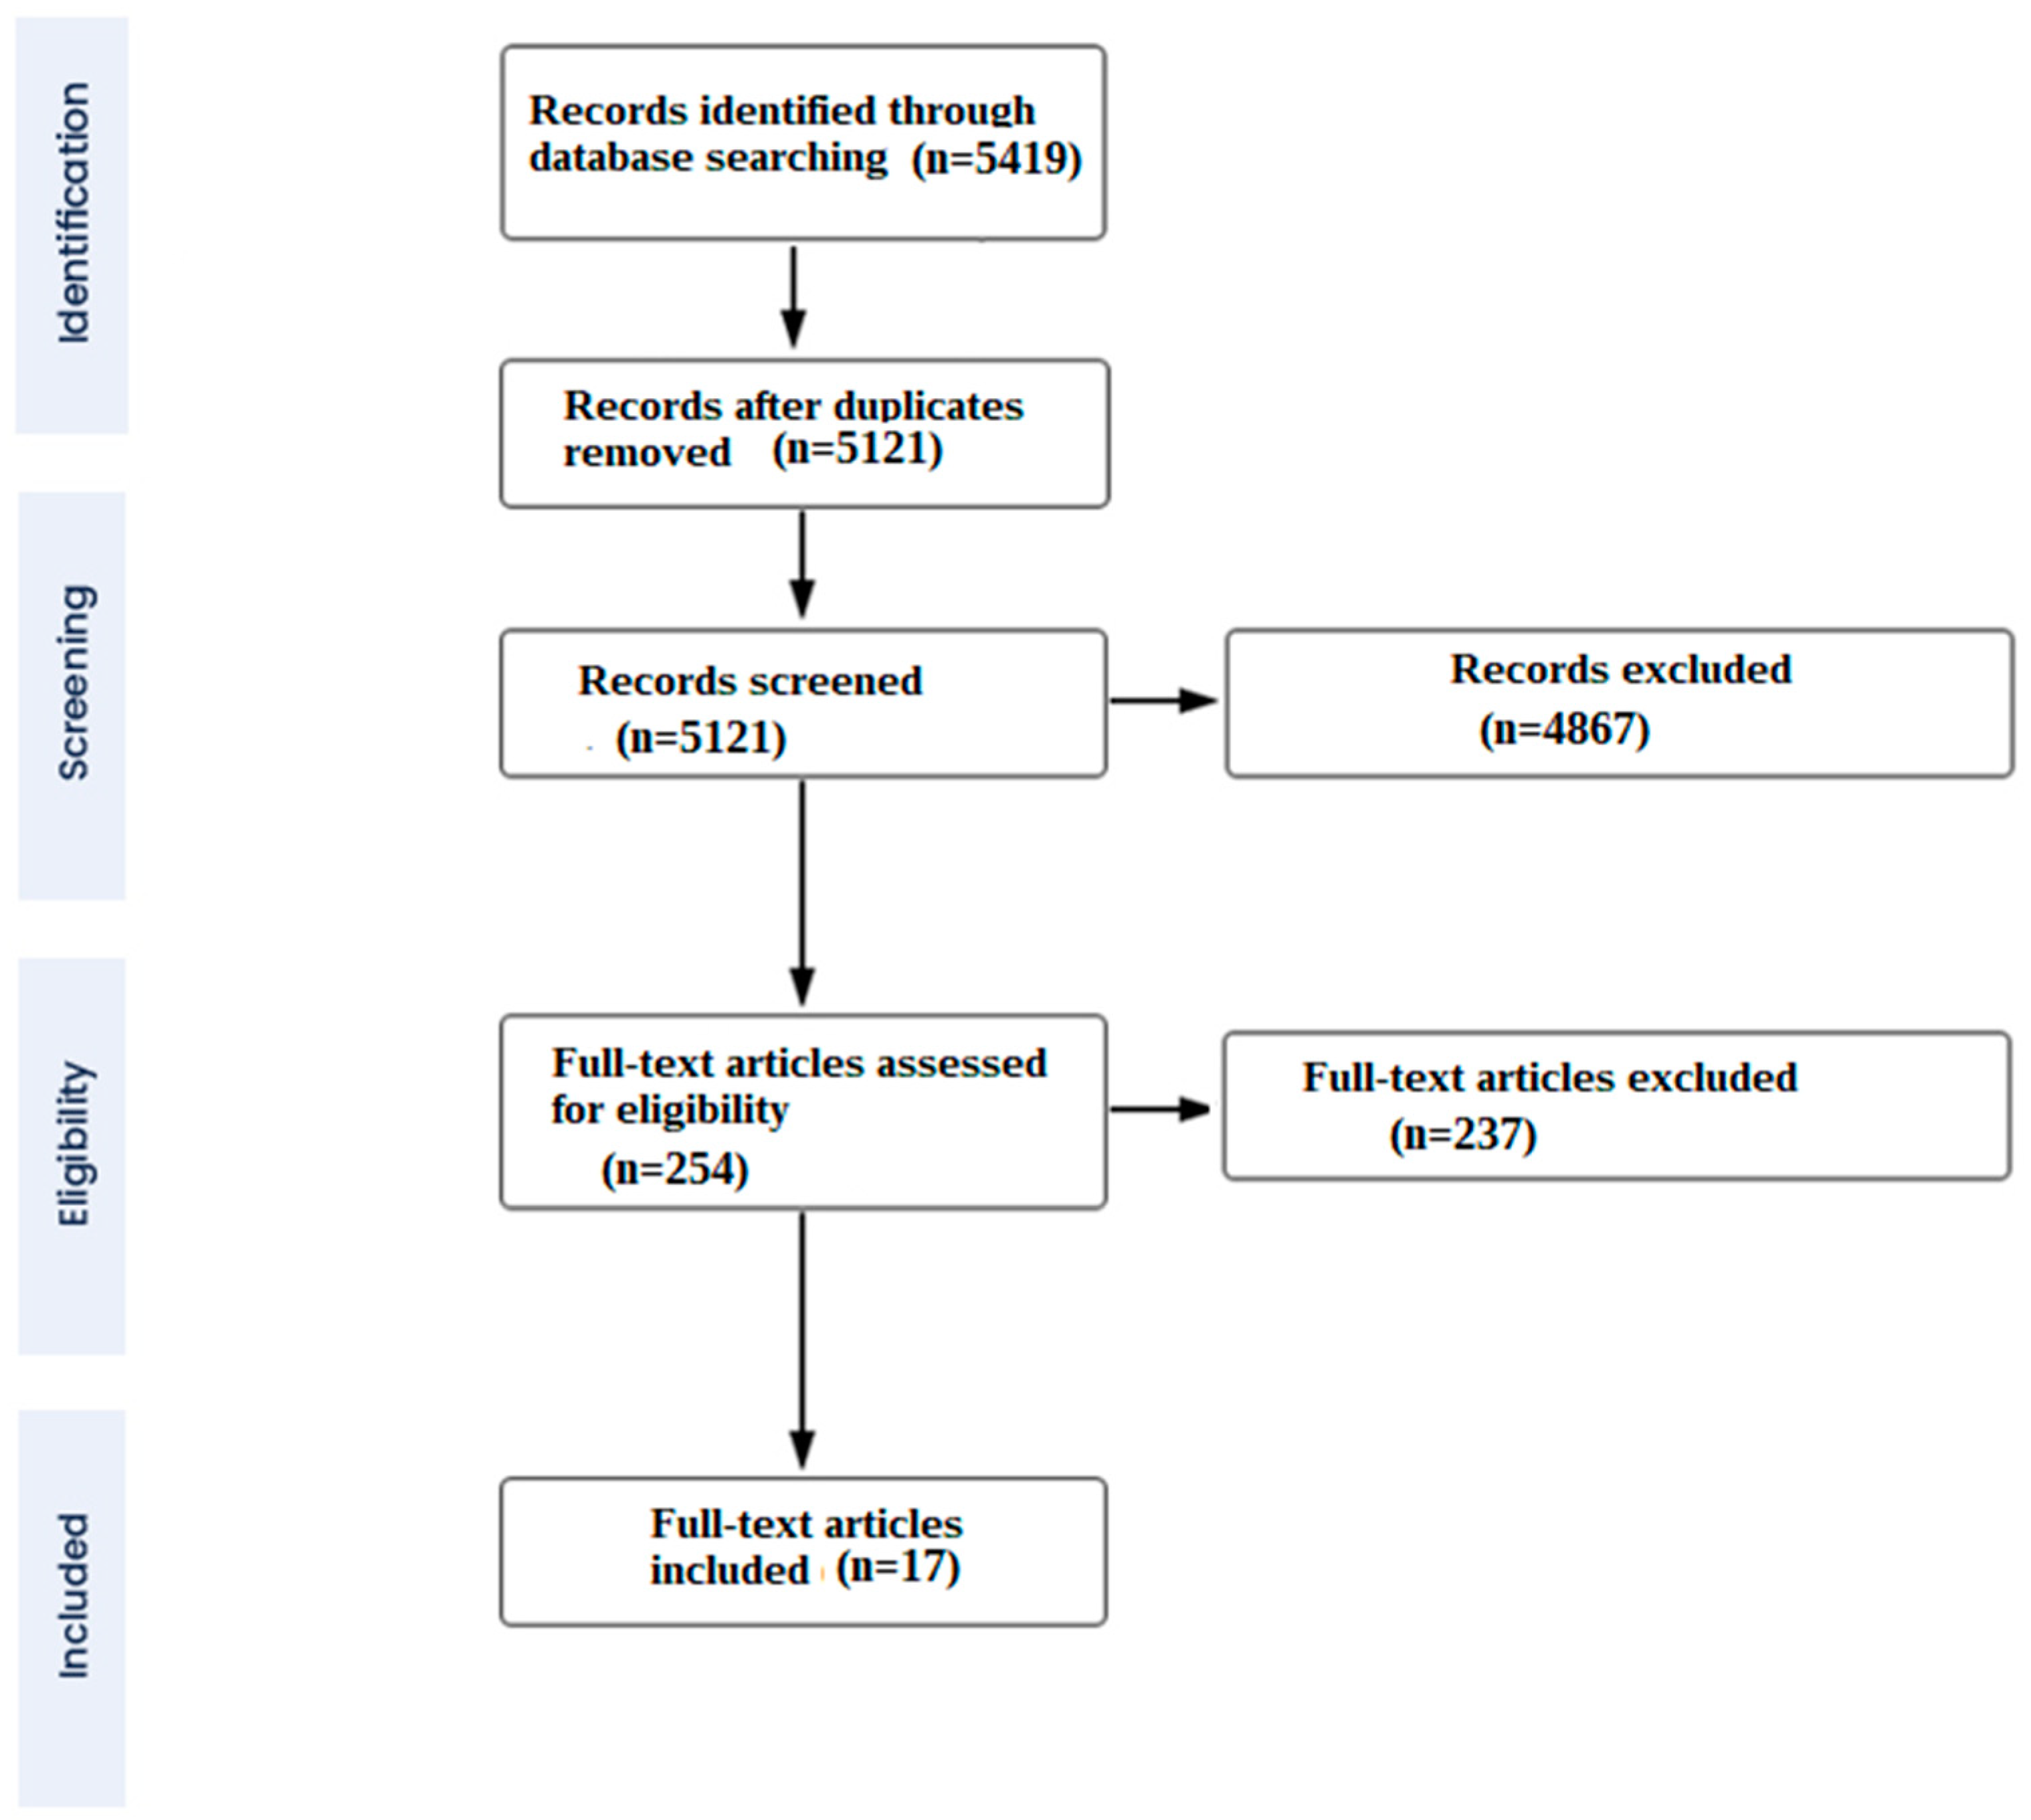
2. Methods
2.1. Data Sources and Search Strategy
2.2. Study Selection Criteria
3. Results
3.1. Summary and Outcomes of Included Studies
3.1.1. Longitudinal Studies
3.1.2. Non-Longitudinal Studies
4. Discussion
4.1. Interpretation of the Results of Consistent Findings Regarding Altered EEG Activity in Individuals with DS
4.1.1. Alpha Activity
4.1.2. Delta Activity
4.1.3. Theta Activity
4.2. Sources of Inconsistencies in Results and Prospects for Avoiding Them in Future Research
5. Conclusions
Author Contributions
Funding
Institutional Review Board Statement
Informed Consent Statement
Data Availability Statement
Acknowledgments
Conflicts of Interest
References
- Mégarbané, A.; Ravel, A.; Mircher, C.; Sturtz, F.; Grattau, Y.; Rethoré, M.O.; Delabar, J.M.; Mobley, W.C. The 50th anniversary of the discovery of trisomy 21: The past, present, and future of research and treatment of Down syndrome. Genet. Med. 2009, 11, 611–616. [Google Scholar] [CrossRef]
- Sherman, S.L.; Allen, E.G.; Bean, L.H.; Freeman, S.B. Epidemiology of Down syndrome. Ment. Retard. Dev. Disabil. Res. Rev. 2007, 13, 221–227. [Google Scholar] [CrossRef]
- Moorthie, S.; Blencowe, H.; Darlison, M.W.; Gibbons, S.; Lawn, J.E.; Mastroiacovo, P.; Morris, J.K.; Modell, B. Congenital Disorders Expert Group. Chromosomal disorders: Estimating baseline birth prevalence and pregnancy outcomes worldwide. J. Community Genet. 2018, 9, 377–386. [Google Scholar] [CrossRef]
- Lott, I.T.; Dierssen, M. Cognitive deficits and associated neurological complications in individuals with Down’s syndrome. Lancet Neurol. 2010, 9, 623–633. [Google Scholar] [CrossRef]
- Hasina, Z.; Wang, N.; Wang, C.C. Developmental Neuropathology and Neurodegeneration of Down Syndrome: Current Knowledge in Humans. Front. Cell Dev. Biol. 2022, 10, 877711. [Google Scholar] [CrossRef]
- Biasiucci, A.; Franceschiello, B.; Murray, M.M. Electroencephalography. Curr. Biol. 2019, 29, R80–R85. [Google Scholar] [CrossRef] [PubMed]
- Michel, C.M.; Murray, M.M. Towards the utilization of EEG as a brain imaging tool. Neuroimage 2012, 61, 371–385. [Google Scholar] [CrossRef] [PubMed]
- Fortea, J.; Zaman, S.H.; Hartley, S.; Rafii, M.S.; Head, E.; Carmona-Iragui, M. Alzheimer’s disease associated with Down syndrome: A genetic form of dementia. Lancet Neurol. 2021, 20, 930–942. [Google Scholar] [CrossRef] [PubMed]
- Livint Popa, L.; Dragos, H.; Pantelemon, C.; Verisezan Rosu, O.; Strilciuc, S. The Role of Quantitative EEG in the Diagnosis of Neuropsychiatric Disorders. J. Med. Life 2020, 13, 8–15. [Google Scholar] [CrossRef] [PubMed]
- Sinha, S.R.; Sullivan, L.; Sabau, D.; San-Juan, D.; Dombrowski, K.E.; Halford, J.J.; Hani, A.J.; Drislane, F.W.; Stecker, M.M. American Clinical Neurophysiology Society Guideline 1: Minimum Technical Requirements for Performing Clinical Electroencephalography. J. Clin. Neurophysiol. 2016, 33, 303–307. [Google Scholar] [CrossRef] [PubMed]
- Gunnarson, S. Electro-encephalographic examinations of imbeciles; regarding the alpha frequency in spastics and mongoloid idiots. Acta Paediatr. 1945, 32, 426–434. [Google Scholar] [CrossRef]
- Vergani, O.; Aldeghi, E. Indagini elettroencefalografiche nella frenastenia mongoloide [EEG findings in mongoloid phrenasthenia]. Minerva Pediatr. 1958, 10, 1378–1383. [Google Scholar]
- Beley, A.; Sevestre, P.; Lecuyer, R.J.; Leroy, C. Contribution to the EEG of mongoloids. Rev. Neurol. 1959, 101, 457–459. [Google Scholar] [PubMed]
- Devinsky, O.; Sato, S.; Conwit, R.A.; Schapiro, M.B. Relation of EEG alpha background to cognitive function, brain atrophy, and cerebral metabolism in Down’s syndrome: Age-specific changes. Arch. Neurol. 1990, 47, 58–62. [Google Scholar] [CrossRef] [PubMed]
- Partanen, J.; Soininen, H.; Könönen, M.; Kilpeläinen, R.; Helkala, E.L.; Sr, P.R. EEG reactivity correlates with neuropsychological test scores in down’s syndrome. Acta Neurol. Scand. 1996, 94, 242–246. [Google Scholar] [CrossRef] [PubMed]
- Babiloni, C.; Albertini, G.; Onorati, P.; Vecchio, F.; Buffo, P.; Sarà, M.; Condoluci, C.; Pistoia, F.; Carducci, F.; Rossini, P.M. Inter-hemispheric functional coupling of eyes-closed resting EEG rhythms in adolescents with down syndrome. Clin. Neurophysiol. 2009, 120, 1619–1627. [Google Scholar] [CrossRef] [PubMed]
- Babiloni, C.; Albertini, G.; Onorati, P.; Muratori, C.; Buffo, P.; Condoluci, C.; Sarà, M.; Pistoia, F.; Vecchio, F.; Rossini, P.M. Cortical sources of EEG rhythms are abnormal in down syndrome. Clin. Neurophysiol. 2010, 121, 1205–1212. [Google Scholar] [CrossRef] [PubMed]
- Schmid, R.G.; Sadowsky, K.; Weinmann, H.M.; Tirsch, W.S.; Pöppl, S.J. Z-transformed EEG power spectra of children with down syndrome vs a control group. Neuropediatrics 1985, 16, 218–224. [Google Scholar] [CrossRef]
- Ono, Y. EEG changes with aging in adults with down syndrome. Psychiatry Clin. Neurosci. 1993, 47, 75–84. [Google Scholar] [CrossRef]
- Soininen, H.; Partanen, J.; Jousma, V.; Helkala, E.L.; Vanhanen, M.; Majuri, S.; Kaski, M.; Hartikainen, P.; Riekkinen Sr, P. Age-related cognitive decline and electroencephalogram slowing in down’s syndrome as a model of Alzheimer’s disease. Neuroscience 1993, 53, 57–63. [Google Scholar] [CrossRef]
- Murata, T.; Koshino, Y.; Omori, M.; Murata, I.; Nishio, M.; Horie, T.; Kiminor, I. Quantitative EEG study on premature aging in adult down’s syndrome. Biol. Psychiatry 1994, 35, 422–425. [Google Scholar] [CrossRef] [PubMed]
- Katada, A.; Hasegawa, S.; Ohira, D.; Kumagai, T.; Harashima, T.; Ozaki, H.; Suzuki, H. On chronological changes in the basic EEG rhythm in persons with down syndrome–with special reference to slowing of alpha waves. Brain Dev. 2000, 22, 224–229. [Google Scholar] [CrossRef]
- Hamburg, S.; Bush, D.; Strydom, A.; Startin, C.M. Comparison of resting-state EEG between adults with Down syndrome and typically developing controls. J. Neurodev. Disord. 2021, 13, 48. [Google Scholar] [CrossRef] [PubMed]
- Politoff, A.L.; Stadter, R.P.; Monson, N.; Hass, P. Cognition-related EEG abnormalities in nondemented Down syndrome subjects. Dementia 1996, 7, 69–75. [Google Scholar] [CrossRef] [PubMed]
- Salamy, A.; Alvarez, W.; Peeke, H.V. Neurometric evaluation in Down syndrome individuals: Possible implications for dual diagnosis. Brain Dysfunct. 1990, 3, 50–57. [Google Scholar]
- Ono, Y.; Yoshida, H.; Momotani, Y.; Yoshimasu, F.; Higashi, Y. Age-related changes in occipital alpha rhythm of adults with Down syndrome. Jpn. J. Psychiatry Neurol. 1992, 46, 659–664. [Google Scholar] [CrossRef]
- Locatelli, T.; Fornara, C.; Medaglini, S.; Alberoni, M.; Franceschi, M.; Rinaldi, L.; Comola, M.; Leocani, L.; Canal, N.; Comi, G. Quantified electroencephalogram in adult patients with Down’s syndrome. Dev. Brain Dysfunct. 1996, 9, 215–223. [Google Scholar]
- Medaglini, S.; Locatelli, T.; Fornara, C.; Alberoni, M.; Comola, M.; Franceschi, M.; Comi, G. P300 and EEG mapping in Down’s syndrome. J. Psychophysiol. 1997, 11, 48–58. [Google Scholar]
- Velikova, S.; Magnani, G.; Arcari, C.; Falautano, M.; Franceschi, M.; Comi, G.; Leocani, L. Cognitive impairment and EEG background activity in adults with Down’s syndrome: A topographic study. Hum. Brain Mapp. 2011, 32, 716–729. [Google Scholar] [CrossRef] [PubMed]
- Hamburg, S.; Rosch, R.; Startin, C.M.; Friston, K.J.; Strydom, A. Dynamic Causal Modeling of the Relationship between Cognition and Theta-alpha Oscillations in Adults with Down Syndrome. Cereb. Cortex. 2019, 29, 2279–2290. [Google Scholar] [CrossRef] [PubMed]
- Cantero, J.L.; Atienza, M.; Salas, R.M. Human alpha oscillations in wakefulness, drowsiness period, and REM sleep: Different electroencephalographic phenomena within the alpha band. Neurophysiol. Clin. 2002, 32, 54–71. [Google Scholar] [CrossRef] [PubMed]
- Foxe, J.J.; Snyder, A.C. The Role of Alpha-Band Brain Oscillations as a Sensory Suppression Mechanism during Selective Attention. Front. Psychol. 2011, 2, 154. [Google Scholar] [CrossRef] [PubMed]
- Schmidt, R.; Herrojo Ruiz, M.; Kilavik, B.E.; Lundqvist, M.; Starr, P.A.; Aron, A.R. Beta Oscillations in Working Memory, Executive Control of Movement and Thought, and Sensorimotor Function. J. Neurosci. 2019, 39, 8231–8238. [Google Scholar] [CrossRef] [PubMed]
- Sitaram, R.; Ros, T.; Stoeckel, L.; Haller, S.; Scharnowski, F.; Lewis-Peacock, J.; Weiskopf, N.; Blefari, M.L.; Rana, M.; Oblak, E.; et al. Closed-loop brain training: The science of neurofeedback. Nat. Rev. Neurosci. 2017, 18, 86–100. [Google Scholar] [CrossRef] [PubMed]
- Surmeli, T.; Ertem, A. Post WISC-R and TOVA improvement with QEEG guided neurofeedback training in mentally retarded: A clinical case series of behavioral problems. Clin. EEG Neurosci. 2010, 41, 32–41. [Google Scholar] [CrossRef] [PubMed]
- Ekstein, S.; Glick, B.; Weill, M.; Kay, B.; Berger, I. Down Syndrome and Attention-Deficit/Hyperactivity Disorder (ADHD). J. Child. Neurol. 2011, 26, 1290–1295. [Google Scholar] [CrossRef] [PubMed]
- Scheijbeler, E.P.; de Haan, W.; Stam, C.J.; Twisk, J.W.; Gouw, A.A. Longitudinal resting-state EEG in amyloid-positive patients along the Alzheimer’s disease continuum: Considerations for clinical trials. Alzheimer’s Res. Ther. 2023, 15, 182. [Google Scholar] [CrossRef]
- Gaubert, S.; Raimondo, F.; Houot, M.; Corsi, M.C.; Naccache, L.; Diego Sitt, J.; Hermann, B.; Oudiette, D.; Gagliardi, G.; Habert, M.O.; et al. Alzheimer’s Disease Neuroimaging Initiative. EEG evidence of compensatory mechanisms in preclinical Alzheimer’s disease. Brain 2019, 142, 2096–2112. [Google Scholar] [CrossRef]
- Attar, E.T. Review of electroencephalography signals approaches for mental stress assessment. Neurosciences 2022, 27, 209–215. [Google Scholar] [CrossRef]
- Azabou, E.; Navarro, V.; Kubis, N.; Gavaret, M.; Heming, N.; Cariou, A. Value and mechanisms of EEG reactivity in the prognosis of patients with impaired consciousness: A systematic review. Crit. Care 2018, 22, 184. [Google Scholar] [CrossRef]
- Rivelli, A.; Fitzpatrick, V.; Chaudhari, S.; Chicoine, L.; Jia, G.; Rzhetsky, A.; Chicoine, B. Prevalence of Mental Health Conditions Among 6078 Individuals with Down Syndrome in the United States. J. Patient Cent. Res. Rev. 2022, 9, 58–63. [Google Scholar] [CrossRef]
- Hohaia, W.; Saurels, B.W.; Johnston, A.; Yarrow, K.; Arnold, D.H. Occipital alpha-band brain waves when the eyes are closed are shaped by ongoing visual processes. Sci. Rep. 2022, 12, 1194. [Google Scholar] [CrossRef]
- Fodale, V.; Mafrica, F.; Caminiti, V.; Grasso, G. The cholinergic system in Down’s syndrome. J. Intellect. Disabil. 2006, 10, 261–274. [Google Scholar] [CrossRef] [PubMed]
- Lejko, N.; Larabi, D.I.; Herrmann, C.S.; Aleman, A.; Ćurčić-Blake, B. Alpha Power and Functional Connectivity in Cognitive Decline: A Systematic Review and Meta-Analysis. J. Alzheimer’s Dis. 2020, 78, 1047–1088. [Google Scholar] [CrossRef] [PubMed]
- Sauseng, P.; Klimesch, W.; Gerloff, C.; Hummel, F.C. Spontaneous locally restricted EEG alpha activity determines cortical excitability in the motor cortex. Neuropsychologia 2009, 47, 284–288. [Google Scholar] [CrossRef] [PubMed]
- Goldman, R.I.; Stern, J.M.; Engel, J., Jr.; Cohen, M.S. Simultaneous EEG and fMRI of the alpha rhythm. Neuroreport 2002, 13, 2487–2492. [Google Scholar] [CrossRef] [PubMed]
- Klimesch, W. Alpha-band oscillations, attention, and controlled access to stored information. Trends Cogn. Sci. 2012, 16, 606–617. [Google Scholar] [CrossRef]
- Sadaghiani, S.; Kleinschmidt, A. Brain networks and α-oscillations: Structural and functional foundations of cognitive control. Trends Cogn. Sci. 2016, 20, 805–817. [Google Scholar] [CrossRef]
- Hindriks, R.; van Putten, M.J. Thalamo-cortical mechanisms underlying changes in amplitude and frequency of human alpha oscillations. Neuroimage 2013, 70, 150–163. [Google Scholar] [CrossRef]
- Suffczynski, P.; Kalitzin, S.; Pfurtscheller, G.; Da Silva, F.L. Computational model of thalamo-cortical networks: Dynamical control of alpha rhythms in relation to focal attention. Int. J. Psychophysiol. 2001, 43, 25–40. [Google Scholar] [CrossRef]
- Lopes da Silva, F.H.; Vos, J.E.; Mooibroek, J.; Rotterdam, A.V. Relative contributions of intracortical and thalamo-cortical processes in the generation of alpha rhythms, revealed by partial coherence analysis. Electroencephalogr. Clin. Neurophysiol. 1980, 50, 449–456. [Google Scholar] [CrossRef]
- Eckart, C.; Woźniak-Kwaśniewska, A.; Herweg, N.A.; Fuentemilla, L.; Bunzeck, N. Acetylcholine modulates human working memory and subsequent familiarity based recognition via alpha oscillations. Neuroimage 2016, 137, 61–69. [Google Scholar] [CrossRef]
- Lörincz, M.L.; Crunelli, V.; Hughes, S.W. Cellular dynamics of cholinergically induced α (8–13 Hz) rhythms in sensory thalamic nuclei In Vitro. J. Neurosci. 2008, 28, 660–671. [Google Scholar] [CrossRef]
- Vijayan, S.; Kopell, N.J. Thalamic model of awake alpha oscillations and implications for stimulus processing. Proc. Natl. Acad. Sci. USA 2012, 109, 18553–18558. [Google Scholar] [CrossRef]
- Fogelson, N.; Kogan, E.; Korczyn, A.D.; Giladi, N.; Shabtai, H.; Neufeld, M.Y. Effects of rivastigmine on the quantitative EEG in demented Parkinsonian patients. Acta Neurol. Scand. 2003, 107, 252–255. [Google Scholar] [CrossRef]
- Bosboom, J.L.; Stoffers, D.; Stam, C.J.; Berendse, H.W.; Wolters, E.C. Cholinergic modulation of MEG resting-state oscillatory activity in Parkinson’s disease related dementia. Clin. Neurophysiol. 2009, 120, 910–915. [Google Scholar] [CrossRef] [PubMed]
- Babiloni, C.; Del Percio, C.; Bordet, R.; Bourriez, J.L.; Bentivoglio, M.; Payoux, P.; Derambure, P.; Dix, S.; Infarinato, F.; Lizio, R.; et al. Effects of acetylcholinesterase inhibitors and memantine on resting-state electroencephalographic rhythms in Alzheimer’s disease patients. Clin. Neurophysiol. 2013, 124, 837–850. [Google Scholar] [CrossRef] [PubMed]
- Strydom, A.; Coppus, A.; Blesa, R.; Danek, A.; Fortea, J.; Hardy, J.; Levin, J.; Nuebling, G.; Rebillat, A.S.; Ritchie, C.; et al. Alzheimer’s disease in Down syndrome: An overlooked population for prevention trials. Alzheimer’s Dement. 2018, 4, 703–713. [Google Scholar] [CrossRef]
- Eady, N.; Sheehan, R.; Rantell, K.; Sinai, A.; Bernal, J.; Bohnen, I.; Bonell, S.; Courtenay, K.; Dodd, K.; Gazizova, D.; et al. Impact of cholinesterase inhibitors or memantine on survival in adults with Down syndrome and dementia: Clinical cohort study. Br. J. Psychiatry 2018, 212, 155–160. [Google Scholar] [CrossRef] [PubMed]
- Alkire, M.T.; Miller, J. General anesthesia and the neural correlates of consciousness. Prog. Brain Res. 2005, 150, 229–597. [Google Scholar]
- Uygun, D.S.; Basheer, R. Circuits and components of delta wave regulation. Brain Res. Bull. 2022, 188, 223–232. [Google Scholar] [CrossRef]
- McCormick, D.A. GABA as an inhibitory neurotransmitter in human cerebral cortex. J. Neurophysiol. 1989, 62, 1018–1027. [Google Scholar] [CrossRef]
- Mesbah-Oskui, R.L.; Orser, B.A.; Horner, R.L. Thalamic δ-subunit containing GABAA receptors promote electrocortical signatures of deep non-REM sleep but do not mediate the effects of etomidate at the thalamus in vivo. J. Neurosci. 2014, 34, 12253–12266. [Google Scholar] [CrossRef]
- Bartesaghi, R. Brain circuit pathology in Down syndrome: From neurons to neural networks. Rev. Neurosci. 2022, 34, 365–423. [Google Scholar] [CrossRef]
- Contestabile, A.; Magara, S.; Cancedda, L. The GABAergic Hypothesis for Cognitive Disabilities in Down Syndrome. Front. Cell. Neurosci. 2017, 11, 54. [Google Scholar] [CrossRef] [PubMed]
- Klein, J.A.; Haydar, T.F. Neurodevelopment in Down syndrome: Concordance in humans and models. Front. Cell. Neurosci. 2022, 16, 941855. [Google Scholar] [CrossRef] [PubMed]
- Nuñez, A.; Buño, W. The Theta Rhythm of the Hippocampus: From Neuronal and Circuit Mechanisms to Behavior. Front. Cell. Neurosci. 2021, 15, 649262. [Google Scholar] [CrossRef]
- Kowalczyk, T.; Bocian, R.; Konopacki, J. The generation of theta rhythm in hippocampal formation maintained in vitro. Eur. J. Neurosci. 2013, 37, 679–699. [Google Scholar] [CrossRef] [PubMed]
- Kowalczyk, T.; Caban, B.; Bocian, R. Theta rhythm recorded in the hippocampal formation in vitro. Postepy Hig. Med. Dosw. 2013, 15, 617–630. [Google Scholar] [CrossRef]
- Yamaguchi, Y. A theory of hippocampal memory based on theta phase precession. Biol. Cybern. 2003, 89, 1–9. [Google Scholar] [CrossRef] [PubMed]
- Karakaş, S. A review of theta oscillation and its functional correlates. Int. J. Psychophysiol. 2020, 157, 82–99. [Google Scholar] [CrossRef]
- Herweg, N.A.; Solomon, E.A.; Kahana, M.J. Theta Oscillations in Human Memory. Trends Cogn. Sci. 2020, 24, 208–227. [Google Scholar] [CrossRef] [PubMed]
- Cramer, N.; Galdzicki, Z. From abnormal hippocampal synaptic plasticity in down syndrome mouse models to cognitive disability in down syndrome. Neural Plast. 2012, 2012, 101542. [Google Scholar] [CrossRef] [PubMed]
- Klimesch, W. EEG alpha and theta oscillations reflect cognitive and memory performance: A review and analysis. Brain Res. Rev. 1999, 29, 169–195. [Google Scholar] [CrossRef] [PubMed]
- Grieco, J.; Pulsifer, M.; Seligsohn, K.; Skotko, B.; Schwartz, A. Down syndrome: Cognitive and behavioral functioning across the lifespan. Am. J. Med. Genet. C Semin. Med. Genet. 2015, 169, 135–149. [Google Scholar] [CrossRef]
- Konopacki, J.; Gołebiewski, H.; Eckersdorf, B.; Kowalczyk, T.; Bocian, R. In vitro recorded theta-like activity in the limbic cortex: Comparison with spontaneous theta and epileptiform discharges. Acta Neurobiol. Exp. 2000, 60, 67–85. [Google Scholar] [CrossRef]
- Homan, R.W.; Herman, J.; Purdy, P. Cerebral location of international 10–20 system electrode placement. Electroencephalogr. Clin. Neurophysiol. 1987, 66, 376–382. [Google Scholar] [CrossRef]
- Islam, M.K.; Rastegarnia, A.; Yang, Z. Methods for artifact detection and removal from scalp EEG: A review. Neurophysiol. Clin. 2016, 46, 287–305. [Google Scholar] [CrossRef]
- Urigüen, J.A.; Garcia-Zapirain, B. EEG artifact removal-state-of-the-art and guidelines. J. Neural Eng. 2015, 12, 031001. [Google Scholar] [CrossRef]
- Chaddad, A.; Wu, Y.; Kateb, R.; Bouridane, A. Electroencephalography Signal Processing: A Comprehensive Review and Analysis of Methods and Techniques. Sensors 2023, 23, 6434. [Google Scholar] [CrossRef]
- Zhang, H.; Zhou, Q.Q.; Chen, H.; Hu, X.Q.; Li, W.G.; Bai, Y.; Han, J.-X.; Wang, Y.; Liang, Z.-H.; Chen, D.; et al. The applied principles of EEG analysis methods in neuroscience and clinical neurology. Military Med. Res. 2023, 10, 67. [Google Scholar] [CrossRef] [PubMed]
- Tröndle, M.; Popov, T.; Pedroni, A.; Pfeiffer, C.; Barańczuk-Turska, Z.; Langer, N. Decomposing age effects in EEG alpha power. Cortex 2023, 161, 116–144. [Google Scholar] [CrossRef] [PubMed]
- Vysata, O.; Kukal, J.; Prochazka, A.; Pazdera, L.; Valis, M. Age-Related Changes in the Energy and Spectral Composition of EEG. Neurophysiology 2012, 44, 63–67. [Google Scholar] [CrossRef]
- Altuna, M.; Giménez, S.; Fortea, J. Epilepsy in Down Syndrome: A Highly Prevalent Comorbidity. J. Clin. Med. 2021, 10, 2776. [Google Scholar] [CrossRef] [PubMed]
- Tsipouras, M.G. Spectral information of EEG signals with respect to epilepsy classification. EURASIP J. Adv. Signal Process. 2019, 2019, 10. [Google Scholar] [CrossRef]
- Ball, S.L.; Holland, A.J.; Huppert, F.A.; Treppner, P.; Watson, P.; Hon, J. The modified CAMDEX informant interview is a valid and reliable tool for use in the diagnosis of dementia in adults with Down’s syndrome. J. Intellect. Disabil. Res. 2004, 48 Pt 6, 611–620. [Google Scholar] [CrossRef]
- Windsperger, K.; Hoehl, S. Development of Down Syndrome Research Over the Last Decades-What Healthcare and Education Professionals Need to Know. Front. Psychiatry 2021, 12, 749046. [Google Scholar] [CrossRef]
- Kaufman, A.S.; Kaufman, N.L. Manual for Kaufman Brief Intelligence Test Second Edition (KBIT-2); American Guidance Service: Circle Pines, MN, USA, 2004. [Google Scholar]


| Study | Participants | Methods of EEG Analysis | Controls for Confounders | Findings |
|---|---|---|---|---|
| [14] | - 19 young adults with DS, aged 19 to 37 years, and 9 older adults, aged 42 to 66 years; - 13 healthy control subjects aged 22 to 38 years. | A certified electroencephalographer analysed the EEGs, categorising them based on the presence or absence of alpha background activity. | + DS was confirmed by genetic tests; + Presence of a control group; + Patients divided into two groups; + The patients did not have epilepsy; + Patients had no other comorbidities; + Patients were not taking psychotropic medications; - Four elderly patients had a history of mental disorientation, deterioration, and memory loss and suffered from dementia, but it was not stated which diagnostic tests were used for this purpose. |
|
| [15] | - 32 adults with DS (age 21–60 years); - 31 age-matched controls (age 21–60 years). | The absolute amplitude and power for standard EEG bands, along with peak frequency and mean frequency were calculated. In terms of reactivity, EC/EO ratios for amplitude, power, and the percentage diminution of amplitude and power across all bands were computed. A clinical neuropsychologist evaluated the EEG tracings without knowledge of the patient’s details, grading them for different abnormalities, such as the slowing of the dominant occipital rhythm. | + Presence of a control group; - There was no information whether DS was confirmed by genetic tests; - There was a wide range of variability in mental deficiency, with standard deviation values being significantly larger than the means. It was not reported how many patients had experienced significant cognitive decline or confirmed dementia; - Patients were taking neuroleptics and benzodiazepines; - Patients with comorbidities were not excluded; - Some patients had epilepsy. |
|
| [16] | - 38 adolescents with DS (18.7 years ± 0.67 SE); - 17 age-matched healthy controls. | The spectral analysis was conducted using the FFT with the Welch technique, and interhemispheric directional EEG functional coupling was analysed using the Directed Transfer Function (DFT). The standard frequency bands examined included alpha1 (8–10.5 Hz), alpha2 (10.5–13 Hz), beta1, and beta2. Statistical analyses were performed on subgroups, bands and electrodes. | + DS was confirmed by genetic tests; + People with DS were of similar age; + Presence of a control group; + Patients with comorbidities were excluded; + Epilepsy was excluded in the patients; + Patients were not taking psychoactive drugs. |
|
| [17] | - 45 young adults with DS (mean age 22.8 years); - 45 age-matched healthy adults (mean age 22.4 years). | The analysis involved the examination of both Alpha 1 (8–10.5 Hz) and Alpha 2 (10.5–13 Hz) bands. Cortical EEG sources were estimated using LORETA, wherein relative power current source densities at cortical voxels were compared to address abnormalities caused by head volume conduction. The Alpha frequency was calculated over an extended range. | + DS was confirmed by genetic tests; + All individuals recruited for this study were confirmed to be free from dementia; + Participants were of similar age; + Presence of a control group; + Patients with comorbidities were excluded; + Epilepsy was excluded in the patients; + Patients were not taking psychoactive drugs. |
|
| [18] | - 88 children with DS (aged six months, up to five years); - 277 age-matched healthy children. | A time code was automatically generated and recorded, enabling the automated identification of EEG periods free from artifacts that were visually selected on analog tape for analog-to-digital conversion. To conduct additional analysis, the spectra of the two fronto-central and the two parieto-occipital leads were segmented into the six frequency bands. | + People with DS were of similar age; + Presence of a control group; - There was no information whether DS was confirmed by genetic tests; - No information about the occurrence of epilepsy in patients; - No information on the occurrence of comorbidities in patients; - No information about medications being used. |
|
| [19] | - 40 people with DS (age 15–54, mean 30.3 ± 11.4 years); - 42 non-DS with intellectual disabilities (mean age 30.9 ± 10.8 years); - 47 healthy control group (mean age 30.2 ± 11.5 years). | The analysis involved examining relative power using EEGs from four derivations in the left hemisphere (O1-A1, C3-A1, P3-A1, F3-A1). Specifically, five artifact-free epochs of 5.12 seconds recorded from O1, were subjected to FFT. The FFT was employed to analyse the peak frequency of occipital alpha rhythms, defined as the frequency with the most prominent peak in the 8–13 Hz band. Relative power in six bands was then calculated in the 4–30 Hz range (theta1, theta2, alpha1, alpha2, beta1, beta2). | + Presence of control groups; + Patients with epilepsy were excluded; + Patients with neurological diseases were excluded; + Patients did not use any medications; - There was no information whether DS was confirmed by genetic tests; - Wide age range in all study groups; - It was not stated whether the patients had symptoms of dementia. |
|
| [20] | - 31 people with DS (mean age 35 ± 10 years); - 69 AD patients (mean age 80.1 ± 9.5 years); - 16 elderly controls (age 81.6 ± 7.1 years); - 26 young healthy controls (age 26 ± 8 years). | Absolute amplitude and power of typical EEG bands (alpha 7.57–13.92 Hz), along with peak frequency and mean frequency (for both the entire spectrum and a combination of alpha and theta = 4.15–13.92 Hz), were calculated. A clinical neurophysiologist assessed the EEG tracings without knowledge of the patient’s details, grading them for various abnormalities, including the slowing of the dominant occipital rhythm. | + The DS patients were divided into two groups: those under 40 years old (17 individuals) and those aged 40 and older (10 individuals); - There was no information whether DS was confirmed by genetic tests; - The individuals with DS exhibited cognitive impairment, as assessed through MMS scores, but there was no information that they have been diagnosed with dementia; - Patients from the DS and AD groups were taking neuroleptics and benzodiazepines; - Six AD patients and five DS patients had a history of epileptic seizures; - No information on exclusion of patients with comorbidities. |
|
| [21] | - 32 people with DS (age 20–46 years); - 15 healthy older adult controls (in their 60s); - 15 healthy younger adult controls. | The quantity of waves present in 10 frequency bands (delta, theta1–3, alpha1–4, beta1–2) was determined using the “wave-form recognition method.” Additionally, the mean frequency of the occipital region (O1) was computed within the theta-alpha band range of 4–13 Hz. | + It was not reported that any of the patients had been diagnosed with dementia, but test results indicated cognitive decline; + Patients with DS were divided into three groups; + One patient was taking anticonvulsants; - 90% of patients had genetically confirmed trisomy 21, and 10% of patients had the mosaic type; - Epilepsy was not excluded in the patients; - Comorbidities in patients were not excluded. |
|
| [22] | (1) Cross-sectional study: - 265 children and adults with DS (age range 8–55 years) - 242 non-DS children and adults with intellectual disabilities (age range 7–58 years); - 239 healthy children and adults (age range 2–59 years); (2) Longitudinal study with period between 8–9 years: - 28 people with DS; - 14 non-DS with intellectual disabilities. | The dominant frequency was determined based on the peak of the average spectrum. The analysis specifically targeted the frontal, central, and occipital regions. | + The results were divided into age groups; + Epilepsy was not reported in the patients; - For one-third of the individuals with DS, a chromosome karyotype was not conducted. Among the remaining two-thirds, the karyotype was typical trisomy, except for four individuals who exhibited a mosaic type; - No information on exclusion of patients with comorbidities; - No information about medications used by patients. |
|
| [23] | - 25 adults with DS (age range 17–44); - 25 healthy controls (age range 16–44). | Absolute and relative power measures for each frequency band of interest (delta 0.5–4 Hz; theta 4–8 Hz; alpha 8–13 Hz; beta 13–30 Hz) were obtained for each region (frontal and occipital) for every individual. Additionally, alpha peak features were calculated, with the frequency of the peak amplitude within the 8–13 Hz range being defined. Some individuals with DS did not exhibit a detectable alpha peak. To address this, alpha peak features were derived for all participants by eliminating the linear trend from individual power spectra, a process referred to as ‘spectral normalisation’. | + Every participant had their trisomy 21 genetically confirmed; + To be eligible for the study, all participants had to exhibit no decline according to this questionnaire; + Age-matched participants in control group; + Participants with an acute physical or mental health condition were excluded; - The presence of epilepsy in patients was not excluded; - No information about medications used by patients. |
|
| [24] | - 13 adults with DS (mean age 33.8 years); - 13 healthy age-matched controls. | Spectral analysis was conducted using the Dirichlet window and FFT. The O2-A2 electrodes were utilized for analysis, with alpha defined within the range of 8–12.9 Hz. The dominant occipital frequency was determined as the frequency with the largest power peak in the 2–20 Hz range in the T6-O2 channels. | + All participants had the classical phenotype of DS; + All included patients were without dementia; + Presence of an age-matched control group; + Patients with focal neurological findings were excluded; + Patients were not taking psychotropic medications. |
|
| [25] | - 6 people with DS (24–78 years, mean age 42.3 years). | Absolute power, relative power, symmetry, and phase coherence were measured. Age-appropriate normative values were used for statistical comparisons of the variables. Additional EEG analyses, such as multivariate analyses of composite features across frequency bands and electrode locations, were also conducted. | - Significant age range of the participants; - No information about cognitive decline or dementia in participants; - No control group; * Lack of access to information about the genetic confirmation of DS, the presence of coexisting neurological and psychiatric diseases, epileptic seizures and psychoactive drugs taken. |
|
| [26] | - 36 people with DS (aged 15–54, mean age 30.7 ± 11.5 years); - 47 healthy controls (mean age 30.9 ± 10.8 years); - 42 non-DS mentally retarded (mean age 30.9 ± 10.8 years). | Measured the peak frequency and relative powers within conventional EEG bands, with a specific division for the alpha band into the ranges of 8–10.5 Hz and 10.5–13 Hz. | + DS was confirmed by genetic tests; + Presence of a control group; + To explore age-related changes, the subjects were categorised into four age groups: (1) 15–24, (2) 25–34, (3) 35–44, and (4) 45–54 years old; + Patients with DS did not take any psychoactive drugs; - No information about cognitive decline or dementia; - No information about coexisting neurological and psychiatric diseases. |
|
| [27] | - 33 younger adults with DS (20–35 years); - 12 older adults with DS (36–55 years); - 20 younger healthy adults as a controls (age 20–35 years); - 20 older healthy adults as a controls (age 36–55 years). | The relative and absolute power of delta, theta, alpha (8–11.9 Hz), and beta bands, along with their topographical distribution were investigated. Results were deemed abnormal if they deviated beyond the mean normal values ± 2.5 standard deviations. | + Dementia was assessed using criteria of Shapiro, some patients had dementia; + Presence of a control groups; - There was no information whether DS was confirmed by genetic tests; * Lack of access to information about the genetic confirmation of DS, the presence of coexisting neurological and psychiatric diseases, epileptic seizures and psychoactive drugs taken. |
|
| [28] | - 45 adults with DS (mean age 30.6 years), subdivided into 33 younger adults (age 20–45 years) and 12 older adults (age 36–56 years); - 40 healthy control subjects (20 younger adults (age 20–35 years) and 20 older adults (age 36–55 years). | Resting-state analysis involved computing the relative and absolute power of delta, theta, alpha (8–11.9 Hz), and beta. The topographic distribution of each band was examined using bidimensional maps with rectangular linear interpolation. Results were deemed abnormal if they deviated beyond the mean values of the control group ± 2.5 standard deviations. | + Participants were divided into two groups: younger adults and older adults; + Dementia was diagnosed through clinical assessment using the Shapiro criteria and cognitive test outcomes; + Presence of a control group; * Lack of access to information about the genetic confirmation of DS, the presence of coexisting neurological and psychiatric diseases, epileptic seizures and psychoactive drugs taken. |
|
| [29] | - 25 adults with DS (mean age 38 years, range 30–69 years); - 25 age-matched healthy controls (mean age 36 years, range 28–65 years). | There was calculated the average absolute power for each channel across the 1–30 Hz range with 1 Hz increments. Percent power was determined as a percentage value of a 1 Hz segment. The alpha frequency was identified as the frequency with the maximum power within the alpha band over occipital electrodes (O1 and O2). Absolute and relative power were assessed for traditional bands (alpha1&2 and beta1–3), and the absolute power of individually adjusted bands for theta and alpha 1–3 was also measured. | + Patients with neurological and psychiatric disorders were excluded; + Patients taking psychoactive medications were excluded; + Presence of the control group; - No genetic confirmation of the presence of DS or its subtypes; - Wide age range of examined patients and no division into groups of younger and older adults; - No assessment for cognitive decline and dementia; - Patients were not examined for the occurrence of epileptic seizures. |
|
| [30] | - 36 adults with DS (mean age 30.9 years, range 16–56). | Spectral estimates were acquired through multitaper analysis for each channel, employing 2-s windows with a time resolution of 400 ms, steps of 50 ms, and a 3 dB bandwidth. Averaging was performed within and across time windows for each subject, and scalp maps were generated for statistical parametric mapping results. Spatial smoothing was applied to minimize spatio-anatomical differences between participants. SPMs were family-wise error corrected at p = 0.05. Mean scalp maps for theta (5 Hz) and alpha (8 Hz) power were created to analyse their regional distribution and locate the maximum power in each band. Linear regression was then employed to explore the relationship between raw KBIT-2 scores and both alpha peak amplitude and alpha peak frequency derived from regional electrode averages. Additionally, a scalp-wide SPM for power in the combined theta-alpha range (4–13 Hz) was generated. Regression analysis identified significant associations between raw KBIT-2 scores and theta-alpha power across the scalp, with family-wise error correction applied. This comprehensive analysis was conducted using a general linear model. | + All participants had genetically confirmed trisomy 21; + Patients with confirmed absence of dementia; + Patients with mental disorders were excluded; - No control group; - Patients were not examined for the occurrence of epileptic seizures. |
|
Disclaimer/Publisher’s Note: The statements, opinions and data contained in all publications are solely those of the individual author(s) and contributor(s) and not of MDPI and/or the editor(s). MDPI and/or the editor(s) disclaim responsibility for any injury to people or property resulting from any ideas, methods, instructions or products referred to in the content. |
© 2024 by the authors. Licensee MDPI, Basel, Switzerland. This article is an open access article distributed under the terms and conditions of the Creative Commons Attribution (CC BY) license (https://creativecommons.org/licenses/by/4.0/).
Share and Cite
Chmiel, J.; Rybakowski, F.; Leszek, J. EEG in Down Syndrome—A Review and Insights into Potential Neural Mechanisms. Brain Sci. 2024, 14, 136. https://doi.org/10.3390/brainsci14020136
Chmiel J, Rybakowski F, Leszek J. EEG in Down Syndrome—A Review and Insights into Potential Neural Mechanisms. Brain Sciences. 2024; 14(2):136. https://doi.org/10.3390/brainsci14020136
Chicago/Turabian StyleChmiel, James, Filip Rybakowski, and Jerzy Leszek. 2024. "EEG in Down Syndrome—A Review and Insights into Potential Neural Mechanisms" Brain Sciences 14, no. 2: 136. https://doi.org/10.3390/brainsci14020136
APA StyleChmiel, J., Rybakowski, F., & Leszek, J. (2024). EEG in Down Syndrome—A Review and Insights into Potential Neural Mechanisms. Brain Sciences, 14(2), 136. https://doi.org/10.3390/brainsci14020136