Abstract
Diffusion tensor imaging (DTI) showed its adequacy in evaluating the normal-appearing white matter (NAWM) and lesions in the brain that are difficult to evaluate with routine clinical magnetic resonance imaging (MRI) in multiple sclerosis (MS). Recently, MRI systems have been developed with regard to software and hardware, leading to different proposed diffusion analysis methods such as diffusion tensor imaging, q-space imaging, diffusional kurtosis imaging, neurite orientation dispersion and density imaging, and axonal diameter measurement. These methods have the ability to better detect in vivo microstructural changes in the brain than DTI. These different analysis modalities could provide supplementary inputs for MS disease characterization and help in monitoring the disease’s progression as well as treatment efficacy. This paper reviews some of the recent diffusion MRI methods used for the assessment of MS in vivo.
1. Introduction
Multiple sclerosis (MS) is a chronic inflammatory demyelination disease that causes cognitive, sensory, and motor deterioration to the nervous system [1,2]. Injured myelin undergoes a remyelination process that may fail, and develops chronic plaques with different degrees of demyelination with or without axonal injury and gliosis [3]. The exact cause of MS is not yet known; however, it is most likely the result of either a pathogen or an aberrant response of the immune system or a combination of both [4,5]. There is also some epidemiological evidence for the environment acting in combination with genetic factors long prior to multiple sclerosis becoming evident clinically, which is also important in disease formation. MS affects more than 3 million people around the world and can affect young adults at the average age of 30 [5,6,7]. This number of MS patients is growing significantly, and thus the need for effective prevention strategies is essential [8]. MS has no cure as yet and the treatment focuses on shortening the duration of attacks as well as slowing the disease progression to minimize the symptoms [5].
Magnetic resonance imaging (MRI) is an established key imaging modality for the investigation of pathophysiology in a wide range of neurodegenerative diseases [9,10,11]. MRI not only assists in diagnosing and monitoring the disease as stated in the revised McDonald criteria [12], but also allows the evaluation of the efficacy of disease treatment [9,10,11]. Conventional MRI examinations can measure central nervous system (CNS) atrophy and MS lesions through T_1 hypo-intense, T_2 hyper-intense, and gadolinium (Gd) enhancement imaging modalities. These modalities have helped with the diagnosis, clinical management, and examination of the underlying MS disease mechanisms in clinical and pre-clinical trials [11]. However, conventional MRI has inherently low sensitivity in detecting MS gray matter (GM) and diffuse white matter (WM) damage as the imaging findings do not always agree with the degree of the disease progression [13]. This can be caused by an ongoing microstructural change in neural tissues that is invisible for conventional MRI, known as normal-appearing white matter (NAWM), which often demonstrates swelling, mild inflammation, increased expression of proteolytic enzymes, microglia activation, gliosis, and chronic injury [14]. The degree of the damage caused to NAWM differs according to the disease severity [15]. Therefore, new MRI techniques are urgently required to improve the sensitivity and specificity for measuring this type of damage.
Diffusion (also known as a Brownian motion) is a phenomenon of the thermal random movement of water molecules, which can be quantified using diffusion weighted imaging (DWI) in vivo and to ultimately define the characterization of neural activity [16,17]. In a DWI sequence, a diffusion sensitization gradient is applied on both sides of the refocusing radiofrequency pulses. A parameter called the b-value, which is proportional to the square of the amplitude and the duration of the applied diffusion gradient, determines the weighting of the diffusion images (expressed in s/mm2). The apparent diffusion coefficient (ADC) is a parameter that quantitatively evaluates the diffusion images and shows with a dark contrast those tissues with restricted diffusion (bright on DWI images) [18]. The free movement of water molecules that can diffuse equally in all directions is called isotropic diffusion and results in a spherical spatial displacement. To measure the isotropic diffusion coefficient, only one direction is needed [19].
In biological tissues, the diffusion of water is complicated due to their structural boundaries [19]. Diffusion in these conditions is called anisotropic. In the central nervous system (CNS), white matter (WM) structures are highly organized, resulting in preferential water diffusion parallel to the axon direction (Figure 1) [20]. In order to obtain the anisotropic diffusion coefficient, more than one diffusion gradient direction is essential [19]. For instance, diffusion tensor imaging (DTI) requires six non-collinear directions of the diffusion-sensitized gradient measurements in addition to at least one reference measurement that is acquired with no diffusion gradient. These gradients are incorporated in a 3 × 3 symmetric matrix for each gradient direction and are called the B-matrix [21]. Thus, applying a large number of diffusion gradients will help to improve the diffusion measurement. However, this will have the drawback of increasing the scan time significantly. Moreover, the B-matrix is influenced by different factors such as the main magnetic field inhomogeneity, imaging gradients, eddy current, and other background interference [21,22]. This may lead to B-matrix spatial distribution (BSD), which should be taken into consideration and be corrected and calibrated for, as any gradient distortions of the B-matrix will cause an inaccurate diffusion measurement. Several methods have been proposed to gain a more accurate B-matrix, such as: (a) refocusing each DWI gradient before the readout gradient is turned on and refocusing each imaging gradient before the next DWI gradient [23] or (b) acquiring DWI data twice in each direction (with the given DWI gradient and with the opposite polarity [24,25]). Applying any of these methods will result in a long scanning time. The effect of imaging gradient can be decreased by using the optimal diffusion gradient scheme [26]. Moreover, most of the gradient uniformities’ effects on the B-matrix can be solved by using spherical harmonic expansion [27,28]. The BSD-DTI is an alternative calibration method of correcting the errors and setting the accurate form of the B-matrix. This can be achieved by utilizing an anisotropic phantom with well-defined structures. The phantom is rotated mechanically with a certain set of Euler angles inside the MRI scanner and then the standard DTI measurements are performed and repeated until completing the dataset. In this method, unlike previous methods, knowing all imaging sequence parameters is not required [29,30]. On the other hand, the spatial distribution can be derived in the laboratory coordinate system by a rotation transformation if the phantom has a well-known coordinate system [31]. This allows for the use of any anisotropic phantom with well-known diffusion properties with one condition of using of the phantom parameters during the whole calibration process. It is worth mentioning that experimental observations from Bammer and Markl [27] since 2003, and their following work on the BSD-DTI approach from 2008, theoretically contradict the Stejskal-Tanner (S-T) equation, where the gradient is only time-varying. Only since 2018 has the generalized S-T equation for non-uniform gradients—for which the classic S-T equation is a special case—introduced such a possibility (curvilinear space in which the gradient is constant) [32].
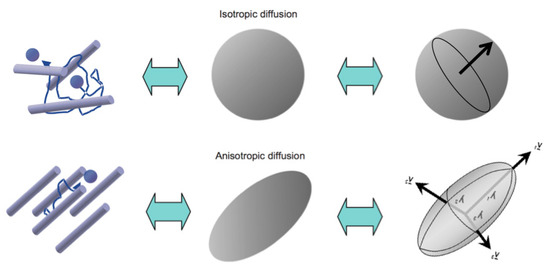
Figure 1.
Schematic graph of isotropic and anisotropic diffusion. This figure was adapted with permission from Ref. [19]. 2023, Elsevier.
The accurately-produced signal contrast of DWI data can then be used as an evaluation tool with which to assess MS disease progression [18]. This review will cover some of the recent post-processing diffusion MRI techniques.
2. Diffusion Tensor Imaging (DTI)
DTI, since it was introduced by Basser and Mattiello [33], has proved its ability to detect abnormal changes in the brains and spinal cords of MS patients through its high sensitivity to water molecules’ motion along the tissues, and can illustrate the tissue type, integrity, architecture, and presence of barriers resulting in quantitative information about the anisotropy and orientation [34]. DTI quantitative metrics include axial diffusivity (AD), which is generally parallel to the WM fibers and measures the fast diffusion along the axons, radial diffusivity (RD), which reflects diffusion perpendicular to the fibers and provides information about diffusion between the axon myelin structures, mean diffusivity (MD), which provides a measure of the overall water motion without directionality, and finally the fractional anisotropy (FA), which is used to describe a relative diffusivity index along the largest diffusion axis of the tensor (see Figure 2) [35,36]. These parameters, in several studies, have shown changes in MS lesions as an increase in the diffusivity and a decrease in the anisotropy as a result of increased water content with a loss of myelin and axons, and the presence of gliosis [37,38,39,40,41]. Other studies have reported a consistency between a decrease in FA in lesions and a decrease in tissue coherence in adults with mild [42] and moderate MS [43], and pediatric patients with mild MS [44,45,46]. Moreover, a change in NAWM has been detected in different studies as an increase in MD and reduced FA values [43,47,48].
DTI has a drawback due to its fundamental assumption that each voxel has only one diffusion direction and accounts for the Einstein–Smoluchowski equation (λ2 = 2Dt), where (λ2) is the mean square displacement, (D) is the diffusion coefficient, and (t) is the diffusion time. This acts as the basis for the diffusion tensor image and assumes that water molecules follow a Gaussian distribution. However, water movement in neuronal tissues in vivo is inconsistent due to the presence of different compartments and barriers that cause different types of water restrictions. Thus, the theory that the water molecule is normally distributed in vivo is not correct in many cases [49,50]. This can produce some issues when analyzing relatively large voxels (>2 mm) as they could have a different tissue mixture (GM, WM, and CSF). Additionally, the presence of the cell membrane and crossing fibers may deviate the diffusion calculations from a Gaussian process [48,50]. Therefore, additional DWI modelling techniques are needed to overcome these problems. Different approaches have been developed to analyze each voxel with different components mathematically, depending on their features, to extract further knowledge about the underlying changes [18].

Figure 2.
Diffusion metrics from the same participant for DTI (FA, MD, AD and RD), DKI (AK, MK and RK), and NODDI (IC, ISO and OD) [51].
3. Q-Space Imaging (QSI)
QSI is an analytical model for DWI datasets utilizing high b-values. It has an advantage of not counting on the Gaussian diffusion assumption when calculating its maps compared to DTI. QSI calculates the average distance travelled of water molecules and their probability density map in one voxel during a given diffusion time with high and multiple b-values. QSI has showed a high sensitivity to NAWM changes in MS patients [52,53]. It even has a higher sensitivity than DTI in detecting pathological changes as shown in Mustafi and Harezalk’s (2019) study, where MS plaques and NAWM showed higher water molecule mean displacement values (a QSI metric that is similar to the ADC of the DTI, which illustrates the amount of water molecule restriction within the voxel) compared to DTI [54]. Moreover, myelin imaging was introduced based on QSI to monitor demyelination and remyelination processes, and helped with observing microstructural changes in MS patients in vivo [55,56,57,58]. QSI, however, is not extensively used clinically due to its need for a large number of high b-values, which results in a long scanning time [52,53].
4. Diffusional Kurtosis Imaging (DKI)
DKI was introduced in 2005 by Jensen and Helpern and its metrics have been driven by QSI analysis [59]. DKI has fewer requirements for its metrics (axial kurtosis (AK), mean kurtosis (MK), and radial kurtosis (RK); see Figure 2) to be measured than QSI (it should have two b-values in addition to a b-value of zero with no fewer than 15 diffusion directions). Thus, it has the advantage of being applied clinically with a reasonable imaging time. The protocol has been utilized to collect proper DWI data for DKI analysis with an imaging time of less than 3 min [60]. One study, conducted by Bester et al., showed a decrease in the cortical mean kurtosis (one of DKI metrics) for patients with cognitive performance deficiency, where it was assessing GM rather than WM [61]. Moreover, DKI has been reported to be more accurate in detecting microstructural changes in NAWM in MS patients than DTI due to its high sensitivity measurements index [62,63]. In addition, the DKI mean axonal water fraction (AWF) parameter revealed significant correlations with the expanded disability status scale (EDSS) and the symbol digit modality test (SDMT) and the tortuosity of the extra axonal space with SDMT (see Figure 3) [64]. Another advantage of DKI is that the mean kurtosis index is not easily affected by crossing fibers in contrast to FA [62,65,66]. On the other hand, some skepticism was raised about the amount of biological tissue complexity reflected by the degree of deviation from the Gaussian distribution and the value of kurtosis in DKI due to the lack of specificity of the mean kurtosis. Thus, more studies should be performed to confirm its usefulness clinically [67].
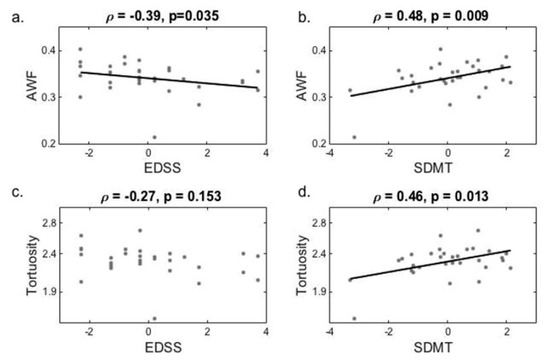
Figure 3.
Mean axonal water fraction (AWF) and tortuosity of the corpus callosum (body) correlated with EDSS (a,c, respectively) and SDMT (b,d, respectively) scores. The best fit lines are Spearman rank for (a,c); and Pearson for (b,d) correlation coefficients. This figure was adapted with permission from Ref. [64]. 2023, Springer Nature.
5. Neurite Orientation Dispersion and Density Imaging (NODDI)
NODDI is a multi-shell, high angular resolution diffusion imaging (HARDI) technique that was developed by Zhang and Schneider [68] in 2012 for the microstructural complexity estimation of neurites in vivo. NODDI parametric indices provide more accurate markers of neurological tissues with a higher sensitivity and specificity than standard DTI and DKI indices [68,69]. This is due to DTI and DKI providing numerical representations for the information contained in DWI data without considering the underlying microstructural characteristics of biological tissue, whereas NODDI accounts for this through the orientation dispersion (OD) index to quantify neurite density [70,71]. The assumption behind the NODDI model is that water molecules in neuronal tissues follow one of three different pools: (I) a free water, which is modelled as isotropic diffusion (used to model CSF); (II) restricted water, which is modelled as sticks (used to model axons and dendrites); and (III) hindered water, which is modelled by anisotropic diffusion Gaussian distribution (used to model extracellular space, neuronal cell bodies, and glial cells) [51,72]. This will result in the formation of three indices for the NODDI model including isotropic diffusion fraction (ISO), orientation dispersion fraction (OD), and intracellular fraction (IC) (see Figure 2) [68]. The Watson distribution model (Figure 4) is used to calculate the orientation of the sticks to calculate the dispersion, which ranges from highly parallel axons (e.g., the corpus callosum) to widely dispersed dendrites (e.g., GM) [50,68]. The required DWI data for NODDI analysis are similar to the DKI requirement. Many studies have used NODDI to evaluate brain MS lesions and NAWM [73,74,75,76,77,78,79,80]. These studies had common findings in IC reduction, which suggests neurite degeneration and reduced density, in MS plaques. Moreover, NAWM showed a decrease in the IC compartment but was not similar to demyelinated regions. A post-mortem study of the human brain showed a good agreement between IC map with histology in the hippocampus axonal pathways (perforant path, Schaffer collaterals, and mossy fibers) [81]. Another post-mortem study was performed on the human spinal cord for MS patients and showed a reduction in the OD map with an excellent agreement with histology findings [82].
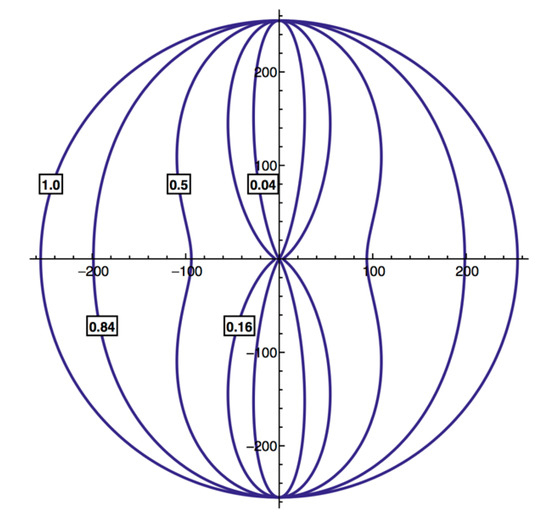
Figure 4.
Watson distribution model. In this illustration, the mean orientation is constant but the orientation dispersion index is varied (OD ∈ [0.04, 0.16, 0.5, 0.84 and 1.0]). This model generates a symmetrical lobe, where the cross-sectional view through the axis symmetry matches its mean orientation. This figure was adapted with permission from Ref. [68]. 2023, Elsevier.
NODDI provides sufficient information to measure neurite morphology in vivo, as well as enabling potential clinical application among many proposed models [68,83]. However, there is some skepticism with regard to using NODDI in clinical research as its analysis may not always fit correctly with the underlying tissue pathological conditions [83]. Thus, further studies on more clinical cases and comparing them with histopathology, EDSS, and disease prognosis are essential for confirmation [78].
6. AxCaliber
Neuronal signal conduction has been found to be directly correlated with axon diameter. Hence, axon diameter controls the transmission capacity within the central nervous system (CNS) and peripheral nervous system. Axons with a large diameter are found in bundles that require a fast response, such as motor nerves, while axons associated with pain and temperature controls have a smaller neuronal path and have a slower response [84].
Whenever axons are damaged as a result of injury or autoimmune or neurodegenerative diseases (such as MS), the patient’s quality of life will be dramatically affected, resulting in sensory and/or motor deficits [85]. MS pathology affects smaller axons first [86]. Therefore, measuring the axon diameter distribution is important for detecting the effect of the disease on neuronal function. Until recently, such information was only accessible through histological examination using invasive tissue biopsy. However, a novel method called AxCaliber was developed by Assaf and Blumenfeld-Katzir [84] in 2008 that enabled the non-invasive measurement of axon diameter distribution in vivo using diffusion MRI. The idea behind it was that diffusion restriction will be experienced differently by axons with different diameters at different diffusion times. Thus, it is possible to estimate the axon diameter distribution by modelling the multi-diffusion time data as a gamma function [87]. AxCaliber is considered an extended framework of the composite hindered and restricted model of diffusion (CHARMED) approach, which was developed by Assaf and Basser [88] in 2005 [84]. It uses a series of DWI-stimulated echo images to extract the axonal diameter distribution and volume fraction for each voxel [85,89]. The first launched AxCaliber model was achieved by applying diffusion gradients perpendicular to the axons’ direction with different diffusion times [87]. This approach made its use limited to highly paralleled WM tracts such as in the corpus callosum of the brain [87,90,91,92] and the WM tracts in the spinal cord [85,93]. Another imaging model (called ActiveAx) was published in 2010 that studies the axonal features with few requirements for the acquisition protocol. The advantage of ActiveAx is that it is not affected by the axon’s orientation. However, unlike AxCaliber, ActiveAx estimates only the mean axon diameter rather than the full axon diameter distribution [87]. Later, in 2019, De Santis and Herranz [94] developed AxCaliber to extract axonal diameter measurements across the whole brain and validated the axonal diameter calculated through AxCaliber with histological findings and reported a linear fitting with a value of R2 = 0.99.
Axons with small diameters are at risk of injury when demyelination occurs. This results in a larger apparent axon diameter calculation for NAWM and lesion areas, which has been found to have a strong correlation with EDSS performance [92]. Several studies have reported axonal diameter increase in lesions and NAWM [95] as well as a decrease in axonal density [92,96] of the corpus callosum in MS patients compared to healthy controls. Additionally, an increase in axon diameter with a reduction in water molecule restriction was reported for the whole brain using AxCaliber in MS compared to healthy controls [94].
AxCaliber has been argued to be overestimating the axon diameter [78]. Gradient strength is essential to solving this issue as it requires a high gradient coil (e.g., 300 mT/m that has been used in studies by Duval and McNab [85], Huang and Fan [92], De Santis and Herranz [94], and Huang and Tobyne [95]), whereas the clinical MRI scanners have a range of 30–80 mT/m [78,85].
7. Future Perspective
A more detailed assessment of MS pathology, such as disease severity and treatment efficacy, can be extracted by combining different advanced diffusion models. The main challenge facing advanced diffusion MRI models is the amount of required data, and sometimes specific hardware, for the analysis to occur, leading to a long scanning time when compared to DTI. One of the solutions is to reduce the diffusion time by replacing the long diffusion-sensitizing gradients used in pulsed gradient spin-echo sequences with rapidly oscillating gradients [97,98]. Another solution is using an imaging protocol that serves different diffusion analysis methods, such as hybrid diffusion imaging (HYDI) [99]. The HYDI scheme consists of multiple shells of DWI. These shells can be used for characterizing the signal behavior with low, moderate, and high diffusion weighting, and could be facilitated to be analyzed using different analysis strategies such as DTI, Q-Space, DKI, and NODDI, resulting in comprehensive findings for the same DWI data.
The recent developments in manufacturing and designing gradient coils have helped to achieve higher b-values as low gradient systems prevent the achievement of a high b-value. This also led to the achievement of a constant gradient field, which allowed for the acquisition of an adequate stimulated echo from very short diffusion times, as well as the application of very short diffusion encoding times [100]. For an example, a maximum b-value with a gradient system of 0.5 T/m can be achieved with a diffusion time of 50 ms; using a stronger gradient system by a factor of 10 (with a capability of 5 T/m), the diffusion time can be shortened by a factor of 20 (decreasing the diffusion time to 2.5 ms) [101]. Moreover, the increase in the resolution of DWI data has led to deeper insights into how functional and structural properties of the brain are coupled through combining DWI with electro-encephalography (EEG) [102].
In very recent years, the number of new diffusion approaches has increased. Nuclear magnetic resonance (NMR) diffusometry is considered a new, unique promising technique for evaluating nanomedicine, whereas nanoparticle-based vaccines used against COVID-19 throughout the pandemic have accelerated the development of nanomedicines in the coming years—NMR diffusometry will be a necessary tool with which to investigate their fate in bioenvironments. NMR diffusometry could complete a range of assays for different drug assessment methods and overcome some of their drawbacks. This application is still in its early development stage but should make a better contribution to understanding the characterization and bioenvironment interaction complexity of nanomedicine in biological systems. NMR diffusometry may allow for new MS treatment approaches as, when nanomedicine is administered, the administration route until it reaches its biological target illustrates the mechanisms of interactions between the drug and the tracer (either encapsulated, entrapped, dissolved, covalently bonded, or adsorbed on the surface) or the drug release process (inclusion and location), and the therapeutic results of where and when the tracer will deliver the drug [101]. Another recent imaging technique is diffusion basis spectrum imaging (DBSI). This technique combines the spectrum of isotropic diffusion tensors (composed of a restricted fraction, which reflects cellularity, and a nonrestricted fraction, which reflects the extra-axonal environment correlated with tissue loss, inflammation, and cerebrospinal fluid partial volume) with discrete anisotropic diffusion tensors (composed of axial diffusivity (which represents residual axon integrity), radial diffusivity (which represents myelin integrity of the remaining axons), and fiber fraction (which represents apparent axonal density)) to investigate MS subtypes’ neuropathology. DBSI has provided preliminary evidence that supports its ability to become a potential non-invasive biomarker of remyelination and a neurodegenerative measurement tool for MS pathology [103]. Another technique showed that DWI can assess WM connections, revealing topological alterations in MS using structural network-based approaches [104,105] and subnetwork-based approaches [106]. These network analyses could serve as potential biomarkers that reflect the state of the brain network more accurately through diagnosing and monitoring disease progression and assessing MS treatment effects. Finally, it is important for a certain consensus on specific DWI parameters (such as repetition time, echo time, number of averages, small and large deltas, number of b-values, b-matrix size, image resolution … etc. for all other required DWI parameters for a certain magnetic field strength) to be created and followed to minimize and overcome some of the issues that may arise from using inadequate parameters leading to inaccurate diffusion measurement.
8. Conclusions
This article has surveyed the potential of DWI in MS pathology. Several valuable modalities were presented to highlight their contributions to better understanding the outcomes of different DWI data models. This can help with diagnosis and improving disease management in MS patients through empowering clinical trials as well as monitoring treatment efficacy. Many other interesting modalities would certainly deserve to be mentioned in this review; however, the aim was not to be detailed but rather illustrative of the potential of DWI.
Funding
This research received no external funding.
Institutional Review Board Statement
Not applicable.
Informed Consent Statement
Not applicable.
Data Availability Statement
This review has no data to be shared.
Conflicts of Interest
The authors declare no conflict of interest.
References
- AlOmair Othman, I.S.M.T.; Brereton Ian, M.; Galloway Graham, J.; Kurniawan Nyoman, D. Current developments in MRI for assessing rodent models of multiple sclerosis. Future Neurol. 2014, 9, 487–511. [Google Scholar] [CrossRef]
- Alamri, S. Adherence to MRI Protocol Consensus Guidelines in Multiple Sclerosis Patients at Taif Hospitals. Int. J. Med. Imaging 2020, 8, 102. [Google Scholar] [CrossRef]
- CAMMS223 Trial Investigators; Coles, A.J.; Compston, D.A.; Selmaj, K.W.; Lake, S.L.; Moran, S.; Margolin, D.H.; Norris, K.; Tandon, P.K. Alemtuzumab vs. Interferon Beta-1a in Early Multiple Sclerosis. N. Engl. J. Med. 2008, 359, 1786–1801. [Google Scholar] [CrossRef] [PubMed]
- Pachner, A.R. Experimental models of multiple sclerosis. Curr. Opin. Neurol. 2011, 24, 291–299. [Google Scholar] [CrossRef] [PubMed]
- Walton, C.; King, R.; Rechtman, L.; Kaye, W.; Leray, E.; Marrie, R.A.; Robertson, N.; La Rocca, N.; Uitdehaag, B.; Van Der Mei, I.; et al. Rising prevalence of multiple sclerosis worldwide: Insights from the Atlas of MS, third edition. Mult. Scler. J. 2020, 26, 1816–1821. [Google Scholar] [CrossRef] [PubMed]
- Nakamura, K. MRI Analysis to Detect Gray Matter Tissue Loss in Multiple Sclerosis; Case Western Reserve University: Cleveland, OH, USA, 2011. [Google Scholar]
- MSIF. What is MS. 2015. Available online: http://www.msif.org/about-ms/what-is-ms/ (accessed on 7 January 2015).
- Ramagopalan, S.V.; Dobson, R.; Meier, U.C.; Giovannoni, G. Multiple sclerosis: Risk factors, prodromes, and potential causal pathways. Lancet Neurol. 2010, 9, 727–739. [Google Scholar] [CrossRef]
- Nathoo, N.; Yong, V.W.; Dunn, J.F. Using magnetic resonance imaging in animal models to guide drug development in multiple sclerosis. Mult. Scler. J. 2013, 20, 3–11. [Google Scholar] [CrossRef]
- Neema, M.; Ceccarelli, A.; Jackson, J.S.; Bakshi, R. Magnetic Resonance Imaging in Multiple Sclerosis. In Multiple Sclerosis; Wiley-Blackwell: Hoboken, NJ, USA, 2012; pp. 136–162. [Google Scholar]
- Neema, M.; Stankiewicz, J.; Arora, A.; Guss, Z.D.; Bakshi, R. MRI in multiple sclerosis: What’s inside the toolbox? Neurotherapeutics 2007, 4, 602–617. [Google Scholar] [CrossRef]
- Polman, C.H.; Reingold, S.C.; Banwell, B.; Clanet, M.; Cohen, J.A.; Filippi, M.; Fujihara, K.; Havrdova, E.; Hutchinson, M.; Kappos, L.; et al. Diagnostic criteria for multiple sclerosis: 2010 Revisions to the McDonald criteria. Ann. Neurol. 2011, 69, 292–302. [Google Scholar] [CrossRef]
- Bakshi, R.; Thompson, A.; Rocca, M.; Pelletier, D.; Dousset, V.; Barkhof, F.; Inglese, M.; Guttmann, C.; Horsfield, M.; Filippi, M. MRI in multiple sclerosis: Current status and future prospects. Lancet Neurol. 2008, 7, 615–625. [Google Scholar] [CrossRef]
- Moll, N.M.; Rietsch Bs, A.M.; Thomas, S.; Ransohoff, A.J.; Lee, J.-C.; Fox, R.; Chang, A.; Ransohoff, R.M.; Fisher, E. Multiple sclerosis normal-appearing white matter: Pathology-imaging correlations. Ann. Neurol. 2011, 70, 764–773. [Google Scholar] [CrossRef] [PubMed]
- Sbardella, E.; Tona, F.; Petsas, N.; Pantano, P. DTI Measurements in Multiple Sclerosis: Evaluation of Brain Damage and Clinical Implications. Mult. Scler. Int. 2013, 2013, 671730. [Google Scholar] [CrossRef] [PubMed]
- Ghosh, A.; Deriche, R. From Diffusion MRI to Brain Connectomics. In Modeling in Computational Biology and Biomedicine; Cazals, F., Kornprobst, P., Eds.; Springer: Berlin/Heidelberg, Germany, 2013; pp. 193–234. [Google Scholar]
- Susumu Mori, J.-D.T. Chapter 1—Basics of Diffusion Measurement. In Introduction to Diffusion Tensor Imaging, 2nd ed.; Tournier, S.M.-D., Ed.; Academic Press: San Diego, CA, USA, 2014; pp. 1–9. [Google Scholar]
- Baliyan, V.; Das, C.J.; Sharma, R.; Gupta, A.K. Diffusion weighted imaging: Technique and applications. World J. Radiol. 2016, 8, 785–798. [Google Scholar] [CrossRef] [PubMed]
- Susumu Mori, J.-D.T. Chapter 4—Principle of Diffusion Tensor Imaging. In Introduction to Diffusion Tensor Imaging, 2nd ed.; Tournier, S.M.-D., Ed.; Academic Press: San Diego, CA, USA, 2014; pp. 27–32. [Google Scholar]
- Galantucci, S.; Tartaglia, M.C.; Wilson, S.M.; Henry, M.; Filippi, M.; Agosta, F.; Dronkers, N.F.; Henry, R.G.; Ogar, J.M.; Miller, B.L.; et al. White matter damage in primary progressive aphasias: A diffusion tensor tractography study. Brain 2011, 134, 3011–3029. [Google Scholar] [CrossRef] [PubMed]
- Borkowski, K.; Kłodowski, K.; Figiel, H.; Krzyżak, A.T. A theoretical validation of the B-matrix spatial distribution approach to diffusion tensor imaging. Magn. Reson. Imaging 2017, 36, 1–6. [Google Scholar] [CrossRef]
- Borkowski, K.; Krzyżak, A.T. Analysis and correction of errors in DTI-based tractography due to diffusion gradient inhomogeneity. J. Magn. Reson. 2018, 296, 5–11. [Google Scholar] [CrossRef]
- Hsu, E.W.; Mori, S. Analytical expressions for the NMR apparent diffusion coefficients in an anisotropic system and a simplified method for determining fiber orientation. Magn. Reson. Med. 1995, 34, 194–200. [Google Scholar] [CrossRef]
- Neeman, M.; Freyer, J.P.; Sillerud, L.O. A simple method for obtaining cross-term-free images for diffusion anisotropy studies in NMR microimaging. Magn. Reson. Med. 1991, 21, 138–143. [Google Scholar] [CrossRef]
- Güllmar, D.; Haueisen, J.; Reichenbach, J.R. Analysis of b-value calculations in diffusion weighted and diffusion tensor imaging. Concepts Magn. Reson. Part A 2005, 25, 53–66. [Google Scholar] [CrossRef]
- Özcan, A. Minimization of imaging gradient effects in diffusion tensor imaging. IEEE Trans. Med. Imaging 2011, 30, 642–654. [Google Scholar] [CrossRef]
- Bammer, R.; Markl, M.; Barnett, A.; Acar, B.; Alley, M.; Pelc, N.; Glover, G.; Moseley, M. Analysis and generalized correction of the effect of spatial gradient field distortions in diffusion-weighted imaging. Magn. Reson. Med. 2003, 50, 560–569. [Google Scholar] [CrossRef] [PubMed]
- Janke, A.; Zhao, H.; Cowin, G.J.; Galloway, G.J.; Doddrell, D.M. Use of spherical harmonic deconvolution methods to compensate for nonlinear gradient effects on MRI images. Magn. Reson. Med. 2004, 52, 115–122. [Google Scholar] [CrossRef] [PubMed]
- Krzyżak, A.T.; Olejniczak, Z. Improving the accuracy of PGSE DTI experiments using the spatial distribution of b matrix. Magn. Reson. Imaging 2015, 33, 286–295. [Google Scholar] [CrossRef]
- Krzyzak, A. Anisotropic Diffusion Phantom for Calibration of Diffusion Tensor Imaging Pulse Sequences used in MRI. U.S. Patent 8643369B2, 4 February 2014. [Google Scholar]
- Krzyzak, A.; Borkowski, K. Theoretical analysis of phantom rotations in BSD-DTI. In Proceedings of the 2015 37th Annual International Conference of the IEEE Engineering in Medicine and Biology Society (EMBC), Milan, Italy, 25–29 August 2015. [Google Scholar] [CrossRef]
- Borkowski, K.; Krzyzak, A. The generalized Stejskal-Tanner equation for non-uniform magnetic field gradients. J. Magn. Reson. 2018, 296, 23–28. [Google Scholar] [CrossRef] [PubMed]
- Basser, P.; Mattiello, J.; LeBihan, D. MR diffusion tensor spectroscopy and imaging. Biophys. J. 1994, 66, 259–267. [Google Scholar] [CrossRef]
- Soares, J.M.; Marques, P.; Alves, V.; Sousa, N. A hitchhiker’s guide to diffusion tensor imaging. Front. Neurosci. 2013, 7, 31. [Google Scholar] [CrossRef]
- Klistorner, A.; Vootakuru, N.; Wang, C.; Yiannikas, C.; Graham, S.L.; Parratt, J.; Garrick, R.; Levin, N.; Masters, L.; Lagopoulos, J.; et al. Decoding Diffusivity in Multiple Sclerosis: Analysis of Optic Radiation Lesional and Non-Lesional White Matter. PLoS ONE 2015, 10, e0122114. [Google Scholar] [CrossRef]
- Wang, X.; Cusick, M.F.; Wang, Y.; Sun, P.; Libbey, J.E.; Trinkaus, K.; Fujinami, R.S.; Song, S.-K. Diffusion basis spectrum imaging detects and distinguishes coexisting subclinical inflammation, demyelination and axonal injury in experimental autoimmune encephalomyelitis mice. NMR Biomed. 2014, 27, 843–852. [Google Scholar] [CrossRef]
- Khan, N.; Smith, M.T. Multiple sclerosis-induced neuropathic pain: Pharmacological management and pathophysiological insights from rodent EAE models. Inflammopharmacology 2013, 22, 1–22. [Google Scholar] [CrossRef]
- O’Connor, A.B.; Schwid, S.R.; Herrmann, D.N.; Markman, J.D.; Dworkin, R.H. Pain associated with multiple sclerosis: Systematic review and proposed classification. Pain 2008, 137, 96–111. [Google Scholar] [CrossRef]
- Khan, N.; Woodruff, T.M.; Smith, M.T. Establishment and characterization of an optimized mouse model of multiple sclerosis-induced neuropathic pain using behavioral, pharmacologic, histologic and immunohistochemical methods. Pharmacol. Biochem. Behav. 2014, 126, 13–27. [Google Scholar] [CrossRef] [PubMed]
- Old, E.A.; Malcangio, M. Chemokine mediated neuron–glia communication and aberrant signalling in neuropathic pain states. Curr. Opin. Pharmacol. 2012, 12, 67–73. [Google Scholar] [CrossRef] [PubMed]
- Gao, Y.-J.; Ji, R.-R. Chemokines, neuronal–glial interactions, and central processing of neuropathic pain. Pharmacol. Ther. 2010, 126, 56–68. [Google Scholar] [CrossRef] [PubMed]
- Filippi, M.; Iannucci, G.; Cercignani, M.; Rocca, M.A.; Pratesi, A.; Comi, G. A quantitative study of water diffusion in multiple sclerosis lesions and normal-appearing white matter using echo-planar imaging. Arch. Neurol. 2000, 57, 1017–1021. [Google Scholar] [CrossRef] [PubMed]
- Filippi, M.; Cercignani, M.; Inglese, M.; Horsfield, M.; Comi, G. Diffusion tensor magnetic resonance imaging in multiple sclerosis. Neurology 2001, 56, 304–311. [Google Scholar] [CrossRef]
- Vishwas, M.; Healy, B.; Pienaar, R.; Gorman, M.; Grant, P.; Chitnis, T. Diffusion Tensor Analysis of Pediatric Multiple Sclerosis and Clinically Isolated Syndromes. Am. J. Neuroradiol. 2012, 34, 417–423. [Google Scholar] [CrossRef]
- Vishwas, M.; Chitnis, T.; Pienaar, R.; Healy, B.; Grant, P. Tract-Based Analysis of Callosal, Projection, and Association Pathways in Pediatric Patients with Multiple Sclerosis: A Preliminary Study. Am. J. Neuroradiol. 2009, 31, 121–128. [Google Scholar] [CrossRef]
- Rocca, M.A.; Sonkin, M.; Copetti, M.; Pagani, E.; Arnold, D.L.; Narayanan, S.; Sled, J.G.; Banwell, B.; Filippi, M. Diffusion tensor magnetic resonance imaging in very early onset pediatric multiple sclerosis. Mult. Scler. J. 2015, 22, 620–627. [Google Scholar] [CrossRef]
- Rovaris, M.; Iannucci, G.; Falautano, M.; Possa, F.; Martinelli, V.; Comi, G.; Filippi, M. Cognitive dysfunction in patients with mildly disabling relapsing–remitting multiple sclerosis: An exploratory study with diffusion tensor MR imaging. J. Neurol. Sci. 2002, 195, 103–109. [Google Scholar] [CrossRef]
- Schneider, T. Sensitivity of multi-shell NODDI to multiple sclerosis white matter changes: A pilot study. Funct. Neurol. 2017, 32, 97–101. [Google Scholar] [CrossRef]
- Hori, M.; Yoshida, M.; Yokoyama, K.; Kamagata, K.; Kumagai, F.; Fukunaga, I.; Kamiya, K.; Suzuki, M.; Masutani, Y.; Hamasaki, N.; et al. Multiple sclerosis: Benefits of q-space imaging in evaluation of normal-appearing and periplaque white matter. Magn. Reson. Imaging 2014, 32, 625–629. [Google Scholar] [CrossRef] [PubMed]
- Winston, G.P. The potential role of novel diffusion imaging techniques in the understanding and treatment of epilepsy. Quant. Imaging Med. Surg. 2015, 5, 279–287. [Google Scholar] [CrossRef] [PubMed]
- Kamiya, K.; Hori, M.; Aoki, S. NODDI in clinical research. J. Neurosci. Methods 2020, 346, 108908. [Google Scholar] [CrossRef] [PubMed]
- Assaf, Y.; Ben-Bashat, D.; Chapman, J.; Peled, S.; Biton, I.E.; Kafri, M.; Segev, Y.; Hendler, T.; Korczyn, A.D.; Graif, M.; et al. High b-value q-space analyzed diffusion-weighted MRI: Application to multiple sclerosis. Magn. Reson. Med. 2002, 47, 115–126. [Google Scholar] [CrossRef] [PubMed]
- Cohen, Y.; Assaf, Y. High b-value q-space analyzed diffusion-weighted MRS and MRI in neuronal tissues—A technical review. NMR Biomed. 2002, 15, 516–542. [Google Scholar] [CrossRef]
- Wu, Y.-C.; Mustafi, S.M.; Harezlak, J.; Kodiweera, C.; Randolph, J.S.; Ford, J.C.; Wishart, H.A. Detecting white matter alterations in multiple sclerosis using advanced diffusion magnetic resonance imaging. Neural Regen. Res. 2019, 14, 114–123. [Google Scholar] [CrossRef]
- Kira, J.-I. q-space Myelin Map imaging: A new imaging technique for treatment evaluation in multiple sclerosis. J. Neurol. Sci. 2017, 373, 358–359. [Google Scholar] [CrossRef]
- Sommer, R.C.; Hata, J.; Rimkus, C.D.M.; da Costa, B.K.; Nakahara, J.; Sato, D.K. Mechanisms of myelin repair, MRI techniques and therapeutic opportunities in multiple sclerosis. Mult. Scler. Relat. Disord. 2021, 58, 103407. [Google Scholar] [CrossRef]
- Fujiyoshi, K.; Hikishima, K.; Nakahara, J.; Tsuji, O.; Hata, J.; Konomi, T.; Nagai, T.; Shibata, S.; Kaneko, S.; Iwanami, A.; et al. Application of q-Space Diffusion MRI for the Visualization of White Matter. J. Neurosci. 2016, 36, 2796. [Google Scholar] [CrossRef]
- Tanikawa, M.; Nakahara, J.; Hata, J.; Suzuki, S.; Fujiyoshi, K.; Fujiwara, H.; Momoshima, S.; Jinzaki, M.; Nakamura, M.; Okano, H.; et al. q-Space Myelin Map imaging for longitudinal analysis of demyelination and remyelination in multiple sclerosis patients treated with fingolimod: A preliminary study. J. Neurol. Sci. 2017, 373, 352–357. [Google Scholar] [CrossRef]
- Jensen, J.H.; Helpern, J.A.; Ramani, A.; Lu, H.; Kaczynski, K. Diffusional kurtosis imaging: The quantification of non-gaussian water diffusion by means of magnetic resonance imaging. Magn. Reson. Med. 2005, 53, 1432–1440. [Google Scholar] [CrossRef] [PubMed]
- Thaler, C.; Kyselyova, A.A.; Faizy, T.D.; Nawka, M.T.; Jespersen, S.; Hansen, B.; Stellmann, J.-P.; Heesen, C.; Stürner, K.H.; Stark, M.; et al. Heterogeneity of multiple sclerosis lesions in fast diffusional kurtosis imaging. PLoS ONE 2021, 16, e0245844. [Google Scholar] [CrossRef]
- Bester, M.; Jensen, J.H.; Babb, J.; Tabesh, A.; Miles, L.; Herbert, J.; Grossman, R.I.; Inglese, M. Non-Gaussian diffusion MRI of gray matter is associated with cognitive impairment in multiple sclerosis. Mult. Scler. J. 2014, 21, 935–944. [Google Scholar] [CrossRef] [PubMed]
- Li, H.Q.; Yin, B.; Quan, C.; Geng, D.Y.; Yu, H.; Bao, Y.F.; Liu, J.; Li, Y.X. Evaluation of patients with relapsing-remitting multiple sclerosis using tract-based spatial statistics analysis: Diffusion kurtosis imaging. BMC Neurol. 2018, 18, 108. [Google Scholar] [CrossRef] [PubMed]
- Qian, W.; Chan, K.H.; Hui, E.S.; Lee, C.Y.; Hu, Y.; Mak, H.K.-F. Application of diffusional kurtosis imaging to detect occult brain damage in multiple sclerosis and neuromyelitis optica. NMR Biomed. 2016, 29, 1536–1545. [Google Scholar] [CrossRef]
- de Kouchkovsky, I.; Fieremans, E.; Fleysher, L.; Herbert, J.; Grossman, R.I.; Inglese, M. Quantification of normal-appearing white matter tract integrity in multiple sclerosis: A diffusion kurtosis imaging study. J. Neurol. 2016, 263, 1146–1155. [Google Scholar] [CrossRef]
- Sahin, S.; Çam, I.; Öztürk, O.; Efendi, H.; Anık, Y.; Gundogdu, O. White Matter Evaluation in Multiple Sclerosis Through Magnetic Resonance Kurtosis Imaging. Cureus 2019, 11, e6424. [Google Scholar] [CrossRef]
- Hori, M.; Fukunaga, I.; Masutani, Y.; Taoka, T.; Kamagata, K.; Suzuki, Y.; Aoki, S. Visualizing Non-Gaussian Diffusion: Clinical Application of q-Space Imaging and Diffusional Kurtosis Imaging of the Brain and Spine. Magn. Reson. Med. Sci. 2012, 11, 221–233. [Google Scholar] [CrossRef]
- Martin, A.R.; Aleksanderek, I.; Cohen-Adad, J.; Tarmohamed, Z.; Tetreault, L.; Smith, N.; Cadotte, D.W.; Crawley, A.; Ginsberg, H.; Mikulis, D.J.; et al. Translating state-of-the-art spinal cord MRI techniques to clinical use: A systematic review of clinical studies utilizing DTI, MT, MWF, MRS, and fMRI. NeuroImage Clin. 2015, 10, 192–238. [Google Scholar] [CrossRef]
- Zhang, H.; Schneider, T.; Wheeler-Kingshott, C.A.; Alexander, D.C. NODDI: Practical in vivo neurite orientation dispersion and density imaging of the human brain. Neuroimage 2012, 61, 1000–1016. [Google Scholar] [CrossRef]
- De Santis, S.; Bastiani, M.; Droby, A.; Kolber, P.; Zipp, F.; Pracht, E.; Stoecker, T.; Groppa, S.; Roebroeck, A. Characterizing Microstructural Tissue Properties in Multiple Sclerosis with Diffusion MRI at 7 T and 3 T: The Impact of the Experimental Design. Neuroscience 2018, 403, 17–26. [Google Scholar] [CrossRef] [PubMed]
- Novikov, D.S.; Kiselev, V.G.; Jespersen, S.N. On modeling. Magn. Reson. Med. 2018, 79, 3172–3193. [Google Scholar] [CrossRef] [PubMed]
- Jelescu, I.O.; Palombo, M.; Bagnato, F.; Schilling, K.G. Challenges for biophysical modeling of microstructure. J. Neurosci. Methods 2020, 344, 108861. [Google Scholar] [CrossRef] [PubMed]
- Grussu, F.; Schneider, T.; Zhang, H.; Alexander, D.C.; Wheeler–Kingshott, C.A. Neurite orientation dispersion and density imaging of the healthy cervical spinal cord in vivo. Neuroimage 2015, 111, 590–601. [Google Scholar] [CrossRef]
- Caverzasi, E.; Papinutto, N.; Castellano, A.; Zhu, A.H.; Scifo, P.; Riva, M.; Bello, L.; Falini, A.; Bharatha, A.; Henry, R. Neurite Orientation Dispersion and Density Imaging Color Maps to Characterize Brain Diffusion in Neurologic Disorders. J. Neuroimaging 2016, 26, 494–498. [Google Scholar] [CrossRef]
- Hagiwara, A.; Kamagata, K.; Shimoji, K.; Yokoyama, K.; Andica, C.; Hori, M.; Fujita, S.; Maekawa, T.; Irie, R.; Akashi, T.; et al. White Matter Abnormalities in Multiple Sclerosis Evaluated by Quantitative Synthetic MRI, Diffusion Tensor Imaging, and Neurite Orientation Dispersion and Density Imaging. Am. J. Neuroradiol. 2019, 40, 1642–1648. [Google Scholar] [CrossRef]
- Hagiwara, A.; Hori, M.; Yokoyama, K.; Nakazawa, M.; Ueda, R.; Horita, M.; Andica, C.; Abe, O.; Aoki, S. Analysis of White Matter Damage in Patients with Multiple Sclerosis via a Novel In Vivo MR Method for Measuring Myelin, Axons, and G-Ratio. Am. J. Neuroradiol. 2017, 38, 1934–1940. [Google Scholar] [CrossRef]
- Granberg, T.; Fan, Q.; Treaba, C.A.; Ouellette, R.; Herranz, E.; Mangeat, G.; Louapre, C.; Cohen-Adad, J.; Klawiter, E.C.; Sloane, J.A.; et al. In vivo characterization of cortical and white matter neuroaxonal pathology in early multiple sclerosis. Brain 2017, 140, 2912–2926. [Google Scholar] [CrossRef]
- Spanò, B.; Giulietti, G.; Pisani, V.; Morreale, M.; Tuzzi, E.; Nocentini, U.; Francia, A.; Caltagirone, C.; Bozzali, M.; Cercignani, M. Disruption of neurite morphology parallels MS progression. Neurol.-Neuroimmunol. Neuroinflammation 2018, 5, e502. [Google Scholar] [CrossRef]
- Lakhani, D.; Schilling, K.; Xu, J.; Bagnato, F. Advanced Multicompartment Diffusion MRI Models and Their Application in Multiple Sclerosis. Am. J. Neuroradiol. 2020, 41, 751–757. [Google Scholar] [CrossRef]
- Collorone, S.; Prados, F.; Kanber, B.; Cawley, N.M.; Tur, C.; Grussu, F.; Solanky, B.S.; Yiannakas, M.; Davagnanam, I.; Wheeler-Kingshott, C.A.M.G.; et al. Brain microstructural and metabolic alterations detected in vivo at onset of the first demyelinating event. Brain 2021, 144, 1409–1421. [Google Scholar] [CrossRef] [PubMed]
- Sacco, S.; Caverzasi, E.; Papinutto, N.; Cordano, C.; Bischof, A.; Gundel, T.; Cheng, S.; Asteggiano, C.; Kirkish, G.; Mallott, J.; et al. Neurite Orientation Dispersion and Density Imaging for Assessing Acute Inflammation and Lesion Evolution in MS. Am. J. Neuroradiol. 2020, 41, 2219–2226. [Google Scholar] [CrossRef]
- Lee, C.H.; Li, J.; Ge, Y.; Shepherd, T.M.; Wadghiri, Y.Z.; Zhang, J.; Nauen, D.W. Post-mortem Diffusion MRI Analysis of Neuronal Pathways in the Human Hippocampus. In Proceedings of the ISMRM & SMRT Virtual Conference & Exhibition, Online, 8–14 August 2020. [Google Scholar]
- Grussu, F.; Schneider, T.; Tur, C.; Yates, R.L.; Tachrount, M.; Ianuş, A.; Yiannakas, M.C.; Newcombe, J.; Zhang, H.; Alexander, D.C.; et al. Neurite dispersion: A new marker of multiple sclerosis spinal cord pathology? Ann. Clin. Transl. Neurol. 2017, 4, 663–679. [Google Scholar] [CrossRef]
- Beck, D.; de Lange, A.-M.G.; Maximov, I.I.; Richard, G.; Andreassen, O.A.; Nordvik, J.E.; Westlye, L.T. White matter microstructure across the adult lifespan: A mixed longitudinal and cross-sectional study using advanced diffusion models and brain-age prediction. Neuroimage 2020, 224, 117441. [Google Scholar] [CrossRef] [PubMed]
- Assaf, Y.; Blumenfeld-Katzir, T.; Yovel, Y.; Basser, P.J. Axcaliber: A method for measuring axon diameter distribution from diffusion MRI. Magn. Reson. Med. 2008, 59, 1347–1354. [Google Scholar] [CrossRef] [PubMed]
- Duval, T.; McNab, J.A.; Setsompop, K.; Witzel, T.; Schneider, T.; Huang, S.Y.; Keil, B.; Klawiter, E.C.; Wald, L.L.; Cohen-Adad, J. In vivo mapping of human spinal cord microstructure at 300 mT/m. Neuroimage 2015, 118, 494–507. [Google Scholar] [CrossRef] [PubMed]
- De Luca, G.; Ebers, G.; Esiri, M.M. Axonal loss in multiple sclerosis: A pathological survey of the corticospinal and sensory tracts. Brain 2004, 127, 1009–1018. [Google Scholar] [CrossRef]
- Assaf, Y.; Alexander, D.C.; Jones, D.K.; Bizzi, A.; Behrens, T.E.; Clark, C.A.; Cohen, Y.; Dyrby, T.B.; Huppi, P.S.; Knoesche, T.R.; et al. The CONNECT project: Combining macro- and micro-structure. Neuroimage 2013, 80, 273–282. [Google Scholar] [CrossRef]
- Assaf, Y.; Basser, P.J. Composite hindered and restricted model of diffusion (CHARMED) MR imaging of the human brain. Neuroimage 2005, 27, 48–58. [Google Scholar] [CrossRef]
- Barazany, D.; Basser, P.J.; Assaf, Y. In vivo measurement of axon diameter distribution in the corpus callosum of rat brain. Brain 2009, 132, 1210–1220. [Google Scholar] [CrossRef]
- Horowitz, A.; Barazany, D.; Tavor, I.; Bernstein, M.; Yovel, G.; Assaf, Y. In vivo correlation between axon diameter and conduction velocity in the human brain. Anat. Embryol. 2014, 220, 1777–1788. [Google Scholar] [CrossRef] [PubMed]
- McNab, J.A.; Witzel, T.; Bhat, H.; Heberlein, K.; Keil, B.; Cohen-Adad, J.; Tisdall, M.D.; Wald, L.L. In Vivo Human Brain Measurements of Axon Diameter Distributions in the Corpus Callosum using 300 mT/m Maximum Gradient Strengths. In Proceedings of the ISMRM 20th Annual Meeting and Exhibition, Melbourne, Australia, 5–11 May 2012; Volume 1530. [Google Scholar]
- Huang, S.Y.; Fan, Q.; Machado, N.; Eloyan, A.; Bireley, J.; Russo, A.W.; Tobyne, S.M.; Patel, K.R.; Brewer, K.; Rapaport, S.F.; et al. Corpus callosum axon diameter relates to cognitive impairment in multiple sclerosis. Ann. Clin. Transl. Neurol. 2019, 6, 882–892. [Google Scholar] [CrossRef] [PubMed]
- Duval, T.; Smith, V.; Stikov, N.; Klawiter, E.C.; Cohen-Adad, J. Scan–rescan of axcaliber, macromolecular tissue volume, and g-ratio in the spinal cord. Magn. Reson. Med. 2018, 79, 2759–2765. [Google Scholar] [CrossRef]
- De Santis, S.; Herranz, E.; Treaba, C.A.; Barletta, V.; Mehndiratta, A.; Mainero, C.; Toschi, N. Whole brain in vivo axonal diameter mapping in multiple sclerosis. In Proceedings of the 2019 41st Annual International Conference of the IEEE Engineering in Medicine and Biology Society (EMBC), Berlin, Germany, 23–27 July 2019; pp. 204–207. [Google Scholar] [CrossRef]
- Huang, S.Y.; Tobyne, S.; Nummenmaa, A.; Witzel, T.; Wald, L.; McNab, J.A.; Klawiter, E.C. Characterization of Axonal Disease in Patients with Multiple Sclerosis Using High-Gradient-Diffusion MR Imaging. Radiology 2016, 280, 244–251. [Google Scholar] [CrossRef]
- Nedjati-Gilani, G.L.; Schneider, T.; Hall, M.G.; Cawley, N.; Hill, I.; Ciccarelli, O.; Drobnjak, I.; Wheeler-Kingshott, C.A.G.; Alexander, D.C. Machine learning based compartment models with permeability for white matter microstructure imaging. Neuroimage 2017, 150, 119–135. [Google Scholar] [CrossRef] [PubMed]
- Martin, M. Measuring Restriction Sizes Using Diffusion Weighted Magnetic Resonance Imaging: A Review. Magn. Reson. Insights 2013, 6, 59–64. [Google Scholar] [CrossRef]
- Xu, J. Probing neural tissues at small scales: Recent progress of oscillating gradient spin echo (OGSE) neuroimaging in humans. J. Neurosci. Methods 2021, 349, 109024. [Google Scholar] [CrossRef]
- Wu, Y.C.; Alexander, A.L. Hybrid diffusion imaging. Neuroimage 2007, 36, 617–629. [Google Scholar] [CrossRef]
- Mazur, W.; Krzyżak, A.T. Attempts at the Characterization of In-Cell Biophysical Processes Non-Invasively—Quantitative NMR Diffusometry of a Model Cellular System. Cells 2020, 9, 2124. [Google Scholar] [CrossRef]
- Franconi, F.; Lemaire, L.; Gimel, J.-C.; Bonnet, S.; Saulnier, P. NMR diffusometry: A new perspective for nanomedicine exploration. J. Control. Release 2021, 337, 155–167. [Google Scholar] [CrossRef] [PubMed]
- Babaeeghazvini, P.; Rueda-Delgado, L.M.; Gooijers, J.; Swinnen, S.P.; Daffertshofer, A. Brain Structural and Functional Connectivity: A Review of Combined Works of Diffusion Magnetic Resonance Imaging and Electro-Encephalography. Front. Hum. Neurosci. 2021, 15, 721206. [Google Scholar] [CrossRef] [PubMed]
- Shirani, A.; Sun, P.; Trinkaus, K.; Perantie, D.C.; George, A.; Naismith, R.T.; Schmidt, R.E.; Song, S.; Cross, A.H. Diffusion basis spectrum imaging for identifying pathologies in MS subtypes. Ann. Clin. Transl. Neurol. 2019, 6, 2323–2327. [Google Scholar] [CrossRef]
- Rubinov, M.; Sporns, O. Complex network measures of brain connectivity: Uses and interpretations. Neuroimage 2010, 52, 1059–1069. [Google Scholar] [CrossRef] [PubMed]
- Kamagata, K.; Zalesky, A.; Yokoyama, K.; Andica, C.; Hagiwara, A.; Shimoji, K.; Kumamaru, K.K.; Takemura, M.Y.; Hoshino, Y.; Kamiya, K.; et al. MR g-ratio-weighted connectome analysis in patients with multiple sclerosis. Sci. Rep. 2019, 9, 13522. [Google Scholar] [CrossRef]
- Charalambous, T.; Clayden, J.D.; Powell, E.; Prados, F.; Tur, C.; Kanber, B.; Chard, D.; Ourselin, S.; Wheeler-Kingshott, C.A.M.G.; Thompson, A.J.; et al. Disrupted principal network organisation in multiple sclerosis relates to disability. Sci. Rep. 2020, 10, 3620. [Google Scholar] [CrossRef]
Disclaimer/Publisher’s Note: The statements, opinions and data contained in all publications are solely those of the individual author(s) and contributor(s) and not of MDPI and/or the editor(s). MDPI and/or the editor(s) disclaim responsibility for any injury to people or property resulting from any ideas, methods, instructions or products referred to in the content. |
© 2023 by the author. Licensee MDPI, Basel, Switzerland. This article is an open access article distributed under the terms and conditions of the Creative Commons Attribution (CC BY) license (https://creativecommons.org/licenses/by/4.0/).