
Assessing Machine Learning Models for Predicting Age with Intracranial Vessel Tortuosity and Thickness Information


Abstract
:1. Introduction
2. Materials and Methods
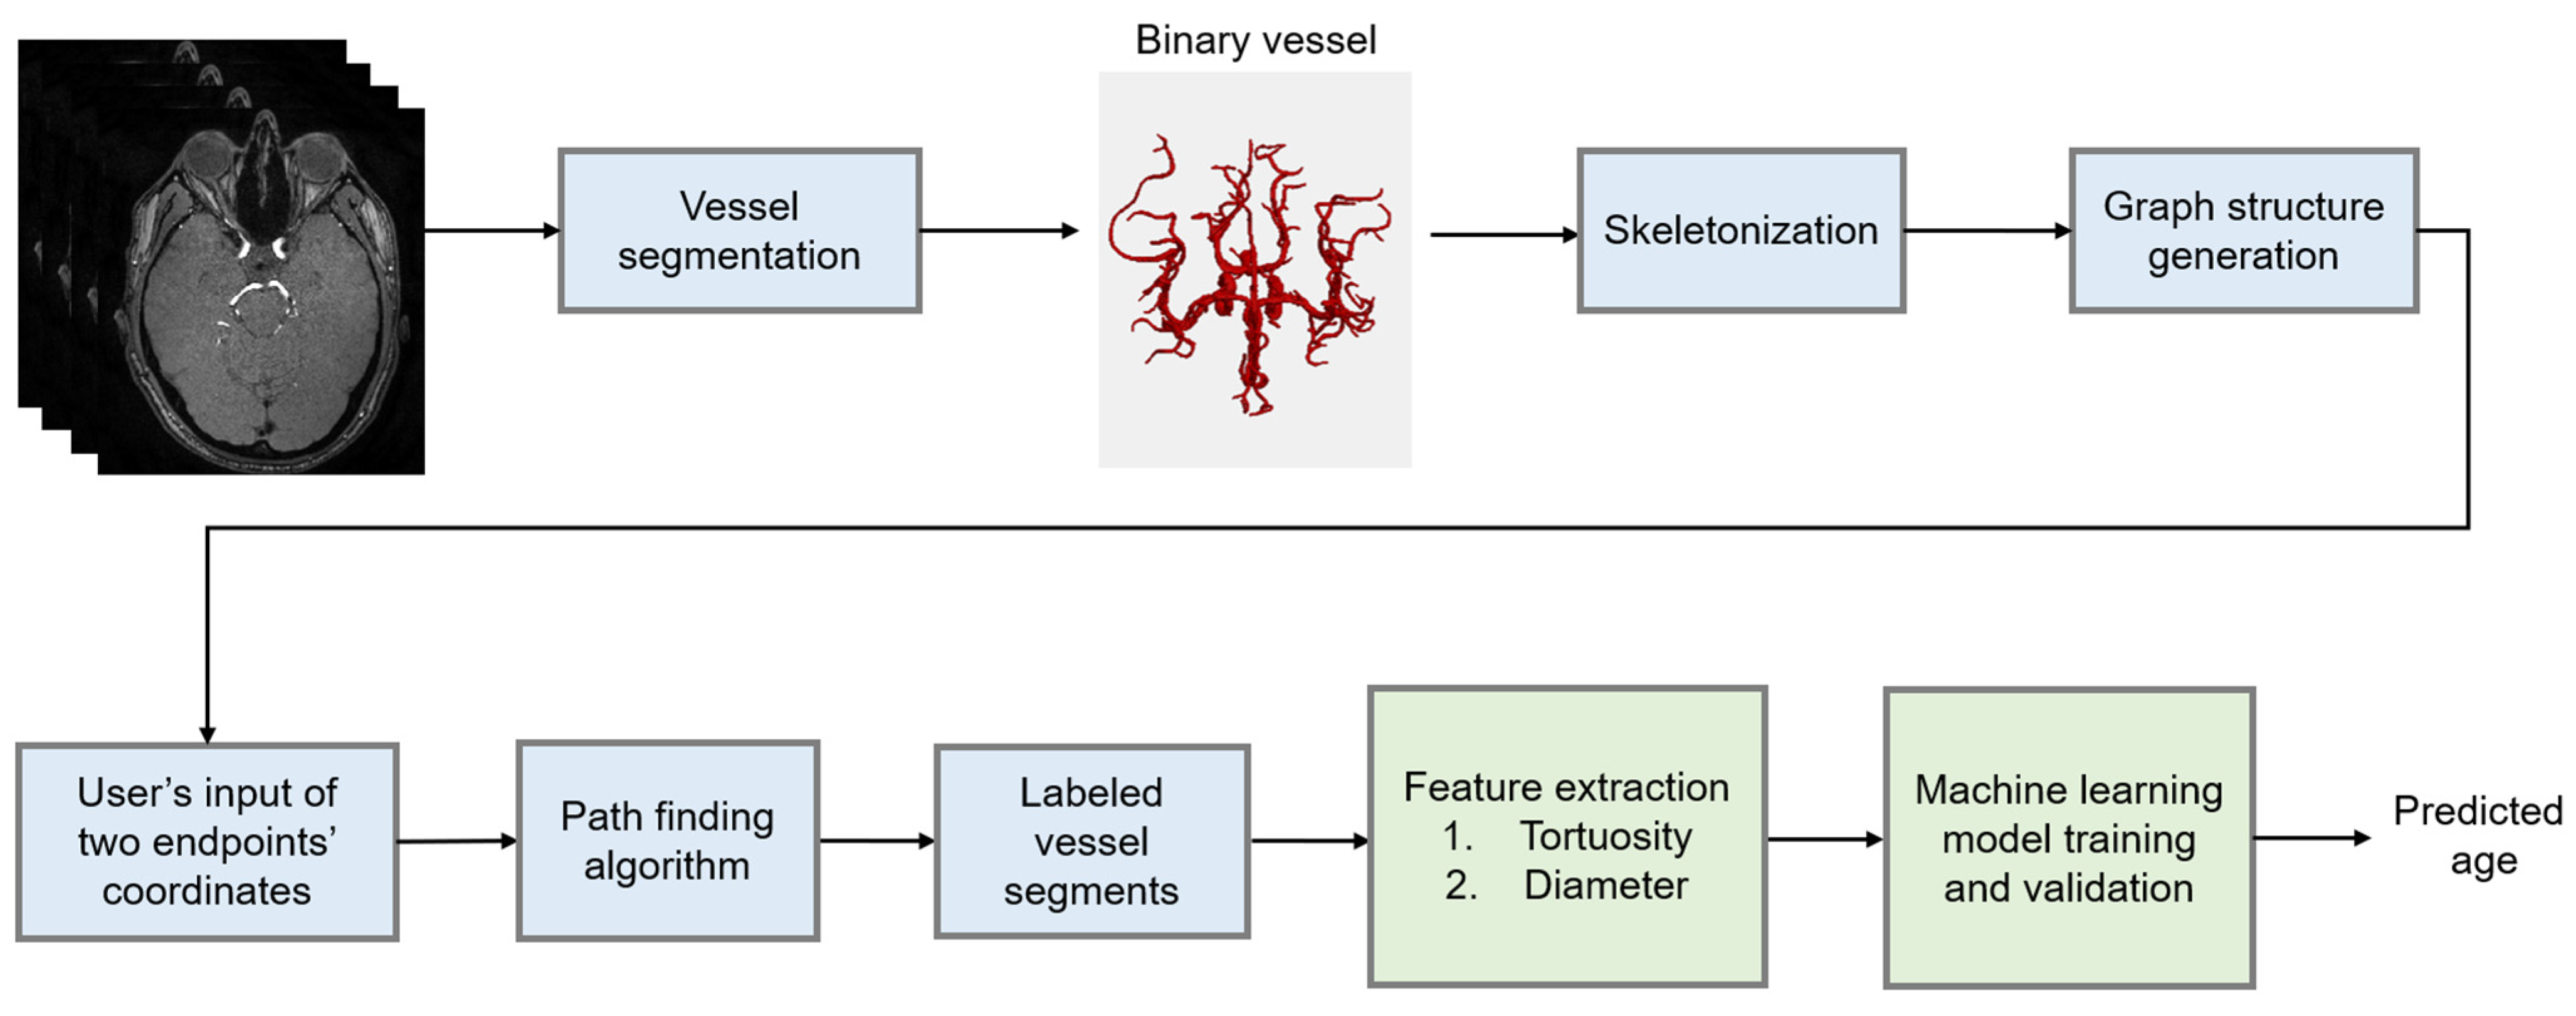
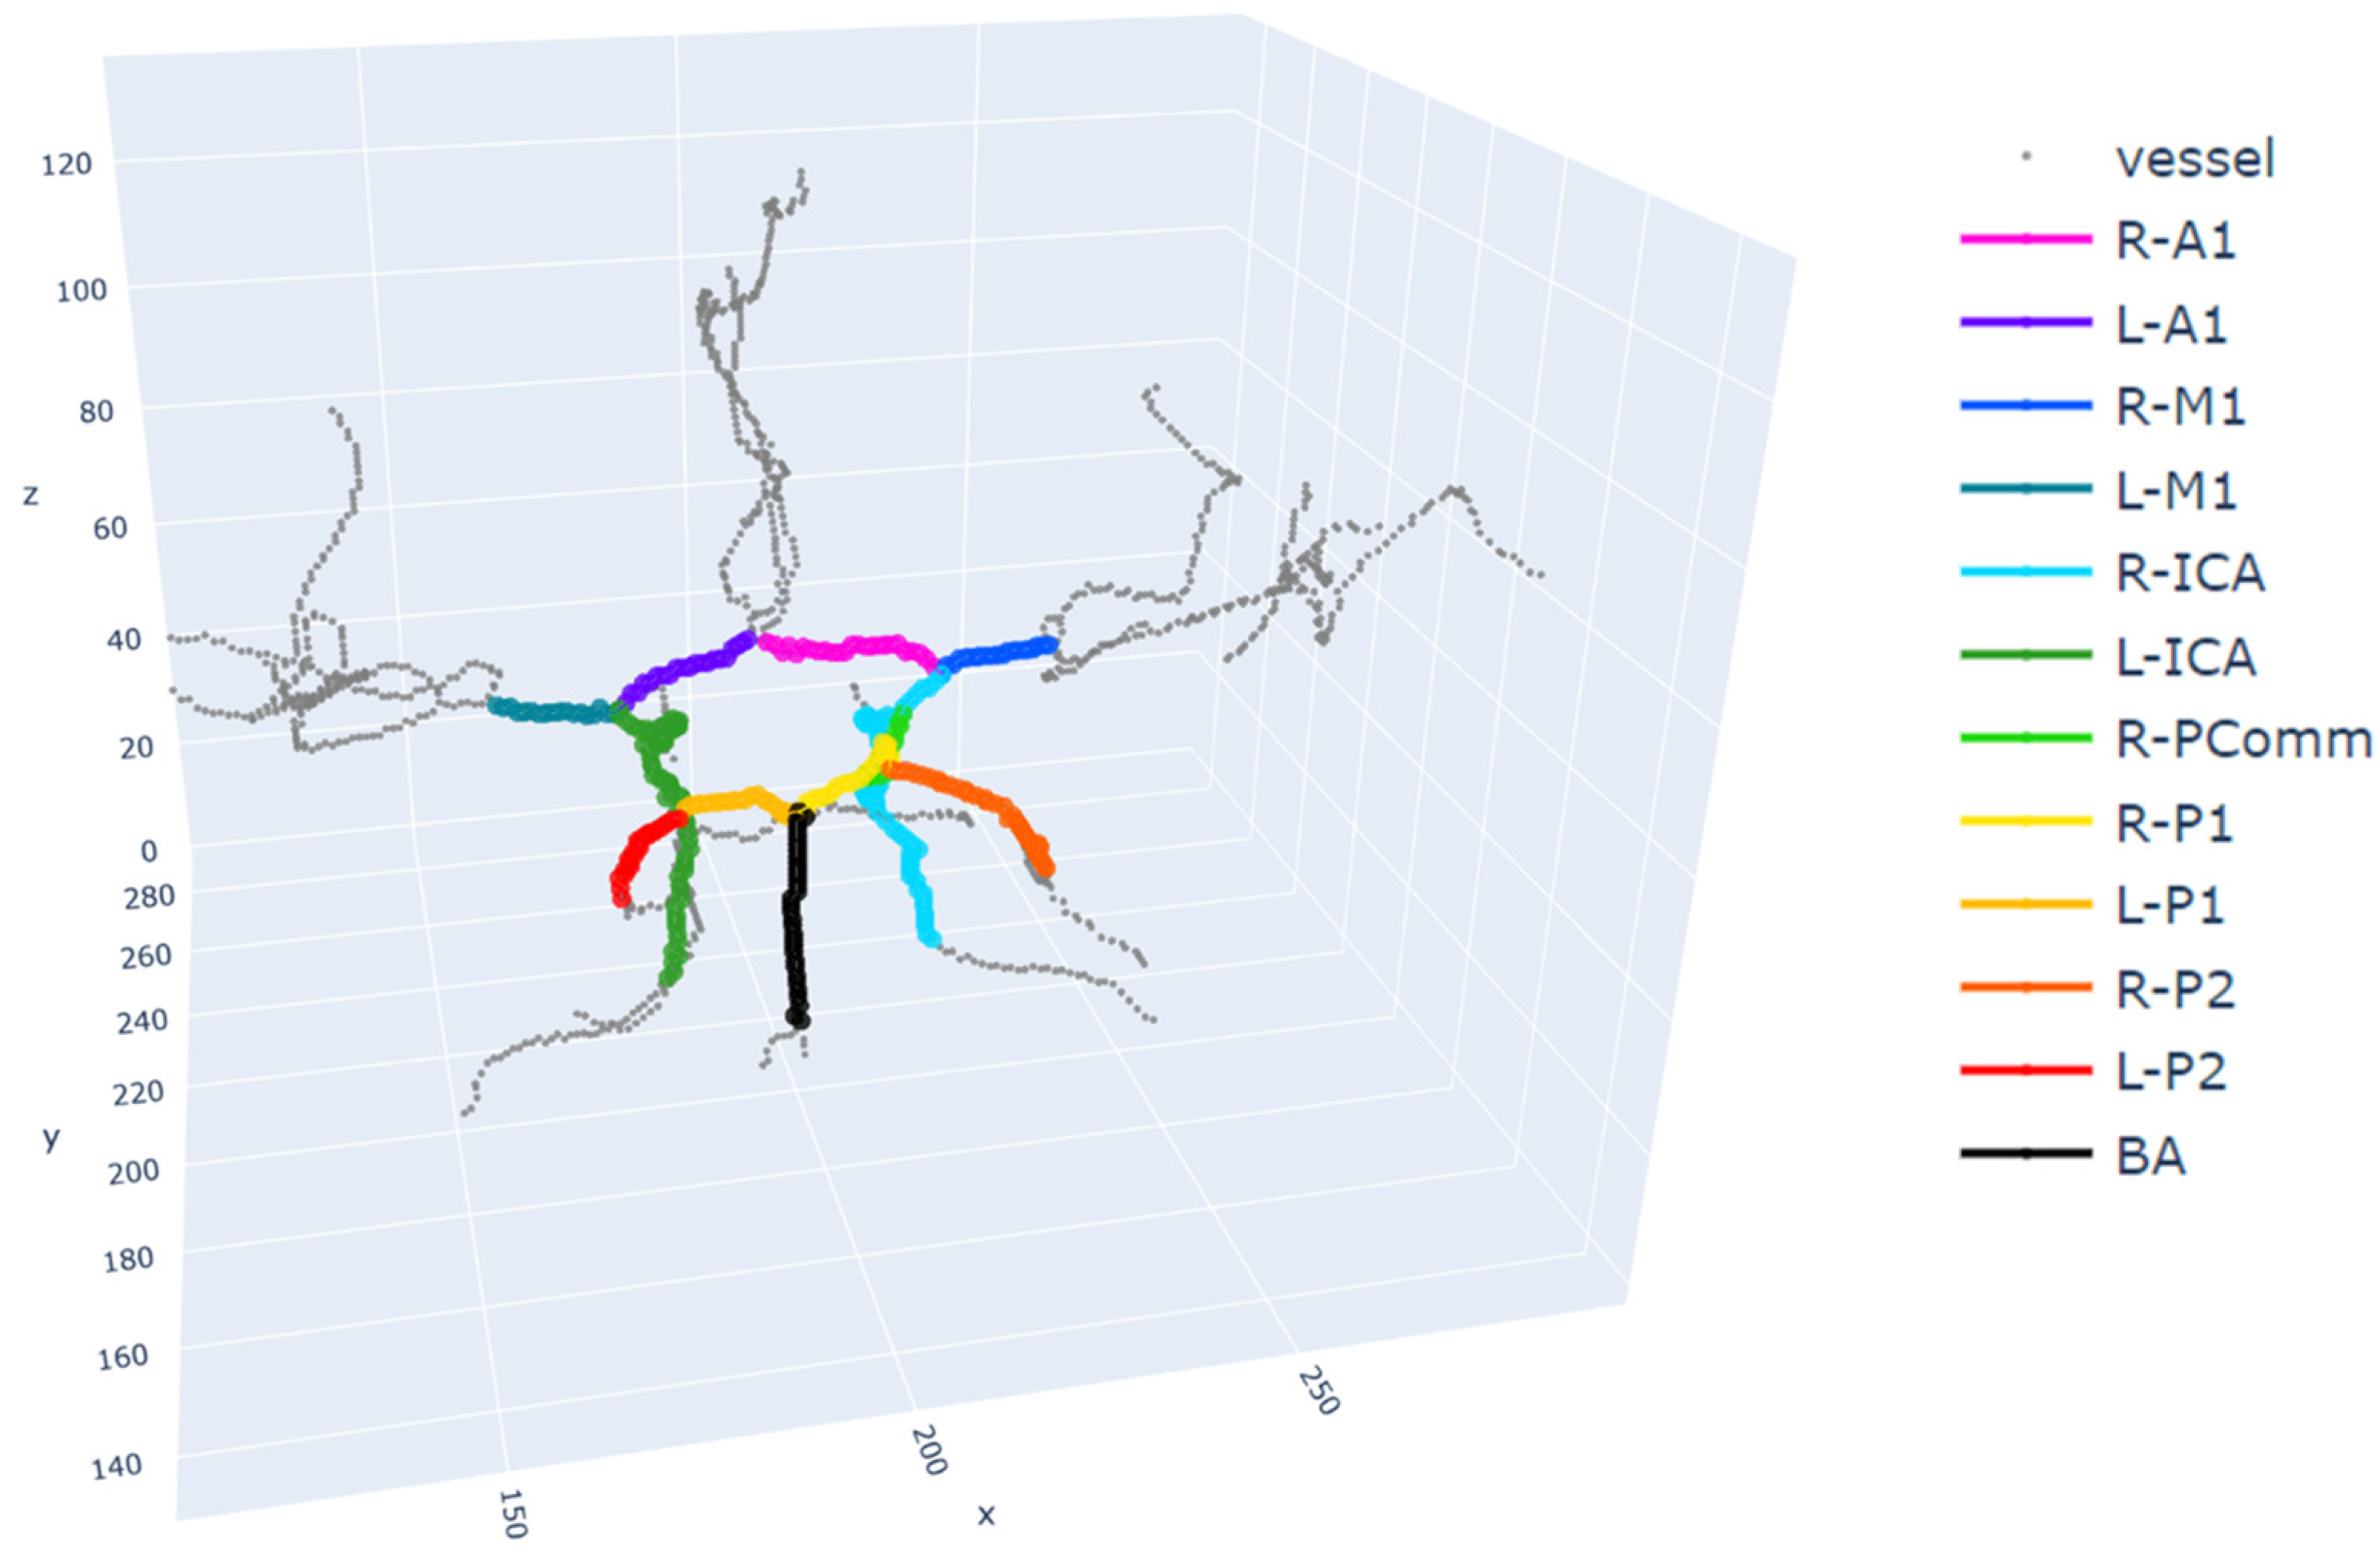
2.1. Data and Preprocessing
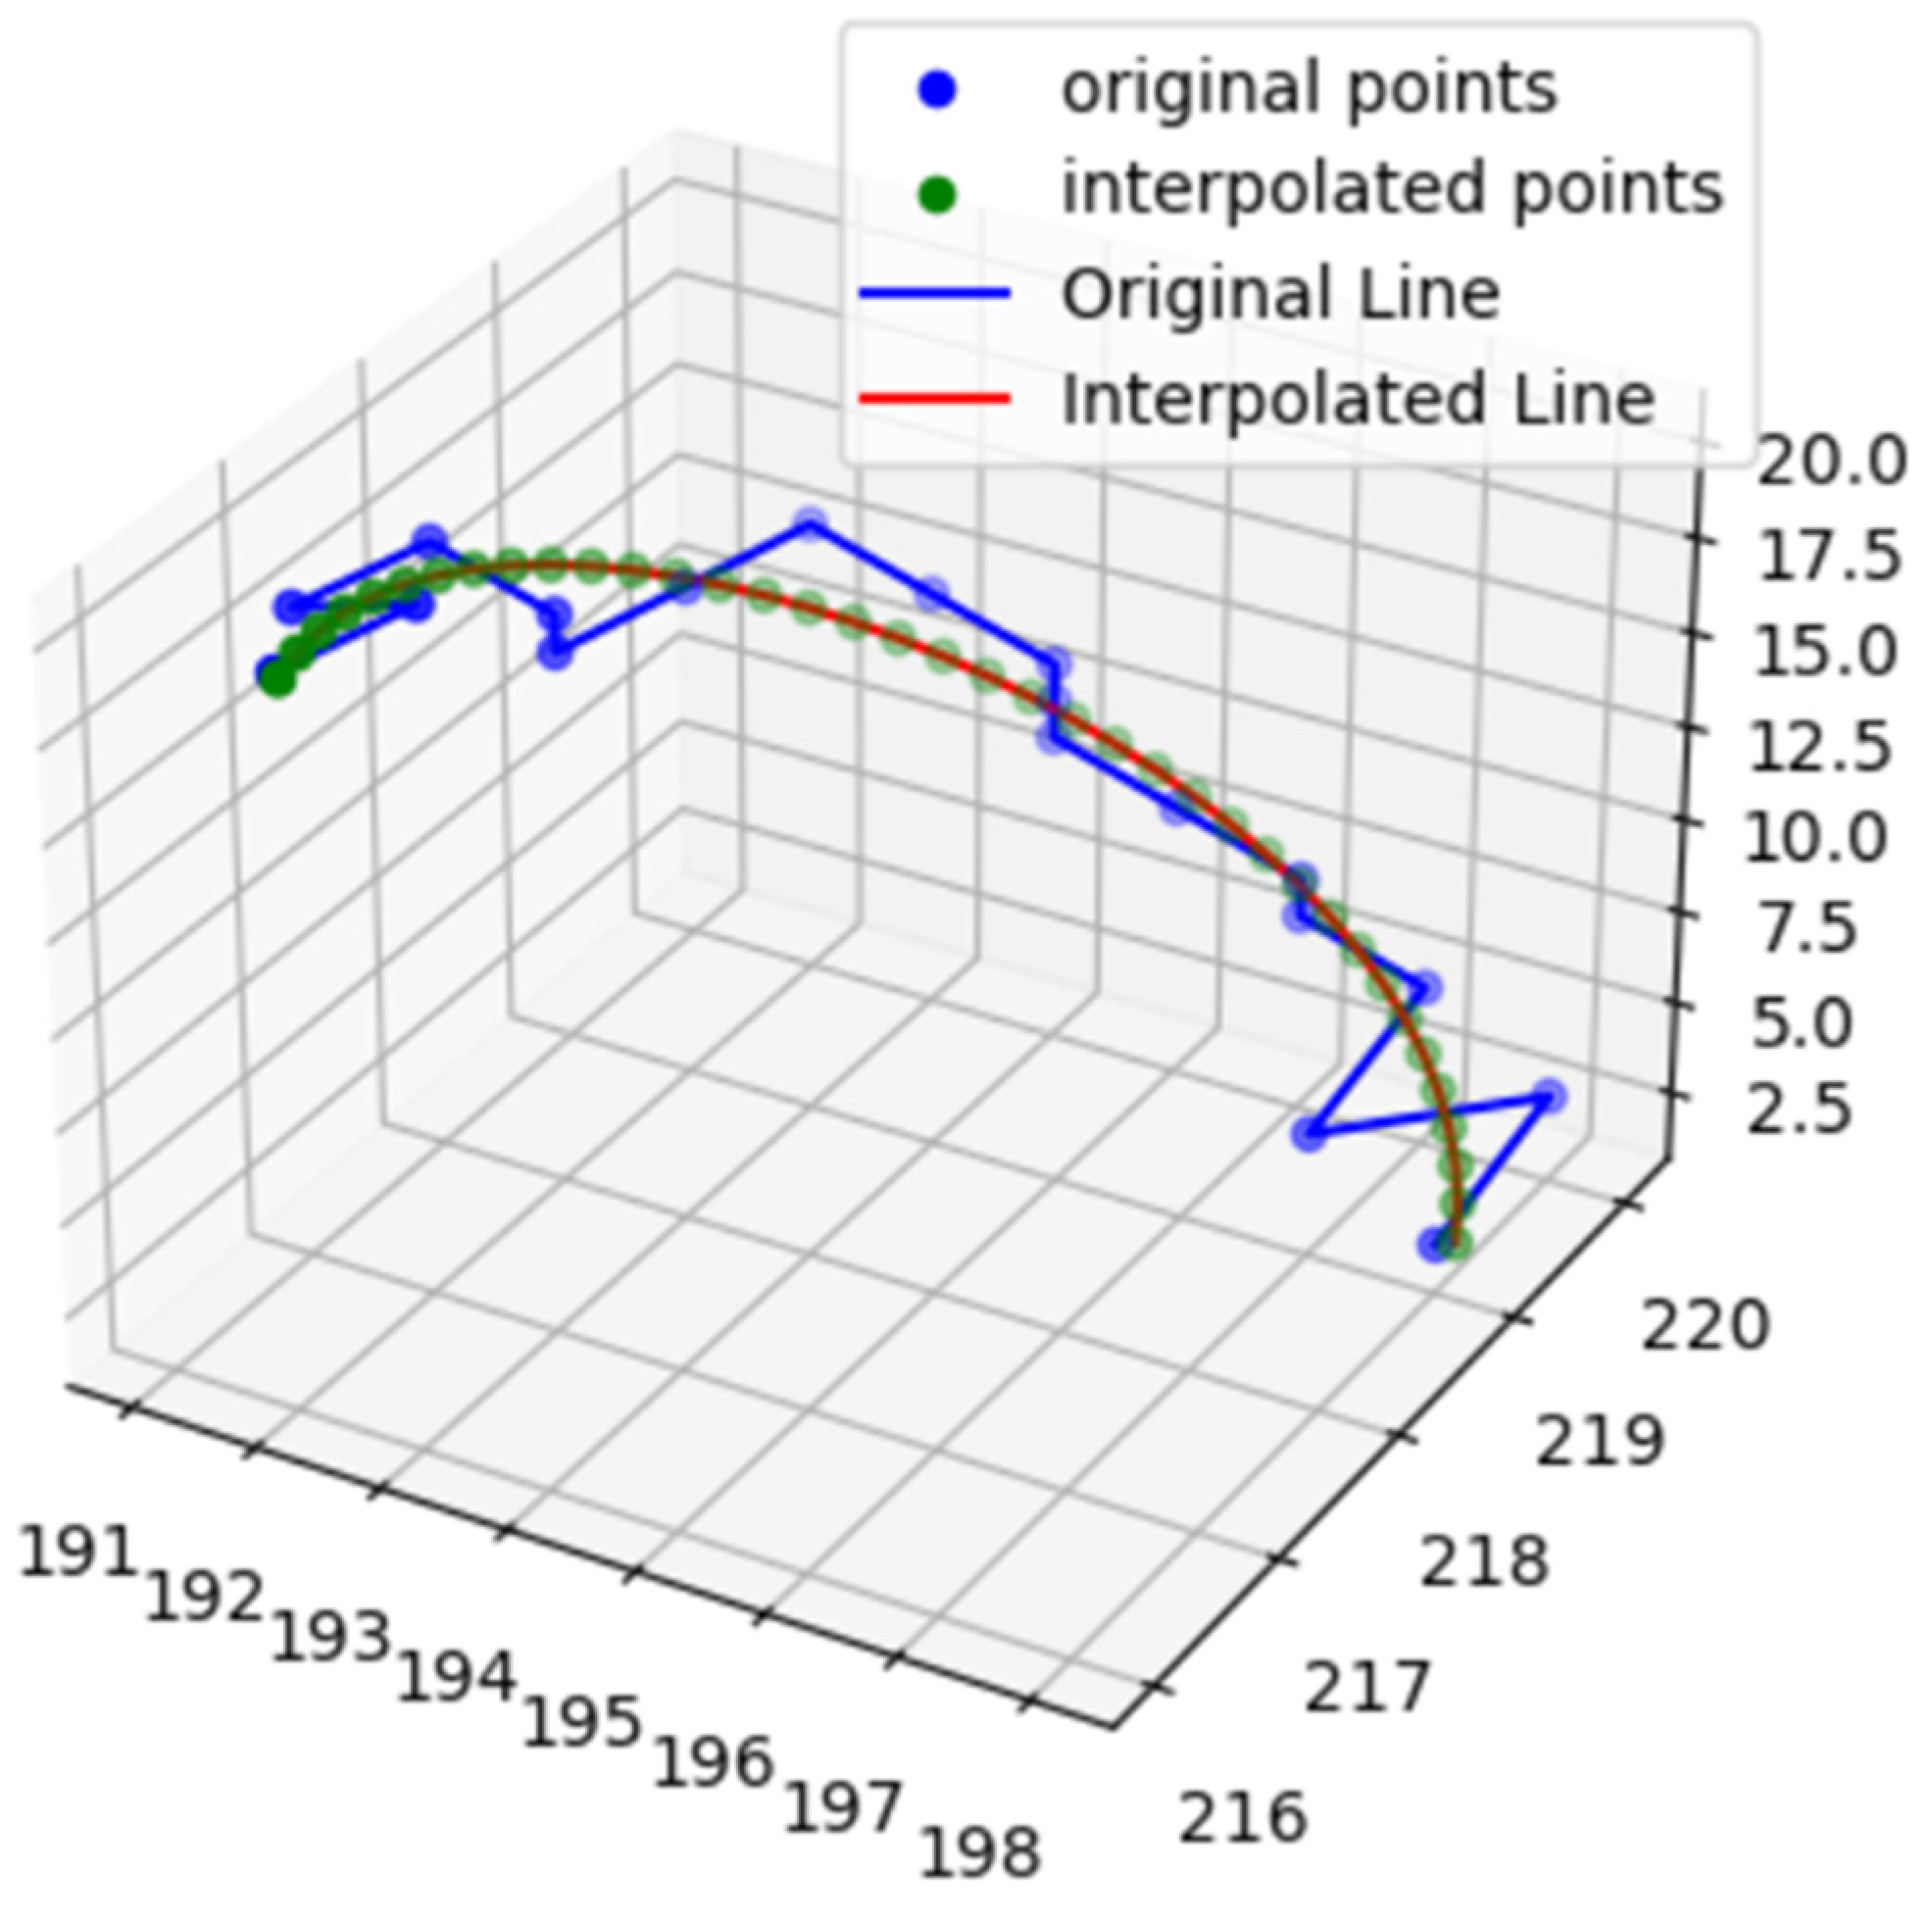
2.2. Feature Extraction
2.3. Model Development
2.3.1. Random Forest
2.3.2. Linear Regression
2.3.3. Bayesian Ridge Regression
2.3.4. AdaBoost
2.3.5. Gradient Boosting
2.3.6. XGBoost
2.3.7. Training and Validation
2.4. Evaluation
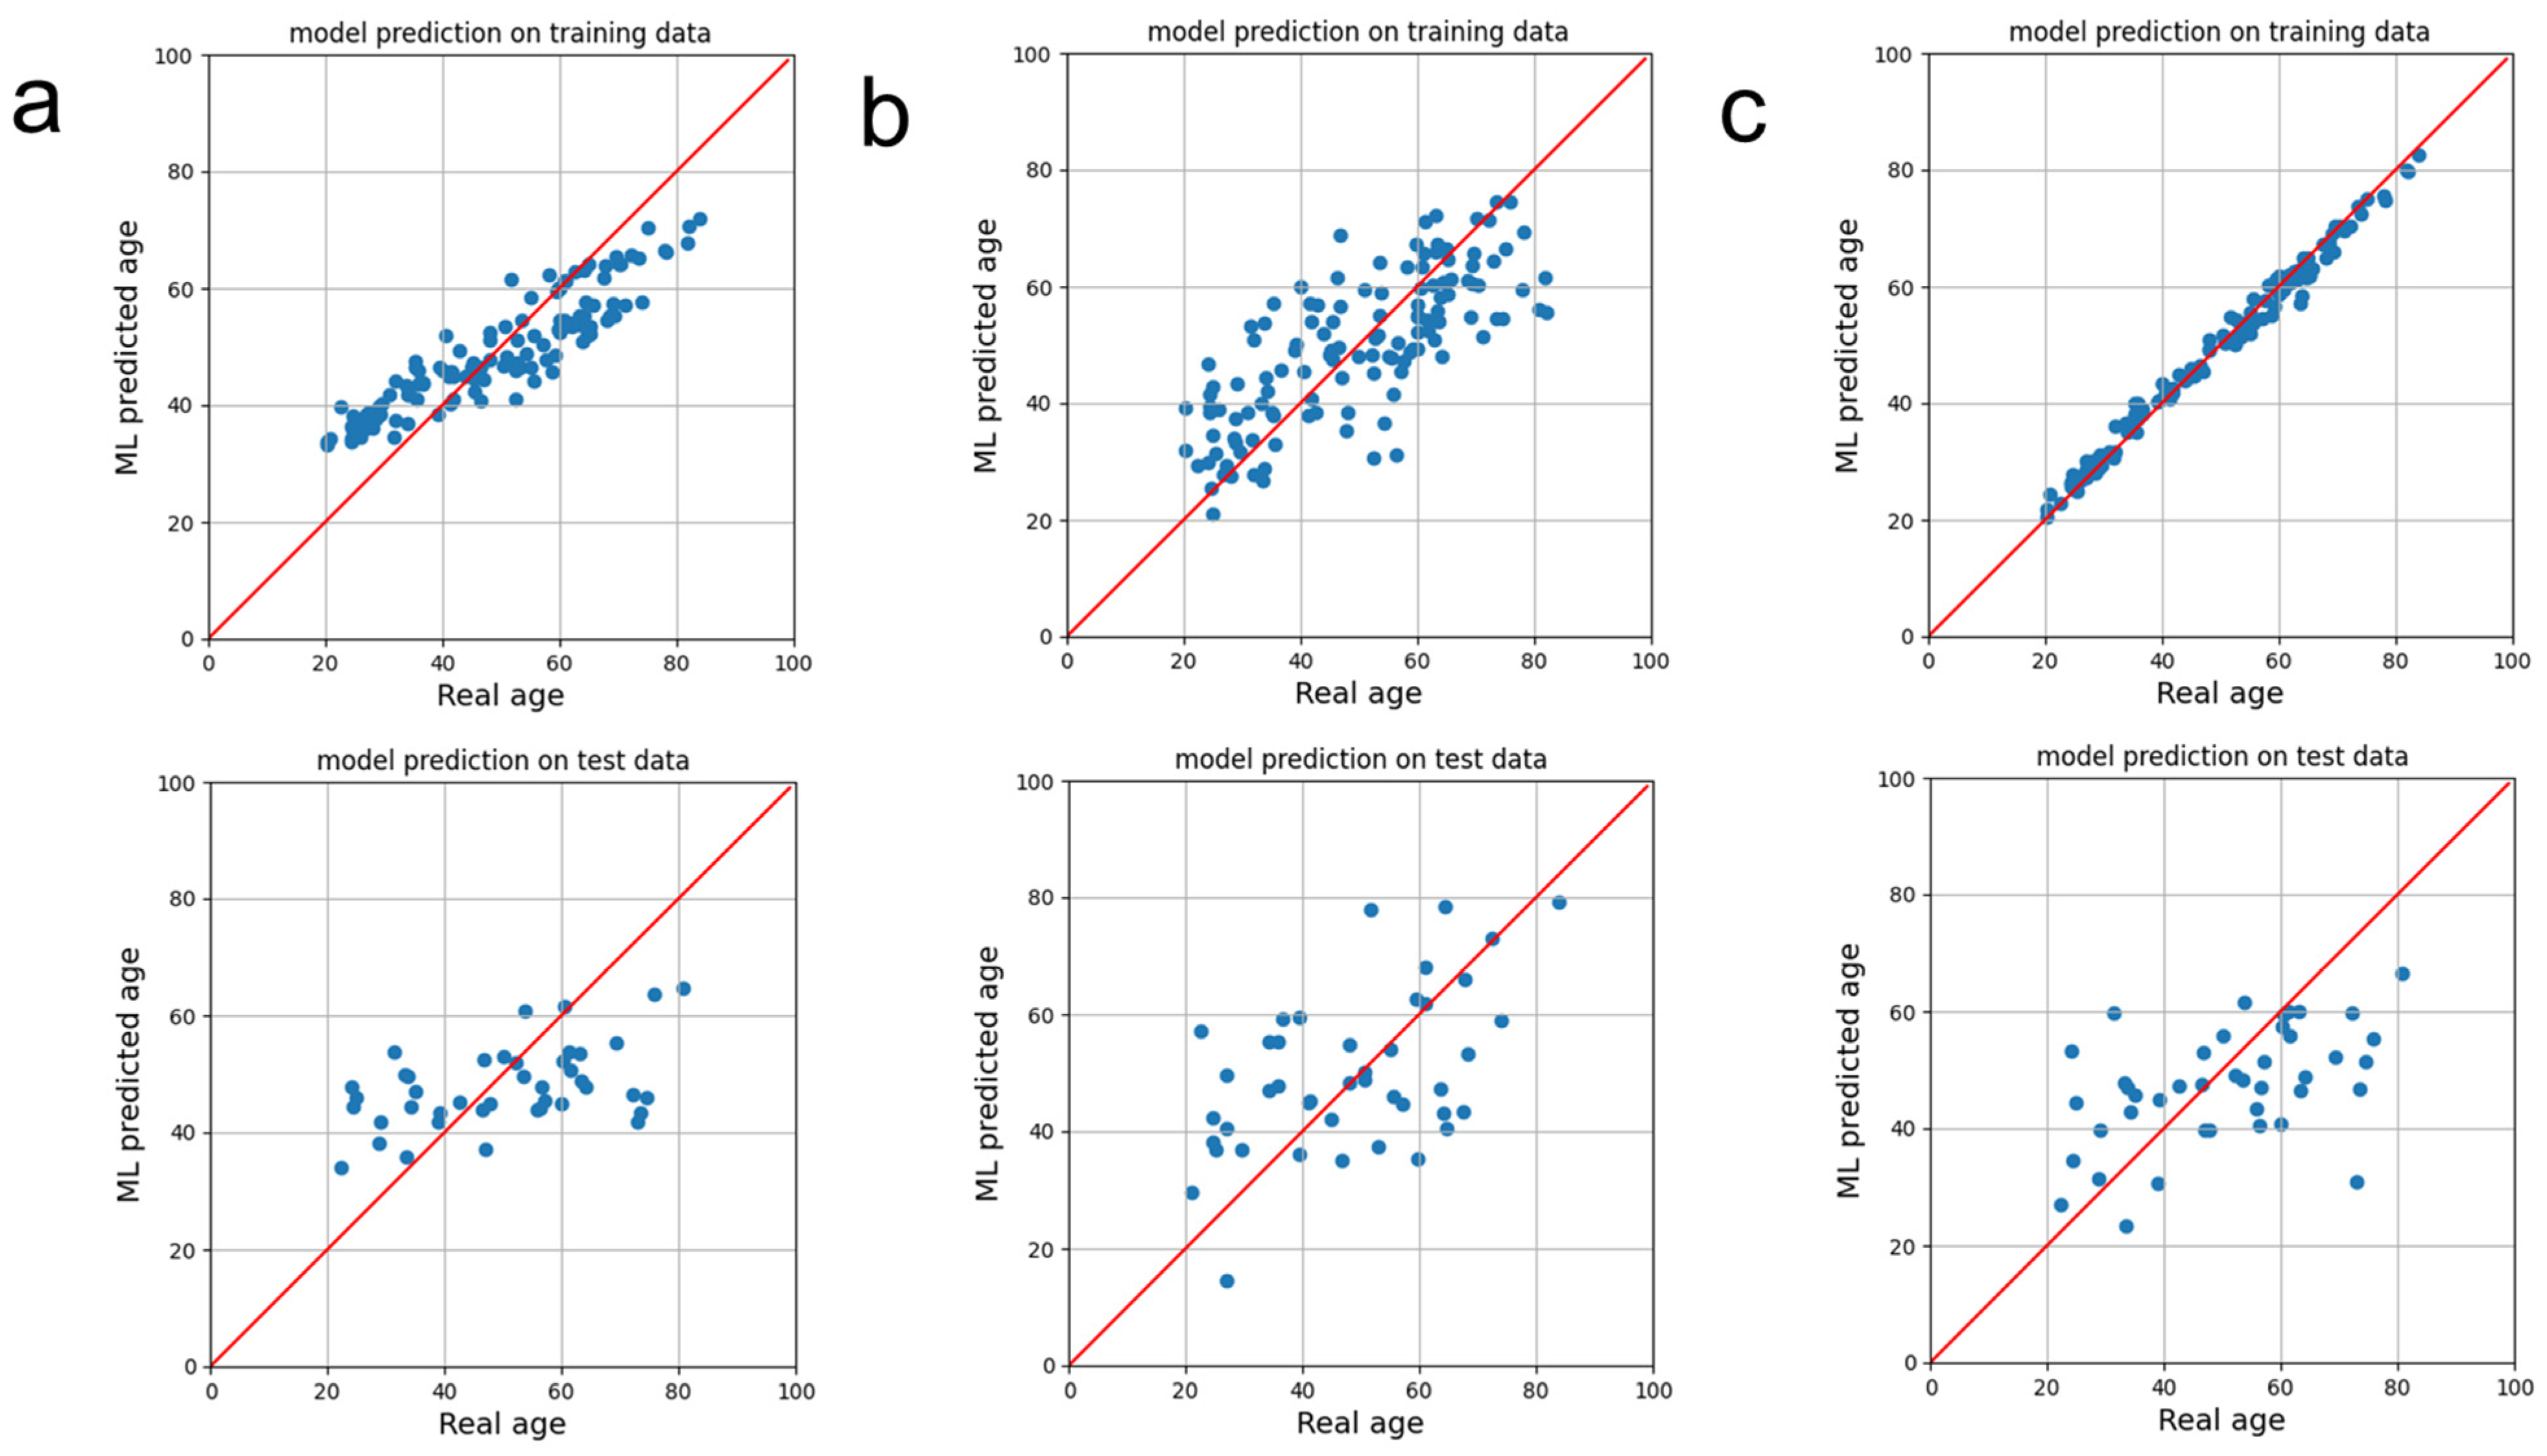
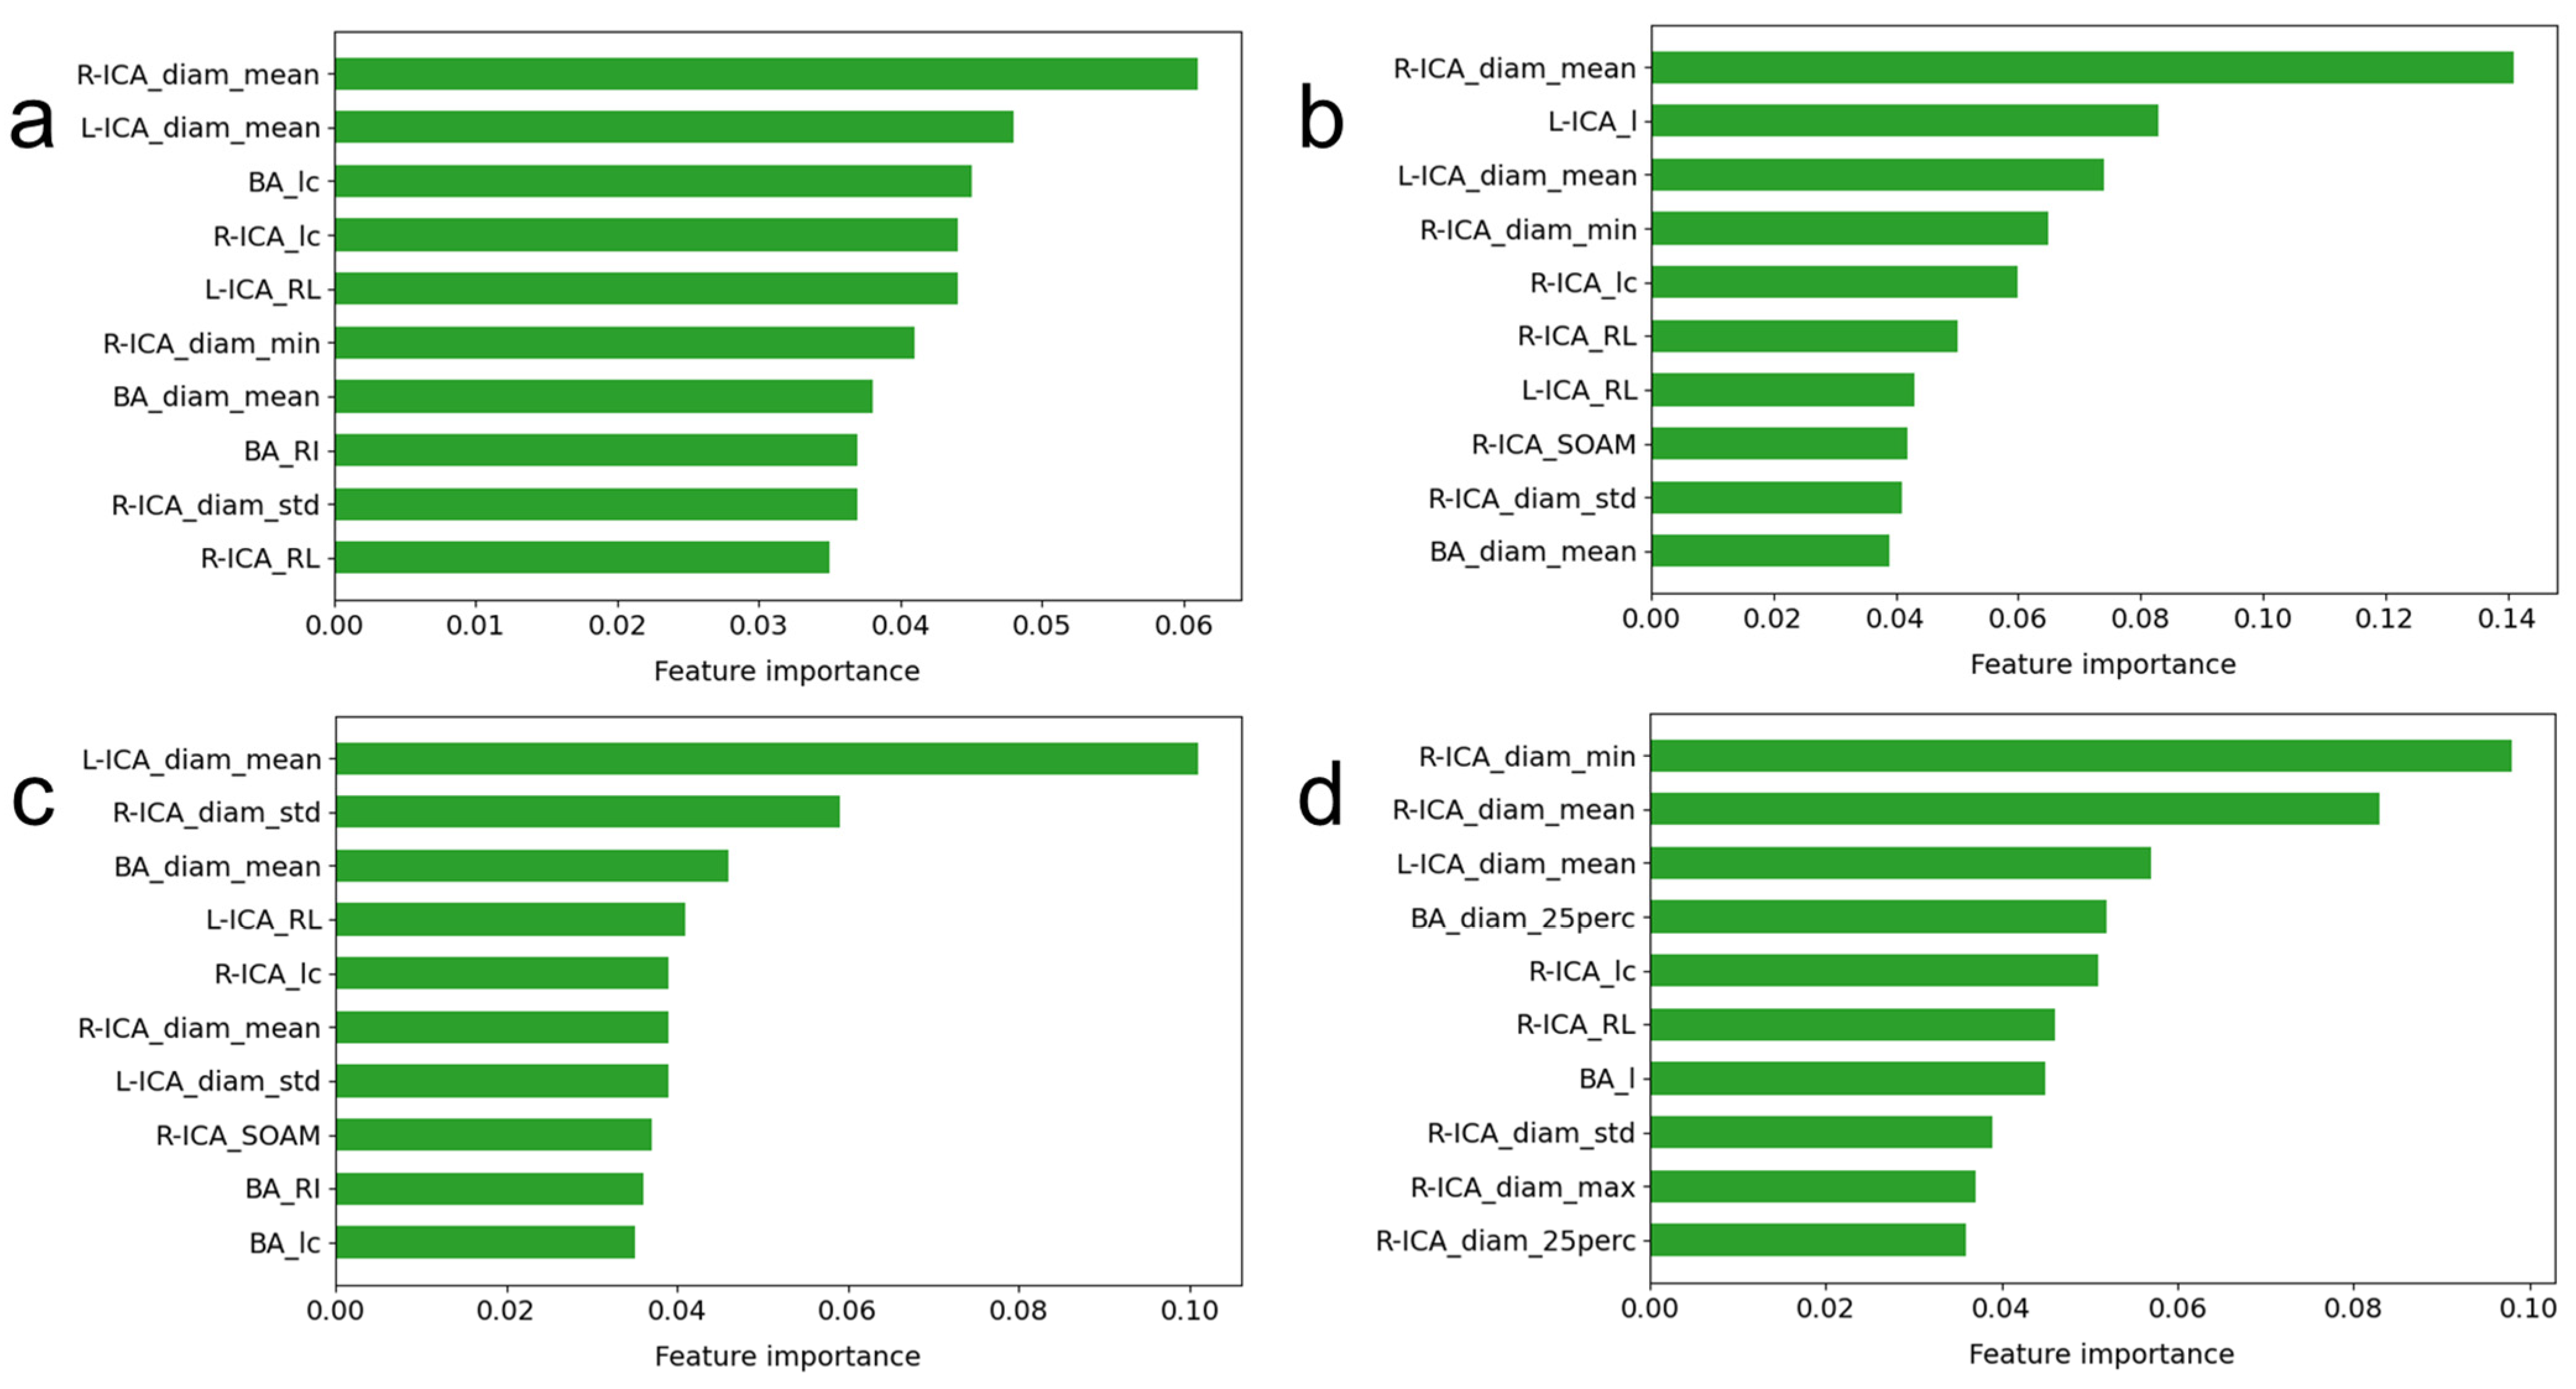
3. Results
4. Discussion
5. Conclusions
Author Contributions
Funding
Institutional Review Board Statement
Informed Consent Statement
Data Availability Statement
Conflicts of Interest
References
- Guillén, M.F. 2030: How Today’s Biggest Trends Will Collide and Reshape the Future of Everything; St. Martin’s Press: New York, NY, USA, 2020. [Google Scholar]
- Baecker, L.; Garcia-Dias, R.; Vieira, S.; Scarpazza, C.; Mechelli, A. Machine learning for brain age prediction: Introduction to methods and clinical applications. eBioMedicine 2021, 72, 103600. [Google Scholar] [CrossRef]
- MacDonald, M.E.; Pike, G.B. MRI of healthy brain aging: A review. NMR Biomed. 2021, 34, e4564. [Google Scholar] [CrossRef]
- Hepp, T.; Blum, D.; Armanious, K.; Scholkopf, B.; Stern, D.; Yang, B.; Gatidis, S. Uncertainty estimation and explainability in deep learning-based age estimation of the human brain: Results from the German National Cohort MRI study. Comput. Med. Imaging Graph. 2021, 92, 101967. [Google Scholar] [CrossRef]
- Sajedi, H.; Pardakhti, N. Age Prediction Based on Brain MRI Image: A Survey. J. Med. Syst. 2019, 43, 279. [Google Scholar] [CrossRef]
- He, S.; Pereira, D.; David Perez, J.; Gollub, R.L.; Murphy, S.N.; Prabhu, S.; Pienaar, R.; Robertson, R.L.; Ellen Grant, P.; Ou, Y. Multi-channel attention-fusion neural network for brain age estimation: Accuracy, generality, and interpretation with 16,705 healthy MRIs across lifespan. Med. Image Anal. 2021, 72, 102091. [Google Scholar] [CrossRef]
- De Lange, A.G.; Anaturk, M.; Suri, S.; Kaufmann, T.; Cole, J.H.; Griffanti, L.; Zsoldos, E.; Jensen, D.E.A.; Filippini, N.; Singh-Manoux, A.; et al. Multimodal brain-age prediction and cardiovascular risk: The Whitehall II MRI sub-study. NeuroImage 2020, 222, 117292. [Google Scholar] [CrossRef]
- Peng, H.; Gong, W.; Beckmann, C.F.; Vedaldi, A.; Smith, S.M. Accurate brain age prediction with lightweight deep neural networks. Med. Image Anal. 2021, 68, 101871. [Google Scholar] [CrossRef]
- Hussein, M.K. Comparison of various machine learning regression models based on Human age prediction. Wasit J. Eng. Sci. 2022, 10, 1–16. [Google Scholar] [CrossRef]
- Bermudez, C.; Plassard, A.J.; Chaganti, S.; Huo, Y.; Aboud, K.S.; Cutting, L.E.; Resnick, S.M.; Landman, B.A. Anatomical context improves deep learning on the brain age estimation task. Magn. Reson. Imaging 2019, 62, 70–77. [Google Scholar] [CrossRef]
- Cherubini, A.; Caligiuri, M.E.; Peran, P.; Sabatini, U.; Cosentino, C.; Amato, F. Importance of Multimodal MRI in Characterizing Brain Tissue and Its Potential Application for Individual Age Prediction. IEEE J. Biomed. Health Inform. 2016, 20, 1232–1239. [Google Scholar] [CrossRef]
- Hofmann, S.M.; Beyer, F.; Lapuschkin, S.; Goltermann, O.; Loeffler, M.; Muller, K.R.; Villringer, A.; Samek, W.; Witte, A.V. Towards the interpretability of deep learning models for multi-modal neuroimaging: Finding structural changes of the ageing brain. NeuroImage 2022, 261, 119504. [Google Scholar] [CrossRef] [PubMed]
- Jiang, H.; Lu, N.; Chen, K.; Yao, L.; Li, K.; Zhang, J.; Guo, X. Predicting Brain Age of Healthy Adults Based on Structural MRI Parcellation Using Convolutional Neural Networks. Front. Neurol. 2019, 10, 1346. [Google Scholar] [CrossRef] [PubMed]
- Ciurica, S.; Lopez-Sublet, M.; Loeys, B.L.; Radhouani, I.; Natarajan, N.; Vikkula, M.; Maas, A.; Adlam, D.; Persu, A. Arterial Tortuosity. Hypertension 2019, 73, 951–960. [Google Scholar] [CrossRef] [PubMed]
- Hyvarinen, S. Arteriographic findings of claudication patients. Ann. Clin. Res. 1984, 16 (Suppl. 41), 1–45. [Google Scholar]
- Del Corso, L.; Moruzzo, D.; Conte, B.; Agelli, M.; Romanelli, A.M.; Pastine, F.; Protti, M.; Pentimone, F.; Baggiani, G. Tortuosity, kinking, and coiling of the carotid artery: Expression of atherosclerosis or aging? Angiology 1998, 49, 361–371. [Google Scholar] [CrossRef]
- Bullitt, E.; Zeng, D.; Mortamet, B.; Ghosh, A.; Aylward, S.R.; Lin, W.; Marks, B.L.; Smith, K. The effects of healthy aging on intracerebral blood vessels visualized by magnetic resonance angiography. Neurobiol. Aging 2010, 31, 290–300. [Google Scholar] [CrossRef] [PubMed]
- Xu, X.; Wang, B.; Ren, C.; Hu, J.; Greenberg, D.A.; Chen, T.; Xie, L.; Jin, K. Age-related Impairment of Vascular Structure and Functions. Aging Dis. 2017, 8, 590–610. [Google Scholar] [CrossRef]
- Wright, S.N.; Kochunov, P.; Mut, F.; Bergamino, M.; Brown, K.M.; Mazziotta, J.C.; Toga, A.W.; Cebral, J.R.; Ascoli, G.A. Digital reconstruction and morphometric analysis of human brain arterial vasculature from magnetic resonance angiography. NeuroImage 2013, 82, 170–181. [Google Scholar] [CrossRef]
- Nam, Y.; Jang, J.; Lee, H.Y.; Choi, Y.; Shin, N.Y.; Ryu, K.H.; Kim, D.H.; Jung, S.L.; Ahn, K.J.; Kim, B.S. Estimating age-related changes in in vivo cerebral magnetic resonance angiography using convolutional neural network. Neurobiol. Aging 2020, 87, 125–131. [Google Scholar] [CrossRef]
- Mouches, P.; Wilms, M.; Rajashekar, D.; Langner, S.; Forkert, N.D. Multimodal biological brain age prediction using magnetic resonance imaging and angiography with the identification of predictive regions. Hum. Brain Mapp. 2022, 43, 2554–2566. [Google Scholar] [CrossRef]
- Diedrich, K.T. Arterial Tortuosity Measurement System for Examining Correlations with Vascular Disease; The University of Utah: Salt Lake City, UT, USA, 2011. [Google Scholar]
- Chen, L.; Mossa-Basha, M.; Balu, N.; Canton, G.; Sun, J.; Pimentel, K.; Hatsukami, T.S.; Hwang, J.N.; Yuan, C. Development of a quantitative intracranial vascular features extraction tool on 3D MRA using semiautomated open-curve active contour vessel tracing. Magn. Reson. Med. 2018, 79, 3229–3238. [Google Scholar] [CrossRef] [PubMed]
- Van der Walt, S.; Schönberger, J.L.; Nunez-Iglesias, J.; Boulogne, F.; Warner, J.D.; Yager, N.; Gouillart, E.; Yu, T. Scikit-image: Image processing in Python. PeerJ 2014, 2, e453. [Google Scholar] [CrossRef] [PubMed]
- Kim, S.O.; Kim, Y.C. Effects of Path-Finding Algorithms on the Labeling of the Centerlines of Circle of Willis Arteries. Tomography 2023, 9, 1423–1433. [Google Scholar] [CrossRef] [PubMed]
- Virtanen, P.; Gommers, R.; Oliphant, T.E.; Haberland, M.; Reddy, T.; Cournapeau, D.; Burovski, E.; Peterson, P.; Weckesser, W.; Bright, J.; et al. SciPy 1.0: Fundamental algorithms for scientific computing in Python. Nat. Methods 2020, 17, 261–272, Correction to Nat. Methods 2020, 17, 352. [Google Scholar] [CrossRef] [PubMed]
- Pedregosa, F.; Varoquaux, G.; Gramfort, A.; Michel, V.; Thirion, B.; Grisel, O.; Blondel, M.; Prettenhofer, P.; Weiss, R.; Dubourg, V. Scikit-learn: Machine learning in Python. J. Mach. Learn. Res. 2011, 12, 2825–2830. [Google Scholar]
- Breiman, L. Random forests. Mach. Learn. 2001, 45, 5–32. [Google Scholar] [CrossRef]
- Hastie, T.; Tibshirani, R.; Friedman, J.H.; Friedman, J.H. The Elements of Statistical Learning: Data Mining, Inference, and Prediction; Springer: Berlin/Heidelberg, Germany, 2009; Volume 2. [Google Scholar]
- Bishop, C.M.; Nasrabadi, N.M. Pattern Recognition and Machine Learning; Springer: Berlin/Heidelberg, Germany, 2006; Volume 4. [Google Scholar]
- Freund, Y. An adaptive version of the boost by majority algorithm. Mach. Learn. 2001, 43, 293–318. [Google Scholar] [CrossRef]
- Chen, T.Q.; Guestrin, C. XGBoost: A Scalable Tree Boosting System. In Proceedings of the KDD’16: 22nd ACM SIGKDD International Conference on Knowledge Discovery and Data Mining, San Francisco, CA, USA, 13–17 August 2016; pp. 785–794. [Google Scholar] [CrossRef]
- Bergstra, J.; Bengio, Y. Random Search for Hyper-Parameter Optimization. J. Mach. Learn. Res. 2012, 13, 281–305. [Google Scholar]
- Hunter, J.D. Matplotlib: A 2D graphics environment. Comput. Sci. Eng. 2007, 9, 90–95. [Google Scholar] [CrossRef]
- Bullitt, E.; Rahman, F.N.; Smith, J.K.; Kim, E.; Zeng, D.; Katz, L.M.; Marks, B.L. The effect of exercise on the cerebral vasculature of healthy aged subjects as visualized by MR angiography. Am. J. Neuroradiol. 2009, 30, 1857–1863. [Google Scholar] [CrossRef]
- Simfukwe, C.; Youn, Y.C. Prediction of East Asian Brain Age using Machine Learning Algorithms Trained with Community-based Healthy Brain MRI. Dement. Neurocogn. Disord. 2022, 21, 138–146. [Google Scholar] [CrossRef] [PubMed]
- Nouri, A.; Autrusseau, F.; Bourcier, R.; Gaignard, A.; L’Allinec, V.; Menguy, C.; Veziers, J.; Desal, H.; Loirand, G.; Redon, R. Characterization of 3D bifurcations in micro-scan and MRA-TOF images of cerebral vasculature for prediction of intra-cranial aneurysms. Comput. Med. Imaging Graph. 2020, 84, 101751. [Google Scholar] [CrossRef] [PubMed]
- Kim, Y.C.; Lee, J.E.; Yu, I.; Song, H.N.; Baek, I.Y.; Seong, J.K.; Jeong, H.G.; Kim, B.J.; Nam, H.S.; Chung, J.W.; et al. Evaluation of Diffusion Lesion Volume Measurements in Acute Ischemic Stroke Using Encoder-Decoder Convolutional Network. Stroke 2019, 50, 1444–1451. [Google Scholar] [CrossRef] [PubMed]
- Heydarheydari, S.; Birgani, M.J.T.; Rezaeijo, S.M. Auto-segmentation of head and neck tumors in positron emission tomography images using non-local means and morphological frameworks. Pol. J. Radiol. 2023, 88, e365–e370. [Google Scholar] [CrossRef] [PubMed]
- Ardakani, A.A.; Bureau, N.J.; Ciaccio, E.J.; Acharya, U.R. Interpretation of radiomics features—A pictorial review. Comput. Methods Programs Biomed. 2022, 215, 106609. [Google Scholar] [CrossRef] [PubMed]
- Choi, Y.S.; Bae, S.; Chang, J.H.; Kang, S.G.; Kim, S.H.; Kim, J.; Rim, T.H.; Choi, S.H.; Jain, R.; Lee, S.K. Fully automated hybrid approach to predict the IDH mutation status of gliomas via deep learning and radiomics. Neuro Oncol. 2021, 23, 304–313. [Google Scholar] [CrossRef]
- Kim, Y.C.; Kim, H.J.; Chung, J.W.; Kim, I.G.; Seong, M.J.; Kim, K.H.; Jeon, P.; Nam, H.S.; Seo, W.K.; Kim, G.M.; et al. Novel Estimation of Penumbra Zone Based on Infarct Growth Using Machine Learning Techniques in Acute Ischemic Stroke. J. Clin. Med. 2020, 9, 1977. [Google Scholar] [CrossRef]
- Salmanpour, M.R.; Hosseinzadeh, M.; Rezaeijo, S.M.; Rahmim, A. Fusion-based tensor radiomics using reproducible features: Application to survival prediction in head and neck cancer. Comput. Methods Programs Biomed. 2023, 240, 107714. [Google Scholar] [CrossRef]
- Lundberg, S.M.; Lee, S.I. A Unified Approach to Interpreting Model Predictions. In Proceedings of the NIPS’17: Proceedings of the 31st International Conference on Neural Information Processing Systems, Long Beach, CA, USA, 4–9 December 2017; Volume 30. [Google Scholar]
- Wang, K.; Hong, T.; Liu, W.; Xu, C.; Yin, C.; Liu, H.; Wei, X.; Wu, S.N.; Li, W.; Rong, L. Development and validation of a machine learning-based prognostic risk stratification model for acute ischemic stroke. Sci. Rep. 2023, 13, 13782. [Google Scholar] [CrossRef]
- Liu, Y.C.; Liu, Z.H.; Luo, X.; Zhao, H.J.T. Diagnosis of Parkinson’s disease based on SHAP value feature selection. Biocybern. Biomed. Eng. 2022, 42, 856–869. [Google Scholar] [CrossRef]
- Oh, S.; Park, Y.; Cho, K.J.; Kim, S.J. Explainable Machine Learning Model for Glaucoma Diagnosis and Its Interpretation. Diagnostics 2021, 11, 510. [Google Scholar] [CrossRef] [PubMed]

| Feature Name | Description | Illustration |
|---|---|---|
| Curve length () | The length along the curve | 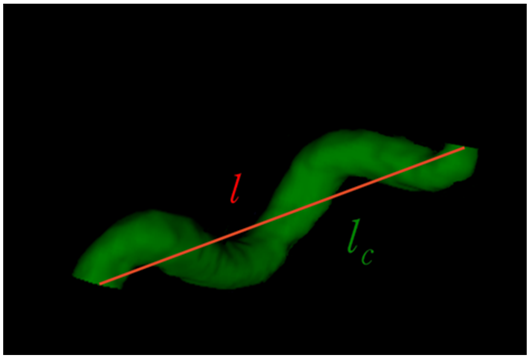 |
| Euclidean length () | The distance between starting and ending points of the curve | |
| Relative length () | ||
| Sum of angle metrics () | : the angle between two adjacent lines connecting the center and two endpoints for the ith center | 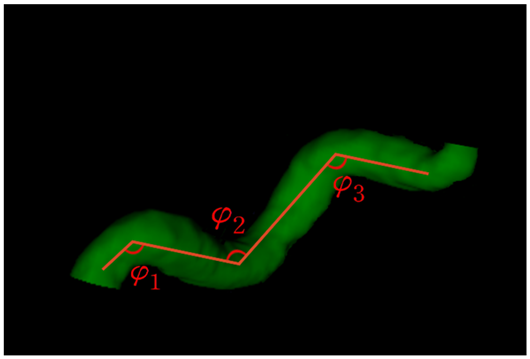 |
| Product of angle distance () | ||
| Triangular index () |  |
| Regression Model | Hyperparameter |
|---|---|
| Random forest regression | n_estimators = 74, max_depth = 14, min_samples_leaf = 2, min_samples_split = 6, max_features = ‘sqrt’, criterion = ‘absolute_error’ |
| AdaBoost regression | learning_rate = 0.07, loss = ‘exponential’, and n_estimators = 163 |
| Gradient boosting regression | criterion = ‘friedman_mse’, learning_rate = 0.11, loss = ‘absolute_error’, max_depth = 15, n_estimator = 198, and tol = 0.003 |
| Bayesian ridge regression | alpha_1 = 0.0004, alpha_2 = 1 × 10⁻⁶, alpha_init = 10, lambda_1 = 1 × 10⁻⁵, and Tol = 0.01 |
| XGBoost regression | colsample_bytree = 0.95, gamma = 0.22, learning_rate = 0.30, max_depth = 4, n_estimators = 138, and subsample = 0.84 |
| Regression Model | Root Mean Squared Error (RMSE) | R2 | Mean Absolute Percentage Error (MAPE) | Pearson Correlation Coefficient |
|---|---|---|---|---|
| Random forest regression | 14.867 ± 0.515 | 0.186 ± 0.031 | 0.319 ± 0.022 | 0.459 ± 0.058 |
| Linear regression | 15.000 ± 1.032 | 0.162 ± 0.140 | 0.290 ± 0.015 | 0.532 ± 0.067 |
| AdaBoost regression | 14.965 ± 0.496 | 0.175 ± 0.029 | 0.315 ± 0.023 | 0.438 ± 0.044 |
| Gradient boosting regression | 15.554 ± 1.478 | 0.106 ± 0.136 | 0.320 ± 0.034 | 0.357 ± 0.163 |
| Bayesian ridge regression | 16.009 ± 0.419 | 0.055 ± 0.041 | 0.347 ± 0.018 | 0.258 ± 0.089 |
| XGBoost regression | 15.207 ± 0.905 | 0.148 ± 0.062 | 0.312 ± 0.031 | 0.456 ± 0.072 |
Disclaimer/Publisher’s Note: The statements, opinions and data contained in all publications are solely those of the individual author(s) and contributor(s) and not of MDPI and/or the editor(s). MDPI and/or the editor(s) disclaim responsibility for any injury to people or property resulting from any ideas, methods, instructions or products referred to in the content. |
© 2023 by the authors. Licensee MDPI, Basel, Switzerland. This article is an open access article distributed under the terms and conditions of the Creative Commons Attribution (CC BY) license (https://creativecommons.org/licenses/by/4.0/).
Share and Cite
Yoon, H.-S.; Oh, J.; Kim, Y.-C. Assessing Machine Learning Models for Predicting Age with Intracranial Vessel Tortuosity and Thickness Information. Brain Sci. 2023, 13, 1512. https://doi.org/10.3390/brainsci13111512
Yoon H-S, Oh J, Kim Y-C. Assessing Machine Learning Models for Predicting Age with Intracranial Vessel Tortuosity and Thickness Information. Brain Sciences. 2023; 13(11):1512. https://doi.org/10.3390/brainsci13111512
Chicago/Turabian StyleYoon, Hoon-Seok, Jeongmin Oh, and Yoon-Chul Kim. 2023. "Assessing Machine Learning Models for Predicting Age with Intracranial Vessel Tortuosity and Thickness Information" Brain Sciences 13, no. 11: 1512. https://doi.org/10.3390/brainsci13111512
APA StyleYoon, H.-S., Oh, J., & Kim, Y.-C. (2023). Assessing Machine Learning Models for Predicting Age with Intracranial Vessel Tortuosity and Thickness Information. Brain Sciences, 13(11), 1512. https://doi.org/10.3390/brainsci13111512