Abstract
The increasing number of MRI studies focused on prodromal Parkinson’s Disease (PD) demonstrates a strong interest in identifying early biomarkers capable of monitoring neurodegeneration. In this systematic review, we present the latest information regarding the most promising MRI markers of neurodegeneration in relation to the most specific prodromal symptoms of PD, namely isolated rapid eye movement (REM) sleep behavior disorder (iRBD). We reviewed structural, diffusion, functional, iron-sensitive, neuro-melanin-sensitive MRI, and proton magnetic resonance spectroscopy studies conducted between 2000 and 2023, which yielded a total of 77 relevant papers. Among these markers, iron and neuromelanin emerged as the most robust and promising indicators for early neurodegenerative processes in iRBD. Atrophy was observed in several regions, including the frontal and temporal cortices, limbic cortices, and basal ganglia, suggesting that neurodegenerative processes had been underway for some time. Diffusion and functional MRI produced heterogeneous yet intriguing results. Additionally, reduced glymphatic clearance function was reported. Technological advancements, such as the development of ultra-high field MRI, have enabled the exploration of minute anatomical structures and the detection of previously undetectable anomalies. The race to achieve early detection of neurodegeneration is well underway.
1. Introduction
Despite tremendous improvement in the diagnosis and management of patients with Parkinson’s disease (PD), this disease remains incurable. In an attempt to limit the progression of neurodegeneration, many innovative treatments are being developed and tested, such as immunotherapy, gene therapy, and drug repurposing [1]. However, these therapies can only be offered to PD patients with motor symptoms because clinical examination is the only reliable marker able to assess their efficacy.
It is therefore urgent to develop early biomarkers able to identify neurodegeneration before the onset of motor symptoms and offer premotor patients a dedicated treatment. Moreover, these biomarkers are expected to reflect the stability or worsening of neurodegeneration during the trial of innovative treatments.
The onset of motor symptoms occurs many years after the commencement of the neurodegenerative process and about 30% of nigrostriatal synaptic activity is already lost [2]. During the premotor phase, several clinical symptoms are associated with a significant risk of developing in the following years a synucleinopathy (a group of neurodegenerative diseases including PD, dementia with Lewy bodies (DLB), and multiple system atrophy (MSA)). These include, in particular, isolated rapid eye movement (REM) sleep behavior disorder (iRBD), hyposmia, and constipation [3]. Instead, late-onset depression is classified as a low-risk factor for prodromal PD with low sensitivity and specificity because of the lack of dedicated studies [3].
Brain imaging showed promising results toward the goal of identifying early biomarkers of neurodegeneration in high-risk patients. For example, positron emission tomography (PET)/single-photon emission computed tomography (SPECT) imaging of striatal membrane dopamine transporters (DAT) revealed a dopaminergic deficit in approximately 50% of patients with idiopathic/isolated RBD (iRBD) [4]. Moreover, leucine-rich kinase 2 (LRRK2) non-manifesting carriers had reduced DAT binding compared with noncarriers [5]. Alternatively, metaiodobenzylguanidine (MIBG) myocardial scintigraphy in patients having at least two symptoms among constipation/iRBD/orthostatic hypotension, revealed abnormal results in 94% of cases [4]. Nevertheless, each of these techniques is very specific to a nervous system pathway and cannot evaluate different parameters at the same time (in the present example, it was the nigrostriatal dysfunction or the cardiac sympathetic nervous system). Furthermore, their availability is sometimes still difficult for the general population. As an alternative, brain MRI is potentially a multimodal technique to investigate prodromal PD. Interestingly, technical development of brain MRI in recent years, made it possible to explore very small anatomical structures and to reveal previously undetectable anomalies, especially in PD [6].
To identify promising biomarkers reflecting neurodegeneration in the premotor stage of synucleinopathies, we conducted a systematic review of the literature regarding MRI abnormalities at prodromal disease stages, especially in patients without any sign of parkinsonism but having iRBD.
2. Materials and Methods
To achieve this aim, we adopted the relevant criteria of the preferred reporting items for systematic reviews and meta-analyses (PRISMA) [7]. In June 2023, we conducted a literature search via the MEDLINE (PubMed) and Google Scholar databases of articles related to structural and functional MRI studies in prodromal PD. The following MRI modalities were considered for the review: structural, diffusion, functional, iron-sensitive, neuromelanin-sensitive MRI, and proton magnetic resonance spectroscopy. We used the combination of the following terms: “magnetic resonance imaging (MRI)” + “prodromal PD” or “premotor PD” or “preclinical PD” or “prodromal synucleinopathy” or “premotor synucleinopathy” or “preclinical synucleinopathy” or “non-motor” or “idiopathic RBD” or “isolated RBD” + “Parkinson” or “voxel based morphometry” or “cortical thickness” or “subcortical volume” or “relaxometry” or “iron” or “Quantitative Susceptibility Mapping” or “QSM” or “susceptibility weighted imaging” or “SWI” or “T2*” or “R2*” or “neuromelanin” or “diffusion tensor imaging” or “spectroscopy” or and “functional MRI” filtered for the period from 2000 to 2023. After removing duplicates, as well as screening the titles, abstracts, and/or full texts for suitability, we selected 77 studies and excluded 5169 studies. Details of the steps of the database search are given in Figure 1.
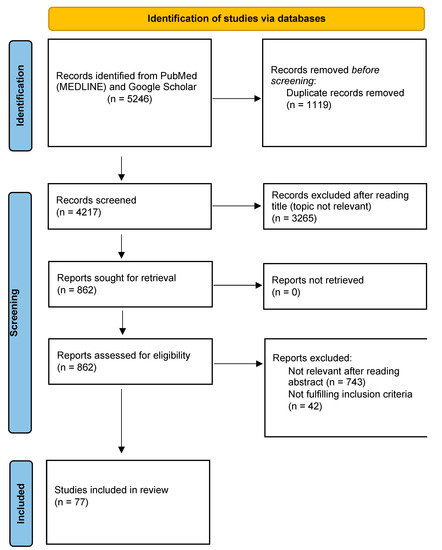
Figure 1.
PRISMA flow diagram describing the steps of database search.
Specifically, the following criteria were applied for inclusion in the review: (1) English full text available; (2) original articles or case–control studies that included patients with iRBD; (3) iRBD diagnosis confirmed by video-polysomnography; (4) MRI studies, and (5) absence of motor sign of parkinsonism or not meeting the criteria for PD diagnosis.
To reduce the risk of omitting a report, the search was conducted twice at 6-month intervals and the bibliography was carefully evaluated by all authors. This study was not registered in PROSPERO (International prospective register of systematic reviews).
Appendix A.1 briefly describes the different MRI modalities used in the studies we report. Readers can refer to it for a better understanding of the image processing methods used.
3. Results
3.1. iRBD as a Prodromal Marker of Synucleinopathy
According to the International Classification of Sleep Disorders 3rd Edition, rapid eye movement (REM) sleep behavior disorder (RBD) is a parasomnia manifested by vivid, often frightening dreams accompanied by simple or complex motor behaviors during REM sleep [8]. The diagnosis is confirmed with polysomnography. RBD presents with a persistent muscle tone during REM sleep, resulting in either sustained (tonic) excessive activity during REM sleep in the chin EMG, intermittent (phasic) excessive activity during REM sleep in the chin or limb EMG, or both [8]. Idiopathic (or isolated) RBD (iRBD) is an established early manifestation of neurodegenerative disease, i.e., synucleinopathy [9]. Indeed, in 174 patients diagnosed with video polysomnography-confirmed iRBD, the estimated risk of a neurodegenerative syndrome was 33.1% five years after the diagnosis of iRBD, 75.7% after 10 years, and 90.9% after 14 years [10]. Moreover, reduced striatal DAT signaling was reported in patients with iRBD, with gradually increasing loss of tracer uptake across the continuum from iRBD to PD [11]. Nevertheless, it is important to know that dream enactment behavior may also be observed in narcolepsy [12], autoimmune diseases (including IgLON5-antibody), or brainstem lesions [13], as well as with certain medications, mostly selective serotonin or serotonin-norepinephrine reuptake inhibitors [14]. Degeneration of the circuits of the nucleus subcoeruleus, which projects to the medullary reticular formation and spinal ventral horn interneurons, releases the inhibition of spinal motor neurons that results in characteristic motor behaviors [13]. There are a few arguments supporting the involvement of the motor cortex in the origin of the violent movements during iRBD. First, some premotor neurons located in the pontomedullary reticular nuclei receive projections from pyramidal neurons in the motor cortex [15]. Second, prolonged and elaborated complex motor behaviors (such as drawing or singing) also support the role of the motor cortex in iRBD [16]. Finally, ictal SPECT during RBD episodes in iRBD patients showed that the supplementary motor area (SMA) was the generator of these behaviors possibly bypassing the basal ganglia [17]. Moderate-to-severe neuronal loss, gliosis, Lewy bodies, and Lewy nerites were found in the subcoeruleus nucleus, the gigantocellular reticular nucleus, and the pedunculopontine nucleus in patients with iRBD and antemortem diagnosis of PD and DLB [18]. Autopsy in patients with iRBD is very rare. One case reported the presence of Lewy body disease with a marked decrease of pigmented neurons in the locus coeruleus and Substantia Nigra (SN) [19], whereas the other one reported Lewy bodies, Lewy neurites, and neuronal loss that were present in the dorsal motor nucleus of the vagus and the medullary tegmentum, including the region encompassing the gigantocellular reticular formation (GCRF). The locus coeruleus had no significant neuronal loss and gliosis but did have many Lewy bodies and Lewy neurites [20]. More recently, a large multicentric study found that genes involved in mitochondrial function and macroautophagy were the strongest contributors to cortical thinning occurring in iRBD [21].
3.2. Key MRI Features in iRBD
iRBD is undoubtedly the most studied premotor manifestation of synucleinopathies. The most important MRI features found in iRBD patients are listed in Table 1.
In summary, in iRBD there was a volumetric reduction in the striatum and lenticular nucleus [22,23] along with decreased volume or thickness mainly in the frontal [22,24,25,26,27,28,29] cortex but it was also reported in the posterior temporal, inferior parietal, dorsolateral prefrontal and lateral occipital cortices [29].
In patients with iRBD, a brain-clinical pattern in patients was found and predicted conversion to Dementia with Lewy Body (DLB) [30,31].
There was a consistent loss of neuromelanin in the SN [32,33] and locus coeruleus [34,35] while iron accumulation in SN, and more precisely in nigrosome 1 [36], was also reported [37,38,39].
Functional network iRBD studies showed heterogeneous results. The connectivity within the basal ganglia was mostly decreased [40,41,42,43] yet this finding was associated with increased connectivity with other regions participating in the coordination of movement and its execution (cerebellum, premotor cortex, SMA) suggesting a compensatory mechanism [44] without any concrete evidence to this day.
Finally, MRS results on iRBD showed changes in neuron function and metabolism [45,46], yet more investigations have to be conducted at this stage of the disease.
As a result, measures of atrophy, iron, and NM-sensitive MRI might be the most regular and promising features for an early neurodegenerative diagnosis.

Table 1.
Key MRI features in idiopathic rapid eye movement (REM)-sleep behavior disorder (iRBD) revealed in studies utilizing advanced post-processing algorithms and large subject cohorts.
Table 1.
Key MRI features in idiopathic rapid eye movement (REM)-sleep behavior disorder (iRBD) revealed in studies utilizing advanced post-processing algorithms and large subject cohorts.
| MRI Modalities | Abnormalities |
|---|---|
| Structural MRI |
|
| |
| |
| |
| |
| Diffusion MRI | Heterogeneous results:
|
| |
| |
| |
| Iron-sensitive MRI |
|
| |
| |
| Neuromelanin-sensitive MRI |
|
| Proton Magnetic Resonance Spectroscopy |
|
| fMRI |
|
| |
| |
| |
|
3.3. Grey Matter (GM) Integrity
Different methods were used to evaluate GM integrity such as voxel-based morphometry (VBM), deformation-based morphometry (DBM), cortical thickness, and segmentations.
With regard to cortical GM, most of the studies reported decreased volume or thinning (Figure 2) in the frontal cortex [21,22,24,25,26,27,28,29] in iRBD compared to healthy subjects. Also, the posterior temporal, parietal [29,47], dorsolateral prefrontal, orbitofrontal, occipital cortices [29,47,48] the superior frontal sulcus [25], the right superior frontal sulcus [27], and the dorsolateral primary motor cortex in the right hemisphere [22] were thinner or with a reduced volume.
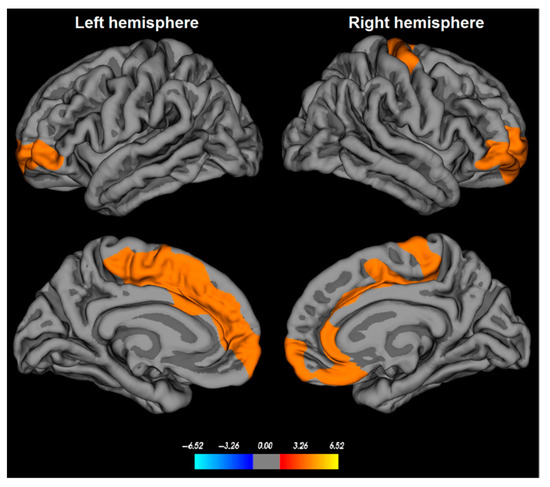
Figure 2.
Cortical thinning in patients with idiopathic rapid eye movement (REM)-sleep behavior disorder (iRBD). Cortical thickness abnormalities in iRBD patients are found in bilateral medial superior frontal, orbitofrontal, and anterior cingulate cortices, as well as in the dorsolateral primary motor cortex in the right hemisphere. The color bar indicates the logarithmic scale of p-values (−log10) for between-group differences in cortical thickness, with red-yellow areas representing significant thinning in iRBD patients versus controls (corrected with a Monte-Carlo simulation using a p-value set at <0.05). From Rahayel et al., 2018 with permission [22].
More marginally, other regions were reported to be affected: anterior cingulate [22,28,63] temporal [24,28], parietal [24], occipital cortices [24,28], the right and left cerebellum, tegmental portion of the pons, left parahippocampal gyrus [26], right posterior hippocampal [27], insula [63], postcentral, left superior parietal, and in lateral occipital regions [27], the lingual gyrus [25] and fusiform regions too [25,27].
To better understand the clinical relevance of these findings, some authors evaluated whether GM damage was correlated with clinical symptoms. The progression of motor signs in iRBD was associated with cortical thinning primarily in frontal regions [64]. Lower GM volume in the frontal lobes was associated with longer iRBD duration and lower age of iRBD symptoms onset [22]. Slower finger tapping of the right hand was associated with cortical thinning in the right paracentral and superior parietal lobule cortices, as well as in the right postcentral and superior parietal lobule cortices [22]. In 182 iRBD patients, thinning of the bilateral sensorimotor cortex and reductions in the surface area of frontopolar, sensorimotor, occipital, inferior parietal, lingual, and fusiform cortices were associated with motor impairment, whereas cortical thinning in bilateral insula, right temporal cortex, and left posterior temporal cortex were associated with cognitive impairment [29]. Parieto-occipital and orbitofrontal thinning were associated with visuospatial loss (Visual form discrimination test) [64].
Patients with iRBD and Mild Cognitive Impairment (MCI) had cortical thinning in the frontal, cingulate, temporal, and occipital cortices, and abnormal surface contraction in the lenticular nucleus and thalamus; whereas, those without any cognitive symptoms had cortical thinning restricted to the frontal cortex [28]. No neuropsychological data were correlated with hippocampal atrophy in patients with iRBD in another study [27].
Using DBM, individuals with iRBD and MCI exhibited a distinct pattern of local deformation and volume atrophy in both cortical (including the cingulate cortex, bilateral insula, precuneus, temporal, frontal and occipital regions, mid-posterior segment of the corpus callosum and right angular gyrus) and subcortical regions (involving the corona radiata, brainstem, basal ganglia, amygdala, thalamus and right hippocampus) when compared to iRBD patients without MCI or control subjects. These findings were correlated with diminished performance in visuospatial abilities, attention, and executive functions, and increased severity of motor symptoms [49].
Taking advantage of follow-up databases, several studies explored longitudinal changes in iRBD. Changes in cortical thickness were noticed in the bilateral superior parietal and precuneus, the right cuneus, the left occipital pole, and lateral orbitofrontal gyri compared to controls [47,64].
Also, some authors found brain patterns related to Dementia with Lewy Body (DLB) in patients with iRBD. More precisely, one study characterized DLB-related whole-brain cortical thickness spatial covariance pattern (DLB-pattern) from a group of DLB patients and repeated this measure during the follow-up in DLB, iRBD, and control groups, identifying phenoconverters to PD or DLB. The DLB-pattern was characterized by thinning of the temporal, orbitofrontal, and insular cortices and relative preservation of the precentral and inferior parietal cortices. In the iRBD group, the baseline DLB-pattern scores were significantly higher in dementia-first than in parkinsonism-first converters. In non-converters, their analysis showed that the DLB-cortical thickness pattern remained stable over time in the majority of the cases. However, individual patterns were heterogeneous [31].
A second study identified a latent variable linking atrophy in the basal ganglia, thalamus, amygdala, and frontotemporal grey and white matter, and expansion in the cerebrospinal fluid (CSF)-filled spaces, to impairment in measures of motor, cognitive, and autonomic functions. They used a Deformation-Based Morphometry (DBM) analysis and the deformation score from this specific pattern foretold the progression to and not PD [30]. Finally, in a last study, cortical thinning in frontal, occipital, and parietal areas was found in iRBD patients before they converted into PD or DLB compared to iRBD non-converters [47].
With regard to the basal ganglia and the brainstem, decreased local volume in the SN pars compacta (SNc) [65], caudate nucleus [22], lentiform nucleus [22], bilateral putamen [23], right thalamus [66], and abnormal surface contraction in the thalamus and lenticular nucleus [28] in iRBD.
Poorer quality of life, as measured by a high Parkinson’s Disease Questionnaire 39 items (PDQ-39) score, was associated with reduced normalized putamen volumes. Similarly, slower performance on the timed gait task was associated with reduced normalized caudate and putamen volumes [23].
In a study designed to investigate subcortical and cortical GM volume alterations associated with depressive and anxiety symptoms in iRBD patients [67], authors found GM volume loss in the caudate nuclei, left calcarine, and right cuneus compared to iRBD patients without significant depressive symptoms and controls. They also found GM volume loss in the left amygdala extending to the hippocampus in iRBD patients with clinically significant anxiety symptoms compared to iRBD patients without significant anxiety symptoms and controls. Moreover, higher severity of anxiety and depressive symptoms was correlated with lower GM volume in these regions in iRBD patients.
Rotating frame relaxation parameters (adiabatic T1ρ and T2ρ, and non-adiabatic RAFF4) tended to be higher in iRBD patients than in controls in the amygdala, hippocampus, and thalamus [68].
In some studies it was paradoxically an increase in the volume of GM of the frontal cortex, caudate [69,70], cerebellum [70] posterior lobe, putamen, and thalamus [24,69], hippocampi [50] interpreted as a possible compensatory mechanism without any concrete evidence to this day.
Finally, only four studies have found no significant clusters of reduced GM volume between iRBD patients and controls [41,43,71,72].
3.4. White Matter (WM) Integrity
The results of the microstructural WM assessment of iRBD were quite heterogeneous.
In the brainstem, decreases of Fractional Anisotropy (FA) in the SN [32], the tegmentum of the midbrain, and rostral pons associated with increases in Mean Diffusivity (MD) within the pontine reticular formation are reported [50,73]. One study found increased (but normal FA) in the SNc [74].
Mean free-water values (bi-tensor DTI) in the posterior SN for iRBD patients were reported to be higher and with a significant negative correlation with dopaminergic SPECT/CT activity [53]. On the contrary, in another study, MD was lower in SN pars reticulata (SNr) of iRBD vs. controls [68], but rotating frame relaxation parameters (adiabatic T1ρ and T2ρ, and non-adiabatic RAFF4) tended to be higher in iRBD patients than in controls in the midbrain and pons in favor of a degenerative process [68].
Further, significant decreases in the axial diffusivity were observed in the pons and the right SN, which were interpreted as altered axonal integrity [51].
At the supratentorial level, FA increases were found in the internal capsule bilaterally (along the anterior thalamic radiation), in the olfactory region, in right insula, right putamen [75] and corticospinal tract, cerebellar peduncles and brainstem [70] whereas significant FA decreases were observed in the fornix, the right visual stream (V1,V2) [51], the left post-central gyrus, the right lobule VIIB and left crus I of cerebellar hemisphere [75], the left superior temporal lobe [51,75] and corpus callosum [70].
Higher quantitative anisotropy in iRBD subjects compared with PD patients was found in bilateral middle cerebellar peduncles and right arcuate fasciculus thought as neural compensation [76] but more evidence is needed to support this hypothesis.
Increased MD in the iRBD compared to the PD group was found in the corpus callosum, the right limb of the internal and external capsule, the right superior and inferior longitudinal fasciculus, the right inferior frontal-occipital fasciculus, the right corticospinal tract [77], the right forceps major, the right corona radiata, the right tapetum, and the left posterior thalamic radiation [52].
Compared to controls, increased MD in the iRBD were found in left angular gyrus, left calcarine fissure and surrounding cortex, left and right caudate nucleus, left anterior and middle cingulate gyrus, left cuneus, right IFG pars orbitalis, left superior frontal gyrus medical orbital part, left fusiform gyrus, left hippocampus, left middle occipital gyrus, left rectus gyrus, left inferior and middle temporal gyrus, left thalamus, left lobule III of cerebellar hemisphere, left lobule VIIB of cerebellar hemisphere, and lobule X of vermis [75].
Radial diffusivity (RD) increases were observed in the fornix, the right visual stream (V1,V2), and the left superior temporal lobe [51]. In another study, the left caudate nucleus and right caudate nucleus had higher axial and radial diffusivity values [75].
These results were not consistent with other studies assessing axial, radial, or mean diffusivity and reporting no abnormalities [25,32].
Regarding structural connectivity data, several studies identified WM changes in iRBD.
Using graph-theoretical analysis, a study demonstrated that individuals with iRBD exhibited notably increased small-worldness, clustering coefficient, and enhanced local connectivity among regions associated with olfactory, motor, and sleep functions when compared to control subjects. Betweenness centrality was also elevated in the left olfactory cortex, left precentral gyrus, left supramarginal gyrus, left temporal pole superior temporal part, lobule of X of vermis, and left crus II of cerebellar hemisphere [75], caudate nucleus and frontal cortex.
Moreover, with network-based statistics (NBS), a study showed greater connectivity between the right SMA area and right putamen, and between the left parahippocampal gyrus and left cerebellum in iRBD subjects compared to controls [78]. Here also, these results were interpreted in terms of neural compensatory mechanisms during the early stages of PD but without any strong evidence of this assessment.
Using probabilistic tractography, another study evaluated longitudinal degenerative progression patterns in prodromal PD patients (iRBD and/or hyposmia). A progression pattern was numerically quantified with a longitudinal brain connectome progression score. A trend towards two patterns of evolution of the connectome in prodromal PD patients (i.e., two subgroups) was found. Subgroup 1 (n = 11) (i.e., the subgroup that had the progression most similar to the PD group according to the longitudinal connectome scores) had increased and more variable Unified Parkinson’s Disease Rating Scale Part III Motor score (UPDRS-III) and Hoehn and Yahr scale (H&Y) scores at 1 and 1.5-year follow-up than at baseline. On the contrary, subgroup 2 (n = 5) (i.e., the subgroup that had the progression most similar to Controls) had UPDRS-III and H&Y scores near 0 at 1 and 1.5 year follow-up, similar to the scores achieved at baseline [79].
Using structural and functional neighborhood analyses, a study demonstrated that cortical thinning was constrained by the brain’s structural (and functional) connectome and that it mapped onto specific networks involved in motor and planning functions [21].
Further, in a third study using 7 Tesla MRI, was found impaired structural connectivity in 14 brainstem nuclei, including the connectivity between REM-on (for example, subcoeruleus nucleus) and REM sleep muscle atonia (for example, medullary reticular formation) areas [54].
The different methods of acquisition and post-processing of the signal are undoubtedly one of the reasons that can explain the differences observed between the reported studies. Further, as the prodromal phase of PD extends over many years, it is possible that there is some heterogeneity in the evaluated patients regarding their progression in neurodegeneration. Nevertheless, most of these studies showed that there was a microstructural alteration in the brainstem as well as in other brain regions. Efforts should be made to harmonize assessment techniques and obtain reliable markers.
3.5. Brain Iron Content
The most frequently evaluated feature in iRBD patients was the loss of dorso-nigral hyperintensity (DNH), mostly corresponding to nigrosome 1, in SWI sequences (Figure 3). However, this sign was inconsistent and therefore insufficient to make the diagnosis of the disease [37,38,55,56,57]. Indeed, even at ultra-high fields, 27.5% [56] to 61% [37,38] of iRBD subjects had DNH, in comparison with 96% of PD patients and 7.7% of healthy subjects. In iRBD patients who did not exhibit DNH abnormalities, there was a notably lower level of putamen dopaminergic SPECT/CT activity when compared to iRBD patients with DNH [37,56].
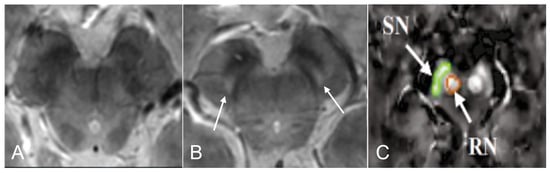
Figure 3.
Brain iron content in idiopathic Rapid eye movement (REM)-sleep behavior disorder (iRBD). 3D GRE multi-echo susceptibility-weighted imaging MR of the substantia nigra (SN) in iRBD (A) and in healthy control (B). Nigrosome 1 (arrows) is visible bilaterally. Adapted from Frosini et al., 2017 with permission [38]. In (C) a quantitative susceptibility map (QSM), is seen in the SN (green) and the red nucleus (orange) in iRBD subjects (adapted from Sun et al., 2020 with permission [39]).
Evaluation of brain iron content using quantitative magnetic resonance imaging showed various results. On the one hand, no difference was found in the transverse relaxation rate (R2*) [32,72] in this region. On the other hand, several studies used Quantitative susceptibility mapping (QSM) to evaluate brain iron content in iRBD patients with different results. In the first one, QSM values in SN were higher in iRBD subjects than in controls (Figure 3) and were positively correlated with disease duration in the left SN [39]. In the second one, no difference was found in SN when comparing iRBD patients with healthy subjects two-years apart [58]. In the third one, in probabilistic regions of interest (ROI) of nigrosome 1, QSM values in iRBD patients were similar to healthy subjects [36]. Finally, a study found that iron content in the right caudate nucleus, right dentate nucleus, right dentate nucleus, and left caudate nucleus was higher and respectively correlated with visuospatial function, memory function, and alternate-Tap test. Also, iRBD patients had reduced volume of the right caudate nucleus in SWI [57].
QSM showed superior sensitivity for PD-related tissue changes in nigrostriatal dopaminergic pathways [80] but this remains to be demonstrated earlier in the degenerative process such as in iRBD patients.
3.6. Neuromelanin
All the studies found a concordant result, namely a reduction in the neuromelanin-sensitive volume and/or signal intensity in the whole SN [32,33,74,81] (but not in the SNc evaluated by its own [65,82]) or in the locus coeruleus/subcoeruleus complex [34,35,81] in iRBD compared to controls (Figure 4). Reduced signal in the locus coeruleus/subcoeruleus complex identified iRBD with 82.5% sensitivity and 81% specificity [35].
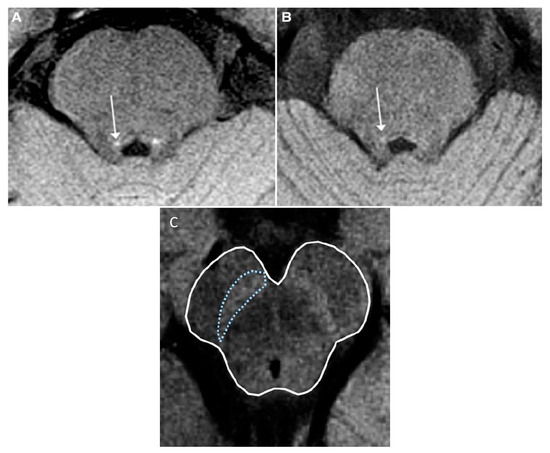
Figure 4.
Neuromelanin-sensitive MRI in idiopathic Rapid eye movement (REM)-sleep behavior disorder (iRBD). Axial T1-weighted neuromelanin-sensitive images. (A,B): The coeruleus/subcoeruleus complex in a healthy volunteer (A) and a patient with iRBD (B). The locus area (arrows) is visible as an area of increased signal intensity. Adapted from Ehrminger et al., 2016 with permission [35]. (C): Neuromelanin in substantia nigra (outlined in blue) in a healthy subject. Adapted from Lehéricy et al., 2014 with permission [6].
This anomaly appears to be the most consistent in the prodromal stage of PD.
Interestingly, two studies [83,84] found a reduced signal of neuromelanin of locus coeruleus in depression without iRBD (or undiagnosed) compared to controls. No difference was reported for SN. Nevertheless, late-onset depression is still classified as a moderate risk for prodromal PD with low sensitivity and specificity [3] because of the lack of dedicated studies.
3.7. Brainstem Metabolism
Only two studies were performed in iRBD in proton Magnetic resonance spectroscopy (MRS). A 3T MRI study showed a reduction of choline/creatine and N-acetylaspartate/Choline ratios in the pontine tegmentum [46] whereas a 1.5T MRI study reported no significant differences in choline/creatine, N-acetylaspartate/creatine, and myoinositol/creatine ratios between healthy subjects and patients [45]. Further investigations are warranted.
3.8. Functional Network Alterations
In iRBD, the most reported resting state fMRI (rsfMRI) result was a reduced nigro-striato-thalamo-pallidal inter- and intra-hemispheric connectivity [21,40,41,42,43,63,85,86,87,88].
This was especially the case for the connectivity of the caudate, putamen, and globus pallidus, bilaterally [41], as well as between the left SN and the left putamen [42] or between the brainstem and the cerebellum posterior lobe, temporal lobe, and anterior cingulate [63].
In comparison to controls, individuals with iRBD exhibited diminished cortico-cortical functional connectivity strength, particularly in edges located within posterior regions [89] but also they exhibited decreased nodal efficiency in the precentral gyrus, postcentral gyrus, supramarginal gyrus, superior temporal gyrus, supramotor area, straight gyrus, middle cingulate gyrus, and Rolandic operculum [88].
Finally, global functional dynamics and functional connectivity (FC) in iRBD were impaired within the resting-state network, particularly in the visual network and sensorimotor networks. FC parameters (synchrony, metastability, within- and between-network FC) were negatively associated with the clinical features, including UPDRS-I, II, Total, and RBD-Sleep Questionnaire [90].
Reduced FC between the brainstem and the cerebellum posterior lobe, temporal lobe, and anterior cingulate correlated with autonomic functions in iRBD (the Scales for Outcomes in Parkinson’s Disease-Autonomic scores) [63].
Comparing iRBD patients with and without MCI with controls, a study reported a lower FC strength between the left lateral occipital cortex and the nucleus basalis of Meynert (belonging to the cholinergic system) and the lingual gyrus in the iRBD group with MCI than in the iRBD with normal cognitive scores and healthy subjects. FC mean values positively correlated with the MoCA and memory test scores [91]. Another study found similar results in iRBD patients that were not considered as MCI: deficits in attention/working memory, executive function, and immediate memory were associated with abnormal striatal-cortical FC including frontal, temporal, and anterior cingulate cortices [87].
In patients with iRBD and impulse control disorders (ICDs), a functional hypoconnectivity between the limbic striatum and temporal occipital regions was also reported. Furthermore, the presence of ICDs correlates with hypoconnectivity between the limbic striatum and clusters located in the cuneus, lingual, and fusiform gyrus [43].
On the contrary, a study reported increased functional connectivity between the putamen and brain regions responsible for executing motion and coordination (such as the cerebellum, vermis, SMA, post- and precentral gyrus) and for planning movement (including the cuneus, precuneus, and superior medial frontal lobe) [44]. The authors interpreted this finding with compensatory mechanisms that enable smooth motion planning despite ongoing pathology. Further studies are needed to support this hypothesis.
Elevated connectivity between the right SN and the right cuneus/precuneus/superior occipital gyrus was reported [42] and increased functional connectivity between the left thalamus and occipital regions including the right cuneal cortex, left fusiform gyrus and lingual gyrus was positively correlated cognitive performance (word recognition list) suggesting a compensatory mechanism for cognitive impairment in iRBD [92]. This needs to be replicated to strengthen this hypothesis. In another study that examined olfaction in iRBD, researchers discovered elevated amplitude of low-frequency fluctuation (ALFF) values in the right parahippocampal gyrus. Additionally, changes in olfaction abilities were found to be associated with alterations in ALFF values in the occipital cortices [24].
Using the dynamic functional connectivity (dFC) approach, a study found four recurring dFC states that were characterized by significantly different connectivity patterns. iRBD patients spent more time in the frequent, fewer positive, and sparsely connected state (for which temporal properties were found to be associated with RBD screening questionnaire scores) than controls did while almost no time in the infrequent, more positive, and strongly connected state [93].
In an fMRI task involving bilateral hand movements, and in which there were internally selected and externally guided movement conditions for each hand, iRBD patients showed stronger functional recruitment compared to controls, mainly in the dorsolateral prefrontal, left primary somatosensory, the right fronto-insular cortices, in absence of behavioral differences. In these patients, lower MoCA scores were associated with higher activation in the left superior medial frontal and medial orbital gyrus, middle cingulate cortex, precuneus, and right cerebellum (Crus II) during the tasks [71].
Additionally, individuals with iRBD exhibited a decrease in BOLD signal change within the dorsal caudate nucleus and displayed notably distinct corticostriatal functional connectivity patterns compared to control subjects during a dual-task virtual reality gait paradigm that involved foot pedals [94].
Finally, in a virtual reality gait paradigm where individuals with iRBD were compared to controls, it was observed that iRBD patients exhibited diminished BOLD signal changes in the left posterior putamen and right mesencephalic locomotor region. Additionally, there was reduced FC between the frontoparietal network and the motor network when these patients navigated narrow versus wide doorways [95].
3.9. Other Interesting Features
In a retrospective study [62], of the 129 individuals diagnosed with iRBD patients from 1990 to 2019, 61 (47.3%) developed a clinically defined synucleinopathy during follow-up, namely 30 (49.2%) PD, 26 (42.6%) DLB, and 5 (8.2%) MSA. Of the five iRBD patients who developed MSA, MRI was abnormal in four subjects before phenoconversion (80%), and showed one of these signs: putaminal rim, cerebellar atrophy, middle cerebellar peduncle atrophy, middle cerebellar peduncle hyperintensity, pontine atrophy or cross-bun sign.
A study used arterial spin-labeled imaging to examine changes in cerebral blood flow (CBF) in individuals with iRBD, aiming to identify alterations in brain perfusion associated with the condition. The findings revealed that the iRBD group exhibited notably reduced CBF values in the right middle frontal gyrus, right inferior frontal gyrus, and right insula. It is important to know that the iRBD group had a lower MMSE score (but still normal, >26/30) than in controls [96].
More recently, another study found profound hypoperfusion and microvascular flow disturbances throughout the cortex in patients compared to controls. They applied dynamic susceptibility contrast MRI to characterize the microscopic distribution of cerebral blood flow. In iRBD patients, the microvascular flow disturbances were seen in cortical areas associated with visual processing, recognition, and language comprehension and were associated with impaired cognitive performance [59].
Moreover, iRBD patients had significantly higher enlarged perivascular spaces (EPVS) in centrum semiovale (CSO), basal ganglia, SN, and brainstem than healthy subjects and PD. Higher CSO-EPVS and SN-EPVS burdens were positively correlated with the severity of clinical symptoms in iRBD patients [97]. Also, three recent studies proposed diffusion tensor image analysis along the perivascular space (DTI-ALPS) as a non-invasive image-analysis method for the evaluation of glymphatic-system dysfunction. The authors found a lower value of the DTI-ALPS index in iRBD indicating a reduction in perivascular diffusivity. This means a reduced glymphatic clearance function [60,61,98].
3.10. Lateralization of Abnormal Findings
Lateralization of brain structures or connectivity impairment varied across the studies we examined. In cases of symptomatic RBD, such as post-pontine strokes, both left and right lesions have been documented [99]. For neurodegenerative conditions, a hypothesis could be formed that, due to highly lateralized connections, the spreading pathology might initially be confined mainly to the same side. Recent research consistently linked handedness to predicting the side of PD onset, with symptoms more often manifesting on the dominant side, ranging from 60% to 65%. One might suggest that the lateralized irregularities in the dominant (left) hemisphere could be attributed to the prevalence of right-handedness in the majority of participants in these studies [100].
However, a study indicated that cortical degeneration in PD differed between the cerebral hemispheres, with early left hemisphere involvement and late right hemisphere involvement, often associated with posterior cortical atrophy. This pattern was not contingent on handedness or affected by the predominant side of motor symptoms [101]. Also, another study found that WM integrity significantly differed in PD with dominant symptoms on the right side, while it remained unchanged in PD with dominant symptoms on the left side (LDP), suggesting that the LDP profile might be linked to a more favorable prognosis [102].
The cause of this predominantly left hemisphere atrophy across various neurodegenerative diseases remains uncertain, although there are multiple hypotheses involving genetics, lateralized vulnerability, and disease-specific factors [101].
In most RBD studies, handedness was often not mentioned. Incorporating this information into subsequent clinical and imaging investigations could assist in elucidating the presence and importance of initial microstructural/connectivity lateralization impairment.
4. Discussion
The increasing number of MRI studies assessing brain alterations in patients with prodromal PD symptoms demonstrates a strong interest of the scientific community in identifying early biomarkers able to monitor neurodegeneration.
For this review, the literature search was limited to PubMed (MEDLINE) and Google Scholar databases for several reasons. First, a huge number of references were found due to the wide scope of MRI methods considered (n = 5246 identified; n = 77 included), which was also the strength of this article. To reduce the risk of omitting a report, the search was conducted twice at 6-month intervals and the bibliography was carefully evaluated by all authors. Compared with previous review articles on this topic, we included many more eligible articles. Those reviews chose either to discuss neuroimaging findings in iRBD in general (including nuclear medicine or ultrasound techniques, drastically limiting the coverage of MRI anomalies) [5,103,104,105,106,107,108] or simply not to cover new MRI techniques available nowadays (such as neuromelanin or spectrometry) [109,110]. Second, MEDLINE and Google Scholar are among the most used databases worldwide. Based on 58 published systematic reviews, a study aimed to determine how to do efficient searches in systematic reviews. Authors reported that MEDLINE median recall (number of included references retrieved by one database divided by the number of included references retrieved by all databases together) was 82.9%, compared with EMBASE 87.3%, Web of Science 72.5%, and Google Scholar 38.0%. Combining MEDLINE and Google Scholar, this score increased to 94.6% [111], which is a very good score. Finally, we followed highly recommended guidelines to conduct a review such as PRISMA [7] and Pautasso’s ten rules [112]. Thus, we can assume that this review covered the field as extensively as possible and is of interest to researchers and clinicians who wish to understand both iRBD pathophysiology, MRI techniques, and findings in 2023.
Some biomarkers such as frontal cortical and basal ganglia atrophy, reduction of neuromelanin in the SN and locus coeruleus, or increase of iron in nigrosome 1 were the most consistent and could help clinicians in the early decision-making of a prodromal synucleinopathy-related disease diagnosis. However, these MRI features still need to be investigated in larger cohorts and to be more widely tested longitudinally. Nevertheless, we should keep in mind that performing any single of these studies is difficult because of the diagnostic complex procedures for iRBD (requiring video-polysomnography) and the scarcity of patients with iRBD visiting a doctor. It was therefore worthwhile to carry out a review of the literature to cross-check the results and extract the most consistent results.
Another problem was the lack of reproducibility of some of the studies leading to inconsistent results. As an example, we can evoke specific technical shortcomings of some of the manuscripts that may have used now known to be methods fraught with lots of statistically significant artifacts—like lack of rigorous quality control for movement in many diffusion and BOLD imaging studies. Thus, results strongly depend on the decisions made in terms of MRI preprocessing although structural imaging assessed with T1-weighted sequences shows greater reproducibility [113].
The field has matured over the course of 22 years making a lot of the earlier studies less convincing in retrospect.
Finally, the quality of the clinical movement disorders evaluation of the participants in the studies was not consistent across the studies. Indeed, a lack of parkinsonism from a movement disorders clinician is far more convincing than from someone not so trained. Unfortunately, the background of those who performed the clinical evaluation was not systematically specified.
Nevertheless, we were able to find a common set of results for most of the MRI methodologies, the most difficult was obviously for fMRI. Further research is warranted, with larger cohorts to highlight discrete but constant abnormalities.
Technological advances in terms of image acquisition and processing allow higher imaging resolution. As an example, the development of the ultra-high field (7 Tesla) MRI, now makes it possible to explore very small anatomical structures and to reveal previously undetectable anomalies. This will undoubtedly enable to establish a more accurate correlation between certain brain regions that were previously difficult to segment (such as the locus coeruleus, the different parts of SN, the nigrosomes, and numerous other small brainstem nuclei) and clinical symptoms. Optimizing parameters for image acquisition and processing will help reduce some of the heterogeneity between studies. Furthermore, at this stage, none of the described MRI parameters has been consistently assessed from the perspective of predicting which synucleinopathy the patient will develop (e.g., PD, DLB, or MSA). This information is of the utmost importance to best adapt the care management.
In the years to come, the combination of different imaging modalities (such as PET/SPECT and MRI) will certainly be of great help to support the hypothesis of the presence of brain lesions (nigrostriatal degeneration, neuromelanin reduction, iron accumulation, microstructural and connectivity changes, atrophy or increased volume thanks to MRI) and of the type of neurodegeneration (for example, alpha-synuclein, tau, amyloid thanks to PET).
Then, diagnostic algorithms that include clinical, molecular, and imaging biomarkers in addition to genetic biomarkers may have a huge impact by identifying patients most at risk for neurodegenerative disease, and by allowing them to undergo the most appropriate therapeutic trial.
Author Contributions
Conceptualization, S.G.; methodology, S.G.; writing—original draft preparation, S.G.; writing—review and editing, M.G., M.B. and A.E. All authors have read and agreed to the published version of the manuscript.
Funding
This research received no external funding.
Institutional Review Board Statement
Not applicable.
Informed Consent Statement
Not applicable.
Data Availability Statement
No new data were created or analyzed in this study. Data sharing is not applicable to this article.
Conflicts of Interest
The authors declare no conflict of interest.
Appendix A. Brief Overview of MRI Modalities
Several analytic methods exist to enable the detection of brain tissue and connectivity changes that are related to neurodegeneration.
Appendix A.1. Structural MRI
Structural MRI can provide comprehensive detail regarding anatomical cerebral structures.
Grey matter (GM) integrity and atrophy are mainly assessed by voxel-based morphometry (VBM), deformation-based morphometry (DBM), cortical thickness analysis, subcortical volumes analysis, quantitative relaxometry, and rotating frame MRI methods.
VBM allows the comparison of the concentration of GM volume between groups on a voxel-wise basis and uses T1-weighted volumetric MRI scans. It involves spatial normalization of high-resolution images of all the subjects participating in the study into the same stereotactic space. Then, the GM is segmented from the spatially normalized images and smoothed. Voxel-wise parametric statistical tests are performed with correction for multiple comparisons [114].
DBM is a useful technique to detect morphological differences over the entire brain since it analyses positional differences between every voxel and a standard brain. Information about the deformation fields is obtained by computing the local Jacobian determinant (as a measure of volume change) and provides evidence of the shape of any structure deformation [115].
Cortical thickness evaluation is based on T1-weighted volumetric sequences such as 3D magnetization-prepared rapid gradient echo sequence (MPRAGE). As regional variations in the cortical thickness can be quite large, automated methods are required to delineate the cortex ribbon. The precision of the thickness measurements is constrained by the contrast-to-noise ratio and fidelity of the underlying MRI data [116,117].
Subcortical volume analyses enable between-group comparisons in a semi-automated manner. These methods use different cortical and sub-cortical atlases segmenting the brain in regions of interest (ROI). They are also based on T1-weighted volumetric sequences [118].
Quantitative relaxometry can be informative of disease-related tissue change as well. T1 relaxation involves an exchange of energy between water protons and the surrounding lipids, proteins, and macromolecules. T2 relaxation, in contrast, refers to the de-phasing of the water protons due to interactions between them. De-phasing can also be induced by macroscopic inhomogeneities in the applied magnetic field. This macroscopic de-phasing is termed T2′, and the combined effect of T2 and T2′ is referred to as T2* (where 1/T2* = 1/T2 + 1/T2′) [119]. Thus, these parameters are directly influenced by the local biophysical structure and biochemical environment. Changes in T1, T2, and T2* can be indicative of several changes occurring at the molecular and cellular level, associated with disease [119].
Rotating frame MRI methods. Whereas free-precession T1 and T2 relaxations due to dipolar interactions depend on magnetic field fluctuations at frequencies near the Larmor frequency in the MHz range, the rotating frame relaxations detect additional information from lower frequencies in the kHz range of the effective fields generated by the radio-frequency pulse. This inherent sensitivity of adiabatic T1ρ, T2ρ, and non-adiabatic Relaxation Along a Fictitious Field in the rotating frame of rank 4 (RAFF4) to slower motional regimes provides the ability to capture the large spectrum of water dynamics closely associated with the fine microstructure of various tissues [120].
Appendix A.2. Diffusion MRI
GM and White matter (WM) integrity can also be evaluated by Diffusion Weighted Imaging (DWI), which is based on measuring the random Brownian motion of water molecules within a voxel of tissue in the presence of diffusion sensitization magnetic gradients.
Diffusion tensor imaging (DTI) is a technique that uses anisotropic diffusion of water molecules to estimate the fiber organization in the brain [121]. In WM, water molecules tend to diffuse longitudinally along an axonal trajectory. Two measures from DTI are commonly used to assess tract microstructure: 1/fractional anisotropy (FA), which characterizes diffusion in the axonal orientation relative to two orthogonal radial orientations, and represents how strongly directional diffusion is within WM; 2/mean diffusivity (MD), also known as the apparent diffusion coefficient (ADC), which is a measure of the degree of diffusion, independent of direction. It is made up of radial and axial diffusivity. Reductions in FA or increases in MD are therefore often used as markers of a change in myelination or degradation of axonal structure [122]. Also, elevated FA could suggest selective neurodegeneration causing lower neural branching, decreases of axonal diameter, and thus higher coherence along the principal orientation [123]. An increase in MD in GM is assumed to reflect the breakdown of microstructural barriers to diffusion which could predate volumetric changes [124]. On the other hand, lower MD values are an indication of a more restricted diffusion environment maybe because of increased cellularity or cell volume fraction, for example, because of a glial response related to neuronal loss [125].
Also, Quantitative Anisotropy (QA) in each fiber tract represents the peak density of water diffusion along the main direction of WM fibers. Unlike conventional DTI, diffusion MRI (DMRI) connectometry is concerned with the density of water diffusion, not just the direction of water diffusion, i.e., how fast the molecules diffuse in different directions. The use of QA in DMRI provides further spatial resolution to identify tracts in regions with kissing or crossing tracts, for instance, in long associational tracts, projecting to or originating from the temporal lobe. In this regard, decreased type 1 error, higher spatial resolution, and lower susceptibility to partial volume effect are the main privileges of QA in DMRI connectometry compared to measures from conventional DTI [76].
Free-water diffusion MRI analysis uses a bi-tensor DTI model and was developed to explicitly estimate the fractional volume of freely diffusing water molecules within the voxel. Free water is defined as the water molecules that do not flow and are not restricted (cerebrospinal fluid in the ventricles, around the brain parenchyma, and also in the extracellular space in the brain parenchyma) [126]. This measure is expected to increase with atrophy-based neurodegeneration [127]. When the free-water component is eliminated, the remaining signal provides a corrected FA value (FAT) and corrected MD value (MDT) within the tissue of interest.
Structural connectivity. The complex system of connections in the human brain, named “connectome”, is of great importance to understanding brain integrity and function. DWI data and T1-weighted MRI as an anatomical reference for subsequent parcellation and co-registration are acquired.
DTI can be used to perform deterministic tractography, which relies on the alignment in WM between the dominant orientation of local water diffusion and the mean orientation of WM fibers. Using this information, tractography methods can infer in vivo continuity (tracking) of fibre estimates (streamlines) from voxel to voxel and reconstruct an entire WM pathway. As opposed to deterministic tractography, probabilistic tractography generates maps of fiber connectivity between brain regions by using an increased number of diffusion directions and by choosing the path from a distribution of possible directions; it can trace pathways into GM [128].
Tract-based spatial statistics (TBSS) is a technique for the analysis of DTI data in which only the very center of the WM tracts (the skeleton) is considered. This overcomes several limitations of standard voxel-based statistical analyses, such as image registration and smoothing [129].
The graph-theoretical approach of the brain is a framework that describes a network, which represents neuroanatomical regions as nodes and their connections as edges (also called links). Edges represent anatomical connections based on connectivity information (e.g., the number of streamlines reaching a region) inferred from fiber tractography. Whole-brain [130] or ROI [131] based graph-theoretical approaches are possible. Among the various metrics that can be obtained from graph-theory analysis, nodal degree is defined as the number of edges linked directly to a node, nodal efficiency measures the ability of a node to propagate information with the other nodes in a network and nodal betweenness captures the influence that one node has over the flow of information between all other nodes in the network [132].
To further identify whether and which specific pairs of nodes exhibit differences in connectivity strength between groups of subjects, network-based statistics (NBS) can be used to seek complementary information about sub-network alterations within large-scale network organizations of the brain [133].
Finally, to assess the impact of structural connectivity, the structural neighbourhood change can be quantified by averaging the structural change observed in the total number of nodes that had a structural connection with each region [21].
Appendix A.3. Functional MRI (fMRI)
The brain connectome can either be structural, as detailed above, or can be functional, by representing physiological activity. fMRI is based on the measurement of blood-oxygen level-dependent (BOLD) signals which reflect changes in deoxyhemoglobin driven by localized changes in brain blood flow, oxygenation, and volume. BOLD signals are coupled to underlying neuronal activity by a process termed neurovascular coupling [131].
Task-based (e.g., motor, cognitive, or olfactory) fMRI measures BOLD signal changes between task-stimulated states and control states. The temporal coherence of signal between brain regions and the task is assumed to reflect functional networks that are active in that region during task performance [134].
fMRI can also be evaluated in a resting-state (rsfMRI) through different analyses. Functional connectivity (FC) describes brain areas that display synchronized/correlated signal fluctuations over time. The amplitude of low-frequency fluctuations (ALFF) is employed to assess the localized intensity of natural fluctuations in the BOLD fMRI signal within the frequency range spanning from 0.01 to 0.1 Hz. Fractional ALFF (fALFF) represents the relative contribution of specific low-frequency oscillations to the whole frequency range. It allows the determination of variation of the BOLD signal relative to the baseline energy metabolism [135]. The regional homogeneity (ReHo) measure is usually used to characterize spontaneous brain activity at a limited anatomical distance [131]. Effective connectivity is based on a Granger causality analysis to characterize the causal influence between different brain regions [136]. Finally, an analysis method of functional dynamics, measured by synchrony and metastability, can be used to analyze the efficiency and flexibility of brain information transmission. Synchrony in the oscillatory activity of network regions is thought to underpin information exchange, while metastability represents the variability in the synchronization of network regions over time that is considered essential for adaptive information processing [90].
Graph-theoretical approach [137] and the functional neighbourhood change [21] can be used in fMRI (see definitions in the section above).
Finally, we need to keep in mind that human brain connectivity is highly dynamic and can vary over very short periods (<10 s). The dynamic patterns are even more evident when individuals engage in different mental activities. Such temporal dynamic changes can be captured by dynamic FC (dFC) analysis, providing additional information on functional brain organization that cannot be discovered through standard FC [93].
Appendix A.4. Iron-Sensitive MRI
Ferritin is the major iron molecule in most brain cells. The total concentration of iron increases during aging in the substantia nigra (SN), globus pallidus, putamen, caudate nucleus, and cortex. The highest iron content is found in globus pallidus, putamen, and caudate nucleus, with lower concentrations in cortical GM, WM, midbrain (including the SN), and cerebellum, and the lowest iron concentrations are found in the locus coeruleus, pons, and medulla [138].
Aggregates of magnetic particles shielded from the water by a protein shell (such as ferritin) exert their effect on MR contrast by dephasing the magnetic spins of the protons diffusing in their vicinity. It reduces the T2 and T2* relaxation time of the protons and produces hypointense areas on T2 spin-echo (SE) and T2*-weighted gradient-echo (GE) sequences with little effect on T1 [139].
Susceptibility-weighted imaging (SWI) has been shown to provide clinically useful complementary qualitative information to conventional SE and GE MRI sequences. Although SWI relies on GE sequences, it has enhanced susceptibility sensitivity compared with conventional T2*-weighted GE sequences because it is based on a high-resolution, flow-compensated, long echo time (TE), i.e., 3D GE imaging technique containing filtered phase information in each voxel. Here, the magnitude and phase MR data are brought together, and a single SWI image is created. Unfortunately, ferrocalcinosis may lead to confusing signal intensity patterns as even basal ganglia “calcification” is often a mixture of paramagnetic iron and diamagnetic calcium [140].
Quantitative susceptibility mapping (QSM) is a recently developed post-processing technique and allows to obtain quantitative maps of bulk tissue magnetic susceptibility, using the same phase signal as conventional, dual- or multi-echo, GE magnetic resonance sequences. QSM is achieved by following several steps. First, by estimating the magnetic field distribution from raw MRI phase data. Second, by eliminating background field contributions that result from susceptibility sources outside of the area of interest. Finally, by solving the inverse problem from field perturbation to magnetic susceptibility. Paramagnetic substances, such as ferritin, appear bright on susceptibility maps, and diamagnetic substances, such as calcium and myelin, appear dark. Thanks to QSM, specific differentiation of calcified from hemorrhagic lesions is allowed [141].
Appendix A.5. Neuromelanin (NM)-Sensitive MRI
Neuromelanin (NM) is an insoluble pigment originating from dopamine-derived quinones contained within autophagic lysosomes together with lipid bodies and many soluble proteins. NM pigment in the SN becomes visible under light microscopy at 2–3 years of age and continues to darken through the 10th decade of life. It chelates transition metal ions, including iron, zinc, and copper, which are responsible for the ability of MRI to detect NM [138].
A phenomenon known as magnetization transfer (MT) is thought to provide the primary source of contrast in NM MRI. MT contrast results from the interaction and exchange between water protons and the protons associated with macromolecules [142]. Paramagnetic substances shorten the relaxation times of both free protons and a pool of restricted macromolecule protons. While the main iron protein in human SN is ferritin, which possesses low paramagnetism, the main iron storage in pigmented SN neurons is NM–iron complexes, which are highly paramagnetic. Also, the melanin-iron structure contributes to an exceptional effect on T1 shortening that enhances its intensity in NM MRI. Thus, with NM MRI, the SN pars compacta (SNc), which contains the highest NM content, appears as an area of higher signal intensity than the SN pars reticulata (SNr), which is much lower in dopamine neurons and richer in iron but contains less NM–iron complex. Other iron-rich structures with lower NM content than SNc, such as putamen, globus pallidus, and caudate nucleus, do not display the intense NM MRI signal. The locus coeruleus appeared to be rich in NM pigments [138].
A T1 weighted protocol, but with a relatively short duration turbo “fast spin-echo” pulse sequence (TSE), can be used to assess NM brain content. The signal is averaged within a region manually traced on a single axial slice and then the contrast-to-noise ratio (CNR) is calculated for the SNc of each subject [143].
More recently, analyses of the NM MRI signal in a voxelwise manner have been performed, which more fully capture fine-grained anatomical information contained in the images [144].
Appendix A.6. Proton Magnetic Resonance Spectroscopy (MRS)
Magnetic resonance spectroscopy (MRS) is a noninvasive technique that enables the detection of neuronal loss and metabolic changes within specific brain ROI in vivo. MRS may be obtained from different nuclei including protons (1H), phosphorus (31P), fluorine (19F), carbon (13C), and sodium (23Na). Protons are the nuclei most used for clinical applications in the human brain, mainly because of their high sensitivity and abundance. After suppression of the signal from water, which is the most abundant metabolite, MRS allows the detection of the signal of several brain metabolites, which generate smaller metabolic peaks [145]. These include N-acetylaspartate (NAA), creatine-phosphocreatine (Cr), choline-containing compounds (Cho), and myoinositol (mI). NAA is considered a neuronal viability marker and its reduction reflects neuronal loss or damage; Cr changes indicate an abnormality in energy metabolism; decreased or increased concentrations of Cho suggest membrane turnover impairment and mI provides information concerning the glial cells [45]. Indeed, ml represents a product of myelin degradation. Elevated ml occurs with a proliferation of glial cells or with increased glial-cell size, as found in inflammation [145]. NAA/Cr and Cho/Cr ratios reflect changes in neuron function and metabolism in ROIs.
References
- Stoker, T.B.; Barker, R.A. Recent developments in the treatment of Parkinson’s Disease. F1000Research 2020, 9, 862. [Google Scholar] [CrossRef]
- Greffard, S.; Verny, M.; Bonnet, A.-M.; Beinis, J.-Y.; Gallinari, C.; Meaume, S.; Piette, F.; Hauw, J.-J.; Duyckaerts, C. Motor Score of the Unified Parkinson Disease Rating Scale as a Good Predictor of Lewy Body–Associated Neuronal Loss in the Substantia Nigra. Arch. Neurol. 2006, 63, 584. [Google Scholar] [CrossRef] [PubMed]
- Postuma, R.B.; Aarsland, D.; Barone, P.; Burn, D.J.; Hawkes, C.H.; Oertel, W.; Ziemssen, T. Identifying prodromal Parkinson’s disease: Pre-Motor disorders in Parkinson’s disease. Mov. Disord. 2012, 27, 617–626. [Google Scholar] [CrossRef] [PubMed]
- Sakakibara, R.; Tateno, F.; Aiba, Y.; Ogata, T.; Kishi, M.; Terada, H.; Inaoka, T.; Nakatsuka, T.; Matsuoka, K. MIBG Myocardial Scintigraphy Identifies Premotor PD/DLB During a Negative DAT Scan Period: Second Report: Mibg Test Identifies Premotor PD/DLB. Mov. Disord. Clin. Pract. 2019, 6, 46–50. [Google Scholar] [CrossRef] [PubMed]
- Mitchell, T.; Lehéricy, S.; Chiu, S.Y.; Strafella, A.P.; Stoessl, A.J.; Vaillancourt, D.E. Emerging Neuroimaging Biomarkers Across Disease Stage in Parkinson Disease: A Review. JAMA Neurol. 2021, 78, 1262. [Google Scholar] [CrossRef]
- Lehéricy, S.; Bardinet, E.; Poupon, C.; Vidailhet, M.; François, C. 7 tesla magnetic resonance imaging: A closer look at substantia nigra anatomy in Parkinson’s disease: 7T MRI in PD. Mov. Disord. 2014, 29, 1574–1581. [Google Scholar] [CrossRef]
- Page, M.J.; McKenzie, J.E.; Bossuyt, P.M.; Boutron, I.; Hoffmann, T.C.; Mulrow, C.D.; Shamseer, L.; Tetzlaff, J.M.; Akl, E.A.; Brennan, S.E.; et al. The PRISMA 2020 statement: An updated guideline for reporting systematic reviews. BMJ 2021, n71. [Google Scholar] [CrossRef]
- American Academy of Sleep Medicine. International Classification of Sleep Disorders, 3rd ed.; American Academy of Sleep Medicine: Darien, IL, USA, 2014. [Google Scholar]
- Dauvilliers, Y.; Schenck, C.H.; Postuma, R.B.; Iranzo, A.; Luppi, P.-H.; Plazzi, G.; Montplaisir, J.; Boeve, B. REM sleep behaviour disorder. Nat. Rev. Dis. Primer 2018, 4, 19. [Google Scholar] [CrossRef]
- Iranzo, A.; Fernández-Arcos, A.; Tolosa, E.; Serradell, M.; Molinuevo, J.L.; Valldeoriola, F.; Gelpi, E.; Vilaseca, I.; Sánchez-Valle, R.; Lladó, A.; et al. Neurodegenerative Disorder Risk in Idiopathic REM Sleep Behavior Disorder: Study in 174 Patients. PLoS ONE 2014, 9, e89741. [Google Scholar] [CrossRef]
- Eisensehr, I.; Linke, R.; Tatsch, K.; Kharraz, B.; Gildehaus, J.F.; Wetter, C.T.; Trenkwalder, C.; Schwarz, J.; Noachtar, S. Increased Muscle Activity During Rapid Eye Movement Sleep Correlates with Decrease of Striatal Presynaptic Dopamine Transporters. IPT and IBZM SPECT Imaging in Subclinical and Clinically Manifest Idiopathic REM Sleep Behavior Disorder, Parkinson’s Disease, and Controls. Sleep 2003, 26, 507–512. [Google Scholar] [CrossRef]
- Dauvilliers, Y.; Jennum, P.; Plazzi, G. Rapid eye movement sleep behavior disorder and rapid eye movement sleep without atonia in narcolepsy. Sleep Med. 2013, 14, 775–781. [Google Scholar] [CrossRef] [PubMed]
- Högl, B.; Stefani, A.; Videnovic, A. Idiopathic REM sleep behaviour disorder and neurodegeneration—An update. Nat. Rev. Neurol. 2018, 14, 40–55. [Google Scholar] [CrossRef] [PubMed]
- Winkelman, J.W.; James, L. Serotonergic Antidepressants are Associated with REM Sleep Without Atonia. Sleep 2004, 27, 317–321. [Google Scholar] [CrossRef] [PubMed]
- Rekling, J.C.; Funk, G.D.; Bayliss, D.A.; Dong, X.-W.; Feldman, J.L. Synaptic Control of Motoneuronal Excitability. Physiol. Rev. 2000, 80, 767–852. [Google Scholar] [CrossRef]
- De Cock, V.C.; Vidailhet, M.; Leu, S.; Texeira, A.; Apartis, E.; Elbaz, A.; Roze, E.; Willer, J.C.; Derenne, J.P.; Agid, Y.; et al. Restoration of normal motor control in Parkinson’s disease during REM sleep. Brain 2007, 130, 450–456. [Google Scholar] [CrossRef]
- Mayer, G.; Bitterlich, M.; Kuwert, T.; Ritt, P.; Stefan, H. Ictal SPECT in patients with rapid eye movement sleep behaviour disorder. Brain 2015, 138, 1263–1270. [Google Scholar] [CrossRef]
- Iranzo, A.; Tolosa, E.; Gelpi, E.; Molinuevo, J.L.; Valldeoriola, F.; Serradell, M.; Sanchez-Valle, R.; Vilaseca, I.; Lomeña, F.; Vilas, D.; et al. Neurodegenerative disease status and post-mortem pathology in idiopathic rapid-eye-movement sleep behaviour disorder: An observational cohort study. Lancet Neurol. 2013, 12, 443–453. [Google Scholar] [CrossRef]
- Uchiyama, M.; Isse, K.; Tanaka, K.; Yokota, N.; Hamamoto, M.; Aida, S.; Ito, Y.; Yoshimura, M.; Okawa, M. Incidental Lewy body disease in a patient with REM sleep behavior disorder. Neurology 1995, 45, 709–712. [Google Scholar] [CrossRef]
- Boeve, B.F.; Dickson, D.W.; Olson, E.J.; Shepard, J.W.; Silber, M.H.; Ferman, T.J.; Ahlskog, J.E.; Benarroch, E.E. Insights into REM sleep behavior disorder pathophysiology in brainstem-predominant Lewy body disease. Sleep Med. 2007, 8, 60–64. [Google Scholar] [CrossRef]
- Rahayel, S.; Tremblay, C.; Vo, A.; Misic, B.; Lehéricy, S.; Arnulf, I.; Vidailhet, M.; Corvol, J.-C.; the ICEBERG Study Group; Vidailhet, M.; et al. Mitochondrial function-associated genes underlie cortical atrophy in prodromal synucleinopathies. Brain 2023, 146, 3301–3318. [Google Scholar] [CrossRef]
- Rahayel, S.; Postuma, R.B.; Montplaisir, J.; Bedetti, C.; Brambati, S.; Carrier, J.; Monchi, O.; Bourgouin, P.-A.; Gaubert, M.; Gagnon, J.-F. Abnormal Gray Matter Shape, Thickness, and Volume in the Motor Cortico-Subcortical Loop in Idiopathic Rapid Eye Movement Sleep Behavior Disorder: Association with Clinical and Motor Features. Cereb. Cortex 2018, 28, 658–671. [Google Scholar] [CrossRef] [PubMed]
- Ellmore, T.M.; Hood, A.J.; Castriotta, R.J.; Stimming, E.F.; Bick, R.J.; Schiess, M.C. Reduced volume of the putamen in REM sleep behavior disorder patients. Park. Relat. Disord. 2010, 16, 645–649. [Google Scholar] [CrossRef] [PubMed]
- Chen, M.; Li, Y.; Chen, J.; Gao, L.; Sun, J.; Gu, Z.; Wu, T.; Chan, P. Structural and functional brain alterations in patients with idiopathic rapid eye movement sleep behavior disorder. J. Neuroradiol. 2022, 49, 66–72. [Google Scholar] [CrossRef] [PubMed]
- Rahayel, S.; Montplaisir, J.; Monchi, O.; Bedetti, C.; Postuma, R.B.; Brambati, S.; Carrier, J.; Joubert, S.; Latreille, V.; Jubault, T.; et al. Patterns of cortical thinning in idiopathic rapid eye movement sleep behavior disorder. Mov. Disord. 2015, 30, 680–687. [Google Scholar] [CrossRef]
- Hanyu, H.; Inoue, Y.; Sakurai, H.; Kanetaka, H.; Nakamura, M.; Miyamoto, T.; Sasai, T.; Iwamoto, T. Voxel-based magnetic resonance imaging study of structural brain changes in patients with idiopathic REM sleep behavior disorder. Park. Relat. Disord. 2012, 18, 136–139. [Google Scholar] [CrossRef] [PubMed]
- Campabadal, A.; Segura, B.; Junque, C.; Serradell, M.; Abos, A.; Uribe, C.; Baggio, H.C.; Gaig, C.; Santamaria, J.; Compta, Y.; et al. Cortical Gray Matter and Hippocampal Atrophy in Idiopathic Rapid Eye Movement Sleep Behavior Disorder. Front. Neurol. 2019, 10, 312. [Google Scholar] [CrossRef]
- Rahayel, S.; Postuma, R.B.; Montplaisir, J.; Génier Marchand, D.; Escudier, F.; Gaubert, M.; Bourgouin, P.-A.; Carrier, J.; Monchi, O.; Joubert, S.; et al. Cortical and subcortical gray matter bases of cognitive deficits in REM sleep behavior disorder. Neurology 2018, 90, e1759–e1770. [Google Scholar] [CrossRef]
- Rahayel, S.; Tremblay, C.; Vo, A.; Zheng, Y.Q.; Lehéricy, S.; Arnulf, I.; Vidailhet, M.; Corvol, J.C.; ICEBERG Study Group; Vidailhet, M.; et al. Brain atrophy in prodromal synucleinopathy is shaped by structural connectivity and gene expression. Brain 2022, 145, 3162–3178. [Google Scholar] [CrossRef]
- Rahayel, S.; Postuma, R.B.; Montplaisir, J.; Mišić, B.; Tremblay, C.; Vo, A.; Lewis, S.; Matar, E.; Ehgoetz Martens, K.; Blanc, F.; et al. A Prodromal Brain-Clinical Pattern of Cognition in Synucleinopathies. Ann. Neurol. 2021, 89, 341–357. [Google Scholar] [CrossRef]
- Shin, J.H.; Kim, H.; Kim, Y.K.; Yoon, E.J.; Nam, H.; Jeon, B.; Lee, J.-Y. Longitudinal evolution of cortical thickness signature reflecting Lewy body dementia in isolated REM sleep behavior disorder: A prospective cohort study. Transl. Neurodegener. 2023, 12, 27. [Google Scholar] [CrossRef]
- Pyatigorskaya, N.; Gaurav, R.; Arnaldi, D.; Leu-Semenescu, S.; Yahia-Cherif, L.; Valabregue, R.; Vidailhet, M.; Arnulf, I.; Lehéricy, S. Magnetic Resonance Imaging Biomarkers to Assess Substantia Nigra Damage in Idiopathic Rapid Eye Movement Sleep Behavior Disorder. Sleep 2017, 40, zsx149. [Google Scholar] [CrossRef] [PubMed]
- Biondetti, E.; Gaurav, R.; Yahia-Cherif, L.; Mangone, G.; Pyatigorskaya, N.; Valabrègue, R.; Ewenczyk, C.; Hutchison, M.; François, C.; Arnulf, I.; et al. Spatiotemporal changes in substantia nigra neuromelanin content in Parkinson’s disease. Brain 2020, 143, 2757–2770. [Google Scholar] [CrossRef] [PubMed]
- Knudsen, K.; Fedorova, T.D.; Hansen, A.K.; Sommerauer, M.; Otto, M.; Svendsen, K.B.; Nahimi, A.; Stokholm, M.G.; Pavese, N.; Beier, C.P.; et al. In-vivo staging of pathology in REM sleep behaviour disorder: A multimodality imaging case-control study. Lancet Neurol. 2018, 17, 618–628. [Google Scholar] [CrossRef] [PubMed]
- Ehrminger, M.; Latimier, A.; Pyatigorskaya, N.; Garcia-Lorenzo, D.; Leu-Semenescu, S.; Vidailhet, M.; Lehericy, S.; Arnulf, I. The coeruleus/subcoeruleus complex in idiopathic rapid eye movement sleep behaviour disorder. Brain 2016, 139, 1180–1188. [Google Scholar] [CrossRef]
- Lancione, M.; Donatelli, G.; Del Prete, E.; Campese, N.; Frosini, D.; Cencini, M.; Costagli, M.; Biagi, L.; Lucchi, G.; Tosetti, M.; et al. Evaluation of iron overload in nigrosome 1 via quantitative susceptibility mapping as a progression biomarker in prodromal stages of synucleinopathies. NeuroImage 2022, 260, 119454. [Google Scholar] [CrossRef] [PubMed]
- Bae, Y.J.; Kim, J.-M.; Kim, K.J.; Kim, E.; Park, H.S.; Kang, S.Y.; Yoon, I.-Y.; Lee, J.-Y.; Jeon, B.; Kim, S.E. Loss of Substantia Nigra Hyperintensity at 3.0-T MR Imaging in Idiopathic REM Sleep Behavior Disorder: Comparison with 123 I-FP-CIT SPECT. Radiology 2018, 287, 285–293. [Google Scholar] [CrossRef]
- Frosini, D.; Cosottini, M.; Donatelli, G.; Costagli, M.; Biagi, L.; Pacchetti, C.; Terzaghi, M.; Cortelli, P.; Arnaldi, D.; Bonanni, E.; et al. Seven tesla MRI of the substantia nigra in patients with rapid eye movement sleep behavior disorder. Park. Relat. Disord. 2017, 43, 105–109. [Google Scholar] [CrossRef]
- Sun, J.; Lai, Z.; Ma, J.; Gao, L.; Chen, M.; Chen, J.; Fang, J.; Fan, Y.; Bao, Y.; Zhang, D.; et al. Quantitative Evaluation of Iron Content in Idiopathic Rapid Eye Movement Sleep Behavior Disorder. Mov. Disord. 2020, 35, 478–485. [Google Scholar] [CrossRef]
- Dayan, E.; Browner, N. Alterations in striato-thalamo-pallidal intrinsic functional connectivity as a prodrome of Parkinson’s disease. NeuroImage Clin. 2017, 16, 313–318. [Google Scholar] [CrossRef]
- Rolinski, M.; Griffanti, L.; Piccini, P.; Roussakis, A.A.; Szewczyk-Krolikowski, K.; Menke, R.A.; Quinnell, T.; Zaiwalla, Z.; Klein, J.C.; Mackay, C.E.; et al. Basal ganglia dysfunction in idiopathic REM sleep behaviour disorder parallels that in early Parkinson’s disease. Brain 2016, 139, 2224–2234. [Google Scholar] [CrossRef]
- Ellmore, T.M.; Castriotta, R.J.; Hendley, K.L.; Aalbers, B.M.; Furr-Stimming, E.; Hood, A.J.; Suescun, J.; Beurlot, M.R.; Hendley, R.T.; Schiess, M.C. Altered Nigrostriatal and Nigrocortical Functional Connectivity in Rapid Eye Movement Sleep Behavior Disorder. Sleep 2013, 36, 1885–1892. [Google Scholar] [CrossRef] [PubMed]
- Marques, A.; Roquet, D.; Matar, E.; Taylor, N.L.; Pereira, B.; O’Callaghan, C.; Lewis, S.J.G. Limbic hypoconnectivity in idiopathic REM sleep behaviour disorder with impulse control disorders. J. Neurol. 2021, 268, 3371–3380. [Google Scholar] [CrossRef] [PubMed]
- Binder, T.; Hobert, M.A.; Pfrommer, T.; Leks, E.; Granert, O.; Weigl, B.; Ethofer, T.; Erb, M.; Wilke, M.; Maetzler, W.; et al. Increased functional connectivity in a population at risk of developing Parkinson’s disease. Park. Relat. Disord. 2021, 92, 1–6. [Google Scholar] [CrossRef] [PubMed]
- Iranzo, A.; Santamaría, J.; Pujol, J.; Moreno, A.; Deus, J.; Tolosa, E. Brainstem Proton Magnetic Resonance Spectroscopy in Idopathic REM Sleep Behavior Disorder. Sleep 2002, 25, 28–31. [Google Scholar] [CrossRef]
- Zhang, L.; Xu, Y.; Zhuang, J.; Peng, H.; Wu, H.; Zhao, Z.; He, B.; Zhao, Z. Metabolic abnormality of pontine tegmentum in patients with REM sleep behavior disorder analyzed using magnetic resonance spectroscopy. Clin. Neurol. Neurosurg. 2016, 148, 137–141. [Google Scholar] [CrossRef] [PubMed]
- Chen, J.; Zhou, L.; Jiang, C.; Chen, Z.; Zhang, L.; Zhou, H.; Kang, W.; Jiang, X.; Li, Y.; Luo, N.; et al. Impaired Ocular Tracking and Cortical Atrophy in Idiopathic Rapid Eye Movement Sleep Behavior Disorder. Mov. Disord. 2022, 37, 972–982. [Google Scholar] [CrossRef]
- Pereira, J.B.; Weintraub, D.; Chahine, L.; Aarsland, D.; Hansson, O.; Westman, E. Cortical thinning in patients with REM sleep behavior disorder is associated with clinical progression. Npj Park. Dis. 2019, 5, 7. [Google Scholar] [CrossRef]
- Unger, M.M.; Belke, M.; Menzler, K.; Heverhagen, J.T.; Keil, B.; Stiasny-Kolster, K.; Rosenow, F.; Diederich, N.J.; Mayer, G.; Möller, J.C.; et al. Diffusion Tensor Imaging in Idiopathic REM Sleep Behavior Disorder Reveals Microstructural Changes in the Brainstem, Substantia Nigra, Olfactory Region, and Other Brain Regions. Sleep 2010, 33, 767–773. [Google Scholar] [CrossRef]
- Biondetti, E.; Santin, M.D.; Valabrègue, R.; Mangone, G.; Gaurav, R.; Pyatigorskaya, N.; Hutchison, M.; Yahia-Cherif, L.; Villain, N.; Habert, M.-O.; et al. The spatiotemporal changes in dopamine, neuromelanin and iron characterizing Parkinson’s disease. Brain 2021, 144, 3114–3125. [Google Scholar] [CrossRef]
- Campabadal, A.; Inguanzo, A.; Segura, B.; Serradell, M.; Abos, A.; Uribe, C.; Gaig, C.; Santamaria, J.; Compta, Y.; Bargallo, N.; et al. Cortical gray matter progression in idiopathic REM sleep behavior disorder and its relation to cognitive decline. NeuroImage Clin. 2020, 28, 102421. [Google Scholar] [CrossRef]
- Mangia, S.; Svatkova, A.; Mascali, D.; Nissi, M.J.; Burton, P.C.; Bednarik, P.; Auerbach, E.J.; Giove, F.; Eberly, L.E.; Howell, M.J.; et al. Multi-modal Brain MRI in Subjects with PD and iRBD. Front. Neurosci. 2017, 11, 709. [Google Scholar] [CrossRef]
- Li, G.; Chen, Z.; Zhou, L.; Zhao, A.; Niu, M.; Li, Y.; Luo, N.; Kang, W.; Liu, J. Altered structure and functional connectivity of the central autonomic network in idiopathic rapid eye movement sleep behaviour disorder. J. Sleep Res. 2021, 30, e13136. [Google Scholar] [CrossRef] [PubMed]
- Brcina, N.; Hohenfeld, C.; Heidbreder, A.; Mirzazade, S.; Krahe, J.; Wojtala, J.; Binkofski, F.; Schulz, J.B.; Schiefer, J.; Reetz, K.; et al. Increased neural motor activation and functional reorganization in patients with idiopathic rapid eye movement sleep behavior disorder. Park. Relat. Disord. 2021, 92, 76–82. [Google Scholar] [CrossRef]
- Lee, J.-H.; Han, Y.-H.; Cho, J.-W.; Lee, J.-S.; Lee, S.-J.; Kim, D.-J.; Kim, T.-H.; Kang, B.-M.; Kim, T.-H.; Mun, C.-W. Evaluation of brain iron content in idiopathic REM sleep behavior disorder using quantitative magnetic resonance imaging. Park. Relat. Disord. 2014, 20, 776–778. [Google Scholar] [CrossRef] [PubMed]
- Chung, S.J.; Cho, K.H.; Lee, Y.H.; Yoo, H.S.; Baik, K.; Jung, J.H.; Ye, B.S.; Sohn, Y.H.; Cha, J.; Lee, P.H. Diffusion tensor imaging-based pontine damage as a degeneration marker in synucleinopathy. J. Neurosci. Res. 2021, 99, 2922–2931. [Google Scholar] [CrossRef] [PubMed]
- Takahashi, H.; Kashiwagi, N.; Arisawa, A.; Matsuo, C.; Kato, H.; Adachi, H.; Kajiyama, Y.; Mochizuki, H.; Tomiyama, N. Imaging of the nigrostriatal system for evaluating the preclinical phase of Parkinson’s disease development: The utility of neuromelanin, diffusion MRI, and DAT-SPECT. Br. J. Radiol. 2022, 95, 20210837. [Google Scholar] [CrossRef]
- Lee, D.A.; Lee, H.-J.; Kim, H.C.; Park, K.M. Application of machine learning analysis based on diffusion tensor imaging to identify REM sleep behavior disorder. Sleep Breath. 2022, 26, 633–640. [Google Scholar] [CrossRef]
- Ehgoetz Martens, K.A.; Matar, E.; Shine, J.M.; Phillips, J.R.; Georgiades, M.J.; Grunstein, R.R.; Halliday, G.M.; Lewis, S.J.G. The Neural Signature of Impaired Dual-Tasking in Idiopathic Rapid Eye Movement Sleep Behavior Disorder Patients. Mov. Disord. 2020, 35, 1596–1606. [Google Scholar] [CrossRef]
- Chen, Y.; Fan, C.; Yang, W.; Nie, K.; Wu, X.; Yang, Y.; Yang, Y.; Wang, L.; Zhang, Y.; Huang, B. Cortical hypoperfusion in patients with idiopathic rapid eye movement sleep behavior disorder detected with arterial spin-labeled perfusion MRI. Neurol. Sci. 2020, 41, 809–815. [Google Scholar] [CrossRef]
- Lee, D.A.; Lee, H.; Park, K.M. Glymphatic dysfunction in isolated REM sleep behavior disorder. Acta Neurol. Scand. 2022, 145, 464–470. [Google Scholar] [CrossRef]
- Byun, J.-I.; Kim, H.-W.; Kang, H.; Cha, K.S.; Sunwoo, J.-S.; Shin, J.-W.; Moon, J.; Lee, S.-T.; Jung, K.-H.; Chu, K.; et al. Altered resting-state thalamo-occipital functional connectivity is associated with cognition in isolated rapid eye movement sleep behavior disorder. Sleep Med. 2020, 69, 198–203. [Google Scholar] [CrossRef]
- Rémillard-Pelchat, D.; Rahayel, S.; Gaubert, M.; Postuma, R.B.; Montplaisir, J.; Pelletier, A.; Monchi, O.; Brambati, S.M.; Carrier, J.; Gagnon, J.-F. Comprehensive Analysis of Brain Volume in REM Sleep Behavior Disorder with Mild Cognitive Impairment. J. Park. Dis. 2022, 12, 229–241. [Google Scholar] [CrossRef] [PubMed]
- Scherfler, C.; Frauscher, B.; Schocke, M.; Iranzo, A.; Gschliesser, V.; Seppi, K.; Santamaria, J.; Tolosa, E.; Högl, B.; Poewe, W.; et al. White and gray matter abnormalities in idiopathic rapid eye movement sleep behavior disorder: A diffusion-tensor imaging and voxel-based morphometry study. Ann. Neurol. 2011, 69, 400–407. [Google Scholar] [CrossRef] [PubMed]
- Ohlhauser, L.; Smart, C.M.; Gawryluk, J.R. Tract-Based Spatial Statistics Reveal Lower White Matter Integrity Specific to Idiopathic Rapid Eye Movement Sleep Behavior Disorder as a Proxy for Prodromal Parkinson’s Disease. J. Park. Dis. 2019, 9, 723–731. [Google Scholar] [CrossRef] [PubMed]
- Zhou, L.; Li, G.; Zhang, Y.; Zhang, M.; Chen, Z.; Zhang, L.; Wang, X.; Zhang, M.; Ye, G.; Li, Y.; et al. Increased free water in the substantia nigra in idiopathic REM sleep behaviour disorder. Brain 2021, 144, 1488–1497. [Google Scholar] [CrossRef]
- García-Gomar, M.G.; Videnovic, A.; Singh, K.; Stauder, M.; Lewis, L.D.; Wald, L.L.; Rosen, B.R.; Bianciardi, M. Disruption of Brainstem Structural Connectivity in REM Sleep Behavior Disorder Using 7 Tesla Magnetic Resonance Imaging. Mov. Disord. 2022, 37, 847–853. [Google Scholar] [CrossRef]
- De Marzi, R.; Seppi, K.; Högl, B.; Müller, C.; Scherfler, C.; Stefani, A.; Iranzo, A.; Tolosa, E.; Santamarìa, J.; Gizewski, E.; et al. Loss of dorsolateral nigral hyperintensity on 3.0 tesla susceptibility-weighted imaging in idiopathic rapid eye movement sleep behavior disorder: Loss of Dorsolateral Nigral Hyperintensity in iRBD. Ann. Neurol. 2016, 79, 1026–1030. [Google Scholar] [CrossRef]
- Barber, T.R.; Griffanti, L.; Bradley, K.M.; McGowan, D.R.; Lo, C.; Mackay, C.E.; Hu, M.T.; Klein, J.C. Nigrosome 1 imaging in REM sleep behavior disorder and its association with dopaminergic decline. Ann. Clin. Transl. Neurol. 2020, 7, 26–35. [Google Scholar] [CrossRef]
- Zhang, X.; Chai, C.; Ghassaban, K.; Ye, J.; Huang, Y.; Zhang, T.; Wu, W.; Zhu, J.; Zhang, X.; Haacke, E.M.; et al. Assessing brain iron and volume of subcortical nuclei in idiopathic rapid eye movement sleep behavior disorder. Sleep 2021, 44, zsab131. [Google Scholar] [CrossRef]
- Eskildsen, S.F.; Iranzo, A.; Stokholm, M.G.; Stær, K.; Østergaard, K.; Serradell, M.; Otto, M.; Svendsen, K.B.; Garrido, A.; Vilas, D.; et al. Impaired cerebral microcirculation in isolated REM sleep behaviour disorder. Brain 2021, 144, 1498–1508. [Google Scholar] [CrossRef]
- Si, X.; Guo, T.; Wang, Z.; Fang, Y.; Gu, L.; Cao, L.; Yang, W.; Gao, T.; Song, Z.; Tian, J.; et al. Neuroimaging evidence of glymphatic system dysfunction in possible REM sleep behavior disorder and Parkinson’s disease. Npj Park. Dis. 2022, 8, 54. [Google Scholar] [CrossRef]
- Bae, Y.J.; Kim, J.-M.; Choi, B.S.; Ryoo, N.; Song, Y.S.; Nam, Y.; Yoon, I.-Y.; Cho, S.J.; Kim, J.H. Altered Brain Glymphatic Flow at Diffusion-Tensor MRI in Rapid Eye Movement Sleep Behavior Disorder. Radiology 2023, 307, 221848. [Google Scholar] [CrossRef]
- Muñoz-Lopetegi, A.; Berenguer, J.; Iranzo, A.; Serradell, M.; Pujol, T.; Gaig, C.; Muñoz, E.; Tolosa, E.; Santamaría, J. Magnetic resonance imaging abnormalities as a marker of multiple system atrophy in isolated rapid eye movement sleep behavior disorder. Sleep 2021, 44, zsaa089. [Google Scholar] [CrossRef]
- Gaurav, R.; Pyatigorskaya, N.; Biondetti, E.; Valabrègue, R.; Yahia-Cherif, L.; Mangone, G.; Leu-Semenescu, S.; Corvol, J.; Vidailhet, M.; Arnulf, I.; et al. Deep Learning-Based Neuromelanin MRI Changes of Isolated REM Sleep Behavior Disorder. Mov. Disord. 2022, 37, 1064–1069. [Google Scholar] [CrossRef]
- Salsone, M.; Cerasa, A.; Arabia, G.; Morelli, M.; Gambardella, A.; Mumoli, L.; Nisticò, R.; Vescio, B.; Quattrone, A. Reduced thalamic volume in Parkinson disease with REM sleep behavior disorder: Volumetric study. Park. Relat. Disord. 2014, 20, 1004–1008. [Google Scholar] [CrossRef]
- Bourgouin, P.-A.; Rahayel, S.; Gaubert, M.; Postuma, R.B.; Montplaisir, J.; Carrier, J.; Monchi, O.; Pelletier, A.; Gagnon, J.-F. Gray matter substrates of depressive and anxiety symptoms in idiopathic REM sleep behavior disorder. Park. Relat. Disord. 2019, 62, 163–170. [Google Scholar] [CrossRef]
- Park, K.M.; Lee, H.-J.; Lee, B.I.; Kim, S.E. Alterations of the brain network in idiopathic rapid eye movement sleep behavior disorder: Structural connectivity analysis. Sleep Breath. 2019, 23, 587–593. [Google Scholar] [CrossRef] [PubMed]
- Holtbernd, F.; Romanzetti, S.; Oertel, W.H.; Knake, S.; Sittig, E.; Heidbreder, A.; Maier, A.; Krahe, J.; Wojtala, J.; Dogan, I.; et al. Convergent patterns of structural brain changes in rapid eye movement sleep behavior disorder and Parkinson’s disease on behalf of the German rapid eye movement sleep behavior disorder study group. Sleep 2021, 44, zsaa199. [Google Scholar] [CrossRef] [PubMed]
- Sanjari Moghaddam, H.; Dolatshahi, M.; Salardini, E.; Aarabi, M.H. Association of olfaction dysfunction with brain microstructure in prodromal Parkinson disease. Neurol. Sci. 2019, 40, 283–291. [Google Scholar] [CrossRef] [PubMed]
- Pimer, L.J.; Leslie, R.A.; Phillips, G.; Newman, A.J.; Rusak, B.; Rolheiser, T.M.; Schoffer, K.; Khan, M.N.; McKelvey, J.R.; Robertson, H.A.; et al. Aberrant corticospinal tract characteristics in prodromal PD: A diffusion tensor imaging study. Clin. Park. Relat. Disord. 2023, 8, 100182. [Google Scholar] [CrossRef]
- Wen, M.-C.; Heng, H.S.E.; Hsu, J.-L.; Xu, Z.; Liew, G.M.; Au, W.L.; Chan, L.L.; Tan, L.C.S.; Tan, E.K. Structural connectome alterations in prodromal and de novo Parkinson’s disease patients. Park. Relat. Disord. 2017, 45, 21–27. [Google Scholar] [CrossRef]
- Peña-Nogales, Ó.; Ellmore, T.M.; de Luis-García, R.; Suescun, J.; Schiess, M.C.; Giancardo, L. Longitudinal Connectomes as a Candidate Progression Marker for Prodromal Parkinson’s Disease. Front. Neurosci. 2019, 12, 967. [Google Scholar] [CrossRef] [PubMed]
- Lotfipour, A.K.; Wharton, S.; Schwarz, S.T.; Gontu, V.; Schäfer, A.; Peters, A.M.; Bowtell, R.W.; Auer, D.P.; Gowland, P.A.; Bajaj, N.P.S. High resolution magnetic susceptibility mapping of the substantia nigra in Parkinson’s disease. J. Magn. Reson. Imaging 2012, 35, 48–55. [Google Scholar] [CrossRef]
- Tan, S.; Zhou, C.; Wen, J.; Duanmu, X.; Guo, T.; Wu, H.; Wu, J.; Cao, Z.; Liu, X.; Chen, J.; et al. Presence but not the timing of onset of REM sleep behavior disorder distinguishes evolution patterns in Parkinson’s disease. Neurobiol. Dis. 2023, 180, 106084. [Google Scholar] [CrossRef]
- Mangone, G.; Houot, M.; Gaurav, R.; Boluda, S.; Pyatigorskaya, N.; Chalancon, A.; Seilhean, D.; Prigent, A.; Lehéricy, S.; Arnulf, I.; et al. Relationship between Substantia Nigra Neuromelanin Imaging and Dual Alpha-Synuclein Labeling of Labial Minor in Salivary Glands in Isolated Rapid Eye Movement Sleep Behavior Disorder and Parkinson’s Disease. Genes 2022, 13, 1715. [Google Scholar] [CrossRef]
- Shibata, E.; Sasaki, M.; Tohyama, K.; Otsuka, K.; Sakai, A. Reduced signal of locus ceruleus in depression in quantitative neuromelanin magnetic resonance imaging. NeuroReport 2007, 18, 415–418. [Google Scholar] [CrossRef]
- Shibata, E.; Sasaki, M.; Tohyama, K.; Otsuka, K.; Endoh, J.; Terayama, Y.; Sakai, A. Use of Neuromelanin-Sensitive MRI to Distinguish Schizophrenic and Depressive Patients and Healthy Individuals Based on Signal Alterations in the Substantia Nigra and Locus Ceruleus. Biol. Psychiatry 2008, 64, 401–406. [Google Scholar] [CrossRef] [PubMed]
- Li, G.; Chen, Z.; Zhou, L.; Yao, M.; Luo, N.; Kang, W.; Chen, S.; Liu, J. Abnormal intrinsic brain activity of the putamen is correlated with dopamine deficiency in idiopathic rapid eye movement sleep behavior disorder. Sleep Med. 2020, 75, 73–80. [Google Scholar] [CrossRef]
- Wakasugi, N.; Togo, H.; Mukai, Y.; Nishikawa, N.; Sakamoto, T.; Murata, M.; Takahashi, Y.; Matsuda, H.; Hanakawa, T. Prefrontal network dysfunctions in rapid eye movement sleep behavior disorder. Park. Relat. Disord. 2021, 85, 72–77. [Google Scholar] [CrossRef]
- Zhang, H.-J.; Wang, S.-H.; Bai, Y.-Y.; Zhang, J.-W.; Chen, S. Abnormal Striatal-Cortical Networks Contribute to the Attention/Executive Function Deficits in Idiopathic REM Sleep Behavior Disorder: A Resting State Functional MRI Study. Front. Aging Neurosci. 2021, 13, 690854. [Google Scholar] [CrossRef] [PubMed]
- Chen, S.; Wang, S.-H.; Bai, Y.-Y.; Zhang, J.-W.; Zhang, H.-J. Comparative Study on Topological Properties of the Whole-Brain Functional Connectome in Idiopathic Rapid Eye Movement Sleep Behavior Disorder and Parkinson’s Disease Without RBD. Front. Aging Neurosci. 2022, 14, 820479. [Google Scholar] [CrossRef]
- Campabadal, A.; Abos, A.; Segura, B.; Serradell, M.; Uribe, C.; Baggio, H.C.; Gaig, C.; Santamaria, J.; Compta, Y.; Bargallo, N.; et al. Disruption of posterior brain functional connectivity and its relation to cognitive impairment in idiopathic REM sleep behavior disorder. NeuroImage Clin. 2020, 25, 102138. [Google Scholar] [CrossRef]
- Wei, J.; Lyu, J.; Xiang, J.; Niu, Y.; Yang, L.; Fan, C.; Li, D.; Yang, Y. Impaired Brain Information Transmission Efficiency and Flexibility in Parkinson’s Disease and Rapid Eye Movement Sleep Behavior Disorder: Evidence from Functional Connectivity and Functional Dynamics. Park. Dis. 2022, 2022, 495371. [Google Scholar] [CrossRef]
- Byun, J.-I.; Cha, K.S.; Kim, M.; Lee, W.-J.; Lee, H.S.; Sunwoo, J.-S.; Shin, J.-W.; Kim, T.-J.; Jun, J.-S.; Kim, H.-J.; et al. Association of Nucleus Basalis of Meynert Functional Connectivity and Cognition in Idiopathic Rapid-Eye-Movement Sleep Behavior Disorder. J. Clin. Neurol. 2022, 18, 562. [Google Scholar] [CrossRef] [PubMed]
- Li, G.; Zhou, L.; Chen, Z.; Luo, N.; Niu, M.; Li, Y.; Kang, W.; Liu, J. Dynamic functional connectivity impairments in idiopathic rapid eye movement sleep behavior disorder. Park. Relat. Disord. 2020, 79, 11–17. [Google Scholar] [CrossRef] [PubMed]
- Ehgoetz Martens, K.A.; Matar, E.; Phillips, J.R.; Shine, J.M.; Grunstein, R.R.; Halliday, G.M.; Lewis, S.J.G. Narrow doorways alter brain connectivity and step patterns in isolated REM sleep behaviour disorder. NeuroImage Clin. 2022, 33, 102958. [Google Scholar] [CrossRef]
- Si, X.; Gu, L.; Song, Z.; Zhou, C.; Fang, Y.; Jin, C.; Wu, J.; Gao, T.; Guo, T.; Guan, X.; et al. Different Perivascular Space Burdens in Idiopathic Rapid Eye Movement Sleep Behavior Disorder and Parkinson’s Disease. Front. Aging Neurosci. 2020, 12, 580853. [Google Scholar] [CrossRef]
- McCarter, S.J.; Louis, E.K. Lesional RBD. In Rapid-Eye-Movement Sleep Behavior Disorder; Schenck, C.H., Högl, B., Videnovic, A., Eds.; Springer International Publishing: Cham, Switzerland, 2019; pp. 107–121. ISBN 978-3-319-90151-0. [Google Scholar]
- Heldmann, M.; Heeren, J.; Klein, C.; Rauch, L.; Hagenah, J.; Münte, T.F.; Kasten, M.; Brüggemann, N. Neuroimaging abnormalities in individuals exhibiting Parkinson’s disease risk markers. Mov. Disord. 2018, 33, 1412–1422. [Google Scholar] [CrossRef] [PubMed]
- Claassen, D.O.; McDonell, K.E.; Donahue, M.; Rawal, S.; Wylie, S.A.; Neimat, J.S.; Kang, H.; Hedera, P.; Zald, D.; Landman, B.; et al. Cortical asymmetry in Parkinson’s disease: Early susceptibility of the left hemisphere. Brain Behav. 2016, 6, e00573. [Google Scholar] [CrossRef]
- Pelizzari, L.; Di Tella, S.; Laganà, M.M.; Bergsland, N.; Rossetto, F.; Nemni, R.; Baglio, F. White matter alterations in early Parkinson’s disease: Role of motor symptom lateralization. Neurol. Sci. 2020, 41, 357–364. [Google Scholar] [CrossRef]
- Valli, M.; Uribe, C.; Mihaescu, A.; Strafella, A.P. Neuroimaging of rapid eye movement sleep behavior disorder and its relation to Parkinson’s disease. J. Neurosci. Res. 2022, 100, 1815–1833. [Google Scholar] [CrossRef]
- Barber, T.R.; Klein, J.C.; Mackay, C.E.; Hu, M.T.M. Neuroimaging in pre-motor Parkinson’s disease. NeuroImage Clin. 2017, 15, 215–227. [Google Scholar] [CrossRef]
- Bourgouin, P.-A.; Rahayel, S.; Gaubert, M.; Arnaldi, D.; Hu, M.; Heidbreder, A.; Rémillard-Pelchat, D.; Terzaghi, M.; Gagnon, J.-F. Neuroimaging of Rapid Eye Movement Sleep Behavior Disorder. In International Review of Neurobiology; Elsevier: Amsterdam, The Netherlands, 2019; Volume 144, pp. 185–210. ISBN 978-0-12-818770-8. [Google Scholar]
- Heller, J.; Brcina, N.; Dogan, I.; Holtbernd, F.; Romanzetti, S.; Schulz, J.B.; Schiefer, J.; Reetz, K. Brain imaging findings in idiopathic REM sleep behavior disorder (RBD)—A systematic review on potential biomarkers for neurodegeneration. Sleep Med. Rev. 2017, 34, 23–33. [Google Scholar] [CrossRef] [PubMed]
- Ota, Y.; Kanel, P.; Bohnen, N. Imaging of sleep disorders in pre-Parkinsonian syndromes. Curr. Opin. Neurol. 2022, 35, 443–452. [Google Scholar] [CrossRef]
- Desseilles, M.; Dang-Vu, T.; Schabus, M.; Sterpenich, V.; Maquet, P.; Schwartz, S. Neuroimaging Insights into the Pathophysiology of Sleep Disorders. Sleep 2008, 31, 777–794. [Google Scholar] [CrossRef] [PubMed]
- Campabadal, A.; Segura, B.; Junque, C.; Iranzo, A. Structural and functional magnetic resonance imaging in isolated REM sleep behavior disorder: A systematic review of studies using neuroimaging software. Sleep Med. Rev. 2021, 59, 101495. [Google Scholar] [CrossRef] [PubMed]
- Paulekiene, G.; Pajarskiene, M.; Pajediene, E.; Radziunas, A. Sleep Dysfunction and Grey Matter Volume. Curr. Neurol. Neurosci. Rep. 2022, 22, 275–283. [Google Scholar] [CrossRef] [PubMed]
- Bramer, W.M.; Rethlefsen, M.L.; Kleijnen, J.; Franco, O.H. Optimal database combinations for literature searches in systematic reviews: A prospective exploratory study. Syst. Rev. 2017, 6, 245. [Google Scholar] [CrossRef]
- Pautasso, M. Ten Simple Rules for Writing a Literature Review. PLoS Comput. Biol. 2013, 9, e1003149. [Google Scholar] [CrossRef]
- Zhang, L.; Pini, L.; Corbetta, M. Different MRI structural processing methods do not impact functional connectivity computation. Sci. Rep. 2023, 13, 8589. [Google Scholar] [CrossRef]
- Ashburner, J.; Friston, K.J. Voxel-Based Morphometry—The Methods. NeuroImage 2000, 11, 805–821. [Google Scholar] [CrossRef] [PubMed]
- Gaser, C.; Nenadic, I.; Buchsbaum, B.R.; Hazlett, E.A.; Buchsbaum, M.S. Deformation-Based Morphometry and Its Relation to Conventional Volumetry of Brain Lateral Ventricles in MRI. NeuroImage 2001, 13, 1140–1145. [Google Scholar] [CrossRef] [PubMed]
- Fischl, B.; Dale, A.M. Measuring the thickness of the human cerebral cortex from magnetic resonance images. Proc. Natl. Acad. Sci. USA 2000, 97, 11050–11055. [Google Scholar] [CrossRef] [PubMed]
- Desikan, R.S.; Ségonne, F.; Fischl, B.; Quinn, B.T.; Dickerson, B.C.; Blacker, D.; Buckner, R.L.; Dale, A.M.; Maguire, R.P.; Hyman, B.T.; et al. An automated labeling system for subdividing the human cerebral cortex on MRI scans into gyral based regions of interest. NeuroImage 2006, 31, 968–980. [Google Scholar] [CrossRef]
- Dima, D.; Modabbernia, A.; Papachristou, E.; Doucet, G.E.; Agartz, I.; Aghajani, M.; Akudjedu, T.N.; Albajes-Eizagirre, A.; Alnaes, D.; Alpert, K.I.; et al. Subcortical volumes across the lifespan: Data from 18,605 healthy individuals aged 3-90 years. Hum. Brain Mapp. 2022, 43, 452–469. [Google Scholar] [CrossRef] [PubMed]
- Deoni, S.C.L. Quantitative Relaxometry of the Brain. Top. Magn. Reson. Imaging 2010, 21, 101–113. [Google Scholar] [CrossRef]
- Filip, P.; Svatkova, A.; Carpenter, A.F.; Eberly, L.E.; Nestrasil, I.; Nissi, M.J.; Michaeli, S.; Mangia, S. Rotating frame MRI relaxations as markers of diffuse white matter abnormalities in multiple sclerosis. NeuroImage Clin. 2020, 26, 102234. [Google Scholar] [CrossRef]
- Basser, P.J.; Mattiello, J.; LeBihan, D. MR diffusion tensor spectroscopy and imaging. Biophys. J. 1994, 66, 259–267. [Google Scholar] [CrossRef]
- Rae, C.L.; Correia, M.M.; Altena, E.; Hughes, L.E.; Barker, R.A.; Rowe, J.B. White matter pathology in Parkinson’s disease: The effect of imaging protocol differences and relevance to executive function. NeuroImage 2012, 62, 1675–1684. [Google Scholar] [CrossRef]
- Mole, J.P.; Subramanian, L.; Bracht, T.; Morris, H.; Metzler-Baddeley, C.; Linden, D.E.J. Increased fractional anisotropy in the motor tracts of Parkinson’s disease suggests compensatory neuroplasticity or selective neurodegeneration. Eur. Radiol. 2016, 26, 3327–3335. [Google Scholar] [CrossRef]
- Weston, P.S.J.; Simpson, I.J.A.; Ryan, N.S.; Ourselin, S.; Fox, N.C. Diffusion imaging changes in grey matter in Alzheimer’s disease: A potential marker of early neurodegeneration. Alzheimers Res. Ther. 2015, 7, 47. [Google Scholar] [CrossRef] [PubMed]
- Zhong, Z.; Merkitch, D.; Karaman, M.M.; Zhang, J.; Sui, Y.; Goldman, J.G.; Zhou, X.J. High-Spatial-Resolution Diffusion MRI in Parkinson Disease: Lateral Asymmetry of the Substantia Nigra. Radiology 2019, 291, 149–157. [Google Scholar] [CrossRef] [PubMed]
- Andica, C.; Kamagata, K.; Hatano, T.; Saito, Y.; Ogaki, K.; Hattori, N.; Aoki, S. MR Biomarkers of Degenerative Brain Disorders Derived from Diffusion Imaging. J. Magn. Reson. Imaging 2020, 52, 1620–1636. [Google Scholar] [CrossRef] [PubMed]
- Wang, Y.; Wang, Q.; Haldar, J.P.; Yeh, F.-C.; Xie, M.; Sun, P.; Tu, T.-W.; Trinkaus, K.; Klein, R.S.; Cross, A.H.; et al. Quantification of increased cellularity during inflammatory demyelination. Brain 2011, 134, 3590–3601. [Google Scholar] [CrossRef] [PubMed]
- Behrens, T.E.J.; Woolrich, M.W.; Jenkinson, M.; Johansen-Berg, H.; Nunes, R.G.; Clare, S.; Matthews, P.M.; Brady, J.M.; Smith, S.M. Characterization and propagation of uncertainty in diffusion-weighted MR imaging. Magn. Reson. Med. 2003, 50, 1077–1088. [Google Scholar] [CrossRef]
- Smith, S.M.; Jenkinson, M.; Johansen-Berg, H.; Rueckert, D.; Nichols, T.E.; Mackay, C.E.; Watkins, K.E.; Ciccarelli, O.; Cader, M.Z.; Matthews, P.M.; et al. Tract-based spatial statistics: Voxelwise analysis of multi-subject diffusion data. NeuroImage 2006, 31, 1487–1505. [Google Scholar] [CrossRef]
- Besson, P.; Bandt, S.K.; Proix, T.; Lagarde, S.; Jirsa, V.K.; Ranjeva, J.-P.; Bartolomei, F.; Guye, M. Anatomic consistencies across epilepsies: A stereotactic-EEG informed high-resolution structural connectivity study. Brain 2017, 140, 2639–2652. [Google Scholar] [CrossRef] [PubMed]
- Milano, M.; Guzzi, P.H.; Cannataro, M. Network building and analysis in connectomics studies: A review of algorithms, databases and technologies. Netw. Model. Anal. Health Inform. Bioinforma. 2019, 8, 13. [Google Scholar] [CrossRef]
- Wang, J. Graph-based network analysis of resting-state functional MRI. Front. Syst. Neurosci. 2010, 4, 16. [Google Scholar] [CrossRef]
- Zalesky, A.; Fornito, A.; Bullmore, E.T. Network-based statistic: Identifying differences in brain networks. NeuroImage 2010, 53, 1197–1207. [Google Scholar] [CrossRef]
- Kannurpatti, S.S.; Rypma, B.; Biswal, B.B. Prediction of Task-Related BOLD fMRI with Amplitude Signatures of Resting-State fMRI. Front. Syst. Neurosci. 2012, 6, 7. [Google Scholar] [CrossRef] [PubMed]
- Huang, L.; Zheng, Y.; Zeng, Z.; Li, M.; Zhang, L.; Gao, Y. Fractional Amplitude of Low-Frequency Fluctuations and Functional Connectivity in Comatose Patients Subjected to Resting-State Functional Magnetic Resonance Imaging. Ann. Indian Acad. Neurol. 2019, 22, 203–209. [Google Scholar] [CrossRef]
- Jiao, Q.; Lu, G.; Zhang, Z.; Zhong, Y.; Wang, Z.; Guo, Y.; Li, K.; Ding, M.; Liu, Y. Granger causal influence predicts BOLD activity levels in the default mode network. Hum. Brain Mapp. 2011, 32, 154–161. [Google Scholar] [CrossRef] [PubMed]
- Rubinov, M.; Sporns, O. Complex network measures of brain connectivity: Uses and interpretations. NeuroImage 2010, 52, 1059–1069. [Google Scholar] [CrossRef]
- Sulzer, D.; Cassidy, C.; Horga, G.; Kang, U.J.; Fahn, S.; Casella, L.; Pezzoli, G.; Langley, J.; Hu, X.P.; Zucca, F.A.; et al. Neuromelanin detection by magnetic resonance imaging (MRI) and its promise as a biomarker for Parkinson’s disease. Npj Park. Dis. 2018, 4, 11. [Google Scholar] [CrossRef] [PubMed]
- Schenck, J.F. Magnetic resonance imaging of brain iron. J. Neurol. Sci. 2003, 207, 99–102. [Google Scholar] [CrossRef]
- Halefoglu, A.M.; Yousem, D.M. Susceptibility weighted imaging: Clinical applications and future directions. World J. Radiol. 2018, 10, 30–45. [Google Scholar] [CrossRef]
- Reichenbach, J.R.; Schweser, F.; Serres, B.; Deistung, A. Quantitative Susceptibility Mapping: Concepts and Applications. Clin. Neuroradiol. 2015, 25, 225–230. [Google Scholar] [CrossRef]
- Trujillo, P.; Summers, P.E.; Ferrari, E.; Zucca, F.A.; Sturini, M.; Mainardi, L.T.; Cerutti, S.; Smith, A.K.; Smith, S.A.; Zecca, L.; et al. Contrast mechanisms associated with neuromelanin-MRI: Neuromelanin-MRI Contrast. Magn. Reson. Med. 2017, 78, 1790–1800. [Google Scholar] [CrossRef]
- Sasaki, M.; Shibata, E.; Tohyama, K.; Takahashi, J.; Otsuka, K.; Tsuchiya, K.; Takahashi, S.; Ehara, S.; Terayama, Y.; Sakai, A. Neuromelanin magnetic resonance imaging of locus ceruleus and substantia nigra in Parkinson’s disease. NeuroReport 2006, 17, 1215–1218. [Google Scholar] [CrossRef]
- Cassidy, C.; Girgis, R.; Benavides, C.; Ferrari, E.; Zucca, F.; Sulzer, D.; Abi-Dargham, A.; Zecca, L.; Horga, G. 194. Neuromelanin-Sensitive MRI as an Early Indicator of Dopamine Dysfunction in Individuals at Risk for Psychosis. Schizophr. Bull. 2017, 43, S101. [Google Scholar] [CrossRef][Green Version]
- Bertholdo, D.; Watcharakorn, A.; Castillo, M. Brain Proton Magnetic Resonance Spectroscopy. Neuroimaging Clin. N. Am. 2013, 23, 359–380. [Google Scholar] [CrossRef] [PubMed]
Disclaimer/Publisher’s Note: The statements, opinions and data contained in all publications are solely those of the individual author(s) and contributor(s) and not of MDPI and/or the editor(s). MDPI and/or the editor(s) disclaim responsibility for any injury to people or property resulting from any ideas, methods, instructions or products referred to in the content. |
© 2023 by the authors. Licensee MDPI, Basel, Switzerland. This article is an open access article distributed under the terms and conditions of the Creative Commons Attribution (CC BY) license (https://creativecommons.org/licenses/by/4.0/).