
Non-Invasive Continuous Optical Monitoring of Cerebral Blood Flow after Traumatic Brain Injury in Mice Using Fiber Camera-Based Speckle Contrast Optical Spectroscopy


Abstract
:1. Introduction
2. Materials and Methods
2.1. Study Design
2.2. Fiber-Based Speckle Contrast Optical Spectroscopy Setup and Analysis
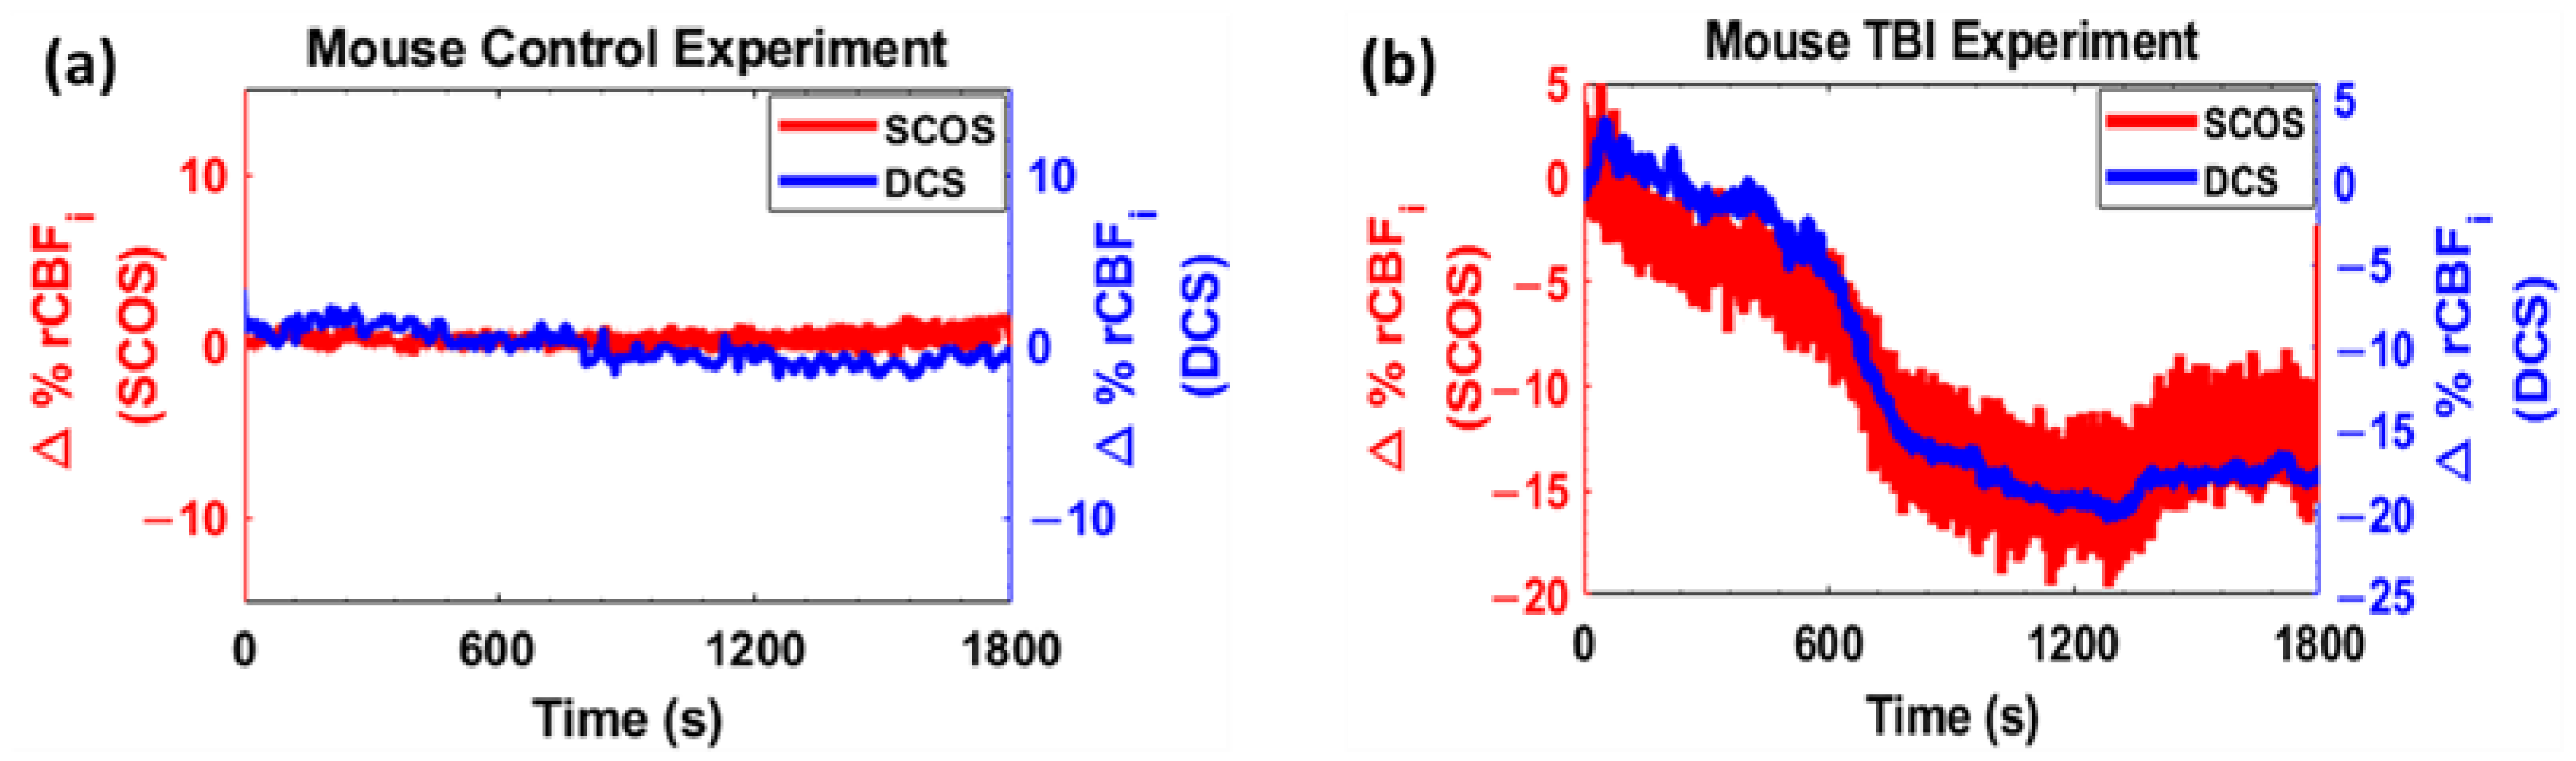
3. Results
4. Discussion
5. Conclusions
Author Contributions
Funding
Institutional Review Board Statement
Informed Consent Statement
Data Availability Statement
Conflicts of Interest
References
- Amyot, F.; Arciniegas, D.B.; Brazaitis, M.P.; Curley, K.C.; Diaz-Arrastia, R.; Gandjbakhche, A.; Herscovitch, P.; HindsII, S.R.; Manley, G.T. A Review of the Effectiveness of Neuroimaging Modalities for the Detection of Traumatic Brain Injury. J. Neurotrauma 2015, 32, 1693–1721. [Google Scholar] [CrossRef] [PubMed]
- Zaninotto, A.L.C.; Costa, B.T.; Ferreira, I.S.; French, M.; Paiva, W.S.; Fregni, F. Traumatic brain injury. In Clinical Trials in Neurology; Fregni, F., Ed.; Neuromethods; Humana Press: New York, NY, USA, 2018. [Google Scholar] [CrossRef]
- Leal-Noval, S.R.; Cayuela, A.; Arellano-Orden, V.; Marín-Caballos, A.; Padilla, V.; Ferrándiz-Millón, C.; Corcia, Y.; Gar-cía-Alfaro, C.; Amaya-Villar, R. Invasive and non-invasive assessment of cerebral oxygenation in patients with severe traumatic brain injury. Intensive Care Med. 2010, 36, 1309–1317. [Google Scholar] [CrossRef] [PubMed]
- Spiotta, A.M.; Stiefel, M.F.; Gracias, V.H.; Garuffe, A.M.; Kofke, W.A.; Maloney-Wilensky, E.; Troxel, A.B.; Levine, J.M.; Le Roux, P.D. Brain tissue oxygen-directed management and outcome in patients with severe traumatic brain injury: Clinical article. J. Neurosurg. 2010, 113, 571–580. [Google Scholar] [CrossRef]
- Oddo, M.; Levine, J.M.; Mackenzie, L.; Frangos, S.; Feihl, F.; Kasner, S.E.; Katsnelson, M.; Pukenas, B.; Macmurtrie, E.; Maloney-Wilensky, E.; et al. Brain hypoxia is associated with short-term outcome after severe traumatic brain injury independently of intracranial hypertension and low cerebral perfusion pressure. Neurosurgery 2011, 69, 1037–1045. [Google Scholar] [CrossRef]
- Davies, D.J.; Su, Z.; Clancy, M.T.; Lucas, S.J.E.; Dehghani, H.; Logan, A.; Belli, A. Near-Infrared Spectroscopy in the Monitoring of Adult Traumatic Brain Injury: A Review. J. Neurotrauma 2015, 32, 933–941. [Google Scholar] [CrossRef]
- Kenney, K.; Amyot, F.; Haber, M.; Pronger, A.; Bogoslovsky, T.; Moore, C.; Diaz-Arrastia, R. Cerebral Vascular Injury in Traumatic Brain Injury. Exp. Neurol. 2016, 275, 353–366. [Google Scholar] [CrossRef] [PubMed]
- Boas, D.A.; Franceschini, M.A. Haemoglobin oxygen saturation as a biomarker: The problem and a solution. Philos. Trans. R. Soc. A Math. Phys. Eng. Sci. 2011, 369, 4407–4424. [Google Scholar] [CrossRef]
- Durduran, T.; Yodh, A.G. Diffuse correlation spectroscopy for non-invasive, micro-vascular cerebral blood flow measurement. NeuroImage 2014, 85, 51–63. [Google Scholar] [CrossRef]
- Forti, R.M.; Katsurayama, M.; Menko, J.; Quiroga, A.; Falcão, A.L.E.; Li, L.M.; Mesquita, R.C. Real-Time Non-invasive Assessment of Cerebral Hemodynamics With Diffuse Optical Spectroscopies in a Neuro Intensive Care Unit: An Observational Case Study. Front. Med. 2020, 7, 147. [Google Scholar] [CrossRef]
- Topjian, A.A.; Fry, M.; Jawad, A.F.; Herman, S.T.; Nadkarni, V.M.; Ichord, R.; Berg, R.A.; Dlugos, D.J.; Abend, N.S. Detection of Electrographic Seizures by Critical Care Providers Using Color Density Spectral Array after Cardiac Arrest Is Feasible. Pediatr. Crit. Care Med. 2015, 16, 461–467. [Google Scholar] [CrossRef]
- Kampfl, A.; Pfausler, B.; Denchev, D.; Jaring, H.P.; Schmutzhard, E. Near Infrared Spectroscopy (NIRS) in Patients with Severe Brain Injury and Elevated Intracranial Pressure: A Pilot Study. In Brain Edema X; Acta Neurochirurgica, Supplements; Springer: Vienna, Austria, 1997; Volume 70. [Google Scholar] [CrossRef]
- Baker, W.B.; Balu, R.; He, L.; Kavuri, V.C.; Busch, D.R.; Amendolia, O.; Quattrone, F.; Frangos, S.; Maloney-Wilensky, E.; Abramson, K. Continuous non-invasive optical monitoring of cerebral blood flow and oxidative metabolism after acute brain injury. J. Cereb. Blood Flow Metab. 2019, 39, 1469–1485. [Google Scholar] [CrossRef] [PubMed]
- Kim, M.N.; Edlow, B.L.; Durduran, T.; Frangos, S.; Mesquita, R.C.; Levine, J.M.; Greenberg, J.H.; Yodh, A.G.; Detre, J.A. Continuous optical monitoring of cerebral hemodynamics during head-of-bed manipulation in brain-injured adults. Neurocritical Care 2014, 20, 443–453. [Google Scholar] [CrossRef]
- Esnault, P.; Boret, H.; Montcriol, A.; Carre, E.; Prunet, B.; Bordes, J.; Simon, P.; Joubert, C.; Dagain, A.; Kaiser, E.; et al. Assessment of cerebral oxygenation in neurocritical care patients: Comparison of a new four wavelengths forehead regional saturation in oxygen sensor (EQUANOX®) with brain tissue oxygenation. A prospective observational study. Minerva Anestesiol. 2015, 81, 876–884. [Google Scholar] [PubMed]
- Robertson, C.S. Use of near infrared spectroscopy to identify traumatic intracranial hemotomas. J. Biomed. Opt. 1997, 2, 31–42. [Google Scholar] [CrossRef] [PubMed]
- Postnov, D.D.; Tang, J.; Erdener, S.E.; Kılıç, K.; Boas, D.A. Dynamic Laser Speckle Imaging. bioRxiv 2019, preprint. [Google Scholar] [CrossRef]
- Dragojević, T.; Bronzi, D.; Varma, H.M.; Valdes, C.P.; Castellvi, C.; Villa, F.; Tosi, A.; Justicia, C.; Zappa, F.; Durduran, T. High-speed multi-exposure laser speckle contrast imaging with a single-photon counting camera. Biomed. Opt. Express 2015, 6, 2865–2876. [Google Scholar] [CrossRef]
- Seong, M.; Phillips, Z.; Mai, P.M.; Yeo, C.; Song, C.; Lee, K.; Kim, J.G. Simultaneous blood flow and blood oxygenation measurements using a combination of diffuse speckle contrast analysis and near-infrared spectroscopy. J. Biomed. Opt. 2016, 21, 27001. [Google Scholar] [CrossRef]
- Bi, R.; Dong, J.; Lee, K. Multi-channel deep tissue flowmetry based on temporal diffuse speckle contrast analysis. Opt. Express 2013, 21, 22854–22861. [Google Scholar] [CrossRef]
- Bi, R.; Dong, J.; Lee, K. Deep tissue flowmetry based on diffuse speckle contrast analysis. Opt. Lett. 2013, 38, 1401–1403. [Google Scholar] [CrossRef] [PubMed]
- Yeo, C.; Jung, H.; Lee, K.; Song, C. Low frequency oscillations assessed by diffuse speckle contrast analysis for foot angiosome concept. Sci. Rep. 2020, 10, 17153. [Google Scholar] [CrossRef]
- Lee, K. Diffuse speckle contrast analysis (DSCA) for deep tissue blood flow monitoring. Adv. Biomed. Eng. 2020, 9, 21–30. [Google Scholar] [CrossRef]
- Lin, C.-H.P.; Orukari, I.E.; Tracy, C.; Verma, M.; Frisk, L.K.; Chetia, S.; Trobaugh, J.W.; Durduran, T.; Culver, J.P. The feasibility of multi-mode fiber based speckle contrast optical spectroscopy. In Dynamics and Fluctuations in Biomedical Photonics XVIII; SPIE: Bellingham, WA, USA, 2021. [Google Scholar] [CrossRef]
- Pagliazzi, M.; Vidal-Rosas, E.E.; Sekar, S.K.V.; Di Sieno, L.; Colombo, L.; Contini, D.; Torricelli, A.; Pifferi, A.; Mora, A.D.; Culver, J.P.; et al. In vivo time domain speckle contrast optical spectroscopy. In European Conference on Biomedical Optics; Optica Publishing Group: Washington, DC, USA, 2019. [Google Scholar]
- Lin, C.-H.P.; Orukari, I.; Tracy, C.; Frisk, L.K.; Verma, M.; Chetia, S.; Durduran, T.; Trobaugh, J.W.; Culver, J.P. Multi-mode fiber-based speckle contrast optical spectroscopy: Analysis of speckle statistics. Opt. Lett. 2023, 48, 1427–1430. [Google Scholar] [CrossRef]
- Valdes, C.P.; Varma, H.M.; Kristoffersen, A.K.; Dragojevic, T.; Culver, J.P.; Durduran, T. Speckle contrast optical spectroscopy, a non-invasive, diffuse optical method for measuring microvascular blood flow in tissue. Biomed. Opt. Express 2014, 5, 2769–2784. [Google Scholar] [CrossRef] [PubMed]
- Zilpelwar, S.; Sie, E.J.; Postnov, D.; Chen, A.I.; Zimmermann, B.; Marsili, F.; Boas, D.A.; Cheng, X. Model of dynamic speckle evolution for evaluating laser speckle contrast measurements of tissue dynamics. Biomed. Opt. Express 2022, 13, 6533–6549. [Google Scholar] [CrossRef] [PubMed]
- Dragojević, T.; Hollmann, J.L.; Tamborini, D.; Portaluppi, D.; Buttafava, M.; Culver, J.P.; Villa, F.; Durduran, T. Compact, multi-exposure speckle contrast optical spectroscopy (SCOS) device for measuring deep tissue blood flow. Biomed. Opt. Express 2017, 9, 322–334. [Google Scholar] [CrossRef]
- Poon, C.S.; Langri, D.S.; Rinehart, B.; Rambo, T.M.; Miller, A.J.; Foreman, B.; Sunar, U. First-in-clinical application of a time-gated diffuse correlation spectroscopy system at 1064 nm using superconducting nanowire single photon detectors in a neuro intensive care unit. Biomed. Opt. Express 2022, 13, 1344–1356. [Google Scholar] [CrossRef] [PubMed]
- Poon, C.-S.; Langri, D.S.; Rinehart, B.; Rambo, T.M.; Miller, A.J.; Foreman, B.; Sunar, U. Continuous cerebral hemodynamic measurement during deep hypothermic circulatory arrest. Biomed. Opt. Express 2016, 7, 3461–3470. [Google Scholar] [CrossRef]
- Rinehart, B.; Poon, C.-S.; Sunar, U. Quantification of perfusion and metabolism in an autism mouse model assessed by diffuse correlation spectroscopy and near-infrared spectroscopy. J. Biophotonics 2021, 14, e202000454. [Google Scholar] [CrossRef]
- Poon, C.; Rinehart, B.; Li, J.; Sunar, U. Cerebral Blood Flow-Based Resting State Functional Connectivity of the Human Brain using Optical Diffuse Correlation Spectroscopy. J. Vis. Exp. 2020, e60765. [Google Scholar] [CrossRef]
- Poon, C.S.; Li, J.; Kress, J.; Rohrbach, D.J.; Sunar, U. Resting-State Functional Connectivity measured by Diffuse Correlation Spectroscopy. In Proceedings of the Biophotonics Congress: Biomedical Optics Congress 2018 (Microscopy/Translational/Brain/OTS), Hollywood, FL, USA, 3–6 April 2018. Optics InfoBase Conference Papers Part F91-T. [Google Scholar] [CrossRef]
- Li, J.; Poon, C.-S.; Kress, J.; Rohrbach, D.J.; Sunar, U. Resting-state functional connectivity measured by diffuse correlation spectroscopy. J. Biophotonics 2018, 11, e201700165. [Google Scholar] [CrossRef]
- Li, J.; Qiu, L.; Xu, L.; Pedapati, E.V.; Erickson, C.A.; Sunar, U. Characterization of autism spectrum disorder with spontaneous hemodynamic activity. Biomed. Opt. Express 2016, 7, 3871–3881. [Google Scholar] [CrossRef] [PubMed]
- Lu, C.M.; Zhang, Y.J.; Biswal, B.B.; Zang, Y.F.; Peng, D.L.; Zhu, C.Z. Use of fNIRS to assess resting state functional connectivity. J. Neurosci. Methods 2010, 186, 242–249. [Google Scholar] [CrossRef]
- Zhang, Y.-J.; Lu, C.-M.; Biswal, B.B.; Zang, Y.-F.; Peng, D.-L.; Zhu, C.-Z. Detecting Resting-State Functional Connectivity in the Language System using Functional Near-Infrared Spectroscopy. J. Biomed. Opt. 2010, 15, 47003. [Google Scholar] [CrossRef] [PubMed]
- Duan, L.; Zhang, Y.J.; Zhu, C.Z. Quantitative comparison of resting-state functional connectivity derived from fNIRS and fMRI: A simultaneous recording study. NeuroImage 2012, 60, 2008–2018. [Google Scholar] [CrossRef] [PubMed]
- Li, J.; Qiu, L. Temporal correlation of spontaneous hemodynamic activity in language areas measured with functional near-infrared spectroscopy. Biomed. Opt. Express 2014, 5, 587–595. [Google Scholar] [CrossRef]
- Chernomordik, V.; Amyot, F.; Kenney, K.; Wassermann, E.; Diaz-Arrastia, R.; Gandjbakhche, A. Abnormality of low frequency cerebral hemodynamics oscillations in TBI population. Brain Res. 2016, 1639, 194–199. [Google Scholar] [CrossRef] [PubMed]
- Tong, Y.; Hocke, L.M.; Licata, S.C.; deB Frederick, B. Low-frequency oscillations measured in the periphery with near-infrared spectroscopy are strongly correlated with blood oxygen level-dependent functional magnetic resonance imaging signals. J. Biomed. Opt. 2012, 17, 1060041–10600410. [Google Scholar] [CrossRef]
- Yaramothu, C.; Li, X.; Morales, C.; Alvarez, T.L. Reliability of Frontal Eye Fields Activation and Very Low-Frequency Oscillations Observed during Vergence Eye Movements: An fNIRS Study. Sci. Rep. 2020, 10, 712. [Google Scholar] [CrossRef] [PubMed]
- Bicciato, G.; Keller, E.; Wolf, M.; Brandi, G.; Schulthess, S.; Friedl, S.G.; Willms, J.F.; Narula, G. Increase in Low-Frequency Oscillations in fNIRS as Cerebral Response to Auditory Stimulation with Familiar Music. Brain Sci. 2021, 12, 42. [Google Scholar] [CrossRef]
- Wang, M.-Y.; Yuan, A.; Zhang, J.; Xiang, Y.; Yuan, Z. Functional near-infrared spectroscopy can detect low-frequency hemodynamic oscillations in the prefrontal cortex during steady-state visual evoked potential-inducing periodic facial expression stimuli presentation. Vis. Comput. Ind. Biomed. Art 2020, 3, 28. [Google Scholar] [CrossRef]
- Andersen, A.V.; Simonsen, S.A.; Schytz, H.W.; Iversen, H.K. Assessing low-frequency oscillations in cerebrovascular diseases and related conditions with near-infrared spectroscopy: A plausible method for evaluating cerebral autoregulation? Neurophotonics 2018, 5, 030901. [Google Scholar] [CrossRef] [PubMed]
- Tong, Y.; Hocke, L.M.; deB Frederick, B.; Frederick, B.B. Low Frequency Systemic Hemodynamic “Noise” in Resting State BOLD fMRI: Characteristics, Causes, Implications, Mitigation Strategies, and Applications. Front. Neurosci. 2019, 13, 787. [Google Scholar] [CrossRef] [PubMed]
- Li, Y.; Zhang, H.; Yu, M.; Yu, W.; Frederick, B.D.; Tong, Y. Systemic low-frequency oscillations observed in the periphery of healthy human subjects. J. Biomed. Opt. 2018, 23, 057001. [Google Scholar] [CrossRef] [PubMed]
- Goltsov, A.; Anisimova, A.V.; Zakharkina, M.; Krupatkin, A.I.; Sidorov, V.V.; Rafailov, E. Bifurcation in Blood Oscillatory Rhythms for Patients with Ischemic Stroke: A Small Scale Clinical Trial using Laser Doppler Flowmetry and Computational Modeling of Vasomotion. Front. Physiol. 2017, 8, 160. [Google Scholar] [CrossRef]
- Tong, Y.; Hocke, L.M.; Fan, X.; Janes, A.C.; deB Frederick, B. Can apparent resting state connectivity arise from systemic fluctuations? Front. Hum. Neurosci. 2015, 9, 285. [Google Scholar] [CrossRef]
- Lu, F.-M.; Wang, Y.-F.; Zhang, J.; Chen, H.-F. Optical mapping of the dominant frequency of brain signal oscillations in motor systems. Sci. Rep. 2017, 7, 14703. [Google Scholar] [CrossRef]
- Rojas, R.F.; Huang, X.; Hernandez-Juarez, J.; Ou, K.L. Physiological fluctuations show frequency-specific networks in fNIRS signals during resting state. In Proceedings of the 39th Annual International Conference of the IEEE Engineering in Medicine and Biology Society, Jeju, Republic of Korea, 11–15 July 2017. [Google Scholar] [CrossRef]
- Narula, G.B.; Brandi, G.; Eisele, A.; Schulthess, S.; Friedl, S.; Willms, J.F.; Westphal, L.; Keller, E. Functional NIRS to detect covert consciousness in neurocritical patients. Clin. Neurophysiol. 2022, 144, 72–82. [Google Scholar] [CrossRef]
- Vermeij, A.; den Abeelen, A.S.S.M.; Kessels, R.P.C.; van Beek, A.H.E.A.; Claassen, J.A.H.R. Very-low-frequency oscillations of cerebral hemodynamics and blood pressure are affected by aging and cognitive load. NeuroImage 2014, 85, 608–615. [Google Scholar] [CrossRef]
- Zhao, C.; Guo, J.; Li, D.; Tao, Y.; Ding, Y.; Liu, H.; Song, Y. Anticipatory alpha oscillation predicts attentional selection and hemodynamic response. Hum. Brain Mapp. 2019, 40, 3606–3619. [Google Scholar] [CrossRef]
- Tong, Y.; Frederick, B.d.B. Concurrent fNIRS and fMRI processing allows independent visualization of the propagation of pressure waves and bulk blood flow in the cerebral vasculature. NeuroImage 2012, 61, 1419–1427. [Google Scholar] [CrossRef]
- Zhang, F.; Cheong, D.; Chen, Y.; Khan, A.; Ding, L.; Yuan, H. Superficial Fluctuations in Functional Near-Infrared Spectroscopy. In Proceedings of the 41st Annual International Conference of the IEEE Engineering in Medicine and Biology Society, Berlin, Germany, 23–27 July 2019. [Google Scholar] [CrossRef]
- Reinhard, M.; Wehrle-Wieland, E.; Grabiak, D.; Roth, M.; Guschlbauer, B.; Timmer, J.; Weiller, C.; Hetzel, A. Oscillatory cerebral hemodynamics-the macro- vs. microvascular level. J. Neurol. Sci. 2006, 250, 103–109. [Google Scholar] [CrossRef] [PubMed]
- Obrig, H.; Neufang, M.; Wenzel, R.; Kohl, M.; Steinbrink, J.; Einhäupl, K.; Villringer, A. Spontaneous low frequency oscillations of cerebral hemodynamics and metabolism in human adults. NeuroImage 2000, 12, 623–639. [Google Scholar] [CrossRef]
- Whittaker, J.R.; Driver, I.D.; Venzi, M.; Bright, M.G.; Murphy, K. Corrigendum: Cerebral Autoregulation Evidenced by Synchronized Low Frequency Oscillations in Blood Pressure and Resting-State fMRI. Front. Neurosci. 2020, 14, 544. [Google Scholar] [CrossRef] [PubMed]
- Phillip, D.; Schytz, H.W.; Selb, J.; Payne, S.; Iversen, H.K.; Skovgaard, L.T.; Boas, D.A.; Ashina, M. Low frequency oscillations in cephalic vessels assessed by near infrared spectroscopy. Eur. J. Clin. Investig. 2012, 42, 1180–1188. [Google Scholar] [CrossRef] [PubMed]
- Cheng, R.; Shang, Y.; Hayes, D.; Saha, S.P.; Yu, G. Non-invasive optical evaluation of spontaneous low frequency oscillations in cerebral hemodynamics. NeuroImage 2012, 62, 1445–1454. [Google Scholar] [CrossRef] [PubMed]
- Cheng, H.; Yu, J.; Xu, L.; Li, J. Power spectrum of spontaneous cerebral homodynamic oscillation shows a distinct pattern in autism spectrum disorder. Biomed. Opt. Express 2019, 10, 1383–1392. [Google Scholar] [CrossRef]
- Abookasis, D.; Volkov, B.; Shochat, A.; Kofman, I. Non-invasive assessment of hemodynamic and brain metabolism parameters following closed head injury in a mouse model by comparative diffuse optical reflectance approaches. Neurophotonics 2016, 3, 25003. [Google Scholar] [CrossRef] [PubMed]
- Witkowski, E. Rapid Disruption of Cortical Activity and Loss of Cerebral Blood Flow in a Mouse Model of Mild Traumatic Brain Injury. Ph.D. Dissertation, Boston University, Boston, MA, USA, 2019. [Google Scholar]
- Buckley, E.M.; Miller, B.F.; Golinski, J.M.; Sadeghian, H.; McAllister, L.M.; Vangel, M.; Ayata, C.; Meehan, W.P., III; Fran-ceschini, M.A.; Whalen, M.J. Decreased microvascular cerebral blood flow assessed by diffuse correlation spectroscopy after repetitive concussions in mice. J. Cereb. Blood Flow Metab. 2015, 35, 1995–2000. [Google Scholar] [CrossRef]
- Jang, H.; Huang, S.; Hammer, D.X.; Wang, L.; Rafi, H.; Ye, M.; Welle, C.G.; Fisher, J.A.N. Alterations in neurovascular coupling following acute traumatic brain injury. Neurophotonics 2017, 4, 045007. [Google Scholar] [CrossRef]
- Huang, C.; Mazdeyasna, S.; Mohtasebi, M.; Saatman, K.E.; Cheng, Q.; Yu, G.; Chen, L. Speckle contrast diffuse correlation tomography of cerebral blood flow in perinatal disease model of neonatal piglets. J. Biophotonics 2020, 14, e202000366. [Google Scholar] [CrossRef]


Disclaimer/Publisher’s Note: The statements, opinions and data contained in all publications are solely those of the individual author(s) and contributor(s) and not of MDPI and/or the editor(s). MDPI and/or the editor(s) disclaim responsibility for any injury to people or property resulting from any ideas, methods, instructions or products referred to in the content. |
© 2023 by the authors. Licensee MDPI, Basel, Switzerland. This article is an open access article distributed under the terms and conditions of the Creative Commons Attribution (CC BY) license (https://creativecommons.org/licenses/by/4.0/).
Share and Cite
Langri, D.S.; Sunar, U. Non-Invasive Continuous Optical Monitoring of Cerebral Blood Flow after Traumatic Brain Injury in Mice Using Fiber Camera-Based Speckle Contrast Optical Spectroscopy. Brain Sci. 2023, 13, 1365. https://doi.org/10.3390/brainsci13101365
Langri DS, Sunar U. Non-Invasive Continuous Optical Monitoring of Cerebral Blood Flow after Traumatic Brain Injury in Mice Using Fiber Camera-Based Speckle Contrast Optical Spectroscopy. Brain Sciences. 2023; 13(10):1365. https://doi.org/10.3390/brainsci13101365
Chicago/Turabian StyleLangri, Dharminder S., and Ulas Sunar. 2023. "Non-Invasive Continuous Optical Monitoring of Cerebral Blood Flow after Traumatic Brain Injury in Mice Using Fiber Camera-Based Speckle Contrast Optical Spectroscopy" Brain Sciences 13, no. 10: 1365. https://doi.org/10.3390/brainsci13101365
APA StyleLangri, D. S., & Sunar, U. (2023). Non-Invasive Continuous Optical Monitoring of Cerebral Blood Flow after Traumatic Brain Injury in Mice Using Fiber Camera-Based Speckle Contrast Optical Spectroscopy. Brain Sciences, 13(10), 1365. https://doi.org/10.3390/brainsci13101365