

COVID-19 Long-Term Effects: Is There an Impact on the Simple Reaction Time and Alternative-Forced Choice on Recovered Patients?
 ,
,  ,
,  ,
,  and
and
Abstract
1. Introduction
2. Materials and Methods
2.1. Study Design and Setting
2.2. Participants
2.3. Study Variables
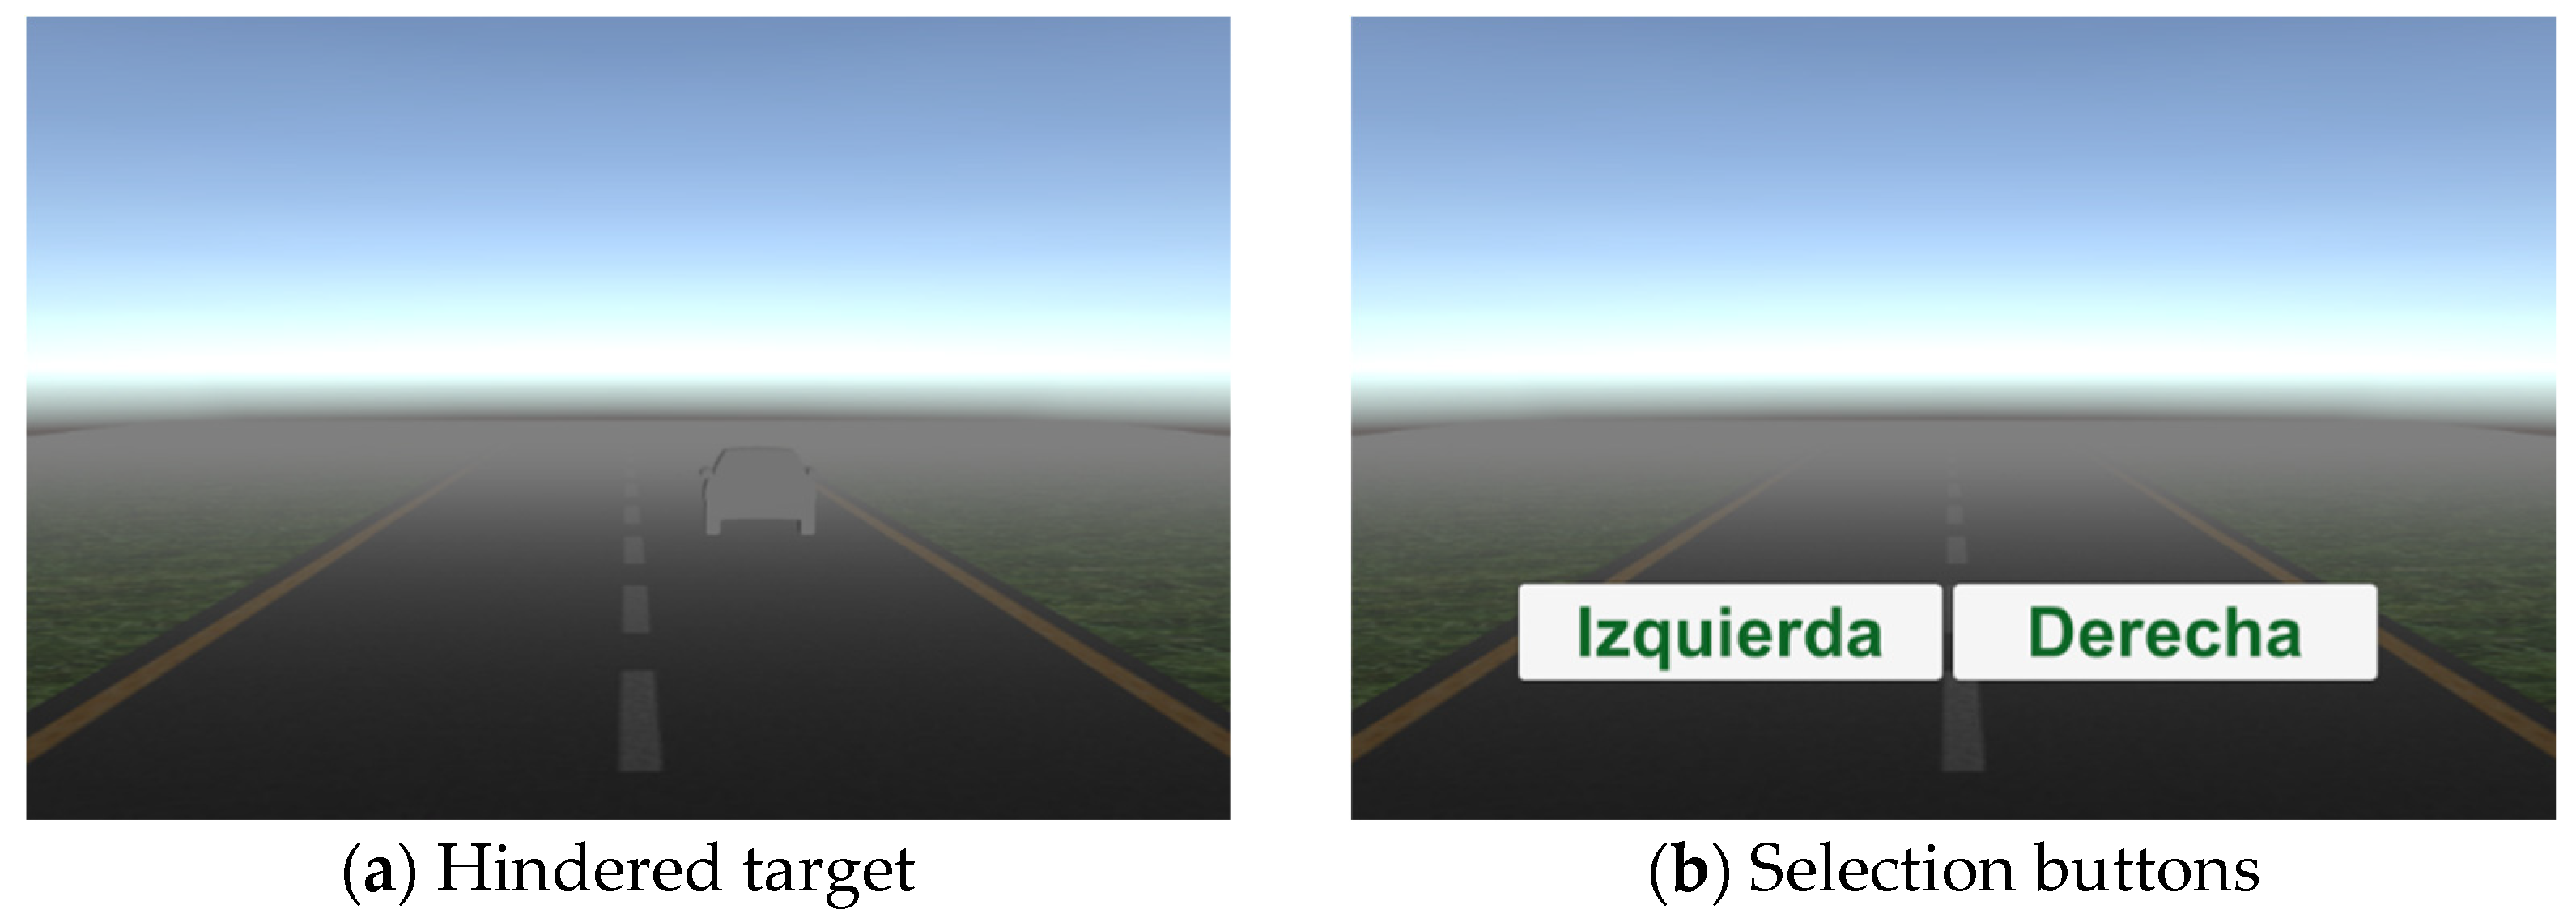
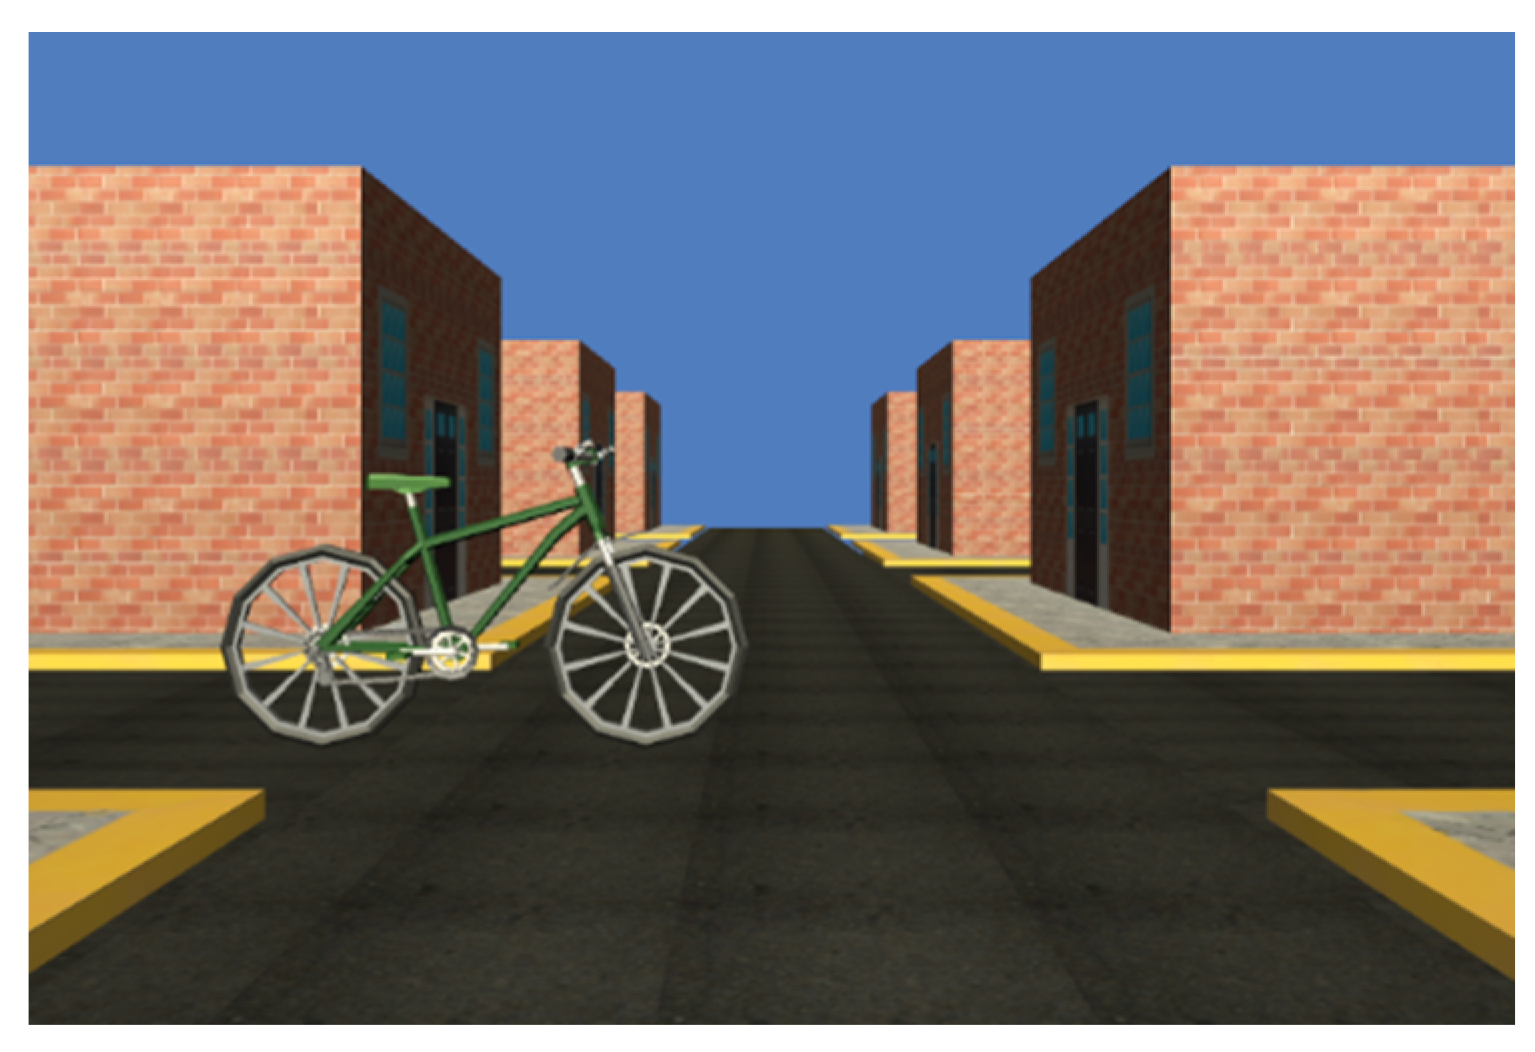
2.4. Simple Reaction and Forced Choice Experiments
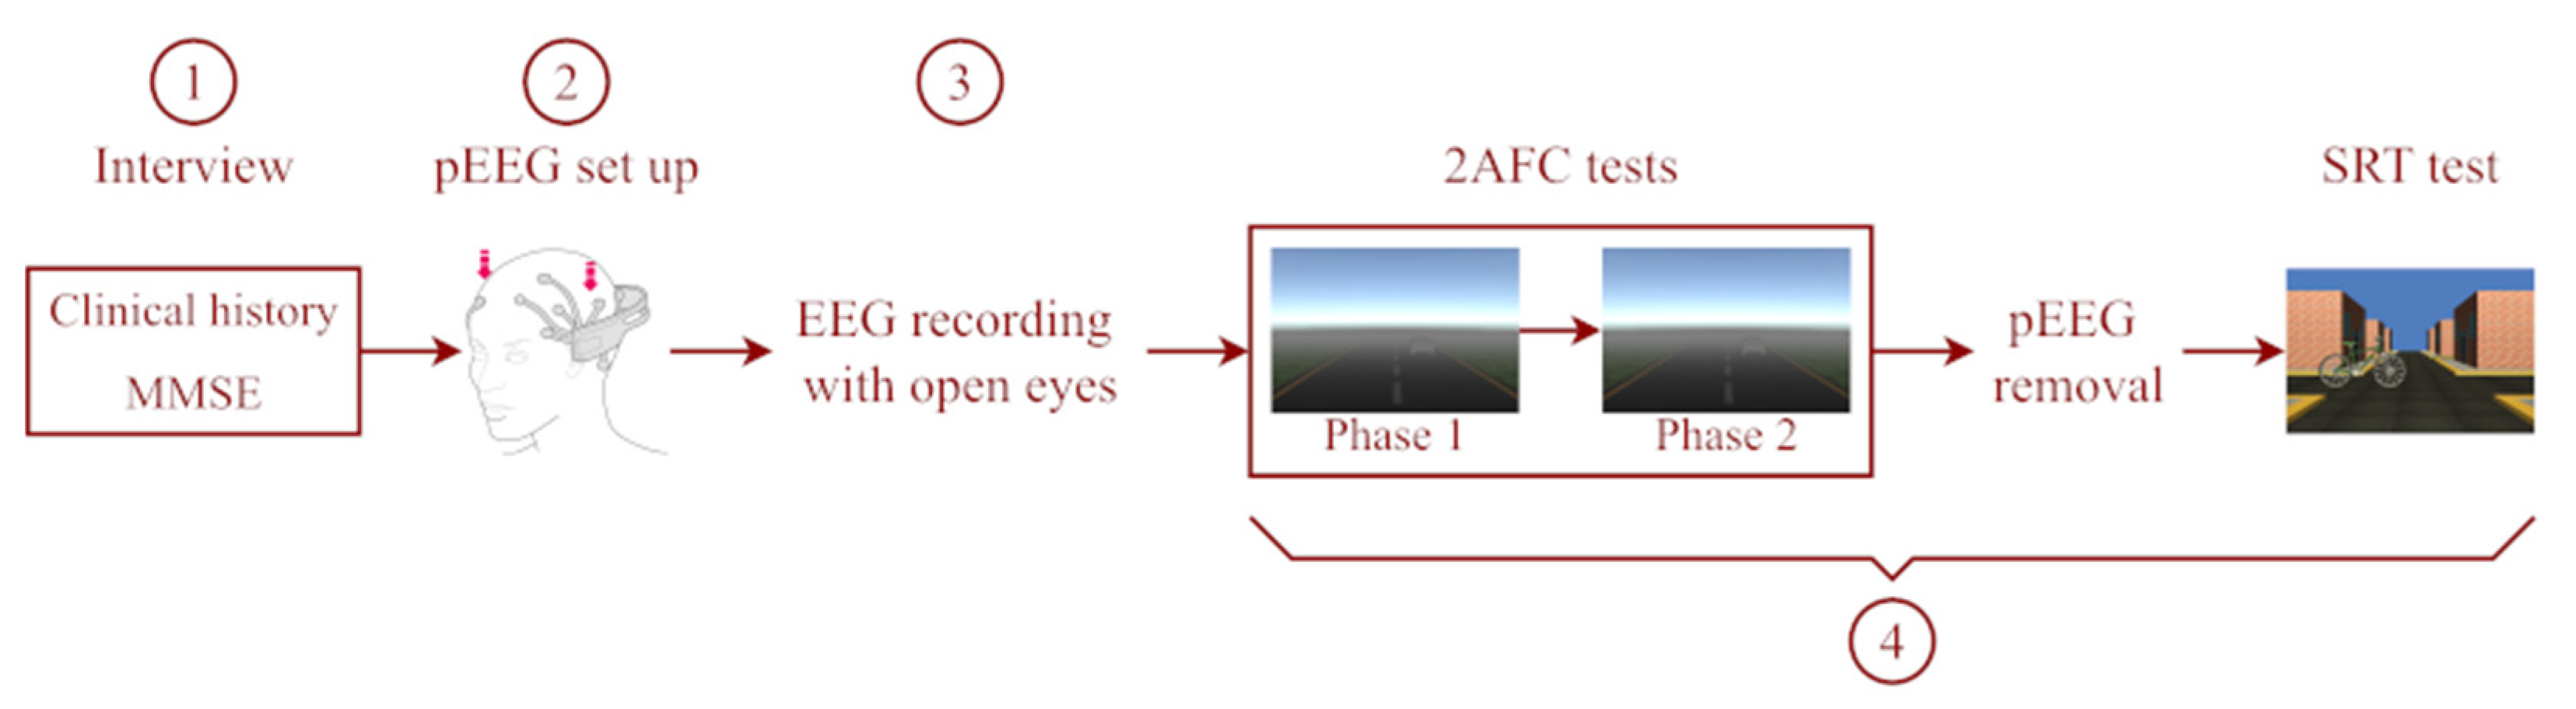
2.5. Procedure
2.6. Data Analysis
2.6.1. Quantitative Variables
2.6.2. Statistical Methods
3. Results
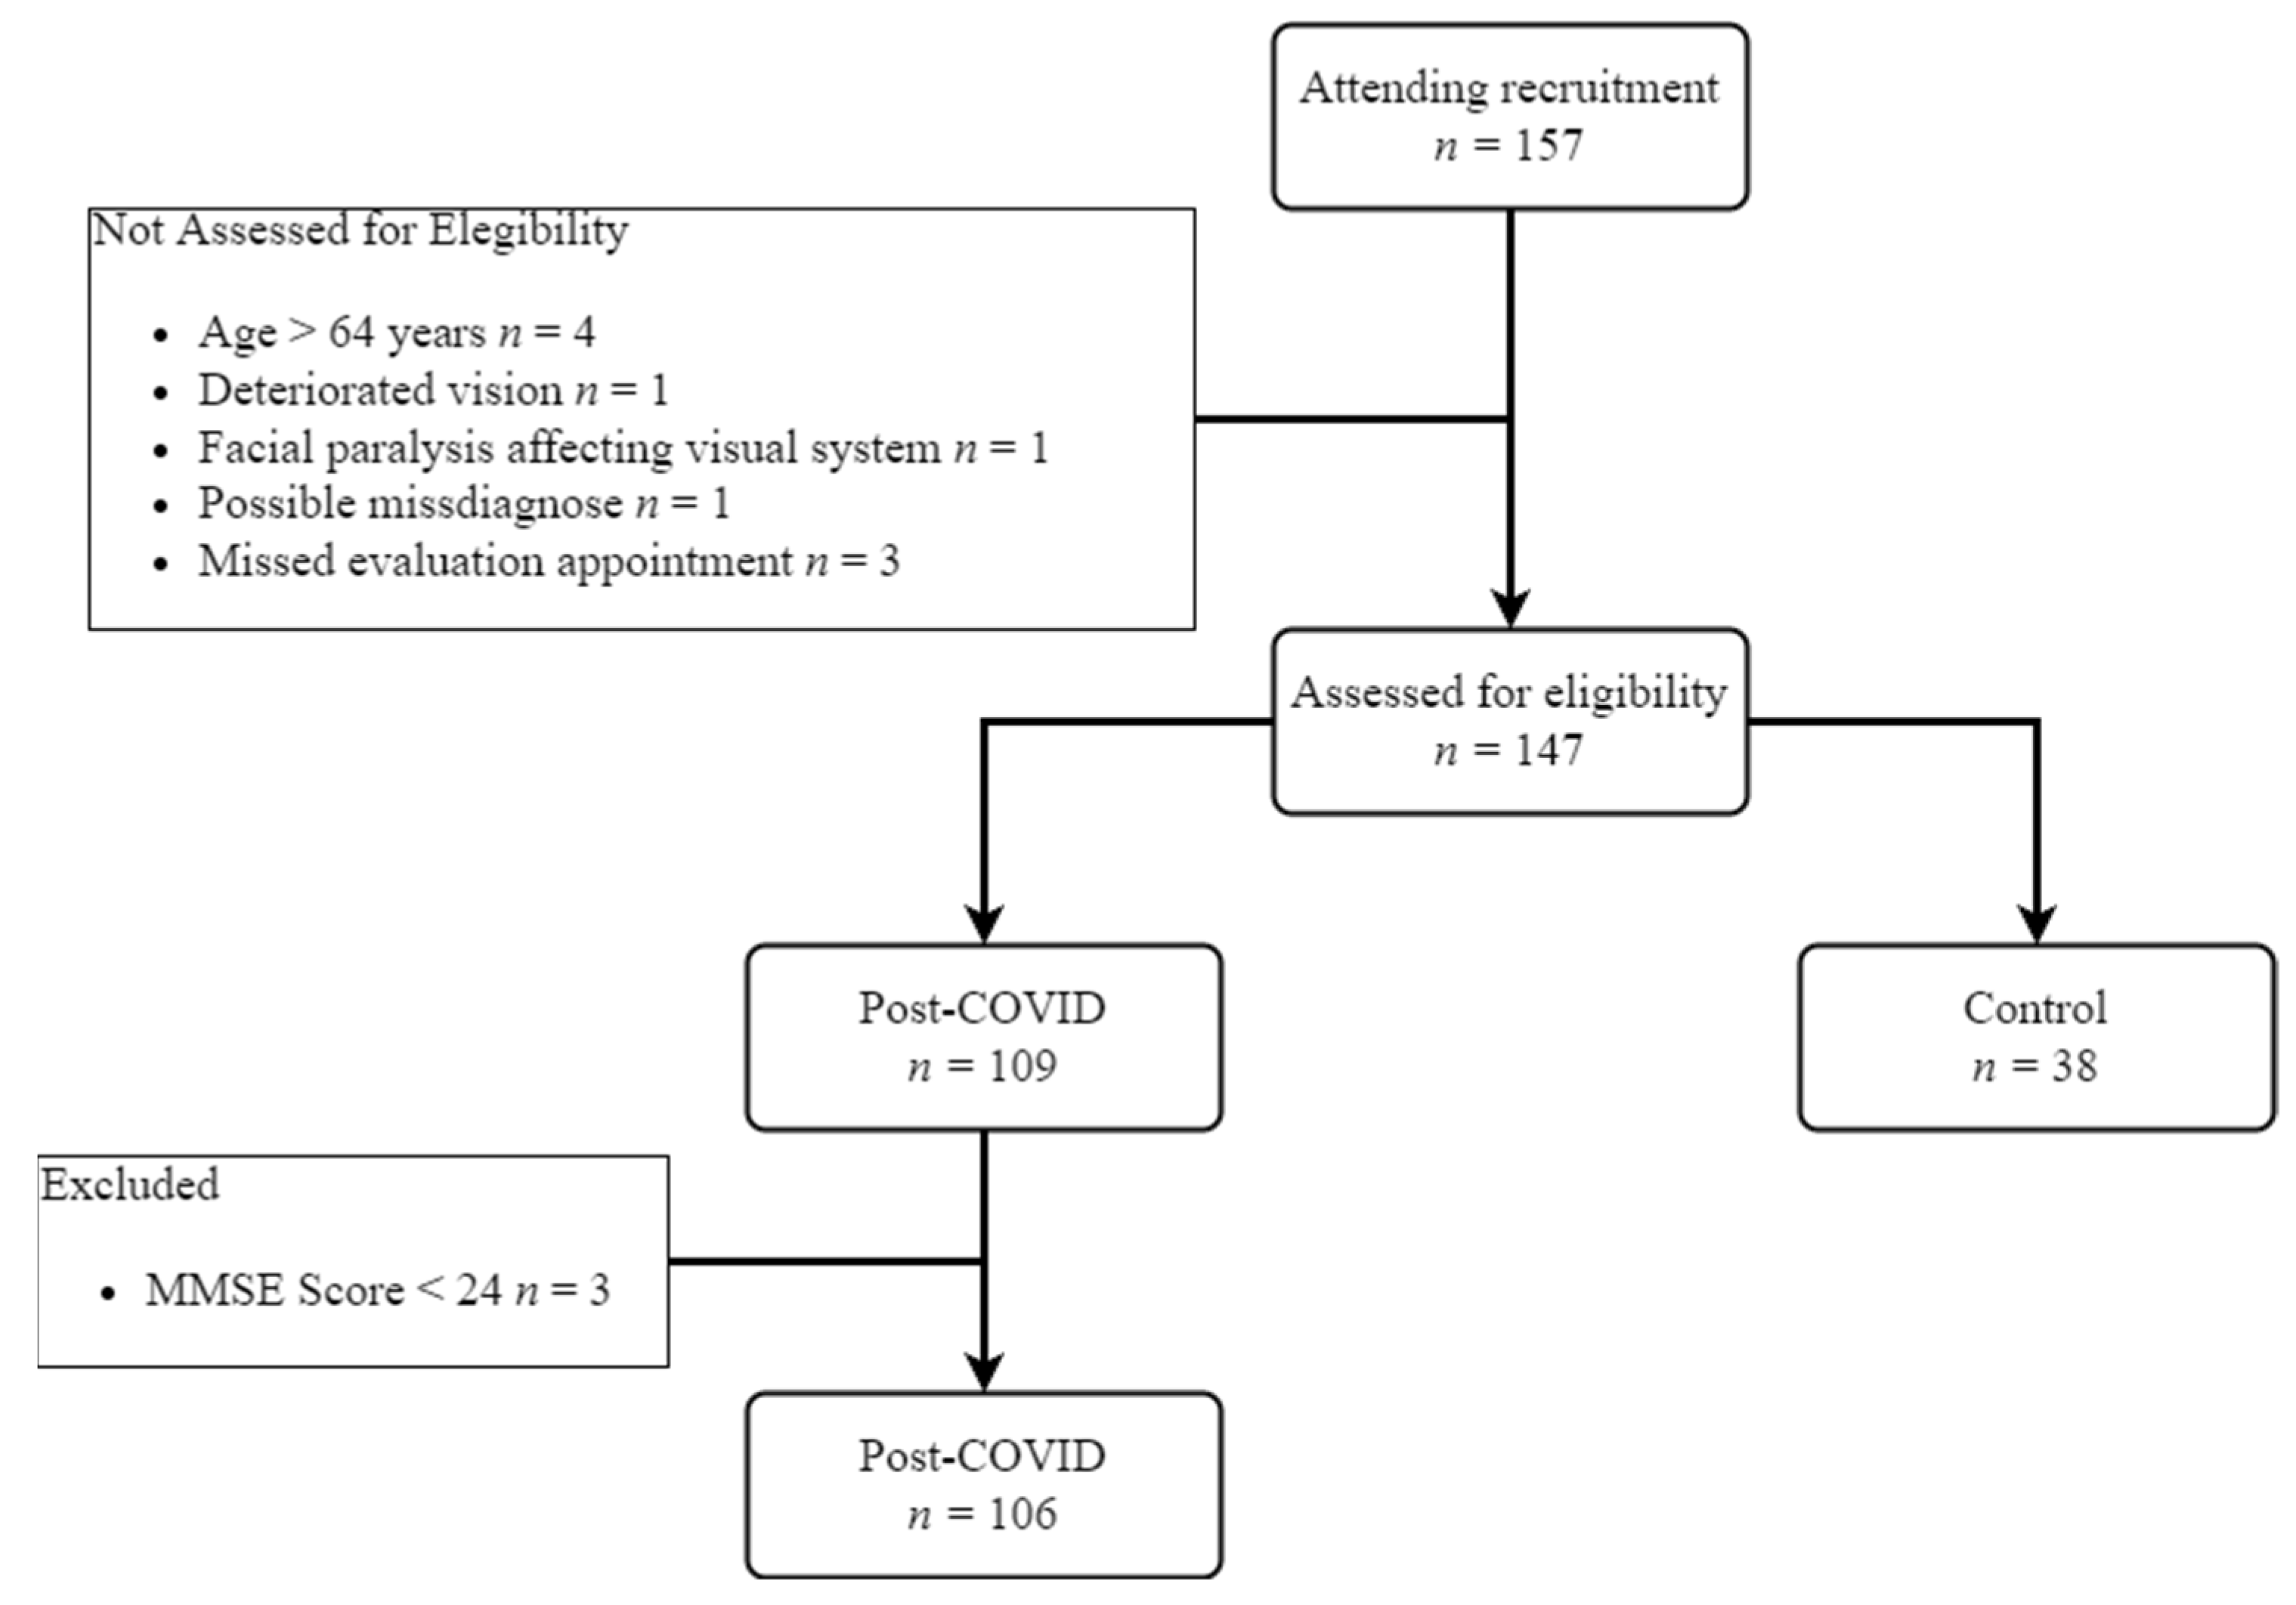
3.1. Study Participation
3.2. Outcome Data
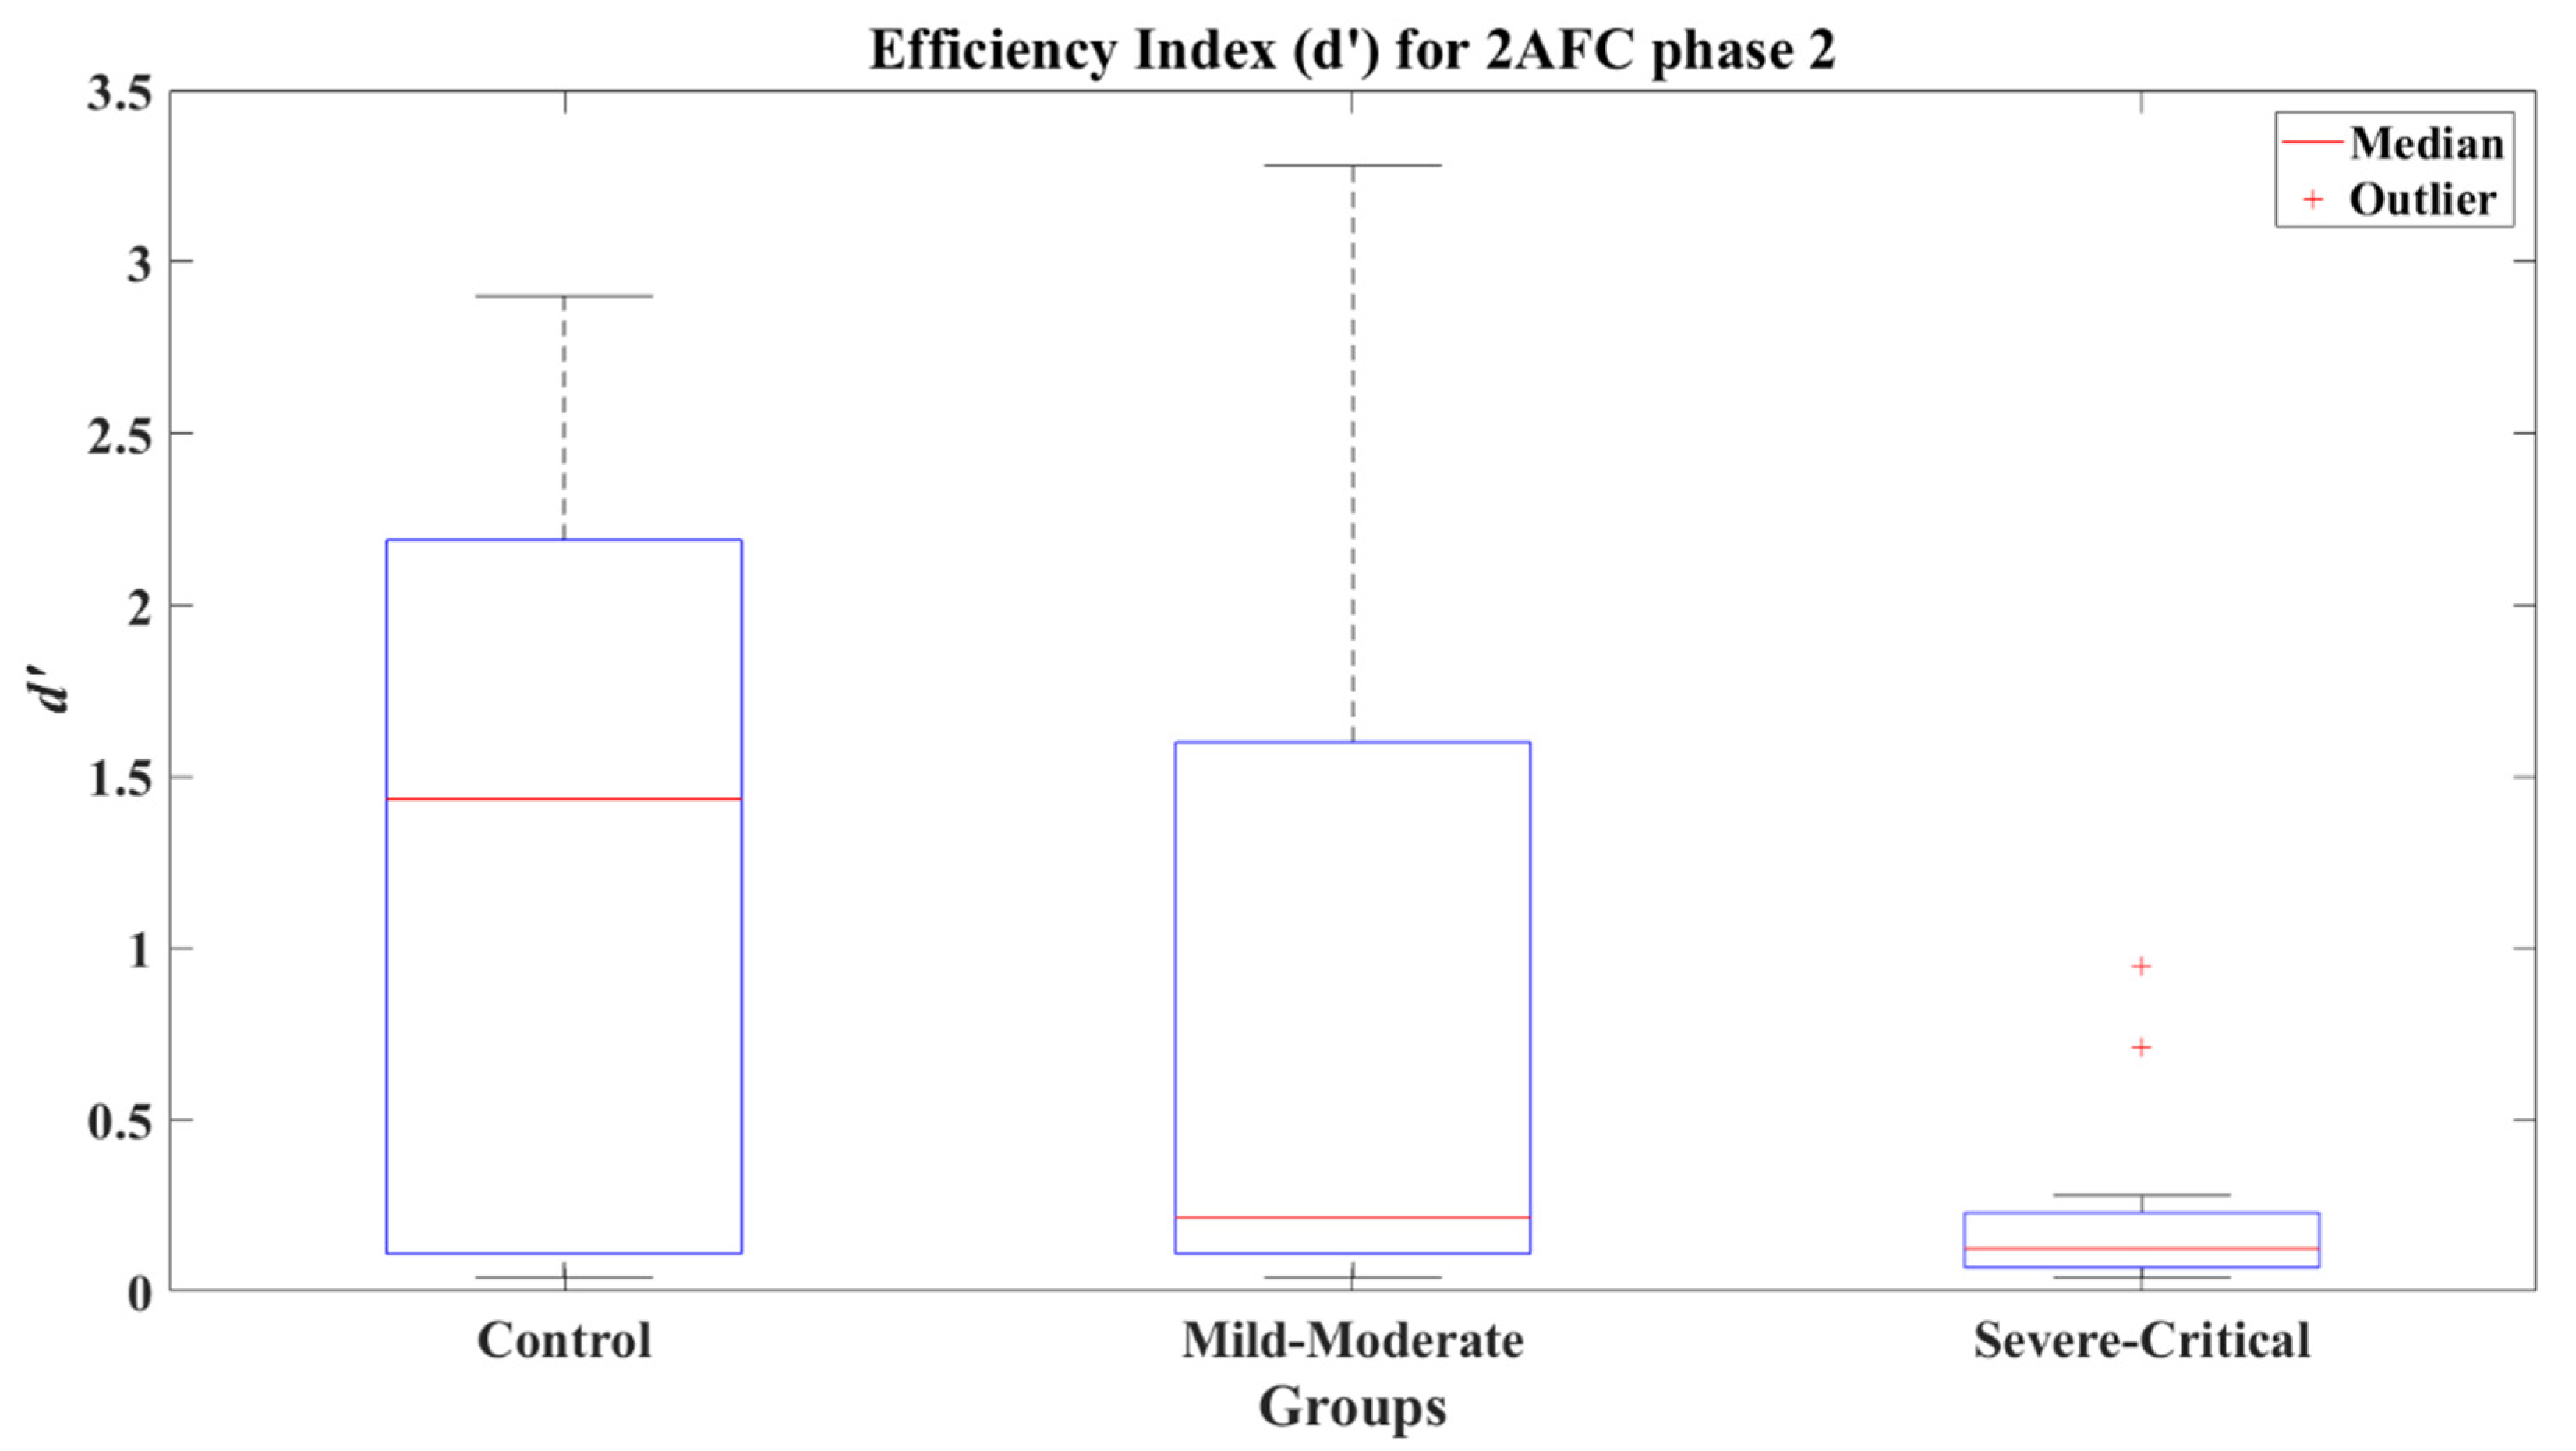
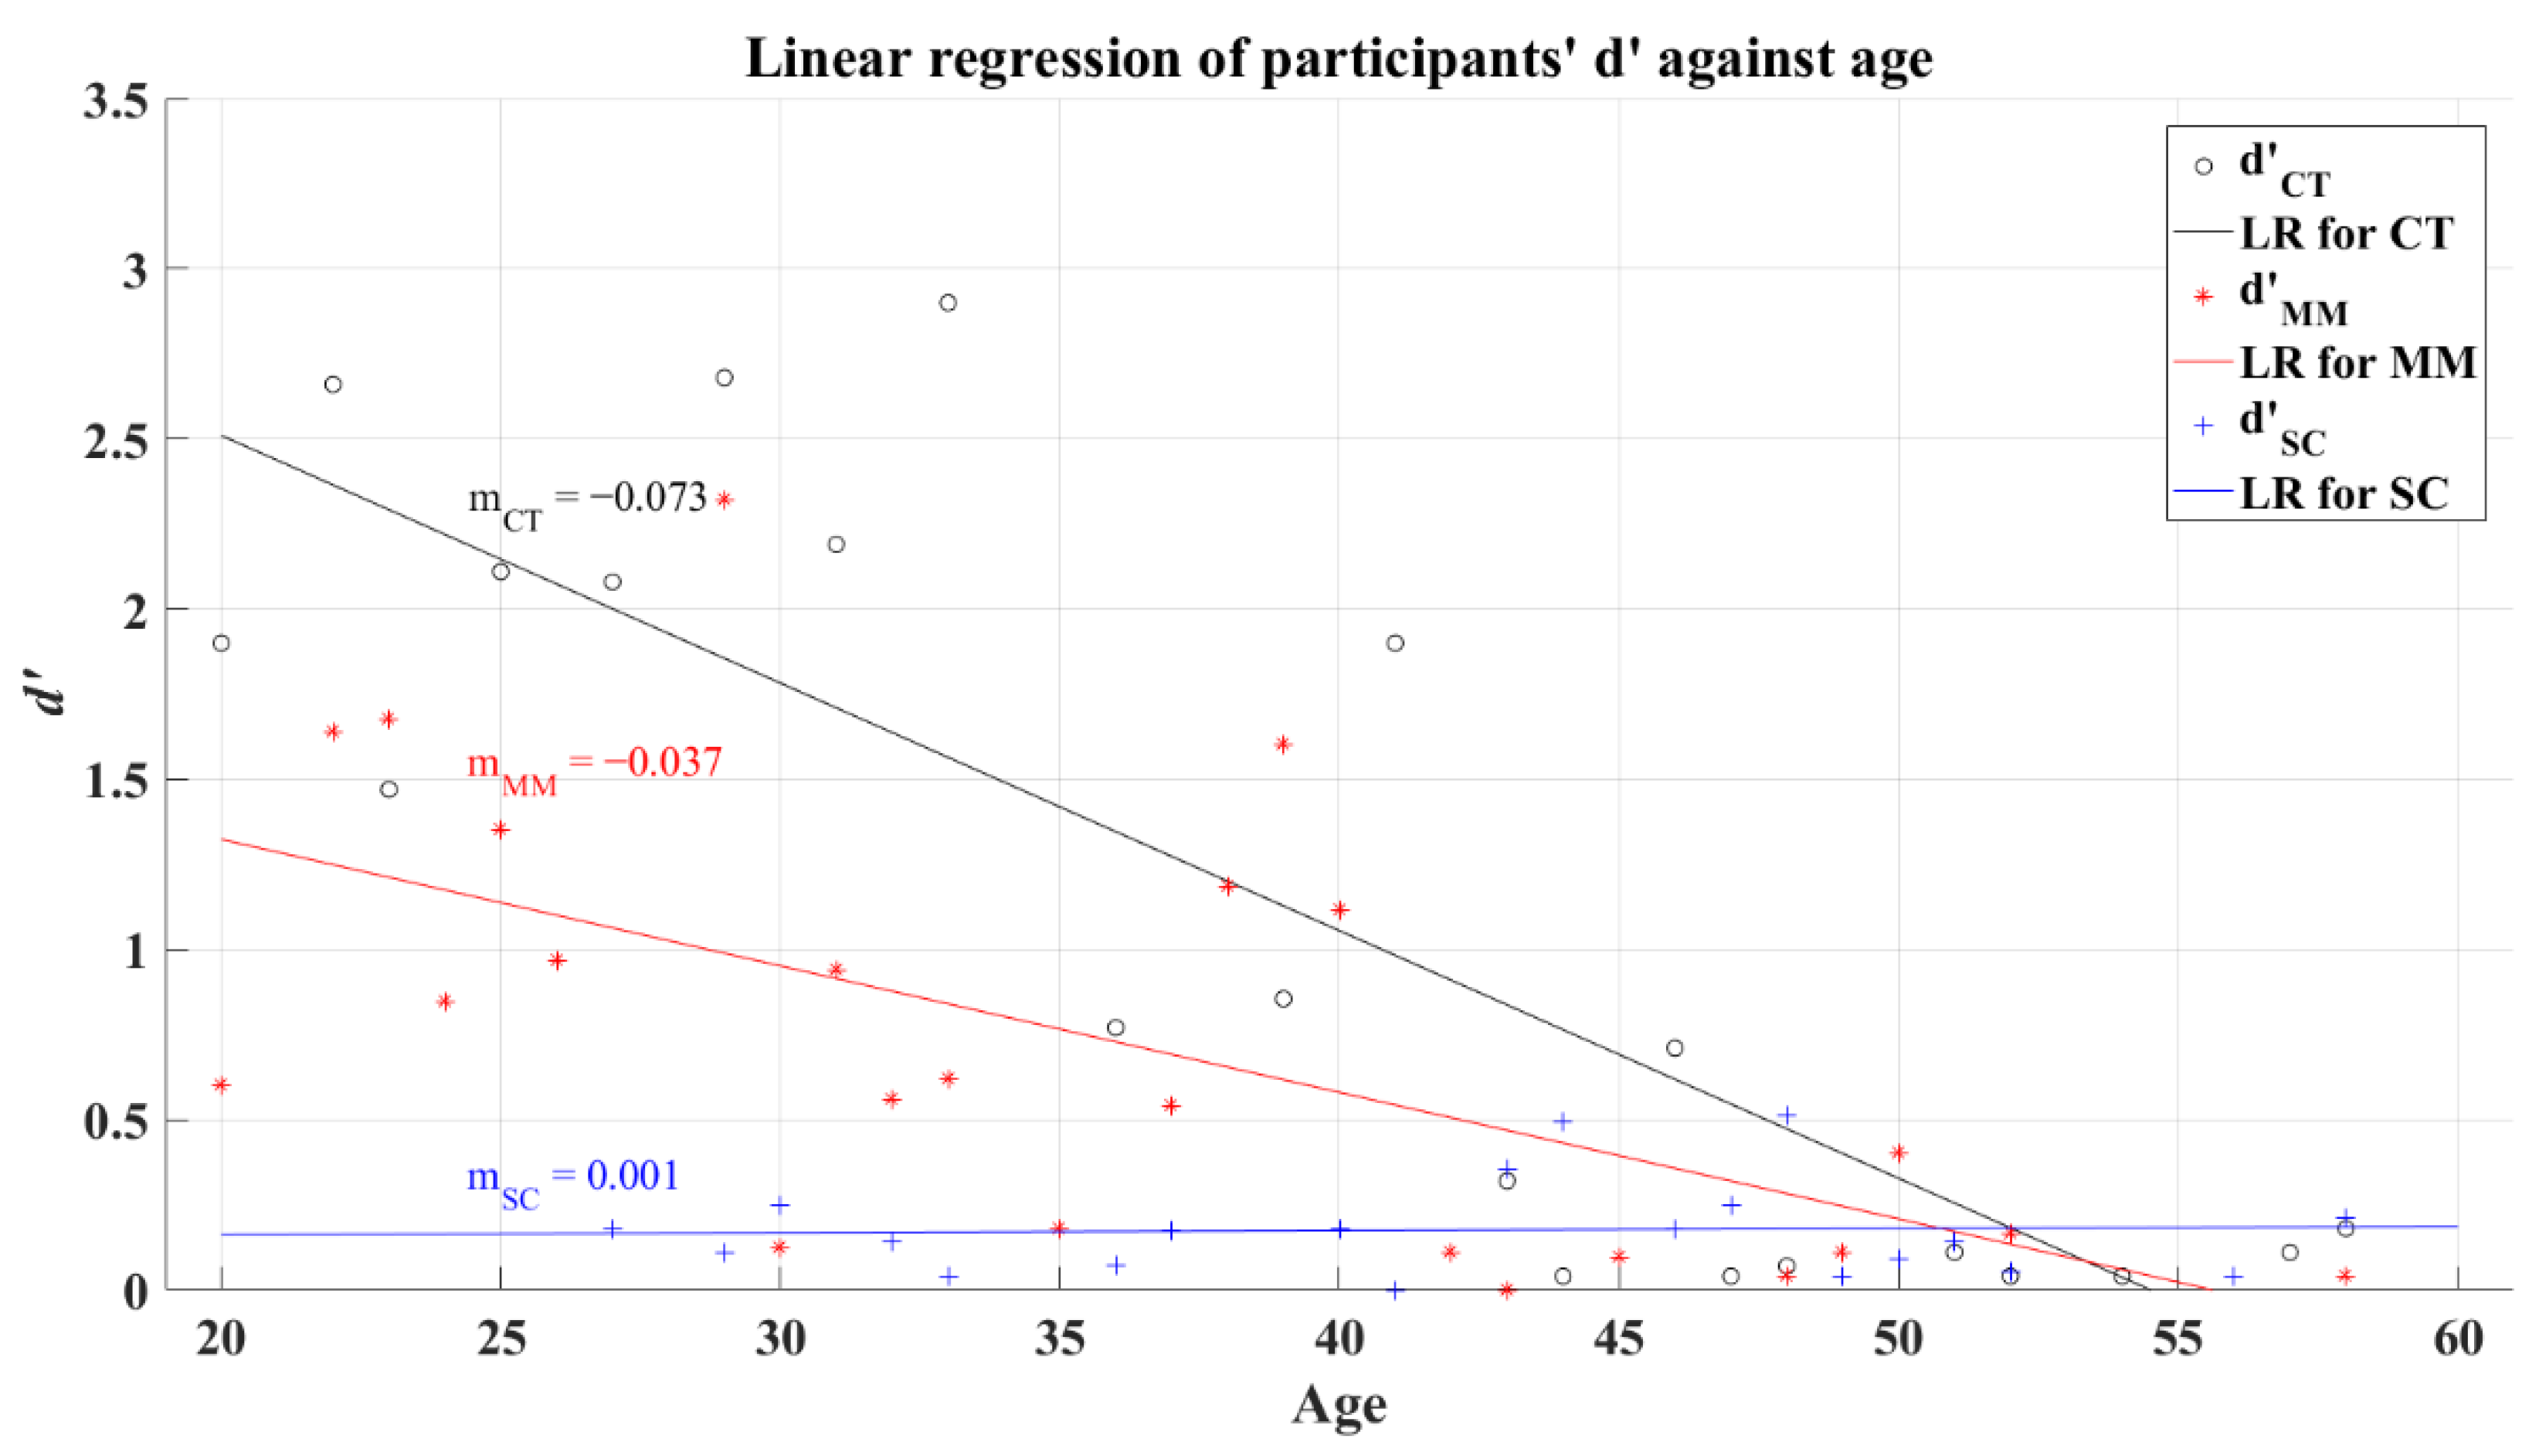
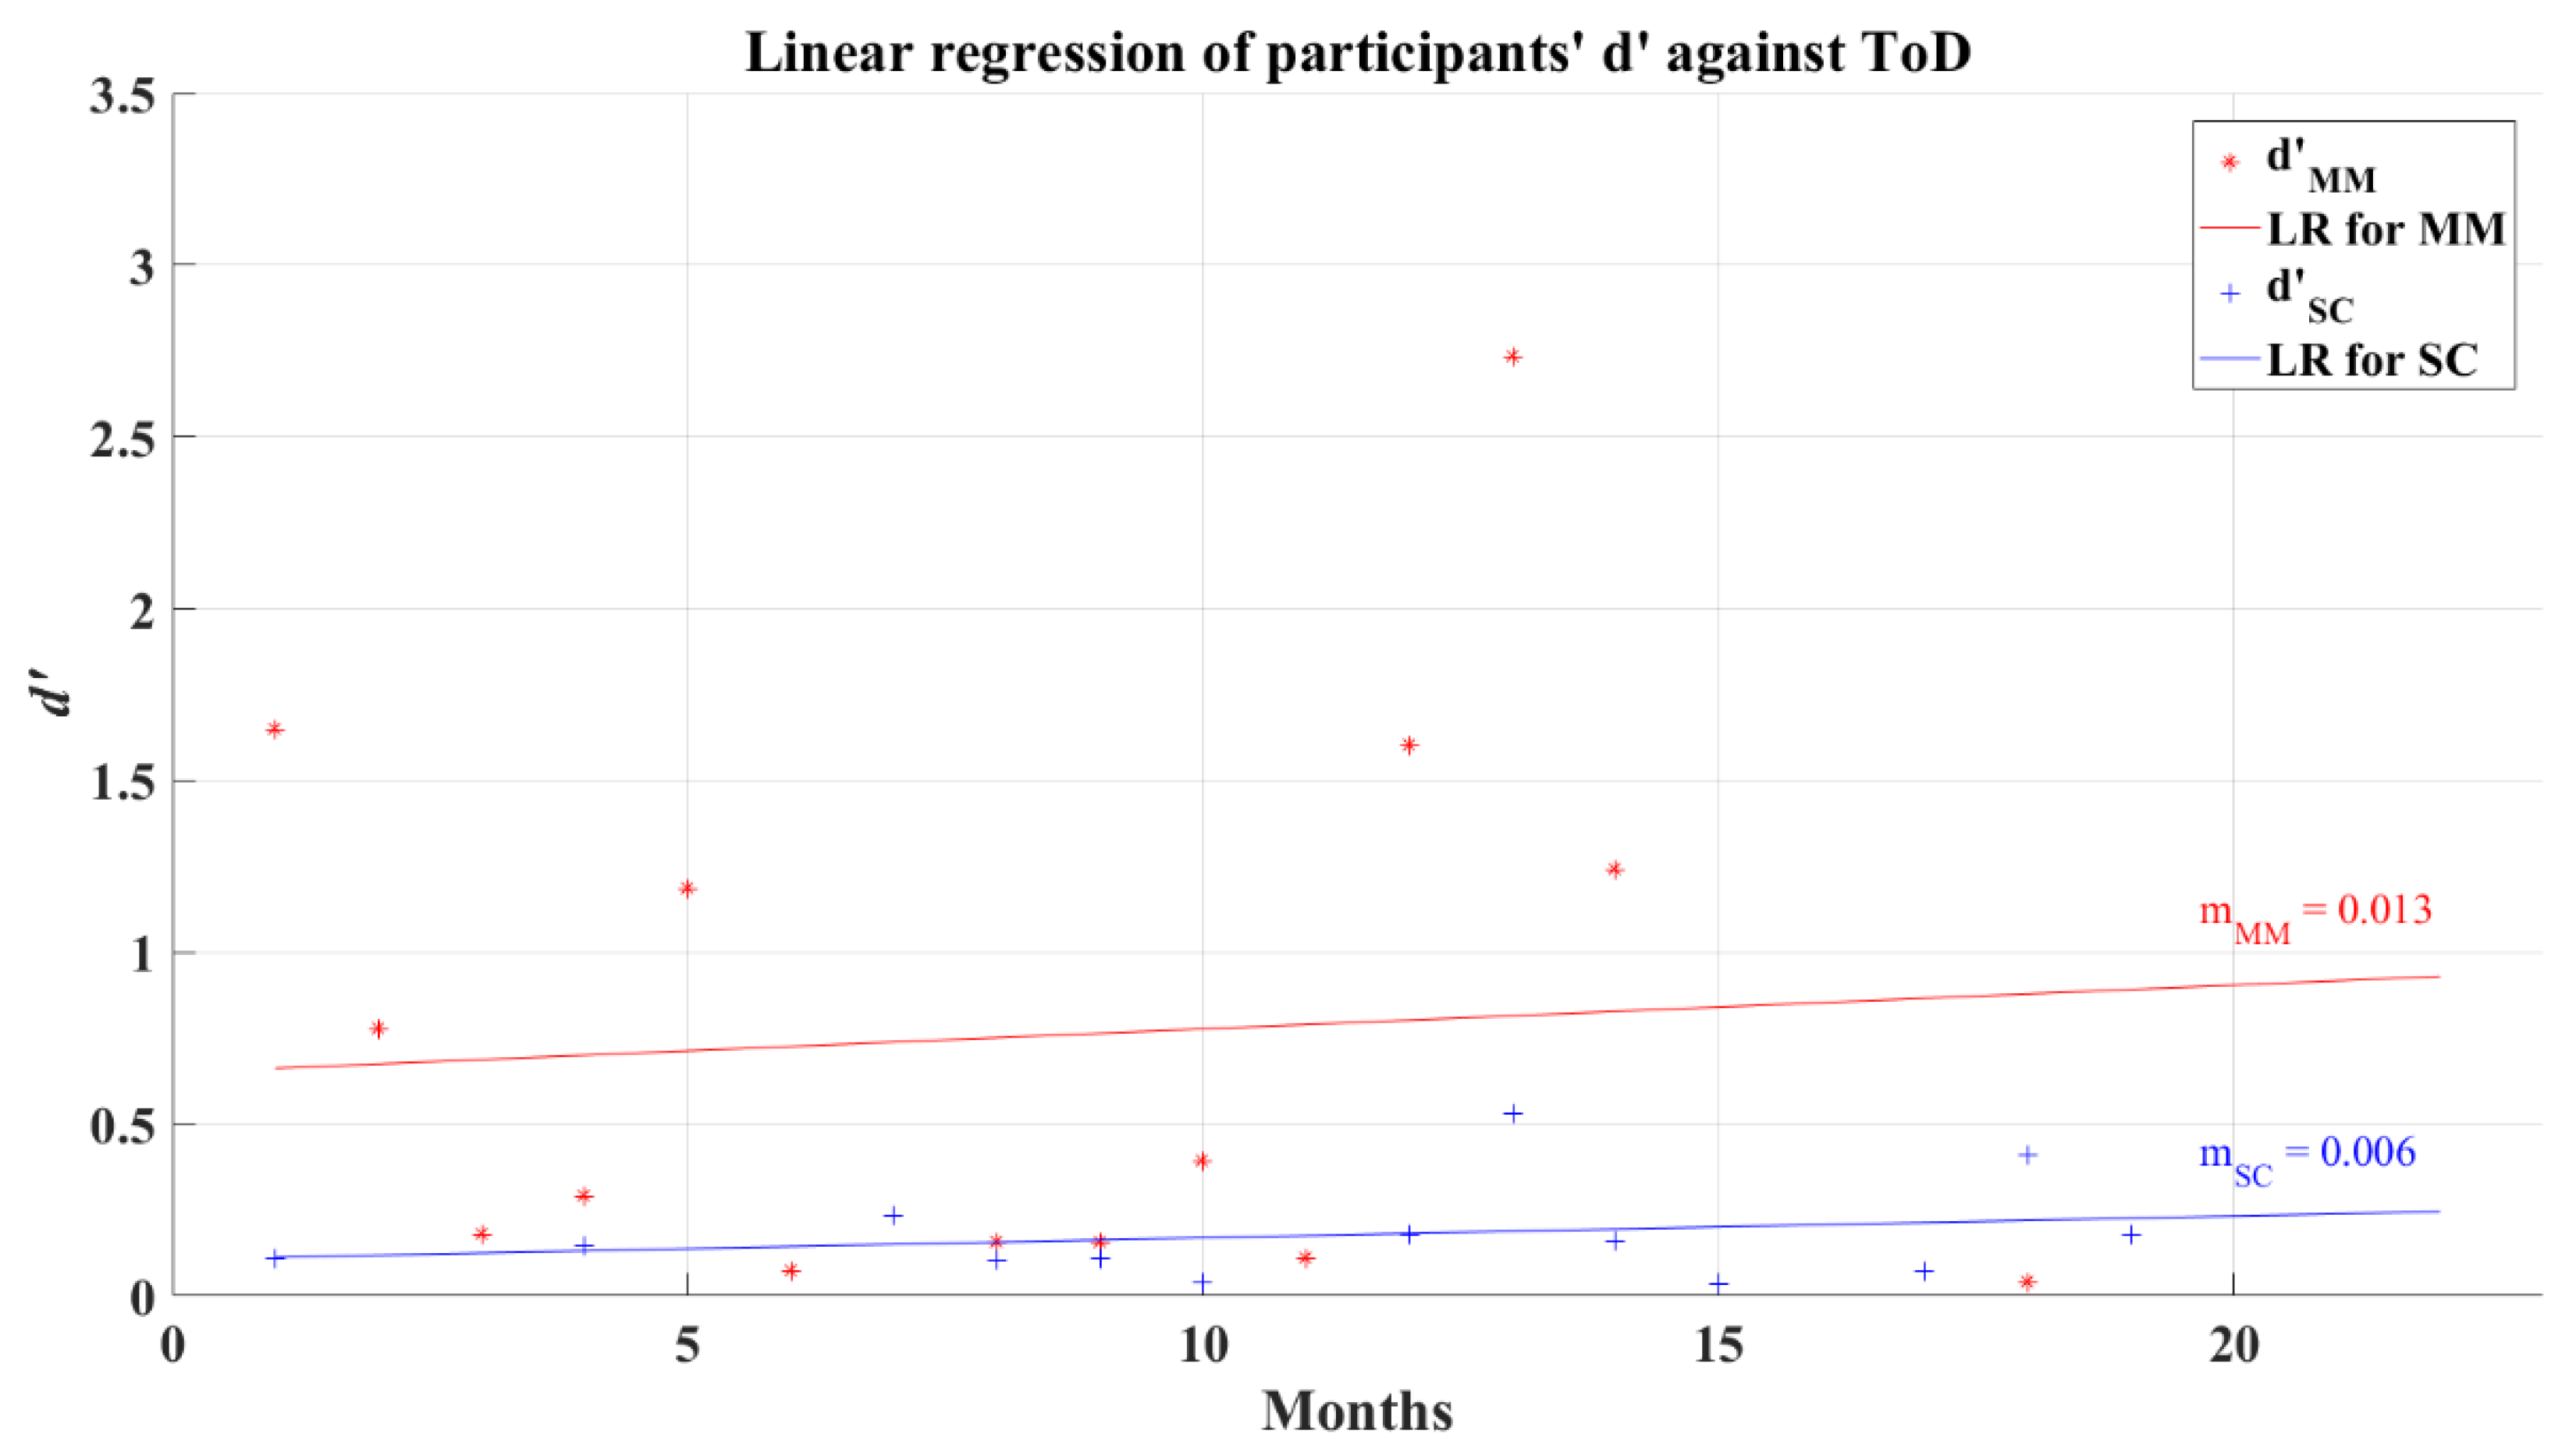
3.3. Two-Alternative Forced Choice Analysis
3.4. Simple Reaction Time Analysis
3.5. Analysis of the Post-COVID-19 Severe-Critical Group by Age Groups
3.6. Risk Estimates
4. Discussion
5. Conclusions
Author Contributions
Funding
Institutional Review Board Statement
Informed Consent Statement
Data Availability Statement
Acknowledgments
Conflicts of Interest
References
- World Health Organization. COVID-19 Weekly Epidemiological Update; World Health Organization: Geneva, Switzerland, 2022. [Google Scholar]
- Maury, A.; Lyoubi, A.; Peiffer-Smadja, N.; de Broucker, T.; Meppiel, E. Neurological Manifestations Associated with SARS-CoV-2 and Other Coronaviruses: A Narrative Review for Clinicians. Rev. Neurol. 2021, 177, 51–64. [Google Scholar] [CrossRef] [PubMed]
- Lopez-Leon, S.; Wegman-Ostrosky, T.; Perelman, C.; Sepulveda, R.; Rebolledo, P.A.; Cuapio, A.; Villapol, S. More than 50 Long-Term Effects of COVID-19: A Systematic Review and Meta-Analysis. Sci. Rep. 2021, 11, 16144. [Google Scholar] [CrossRef] [PubMed]
- Costa, Í.F.; Bonifácio, L.P.; Bellissimo-Rodrigues, F.; Rocha, E.M.; Jorge, R.; Bollela, V.R.; Antunes-Foschini, R. Ocular Findings among Patients Surviving COVID-19. Sci. Rep. 2021, 11, 11085. [Google Scholar] [CrossRef] [PubMed]
- Ellul, M.A.; Benjamin, L.; Singh, B.; Lant, S.; Michael, B.D.; Easton, A.; Kneen, R.; Defres, S.; Sejvar, J.; Solomon, T. Neurological Associations of COVID-19. Lancet Neurol. 2020, 19, 767–783. [Google Scholar] [CrossRef]
- Helms, J.; Kremer, S.; Merdji, H.; Clere-Jehl, R.; Schenck, M.; Kummerlen, C.; Collange, O.; Boulay, C.; Fafi-Kremer, S.; Ohana, M.; et al. Neurologic Features in Severe SARS-CoV-2 Infection. N. Engl. J. Med. 2020, 382, 2268–2270. [Google Scholar] [CrossRef]
- Marshall, M. How COVID-19 Can Damage the Brain. Nature 2020, 585, 342–343. [Google Scholar] [CrossRef]
- Paterson, R.W.; Brown, R.L.; Benjamin, L.; Nortley, R.; Wiethoff, S.; Bharucha, T.; Jayaseelan, D.L.; Kumar, G.; Raftopoulos, R.E.; Zambreanu, L.; et al. The Emerging Spectrum of COVID-19 Neurology: Clinical, Radiological and Laboratory Findings. Brain 2020, 143, 3104–3120. [Google Scholar] [CrossRef]
- Varatharaj, A.; Thomas, N.; Ellul, M.A.; Davies, N.W.S.; Pollak, T.A.; Tenorio, E.L.; Sultan, M.; Easton, A.; Breen, G.; Zandi, M.; et al. Neurological and Neuropsychiatric Complications of COVID-19 in 153 Patients: A UK-Wide Surveillance Study. Lancet Psychiatry 2020, 7, 875–882. [Google Scholar] [CrossRef]
- Andrei Appelt, P.; Taciana Sisconetto, A.; Baldo Sucupira, K.S.M.; de Moura Neto, E.; de Jesus Chagas, T.; Bazan, R.; Moura Cabral, A.; de Oliveira Andrade, A.; de Souza, L.A.P.S.; José Luvizutto, G. Changes in Electrical Brain Activity and Cognitive Functions Following Mild to Moderate COVID-19: A One-Year Prospective Study after Acute Infection. Clin. EEG Neurosci. 2022, 155005942211038. [Google Scholar] [CrossRef]
- Kopańska, M.; Banaś-Ząbczyk, A.; Łagowska, A.; Kuduk, B.; Szczygielski, J. Changes in EEG Recordings in COVID-19 Patients as a Basis for More Accurate QEEG Diagnostics and EEG Neurofeedback Therapy: A Systematic Review. J. Clin. Med. 2021, 10, 1300. [Google Scholar] [CrossRef]
- Gangaputra, S.S.; Patel, S.N. Ocular Symptoms among Nonhospitalized Patients Who Underwent COVID-19 Testing. Ophthalmology 2020, 127, 1425–1427. [Google Scholar] [CrossRef]
- Sen, M.; Honavar, S.; Sharma, N.; Sachdev, M. COVID-19 and Eye: A Review of Ophthalmic Manifestations of COVID-19. Indian J. Ophthalmol. 2021, 69, 488. [Google Scholar] [CrossRef]
- Luís, M.E.; Hipólito-Fernandes, D.; Mota, C.; Maleita, D.; Xavier, C.; Maio, T.; Cunha, J.P.; Tavares Ferreira, J. A Review of Neuro-Ophthalmological Manifestations of Human Coronavirus Infection. Eye Brain 2020, 12, 129–137. [Google Scholar] [CrossRef]
- Johansson, J.; Levi, R.; Jakobsson, M.; Gunnarsson, S.; Samuelsson, K. Multiprofessional Neurorehabilitation After COVID-19 Infection Should Include Assessment of Visual Function. Arch. Rehabil. Res. Clin. Transl. 2022, 4, 100184. [Google Scholar] [CrossRef]
- Javed, A. Neurological Associations of SARS-CoV-2 Infection: A Systematic Review. CNS Neurol. Disord. Drug Targets 2022, 21, 246–258. [Google Scholar] [CrossRef]
- Arica-Polat, B.S.; Gündoğdu, A.A.; Cinar, N.; Uncu, G.; Ayas, Z.O.; Iseri, P.; Karadas, O.; Adapinar, D.O. Evaluation of Cognitive Deficits in Patients Infected with COVID-19. Eur. Rev. Med. Pharmacol. Sci. 2022, 26, 678–685. [Google Scholar] [CrossRef]
- Batty, G.D.; Deary, I.J.; Gale, C.R. Pre-Pandemic Cognitive Function and COVID-19 Mortality: Prospective Cohort Study. Eur. J. Epidemiol. 2021, 36, 559–564. [Google Scholar] [CrossRef]
- Deary, I. Reaction Times and Intelligence Differences a Population-Based Cohort Study. Intelligence 2001, 29, 389–399. [Google Scholar] [CrossRef]
- Allen, J. Red Light-Green Light Reaction Time Test. Available online: https://faculty.washington.edu/chudler/java/redgreen.html (accessed on 9 February 2021).
- Fokides, E.; Chronopoulou, M.I.; Kaimara, P. Comparing Videos and a 3D Virtual Environment for Teaching School-Related Functional Skills and Behaviors to Students with ADHD or Developmental Dyslexia, Displaying Challenging Behaviors: A Case Study. Res. Pract. Technol. Enhanc. Learn. 2019, 14, 22. [Google Scholar] [CrossRef]
- Jirayucharoensak, S.; Israsena, P.; Pan-ngum, S.; Hemrungrojn, S.; Maes, M. A Game-Based Neurofeedback Training System to Enhance Cognitive Performance in Healthy Elderly Subjects and in Patients with Amnestic Mild Cognitive Impairment. Clin. Interv. Aging 2019, 14, 347–360. [Google Scholar] [CrossRef]
- Parsons, S. Authenticity in Virtual Reality for Assessment and Intervention in Autism: A Conceptual Review. Educ. Res. Rev. 2016, 19, 138–157. [Google Scholar] [CrossRef]
- National Institutes of Health Coronavirus Disease 2019 (COVID-19) Treatment Guidelines. Available online: https://www.covid19treatmentguidelines.nih.gov/ (accessed on 4 April 2022).
- Welford, A.T. Reaction Time, Speed of Performance, and Age. Ann. N. Y. Acad. Sci. 1988, 515, 1–17. [Google Scholar] [CrossRef]
- Wickens, C.D.; Hollands, J.G. Engineering Psychology and Human Performance, 3rd ed.; Prentice Hall: Upper Saddle River, NJ, USA, 1999. [Google Scholar]
- Macmillan, N.A.; Creelman, C.D. Two-Alternative Forced Choice (2AFC). In Detection Theory: A User’s Guide; Lawrence Earlbaum Associates: Mahwah, NJ, USA, 2005; pp. 165–179. ISBN 0-8058-4230-6. [Google Scholar]
- EMOTIV Performance Metrics. Available online: https://www.emotiv.com/knowledge-base/performance-metrics/ (accessed on 17 May 2022).
- Microsoft Corporation Fog Formulas. Available online: https://docs.microsoft.com/en-us/previous-versions/windows/desktop/bb324452(v=vs.85)?redirectedfrom=MSDN (accessed on 16 May 2022).
- Macmillan, N.A.; Creelman, C.D. Values of d’ for m-Interval Forced Choice or Identification. In Detection Theory: A User’s Guide; Lawrence Earlbaum Associates: Mahwah, NJ, USA, 2005; pp. 426–430. ISBN 0-8058-4230-6. [Google Scholar]
- Melnik, A.; Legkov, P.; Izdebski, K.; Kärcher, S.M.; Hairston, W.D.; Ferris, D.P.; König, P. Systems, Subjects, Sessions: To What Extent Do These Factors Influence EEG Data? Front. Hum. Neurosci. 2017, 11, 150. [Google Scholar] [CrossRef]
- Badcock, N.A.; Mousikou, P.; Mahajan, Y.; de Lissa, P.; Thie, J.; McArthur, G. Validation of the Emotiv EPOC® EEG Gaming System for Measuring Research Quality Auditory ERPs. PeerJ 2013, 1, e38. [Google Scholar] [CrossRef]
- EMOTIV Emotiv EPOC+ Technical Especifications. Available online: https://emotiv.gitbook.io/epoc-user-manual/introduction-1/technical_specifications (accessed on 29 June 2021).
- Tombaugh, T.N.; McIntyre, N.J. The Mini-Mental State Examination: A Comprehensive Review. J. Am. Geriatr. Soc. 1992, 40, 922–935. [Google Scholar] [CrossRef]
- Baltes, P.B.; Lindenberger, U. Emergence of a Powerful Connection between Sensory and Cognitive Functions Across the Adult Life Span: A New Window to the Study of Cognitive Aging? Psychol. Aging 1997, 2, 12–21. [Google Scholar] [CrossRef]
- Carrillo-Vega, M.F.; Salinas-Escudero, G.; García-Peña, C.; Gutiérrez-Robledo, L.M.; Parra-Rodríguez, L. Early Estimation of the Risk Factors for Hospitalization and Mortality by COVID-19 in Mexico. PLoS ONE 2020, 15, e0238905. [Google Scholar] [CrossRef]
- Hu, K.; Patel, J.; Swiston, C.; Patel, B.C. Ophthalmic Manifestations of Coronavirus (COVID-19); StatPearls Publishing: Treasure Island, FL, USA, 2022. [Google Scholar]
- Zhong, Y.; Wang, K.; Zhu, Y.; Lyu, D.; Yu, Y.; Li, S.; Yao, K. Ocular Manifestations in COVID-19 Patients: A Systematic Review and Meta-Analysis. Travel Med. Infect. Dis. 2021, 44, 102191. [Google Scholar] [CrossRef]
- Tisdale, A.K.; Dinkin, M.; Chwalisz, B.K. Afferent and Efferent Neuro-Ophthalmic Complications of Coronavirus Disease 19. J. Neuro-Ophthalmol. 2021, 41, 154–165. [Google Scholar] [CrossRef]
- Napoli, P.E.; Nioi, M.; Fossarello, M. The “Quarantine Dry Eye”: The Lockdown for Coronavirus Disease 2019 and Its Implications for Ocular Surface Health. Risk Manag. Healthc. Policy 2021, 14, 1629–1636. [Google Scholar] [CrossRef]
- Douaud, G.; Lee, S.; Alfaro-Almagro, F.; Arthofer, C.; Wang, C.; McCarthy, P.; Lange, F.; Andersson, J.L.R.; Griffanti, L.; Duff, E.; et al. SARS-CoV-2 Is Associated with Changes in Brain Structure in UK Biobank. Nature 2022, 604, 697–707. [Google Scholar] [CrossRef] [PubMed]


| Group | Sex | Age Mean (SD) | Schooling | MMSE d Score (SD) | ToD e Months | ||
|---|---|---|---|---|---|---|---|
| M a | F b | T c | Years (SD) | ||||
| Control | 25 | 13 | 38 | 37.29 (11.77) | 15.00 (2.73) | 29.00 (1.01) | - |
| Mild-Moderate | 35 | 32 | 66 | 35.98 (11.24) | 14.74 (3.09) | 28.55 (1.43) | 8.70 (5.04) |
| Severe-Critical | 15 | 25 | 40 | 43.65 (9.20) | 14.28 (3.49) | 28.50 (1.13) | 11.25 (5.29) |
| Group | 2AFC-P1 a | 2AFC-P2 b | SRT c | ||||||
|---|---|---|---|---|---|---|---|---|---|
| N d | CD e | No CD | N | CD | No CD | N | CD | No CD | |
| Control | 30 | 7 | 23 | 26 | 5 | 21 | 32 | 9 | 23 |
| Mild- Moderate | 24 | 3 | 21 | 43 | 10 | 33 | 66 | 28 | 38 |
| Severe-Critical | 32 | 12 | 20 | 26 | 12 | 14 | 37 | 23 | 14 |
| Age Group | Control | Mild-Moderate | Severe-Critical | |||
|---|---|---|---|---|---|---|
| M (SD) | Med | M (SD) | Med | M (SD) | Med | |
| Adult | 3.144 (0.268) | 3.280 | 3.221 (0.171) | 3.280 | 2.973 (0.618) | 3.280 |
| Middle-aged | 2.537 (0.828) | 2.780 | 3.023 (0.343) | 3.280 | 2.011 (1.072) | 1.980 |
| Cognitive Metric | 2AFC-P1 a | 2AFC-P2 b | ||||
|---|---|---|---|---|---|---|
| CT c | MM d | SC e | CT | MM | SC | |
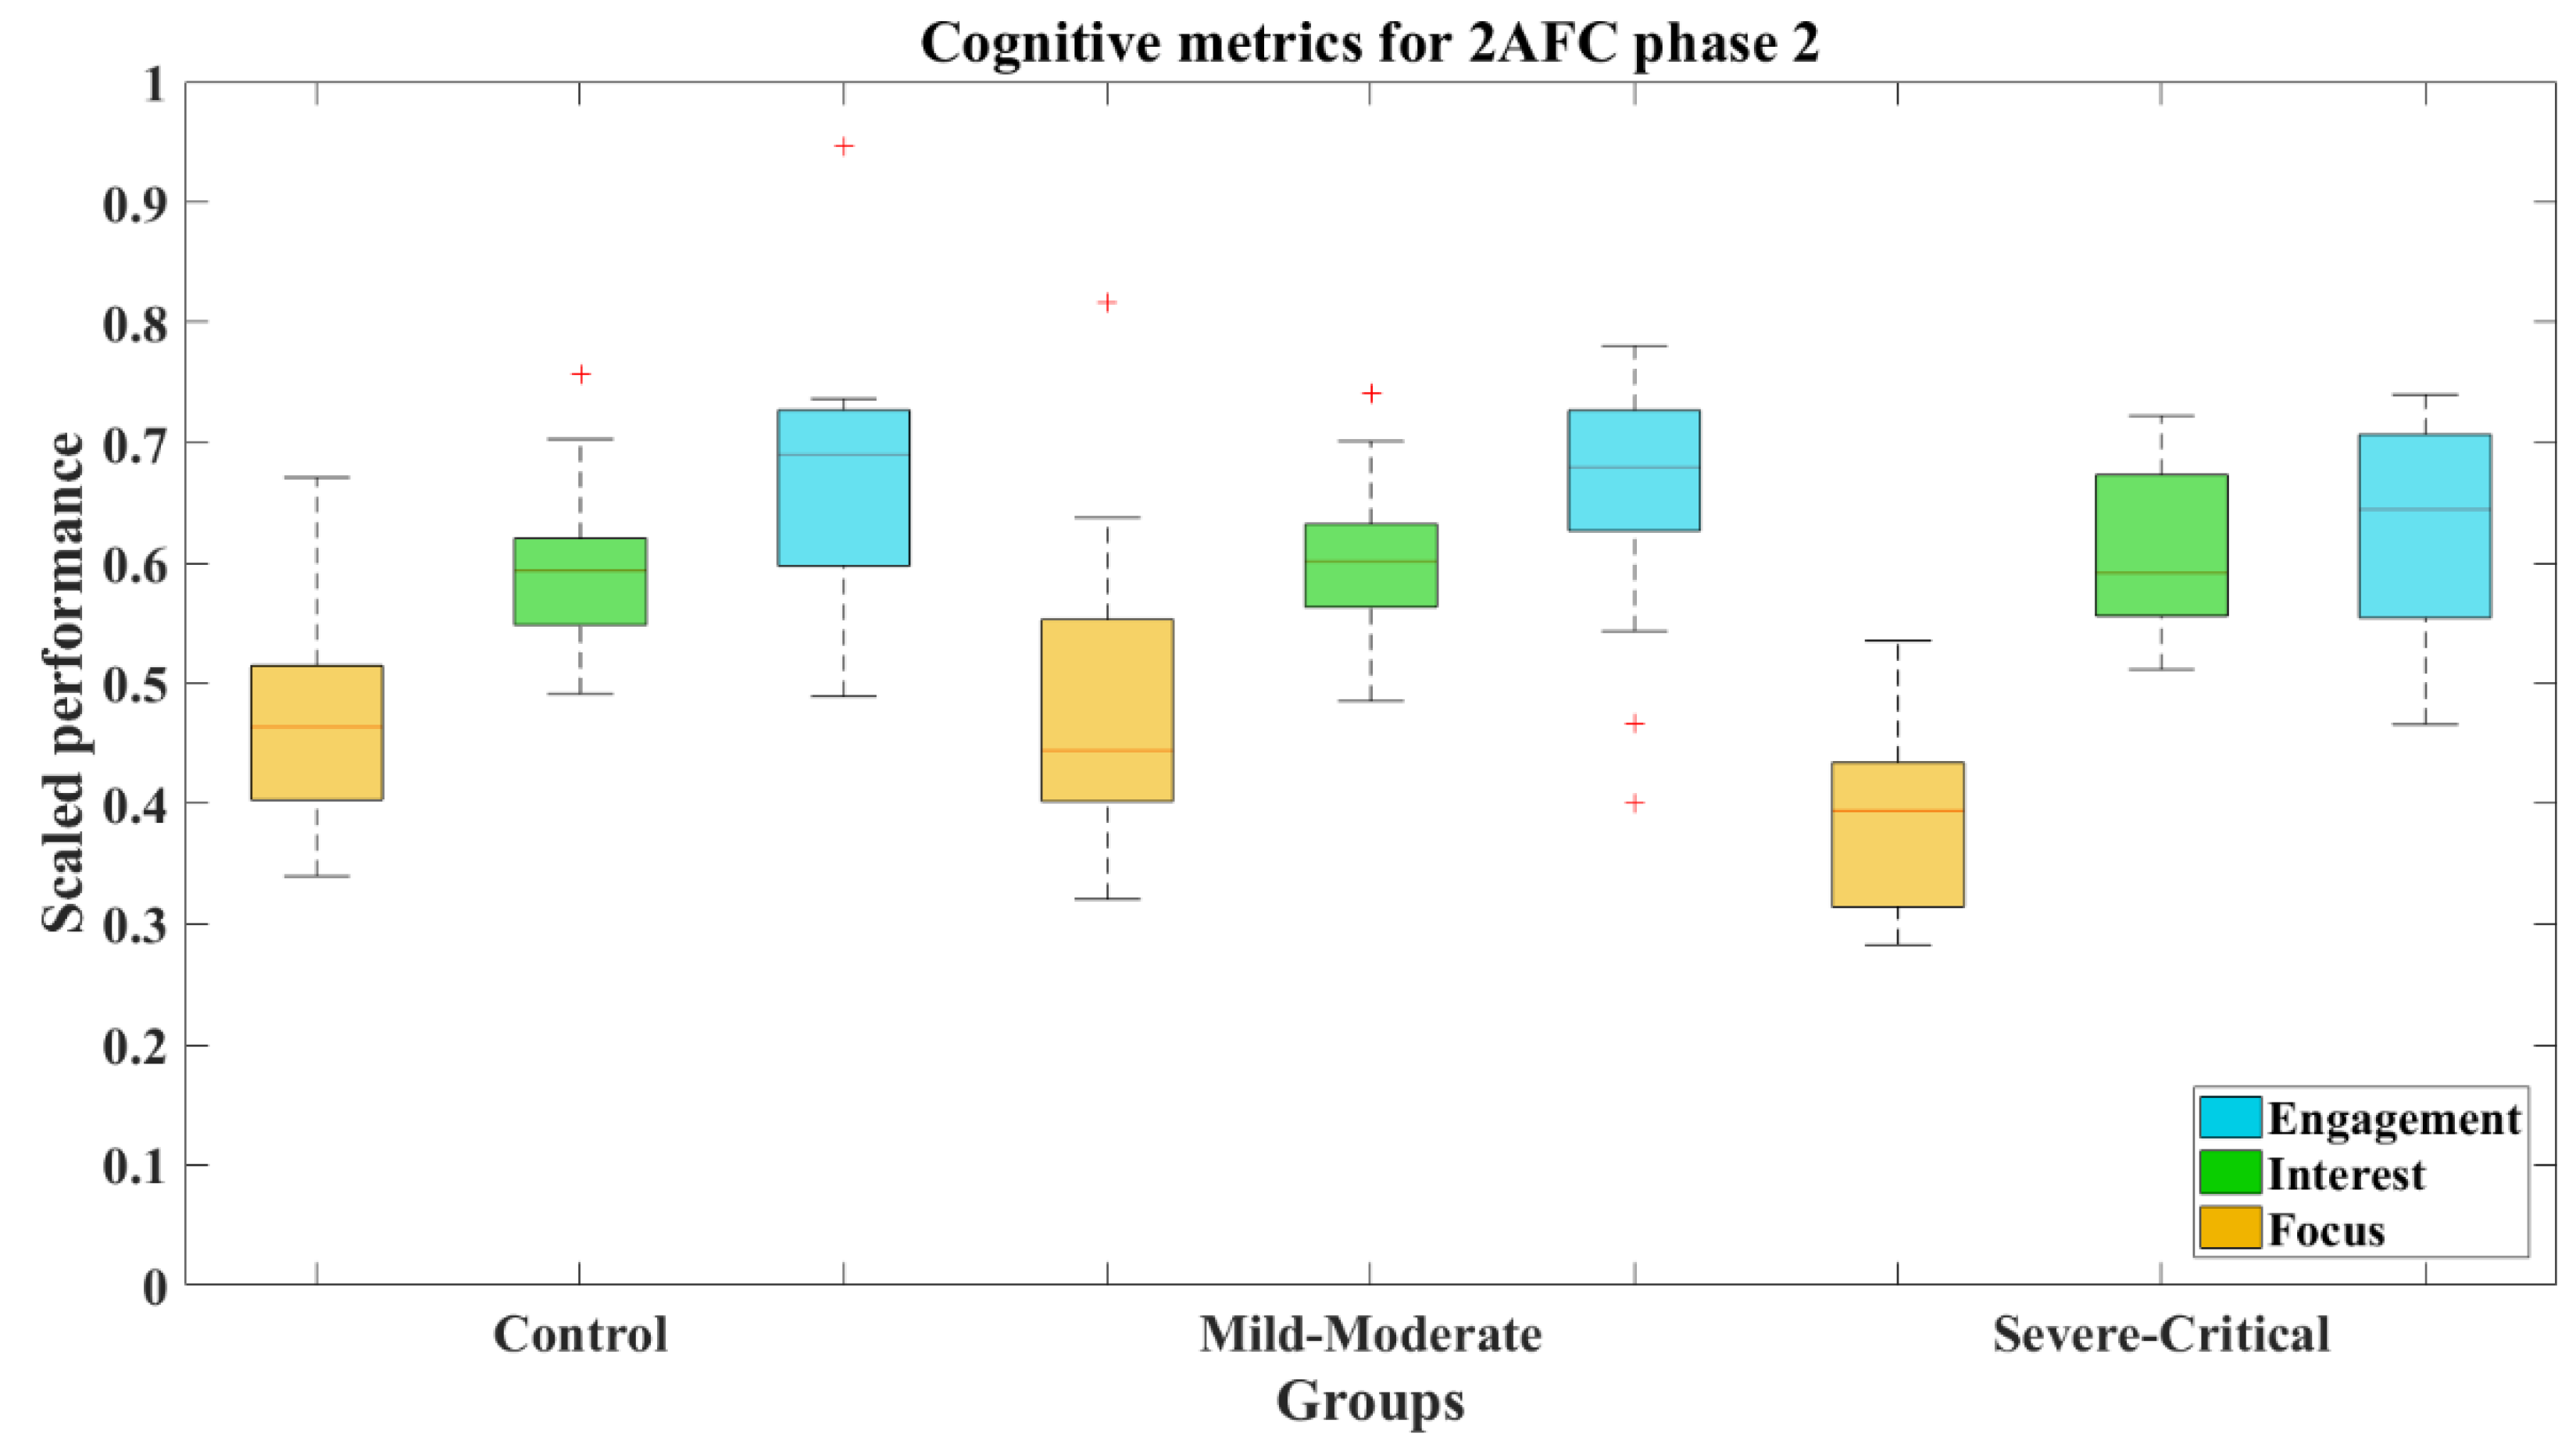
| Focus | M = 0.379 SD = 0.027 Mdn = 0.373 | M = 0.385 SD = 0.037 Mdn = 0.379 | M = 0.333 SD = 0.016 Mdn = 0.336 | M = 0.473 SD = 0.063 Mdn = 0.464 | M = 0.479 SD = 0.044 Mdn = 0.445 | M = 0.386 SD = 0.029 Mdn = 0.394 |
| Interest | M = 0.565 SD = 0.023 Mdn = 0.557 | M = 0.569 SD = 0.019 Mdn = 0.574 | M = 0.590 SD = 0.021 Mdn = 0.595 | M = 0.594 SD = 0.022 Mdn = 0.594 | M = 0.600 SD = 0.024 Mdn = 0.601 | M = 0.610 SD = 0.027 Mdn = 0.592 |
| Engagement | M = 0.693 SD = 0.012 Mdn = 0.694 | M = 0.650 SD = 0.032 Mdn = 0.643 | M = 0.624 SD = 0.016 Mdn = 0.678 | M = 0.672 SD = 0.026 Mdn = 0.690 | M = 0.664 SD = 0.020 Mdn = 0.679 | M = 0.624 SD = 0.025 Mdn = 0.645 |
| Cognitive Metric | 2AFC-P1 a | 2AFC-P2 b | ||||
|---|---|---|---|---|---|---|
| CT-MM c | MM-SC d | CT-SC e | CT-MM | MM-SC | CT-SC | |
| Focus | Z = 0.050 d = −0.07 | Z = 1.561 d = 0.55 | Z = 1.840 d = 0.59 | Z = 0.400 d = −0.05 | Z = 2.497* d = 0.88 | Z = 2.473 * d = 1.02 |
| Interest | Z = −0.650 d = −0.07 | Z = −1.110 d = −0.40 | Z = −1.335 d = −0.42 | Z = −0.538 d = −0.09 | Z = −0.197 d = −0.17 | Z = −0.603 d = −0.24 |
| Engagement | Z = 1.550 d = 0.45 | Z = 0.277 d = 0.21 | Z = 1.222 d = 0.59 | Z = −0.041 d = 0.08 | Z = 1.437 d = 0.43 | Z = 1.226 d = 0.49 |
| Age Group | Control | Mild-Moderate | Severe-Critical | |||
|---|---|---|---|---|---|---|
| M (SD) | Med | M (SD) | Med | M (SD) | Med | |
| Adult | 1.721 (0.975) | 1.900 | 0.975 (0.967) | 0.620 | 0.216 (0.278) | 0.125 |
| Middle-aged | 0.163 (0.227) | 0.090 | 0.137 (0.106) | 0.125 | 0.181 (0.252) | 0.090 |
| Age group | Control | Mild-Moderate | Severe-Critical | |||
|---|---|---|---|---|---|---|
| M (SD) | Med | M (SD) | Med | M (SD) | Med | |
| Adult | 312.957 (40.196) | 318.002 | 318.329 (46.152) | 315.769 | 356.080 (55.770) | 360.181 |
| Middle-aged | 320.952 (40.610) | 308.438 | 368.566 (67.589) | 359.028 | 380.068 (79.889) | 355.642 |
| Subgroup | 2AFC-P1 a | 2AFC-P2 b | SRT c |
|---|---|---|---|
| Adult | M = 2.973 SD = 0.618 | M = 0.216 SD = 0.278 | M = 356.080 ms SD = 55.770 ms |
| Middle-aged | M = 2.011 SD = 1.072 | M = 0.181 SD = 0.252 | M = 380.068 ms SD = 79.889 ms |
Publisher’s Note: MDPI stays neutral with regard to jurisdictional claims in published maps and institutional affiliations. |
© 2022 by the authors. Licensee MDPI, Basel, Switzerland. This article is an open access article distributed under the terms and conditions of the Creative Commons Attribution (CC BY) license (https://creativecommons.org/licenses/by/4.0/).
Share and Cite
Santoyo-Mora, M.; Villaseñor-Mora, C.; Cardona-Torres, L.M.; Martínez-Nolasco, J.J.; Barranco-Gutiérrez, A.I.; Padilla-Medina, J.A.; Bravo-Sánchez, M.G. COVID-19 Long-Term Effects: Is There an Impact on the Simple Reaction Time and Alternative-Forced Choice on Recovered Patients? Brain Sci. 2022, 12, 1258. https://doi.org/10.3390/brainsci12091258
Santoyo-Mora M, Villaseñor-Mora C, Cardona-Torres LM, Martínez-Nolasco JJ, Barranco-Gutiérrez AI, Padilla-Medina JA, Bravo-Sánchez MG. COVID-19 Long-Term Effects: Is There an Impact on the Simple Reaction Time and Alternative-Forced Choice on Recovered Patients? Brain Sciences. 2022; 12(9):1258. https://doi.org/10.3390/brainsci12091258
Chicago/Turabian StyleSantoyo-Mora, Mauro, Carlos Villaseñor-Mora, Luz M. Cardona-Torres, Juan J. Martínez-Nolasco, Alejandro I. Barranco-Gutiérrez, José A. Padilla-Medina, and Micael Gerardo Bravo-Sánchez. 2022. "COVID-19 Long-Term Effects: Is There an Impact on the Simple Reaction Time and Alternative-Forced Choice on Recovered Patients?" Brain Sciences 12, no. 9: 1258. https://doi.org/10.3390/brainsci12091258
APA StyleSantoyo-Mora, M., Villaseñor-Mora, C., Cardona-Torres, L. M., Martínez-Nolasco, J. J., Barranco-Gutiérrez, A. I., Padilla-Medina, J. A., & Bravo-Sánchez, M. G. (2022). COVID-19 Long-Term Effects: Is There an Impact on the Simple Reaction Time and Alternative-Forced Choice on Recovered Patients? Brain Sciences, 12(9), 1258. https://doi.org/10.3390/brainsci12091258