
Task-Related Hemodynamic Changes Induced by High-Definition Transcranial Direct Current Stimulation in Chronic Stroke Patients: An Uncontrolled Pilot fNIRS Study


Abstract
:1. Introduction
2. Materials and Methods
2.1. Participants
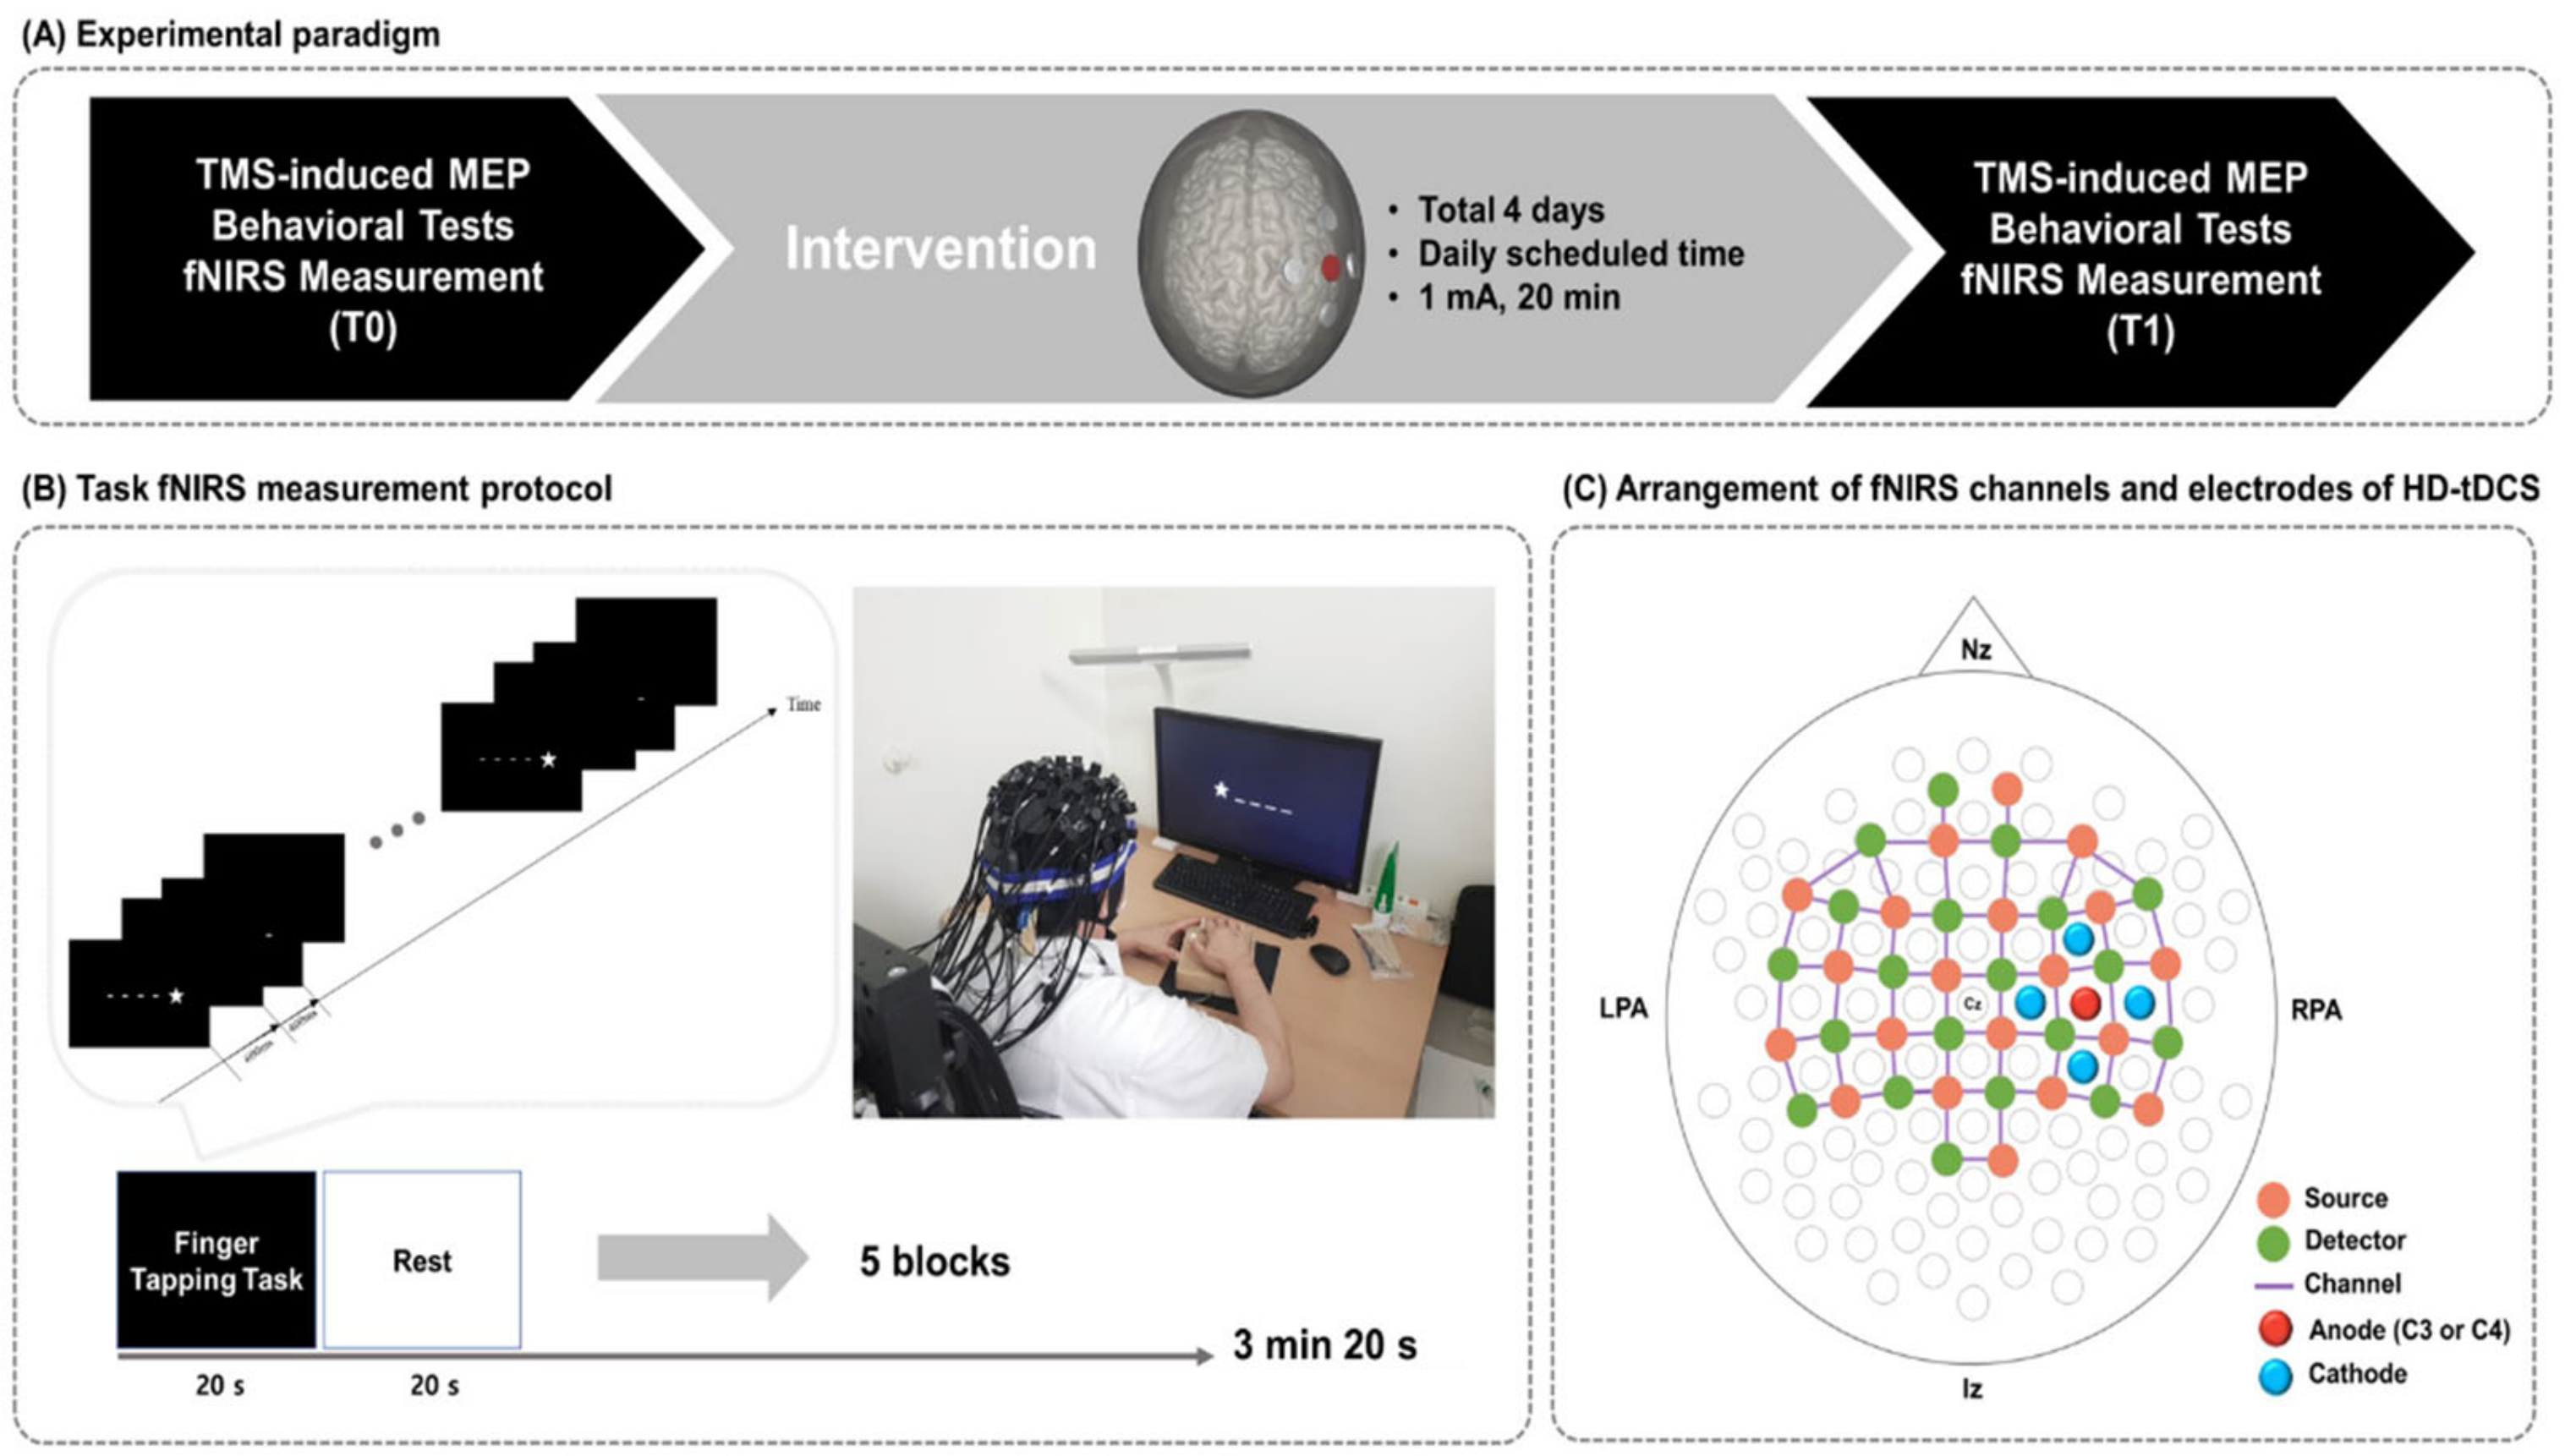
2.2. Study Design
2.3. High-Definition tDCS
2.4. Measurement of Hemodynamic Changes during the Finger Tapping Task
2.5. fNIRS Data Anlysis
2.6. Identification of the Hand Motor Hotspot and Motor Evoked Potential Study
2.7. Behavioral Assessments
2.8. Statistical Analysis
3. Results
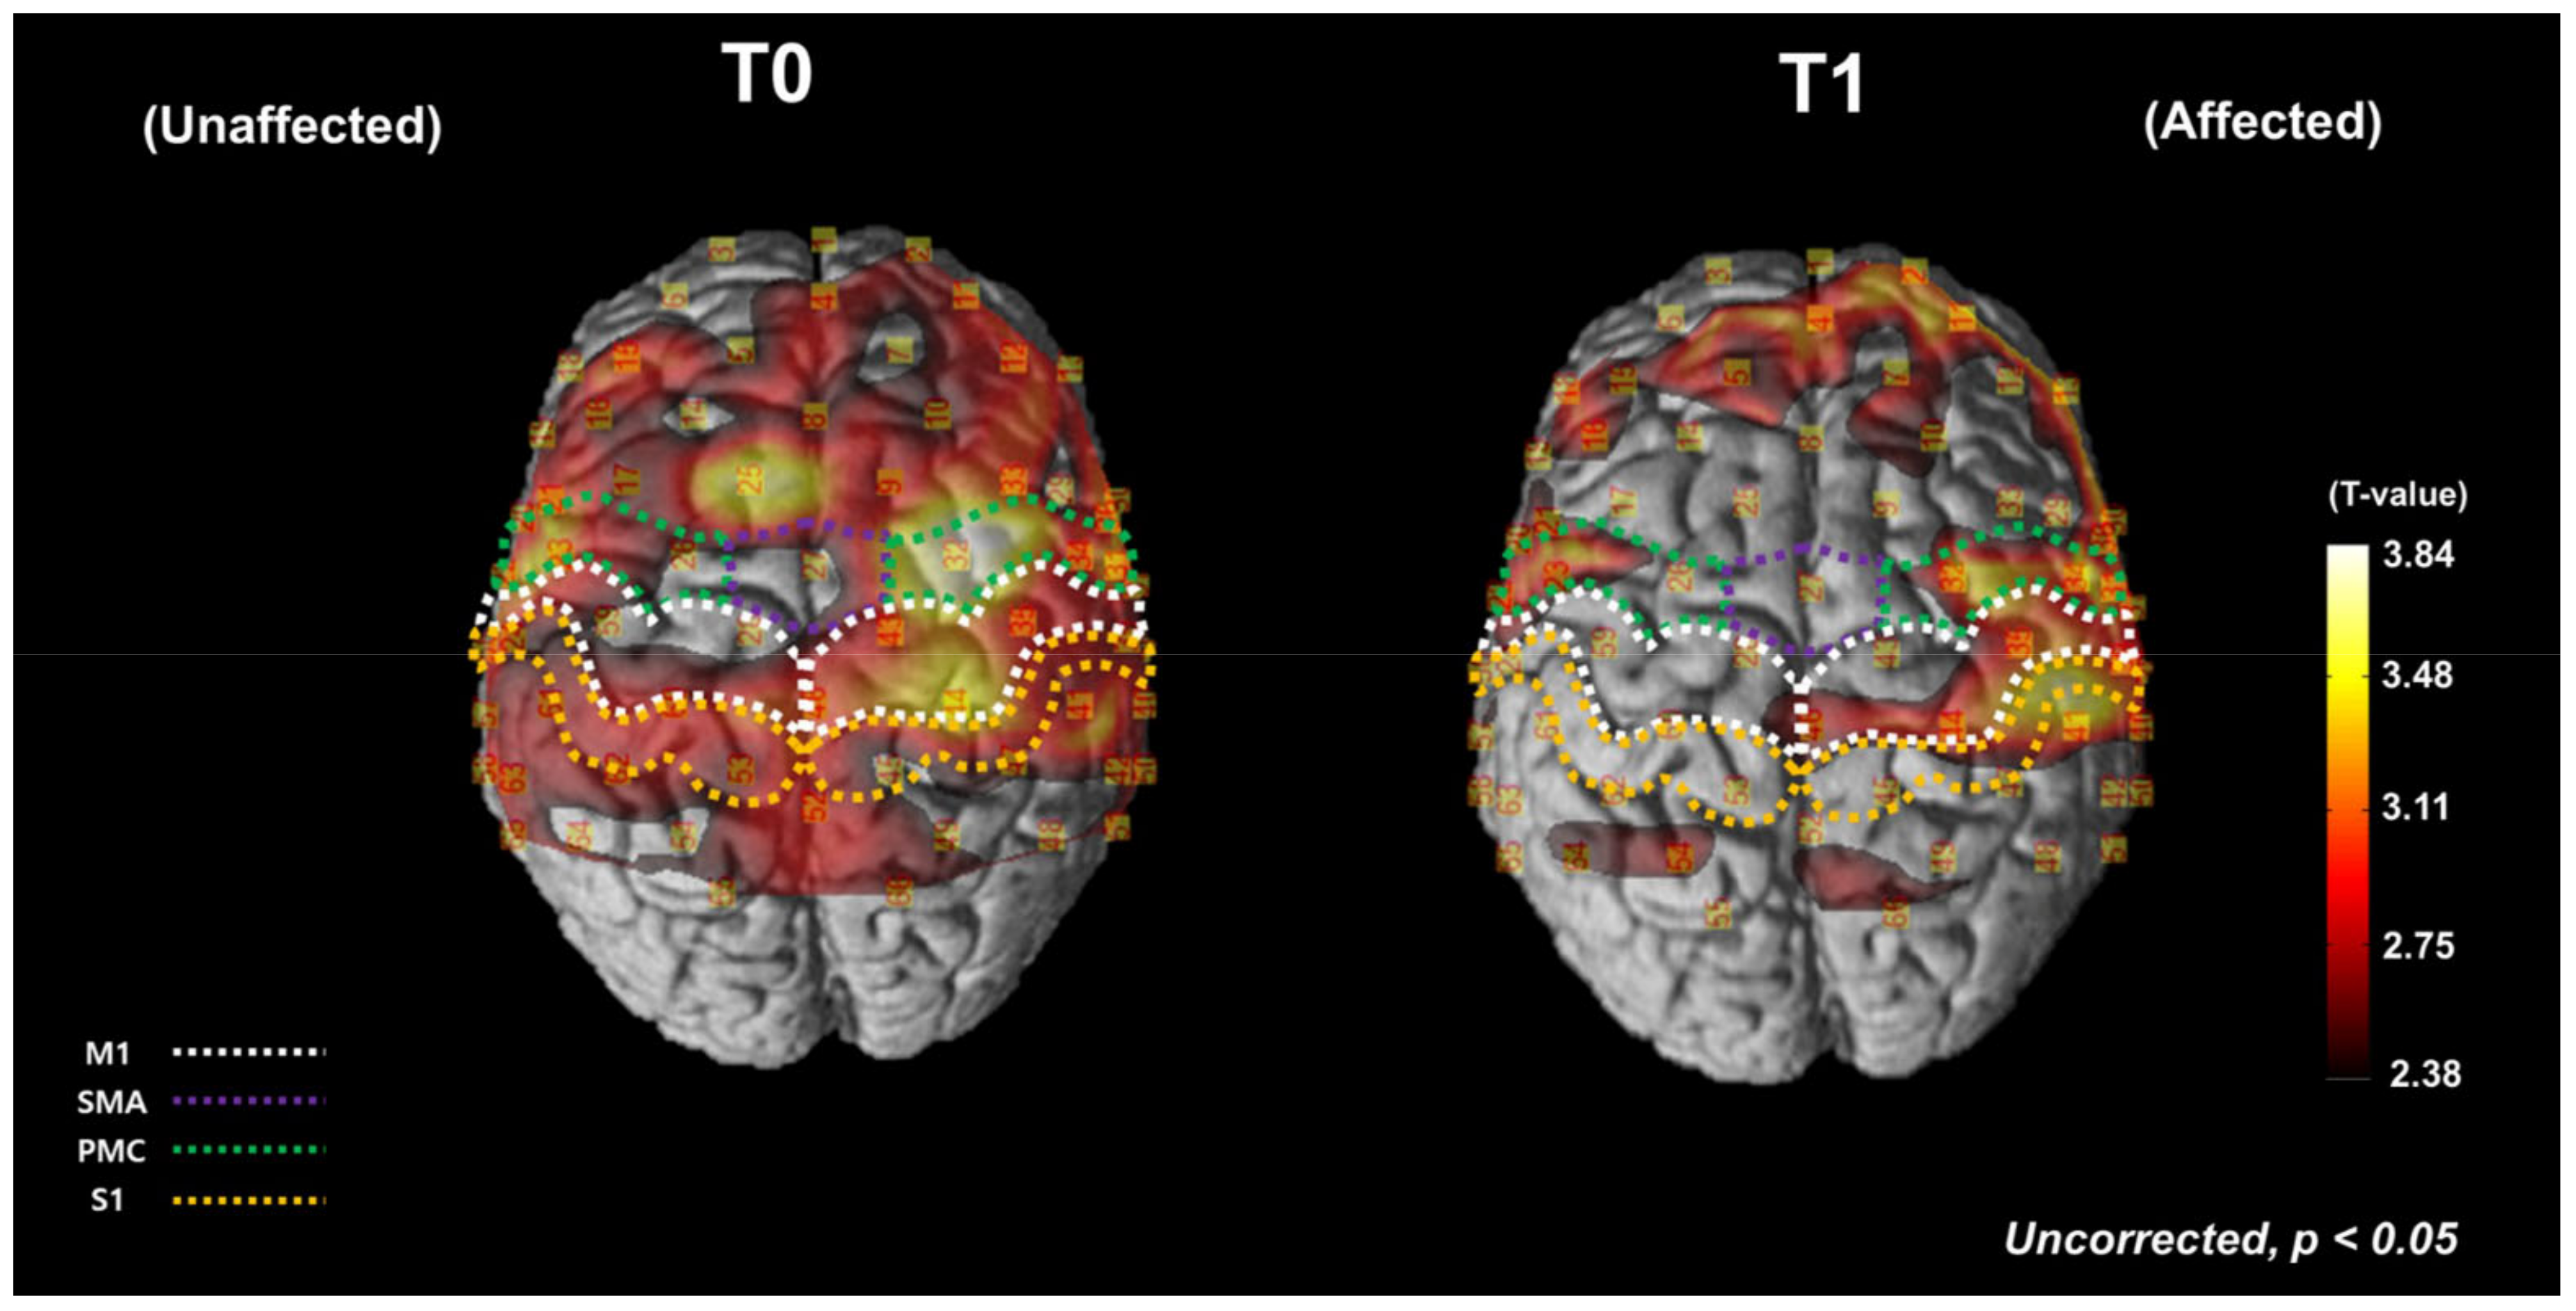
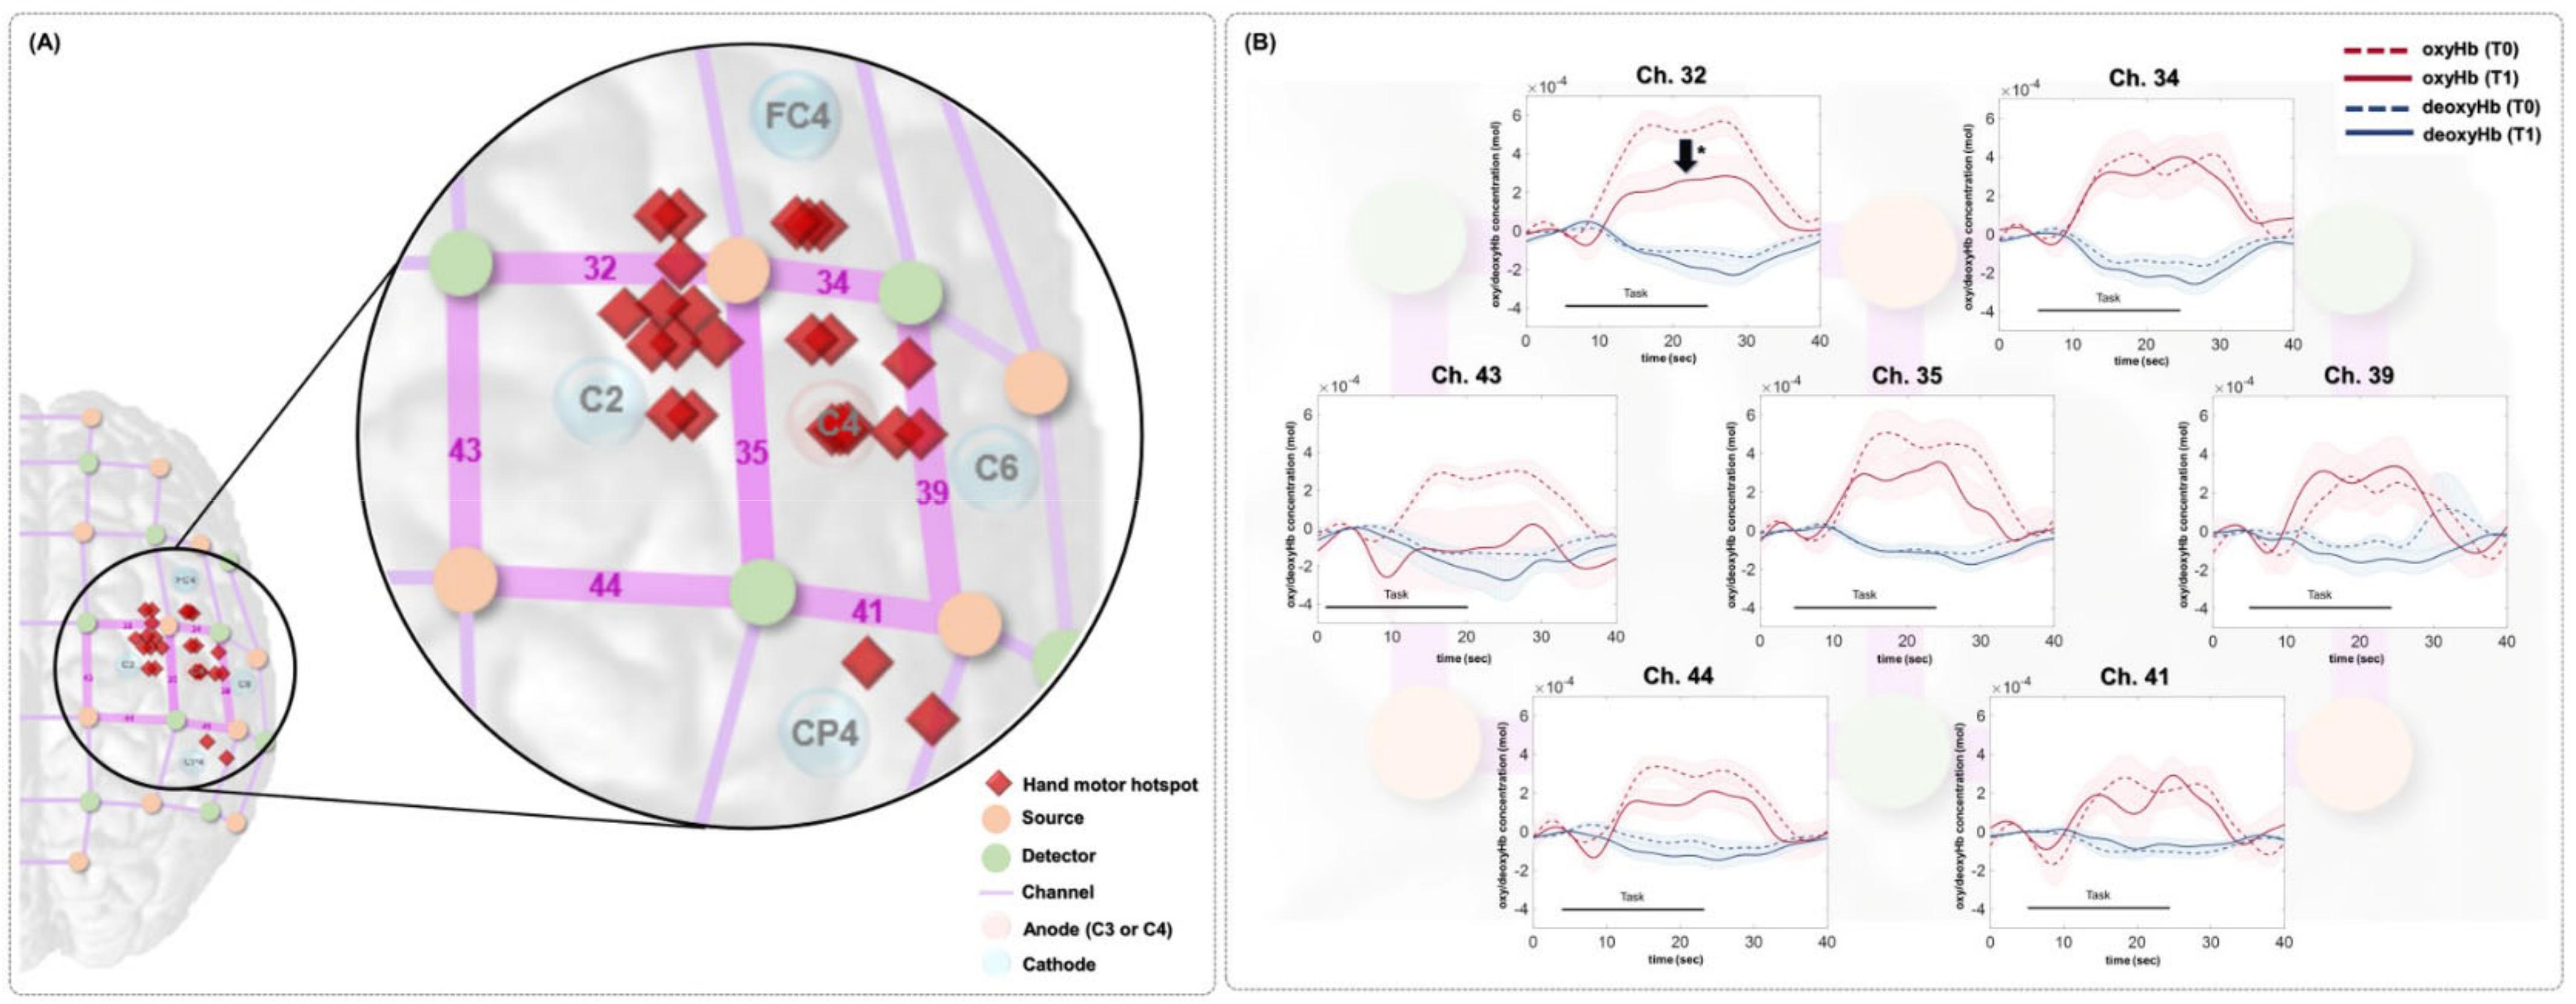
3.1. Cortical Hemodynamic Changes during Finger Tapping Task
3.2. Changes in Behavioral Test Results and Corticospinal Excitability Measurement
4. Discussion
5. Conclusions
Author Contributions
Funding
Institutional Review Board Statement
Informed Consent Statement
Data Availability Statement
Acknowledgments
Conflicts of Interest
References
- Llorens, R.; Fuentes, M.A.; Borrego, A.; Latorre, J.; Alcañiz, M.; Colomer, C.; Noé, E. Effectiveness of a combined transcranial direct current stimulation and virtual reality-based intervention on upper limb function in chronic individuals post-stroke with persistent severe hemiparesis: A randomized controlled trial. J. NeuroEng. Rehabil. 2021, 18, 1–13. [Google Scholar]
- Simpson, L.A.; Eng, J.J. Functional recovery following stroke: Capturing changes in upper-extremity function. Neuroreha-bilit. Neural Repair 2013, 27, 240–250. [Google Scholar] [PubMed]
- Gillen, G.; Nilsen, D.M. Upper extremity function and management. In Stroke Rehabilitation E-Book: A Function-Based Approach; Elsevier: Mosby, NY, USA, 2020. [Google Scholar]
- Langhorne, P.; Coupar, F.; Pollock, A. Motor recovery after stroke: A systematic review. Lancet Neurol. 2009, 8, 741–754. [Google Scholar] [CrossRef] [PubMed]
- Park, J.; Lee, N.; Cho, M.; Kim, D.; Yang, Y. Effects of mental practice on stroke patients’ upper extremity function and daily activity performance. J. Phys. Ther. Sci. 2015, 27, 1075–1077. [Google Scholar] [CrossRef] [Green Version]
- Treger, I.; Shames, J.; Giaquinto, S.; Ring, H. Return to work in stroke patients. Disabil. Rehabil. 2007, 29, 1397–1403. [Google Scholar] [CrossRef]
- Fukuda, S.; Ueba, Y.; Fukuda, H.; Kangawa, T.; Nakashima, Y.; Hashimoto, Y.; Ueba, T. Impact of Upper Limb Function and Employment Status on Return to Work of Blue-Collar Workers after Stroke. J. Stroke Cerebrovasc. Dis. 2019, 28, 2187–2192. [Google Scholar] [CrossRef]
- Sveen, U.; Bautz-Holter, E.; Sodring, K.M.; Wyller, T.B.; Laake, K.; Sveen, E.B.-H.U. Association between impairments, self-care ability and social activities 1 year after stroke. Disabil. Rehabil. 1999, 21, 372–377. [Google Scholar] [CrossRef]
- Franceschini, M.; La Porta, F.; Agosti, M.; Massucci, M. Is health-related-quality of life of stroke patients influenced by neurological impairments at one year after stroke? Eur. J. Phys. Rehabil. Med. 2010, 46, 389–399. [Google Scholar]
- Nichols-Larsen, D.S.; Clark, P.; Zeringue, A.; Greenspan, A.; Blanton, S. Factors Influencing Stroke Survivors’ Quality of Life During Subacute Recovery. Stroke 2005, 36, 1480–1484. [Google Scholar] [CrossRef]
- Ward, N.S.; Brown, M.M.; Thompson, A.J.; Frackowiak, R.S.J. Neural correlates of motor recovery after stroke: A longitudinal fMRI study. Brain 2003, 126, 2476–2496. [Google Scholar]
- Dissanayaka, T.; Zoghi, M.; Farrell, M.; Egan, G.F.; Jaberzadeh, S. Does transcranial electrical stimulation enhance corticospinal excitability of the motor cortex in healthy individuals? A systematic review and meta-analysis. Eur. J. Neurosci. 2017, 46, 1968–1990. [Google Scholar]
- Alisar, D.C.; Ozen, S.; Sozay, S. Effects of Bihemispheric Transcranial Direct Current Stimulation on Upper Extremity Function in Stroke Patients: A randomized Double-Blind Sham-Controlled Study. J. Stroke Cerebrovasc. Dis. 2019, 29, 104454. [Google Scholar] [CrossRef]
- Wang, H.; Yu, H.; Liu, M.; Xu, G.; Guo, L.; Wang, C.; Sun, C. Effects of tDCS on Brain Functional Network of Patients after Stroke. IEEE Access 2020, 8, 205625–205634. [Google Scholar] [CrossRef]
- Bornheim, S.; Thibaut, A.; Beaudart, C.; Maquet, P.; Croisier, J.-L.; Kaux, J.-F. Evaluating the effects of tDCS in stroke patients using functional outcomes: A systematic review. Disabil. Rehabil. 2020, 44, 13–23. [Google Scholar] [CrossRef]
- Philip, N.S.; Nelson, B.G.; Frohlich, F.; Lim, K.; Widge, A.S.; Carpenter, L.L. Low-Intensity Transcranial Current Stimulation in Psychiatry. Am. J. Psychiatry 2017, 174, 628–639. [Google Scholar] [CrossRef] [Green Version]
- Ryan, K.N. Investigating the Cortical, Metabolic and Behavioral Effects of Transcranial Direct Current Stimulation in Preparation for Combined Rehabilitation. Ph.D. Thesis, The University of Western Ontario, London, ON, Canada, 2018. [Google Scholar]
- Jacobson, L.; Koslowsky, M.; Lavidor, M. tDCS polarity effects in motor and cognitive domains: A meta-analytical review. Exp. Brain Res. 2011, 216, 1–10. [Google Scholar] [CrossRef]
- Solomons, C.D.; Shanmugasundaram, V. Transcranial direct current stimulation: A review of electrode characteristics and materials. Med Eng. Phys. 2020, 85, 63–74. [Google Scholar] [CrossRef]
- Khorrampanah, M.; Seyedarabi, H.; Daneshvar, S.; Farhoudi, M. Optimization of montages and electric currents in tDCS. Comput. Biol. Med. 2020, 125, 103998. [Google Scholar] [CrossRef]
- Caulfield, K.A.; George, M.S. Optimizing transcranial direct current stimulation (tDCS) electrode position, size, and distance doubles the on-target cortical electric field: Evidence from 3000 Human Connectome Project models. bioRxiv 2021. [Google Scholar] [CrossRef]
- Villamar, M.F.; Volz, M.S.; Bikson, M.; Datta, A.; DaSilva, A.F.; Fregni, F. Technique and considerations in the use of 4 × 1 ring high-definition transcranial direct current stimulation (HD-tDCS). J. Vis. Exp. JoVE 2013, 77, e50309. [Google Scholar]
- Cole, L.; Dukelow, S.P.; Giuffre, A.; Nettel-Aguirre, A.; Metzler, M.J.; Kirton, A. Sensorimotor robotic measures of tDCS-and HD-tDCS-enhanced motor learning in children. Neural Plast. 2018, 2018, 5317405. [Google Scholar]
- Hogeveen, J.; Grafman, J.; Aboseria, M.; David, A.; Bikson, M.; Hauner, K. Effects of High-Definition and Conventional tDCS on Response Inhibition. Brain Stimul. 2016, 9, 720–729. [Google Scholar] [CrossRef] [PubMed] [Green Version]
- Jacquemin, L.; Shekhawat, G.S.; Van De Heyning, P.; Mertens, G.; Fransen, E.; Van Rompaey, V.; Topsakal, V.; Moyaert, J.; Beyers, J.; Gilles, A. Effects of Electrical Stimulation in Tinnitus Patients: Conventional Versus High-Definition tDCS. Neurorehabil. Neural Repair 2018, 32, 714–723. [Google Scholar] [CrossRef]
- Breitling, C.; Zaehle, T.; Dannhauer, M.; Tegelbeckers, J.; Flechtner, H.-H.; Krauel, K. Comparison between conventional and HD-tDCS of the right inferior frontal gyrus in children and adolescents with ADHD. Clin. Neurophysiol. 2020, 131, 1146–1154. [Google Scholar]
- Masina, F.; Arcara, G.; Galletti, E.; Cinque, I.; Gamberini, L.; Mapelli, D. Neurophysiological and behavioural effects of conventional and high definition tDCS. Sci. Rep. 2021, 11, 7659. [Google Scholar] [CrossRef]
- Lefebvre, S.; Jann, K.; Schmiesing, A.; Ito, K.; Jog, M.; Schweighofer, N.; Wang, D.J.J.; Liew, S.-L. Differences in high-definition transcranial direct current stimulation over the motor hotspot versus the premotor cortex on motor network excitability. Sci. Rep. 2019, 9, 17605. [Google Scholar] [CrossRef] [Green Version]
- Parlikar, R.; Sreeraj, V.S.; Shivakumar, V.; Narayanaswamy, J.C.; Rao, N.P.; Venkatasubramanian, G. High definition transcranial direct current stimulation (HD-tDCS): A systematic review on treatment of neuropsychiatric disorders. Asian J. Psychiatry 2021, 56, 102542. [Google Scholar]
- Borckardt, J.J.; Bikson, M.; Frohman, H.; Reeves, S.T.; Datta, A.; Bansal, V.; Madan, A.; Barth, K.; George, M.S. A pilot study of the tolerability and effects of high-definition transcranial direct current stimulation (HD-tDCS) on pain perception. J. Pain 2012, 13, 112–120. [Google Scholar]
- Hampstead, B.M.; Mascaro, N.; Schlaefflin, S.; Bhaumik, A.; Laing, J.; Peltier, S.; Martis, B. Variable symptomatic and neurophysiologic response to HD-tDCS in a case series with posttraumatic stress disorder. Int. J. Psychophysiol. 2020, 154, 93–100. [Google Scholar] [PubMed]
- Datta, A.; Bansal, V.; Diaz, J.; Patel, J.; Reato, D.; Bikson, M. Gyri-precise head model of transcranial direct current stimulation: Improved spatial focality using a ring electrode versus conventional rectangular pad. Brain Stimul. 2009, 2, 201–207.e1. [Google Scholar] [PubMed] [Green Version]
- Kuo, H.-I.; Bikson, M.; Datta, A.; Minhas, P.; Paulus, W.; Kuo, M.-F.; Nitsche, M.A. Comparing Cortical Plasticity Induced by Conventional and High-Definition 4 × 1 Ring tDCS: A Neurophysiological Study. Brain Stimul. 2013, 6, 644–648. [Google Scholar] [CrossRef]
- Iannone, A.; Santiago, I.; Ajao, S.T.; Brasil-Neto, J.; Rothwell, J.C.; Spampinato, D.A. Comparing the effects of focal and conventional tDCS on motor skill learning: A proof of principle study. Neurosci. Res. 2022, in press. [Google Scholar] [CrossRef]
- Nikolin, S.; Loo, C.K.; Bai, S.; Dokos, S.; Martin, D.M. Focalised stimulation using high definition transcranial direct current stimulation (HD-tDCS) to investigate declarative verbal learning and memory functioning. Neuroimage 2015, 117, 11–19. [Google Scholar]
- Richardson, J.; Datta, A.; Dmochowski, J.; Parra, L.C.; Fridriksson, J. Feasibility of using high-definition transcranial direct current stimulation (HD-tDCS) to enhance treatment outcomes in persons with aphasia. NeuroRehabilitation 2015, 36, 115–126. [Google Scholar]
- Jacquemin, L.; Mertens, G.; Shekhawat, G.S.; Van de Heyning, P.; Vanderveken, O.M.; Topsakal, V.; De Hertogh, W.; Michiels, S.; Beyers, J.; Moyaert, J.; et al. High Definition transcranial Direct Current Stimulation (HD-tDCS) for chronic tinnitus: Outcomes from a prospective longitudinal large cohort study. Prog. Brain Res. 2021, 263, 137–152. [Google Scholar]
- Sehatpour, P.; Dondé, C.; Adair, D.; Kreither, J.; Lopez-Calderon, J.; Avissar, M.; Bikson, M.; Javitt, D.C. Comparison of cortical network effects of high-definition and conventional tDCS during visuomotor processing. Brain Stimul. Basic Transl. Clin. Res. Neuromodul. 2021, 14, 33–35. [Google Scholar]
- Esmaeilpour, Z.; Shereen, A.D.; Ghobadi-Azbari, P.; Datta, A.; Woods, A.J.; Ironside, M.; O’Shea, J.; Kirk, U.; Bikson, M.; Ekhtiari, H. Methodology for tDCS integration with fMRI. Hum. Brain Mapp. 2019, 41, 1950–1967. [Google Scholar] [CrossRef] [Green Version]
- Ferrari, M.; Quaresima, V. A brief review on the history of human functional near-infrared spectroscopy (fNIRS) development and fields of application. Neuroimage 2012, 63, 921–935. [Google Scholar]
- Leff, D.; Orihuela-Espina, F.; Elwell, C.; Athanasiou, T.; Delpy, D.T.; Darzi, A.W.; Yang, G.-Z. Assessment of the cerebral cortex during motor task behaviours in adults: A systematic review of functional near infrared spectroscopy (fNIRS) studies. NeuroImage 2011, 54, 2922–2936. [Google Scholar] [CrossRef]
- Agrò, D.; Canicattì, R.; Pinto, M.; Morsellino, G.; Tomasino, A.; Adamo, G.; Curcio, L.; Parisi, A.; Stivala, S.; Galioto, N.; et al. Design and Implementation of a Portable fNIRS Embedded System. In Applications in Electronics Pervading Industry, Environment and Society; Springer: Cham, Switzerland, 2015; pp. 43–50. [Google Scholar] [CrossRef]
- Lee, S.-H.; Lee, H.-J.; Shim, Y.; Chang, W.H.; Choi, B.-O.; Ryu, G.-H.; Kim, Y.-H. Wearable hip-assist robot modulates cortical activation during gait in stroke patients: A functional near-infrared spectroscopy study. J. Neuroeng. Rehabil. 2020, 17, 1–8. [Google Scholar] [CrossRef]
- Huo, C.; Xu, G.; Li, W.; Xie, H.; Zhang, T.; Liu, Y.; Li, Z. A review on functional near-infrared spectroscopy and application in stroke rehabilitation. Med. Nov. Technol. Devices 2021, 11, 100064. [Google Scholar] [CrossRef]
- Delorme, M.; Vergotte, G.; Perrey, S.; Froger, J.; Laffont, I. Time course of sensorimotor cortex reorganization during upper extremity task accompanying motor recovery early after stroke: An fNIRS study. Restor. Neurol. Neurosci. 2019, 37, 207–218. [Google Scholar] [CrossRef] [PubMed]
- Trofimov, A.O.; Agarkova, D.I.; Kopylov, A.A.; Dubrovin, A.; Trofimova, K.A.; Sheludyakov, A.; Martynov, D.; Cheremuhin, P.N.; Bragin, D.E. NIRS-Based Assessment of Cerebral Oxygenation During High-Definition Anodal Transcranial Direct Current Stimulation in Patients with Posttraumatic Encephalopathy. In GeNeDis; Springer: Cham, Switzerland, 2021; pp. 27–31. [Google Scholar] [CrossRef]
- Besson, P.; Muthalib, M.; Dray, G.; Rothwell, J.; Perrey, S. Concurrent anodal transcranial direct-current stimulation and motor task to influence sensorimotor cortex activation. Brain Res. 2019, 1710, 181–187. [Google Scholar] [CrossRef] [PubMed] [Green Version]
- Yaqub, M.A.; Woo, S.-W.; Hong, K.-S. Effects of HD-tDCS on resting-state functional connectivity in the prefrontal cortex: An fNIRS study. Complexity 2018, 2018, 1613402. [Google Scholar]
- Muller, C.O.; Muthalib, M.; Mottet, D.; Perrey, S.; Dray, G.; Delorme, M.; Duflos, C.; Froger, J.; Xu, B.; Faity, G.; et al. Recovering arm function in chronic stroke patients using combined anodal HD-tDCS and virtual reality therapy (ReArm): A study protocol for a randomized controlled trial. Trials 2021, 22, 747. [Google Scholar]
- Russo, C.; Carneiro, M.I.S.; Bolognini, N.; Fregni, F. Safety Review of Transcranial Direct Current Stimulation in Stroke. Neuromodul. Technol. Neural Interface 2017, 20, 215–222. [Google Scholar] [CrossRef] [Green Version]
- Tak, S.; Jang, K.E.; Jung, J.; Jang, J.; Jeong, Y.; Ye, J.C. NIRS-SPM: Statistical parametric mapping for near infrared spec-troscopy. In Multimodal Biomedical Imaging III, Proceedings of the SPIE BIOS, San Jose, CA, USA, 19–24 January 2008; International Society for Optics and Photonics: Bellingham, WA, USA, 2008. [Google Scholar]
- Ye, J.C.; Tak, S.; Jang, K.E.; Jung, J.; Jang, J. NIRS-SPM: Statistical parametric mapping for near-infrared spectroscopy. NeuroImage 2009, 44, 428–447. [Google Scholar] [CrossRef]
- Benjamini, Y.; Hochberg, Y. Controlling the False Discovery Rate: A Practical and Powerful Approach to Multiple Testing. J. R. Stat. Soc. Ser. B Methodol. 1995, 57, 289–300. [Google Scholar]
- Zhang, F.; Cheong, D.; Khan, A.F.; Chen, Y.; Ding, L.; Yuan, H. Correcting Physiological Noise in Whole-Head Functional Near-Infrared Spectroscopy. J. Neurosci. Methods 2021, 360, 109262. [Google Scholar] [CrossRef]
- Dans, P.; Foglia, S.; Nelson, A. Data Processing in Functional Near-Infrared Spectroscopy (fNIRS) Motor Control Research. Brain Sci. 2021, 11, 606. [Google Scholar] [CrossRef]
- Sassaroli, A.; Fantini, S. Comment on the modified Beer–Lambert law for scattering media. Phys. Med. Biol. 2004, 49, N255–N257. [Google Scholar] [CrossRef] [Green Version]
- Rich, T.L.; Menk, J.S.; Rudser, K.D.; Chen, M.; Meekins, G.D.; Peña, E.; Feyma, T.; Bawroski, K.; Bush, C.; Gillick, B.T. Deter-mining electrode placement for transcranial direct current stimulation: A comparison of EEG-versus TMS-guided methods. Clin. EEG Neurosci. 2017, 48, 367–375. [Google Scholar]
- Julkunen, P.; Säisänen, L.; Danner, N.; Niskanen, E.; Hukkanen, T.; Mervaala, E.; Könönen, M. Comparison of navigated and non-navigated transcranial magnetic stimulation for motor cortex mapping, motor threshold and motor evoked potentials. NeuroImage 2009, 44, 790–795. [Google Scholar] [CrossRef]
- Kim, Y.; Chang, W.; Bang, O.; Kim, S.; Park, Y.; Lee, P. Long-term effects of rTMS on motor recovery in patients after subacute stroke. J. Rehabil. Med. 2010, 42, 758–764. [Google Scholar] [CrossRef] [Green Version]
- Gladstone, D.; Danells, C.J.; Black, S. The Fugl-Meyer Assessment of Motor Recovery after Stroke: A Critical Review of Its Measurement Properties. Neurorehabil. Neural Repair 2002, 16, 232–240. [Google Scholar] [CrossRef]
- Fugl-Meyer, A.R.; Jääskö, L.; Leyman, I.; Olsson, S.; Steglind, S. The post-stroke hemiplegic patient. 1. A method for evaluation of physical performance. Scand. J. Rehabil. Med. 1975, 7, 13–31. [Google Scholar]
- Mathiowetz, V.; Volland, G.; Kashman, N.; Weber, K. Adult Norms for the Box and Block Test of Manual Dexterity. Am. J. Occup. Ther. 1985, 39, 386–391. [Google Scholar] [CrossRef] [Green Version]
- Cohen, J. Statistical Power Analysis for the Behavioral Sciences, 2nd ed.; Lawrence Erlbaum: Hillsdale, NJ, USA, 1988. [Google Scholar]
- Rehme, A.K.; Eickhoff, S.B.; Rottschy, C.; Fink, G.R.; Grefkes, C. Activation likelihood estimation meta-analysis of motor-related neural activity after stroke. Neuroimage 2012, 59, 2771–2782. [Google Scholar]
- Boddington, L.; Reynolds, J. Targeting interhemispheric inhibition with neuromodulation to enhance stroke rehabilitation. Brain Stimul. 2017, 10, 214–222. [Google Scholar] [CrossRef]
- Sehm, B.; Kipping, J.A.; Schaefer, A.; Villringer, A.; Ragert, P. A Comparison between Uni- and Bilateral tDCS Effects on Functional Connectivity of the Human Motor Cortex. Front. Hum. Neurosci. 2013, 7, 183. [Google Scholar] [CrossRef] [Green Version]
- Di Lazzaro, V.; Dileone, M.; Capone, F.; Pellegrino, G.; Ranieri, F.; Musumeci, G.; Florio, L.; Di Pino, G.; Fregni, F. Immediate and Late Modulation of Interhemipheric Imbalance with Bilateral Transcranial Direct Current Stimulation in Acute Stroke. Brain Stimul. 2014, 7, 841–848. [Google Scholar] [CrossRef]
- Cabibel, V.; Muthalib, M.; Teo, W.-P.; Perrey, S.; Muthalib, M. High-definition transcranial direct-current stimulation of the right M1 further facilitates left M1 excitability during crossed facilitation. J. Neurophysiol. 2018, 119, 1266–1272. [Google Scholar] [CrossRef]
- Beaulé, V.; Tremblay, S.; Théoret, H. Interhemispheric Control of Unilateral Movement. Neural Plast. 2012, 2012, 1–11. [Google Scholar] [CrossRef]
- Zhang, D.; Zhou, Y.; Yuan, J. Speech Prosodies of Different Emotional Categories Activate Different Brain Regions in Adult Cortex: An fNIRS Study. Sci. Rep. 2018, 8, 218. [Google Scholar] [CrossRef] [Green Version]
- Wittenberg, G.; Chen, R.; Ishii, K.; Bushara, K.O.; Taub, E.; Gerber, L.; Hallett, M.; Cohen, L.G. Constraint-Induced Therapy in Stroke: Magnetic-Stimulation Motor Maps and Cerebral Activation. Neurorehabil. Neural Repair 2003, 17, 48–57. [Google Scholar] [CrossRef]
- Bergfeldt, U.; Jonsson, T.; Bergfeldt, L.; Julin, P. Cortical activation changes and improved motor function in stroke patients after focal spasticity therapy—An interventional study applying repeated fMRI. BMC Neurol. 2015, 15, 52. [Google Scholar] [CrossRef] [Green Version]
- Tomášová, Z.; Hluštík, P.; Král, M.; Otruba, P.; Herzig, R.; Krobot, A.; Kaňovský, P. Cortical Activation Changes in Patients Suffering from Post-Stroke Arm Spasticity and Treated with Botulinum Toxin A. J. Neuroimaging 2011, 23, 337–344. [Google Scholar] [CrossRef]
- Sakurada, T.; Hirai, M.; Watanabe, E. Individual optimal attentional strategy during implicit motor learning boosts fron-toparietal neural processing efficiency: A functional near-infrared spectroscopy study. Brain Behav. 2019, 9, e01183. [Google Scholar] [PubMed]
- Kim, H.; Kim, J.; Lee, H.-J.; Lee, J.; Na, Y.; Chang, W.H.; Kim, Y.-H. Optimal stimulation site for rTMS to improve motor function: Anatomical hand knob vs. hand motor hotspot. Neurosci. Lett. 2020, 740, 135424. [Google Scholar] [CrossRef] [PubMed]
- Inuggi, A.; Filippi, M.; Chieffo, R.; Agosta, F.; Rocca, M.A.; González-Rosa, J.J.; Cursi, M.; Comi, G.; Leocani, L. Motor area localization using fMRI-constrained cortical current density reconstruction of movement-related cortical potentials, a comparison with fMRI and TMS mapping. Brain Res. 2010, 1308, 68–78. [Google Scholar] [CrossRef] [PubMed]
- Choi, G.-Y.; Kim, W.-S.; Hwang, H.-J. Electroencephalography-Based a Motor Hotspot Identification Approach Using Deep-Learning. In Proceedings of the 2021 9th International Winter Conference on Brain-Computer Interface (BCI), Gangwon, Korea, 22–24 February 2021. [Google Scholar]
- Classen, J.; Knorr, U.; Werhahn, K.J.; Schlaug, G.; Kunesch, E.; Cohen, L.G.; Seitz, R.J.; Benecke, R. Multimodal output map-ping of human central motor representation on different spatial scales. J. Physiol. 1998, 512, 163–179. [Google Scholar]
- Lotze, M.; Kaethner, R.; Erb, M.; Cohen, L.; Grodd, W.; Topka, H. Comparison of representational maps using functional magnetic resonance imaging and transcranial magnetic stimulation. Clin. Neurophysiol. 2003, 114, 306–312. [Google Scholar] [CrossRef]
- Mikkonen, M.; Laakso, I.; Tanaka, S.; Hirata, A. Cost of focality in TDCS: Interindividual variability in electric fields. Brain Stimul. 2020, 13, 117–124. [Google Scholar] [CrossRef] [Green Version]
- Balslev, D.; Braet, W.; McAllister, C.; Miall, R.C. Inter-individual variability in optimal current direction for transcranial magnetic stimulation of the motor cortex. J. Neurosci. Methods 2007, 162, 309–313. [Google Scholar] [CrossRef] [Green Version]
- Chew, T.; Ho, K.-A.; Loo, C.K. Inter- and Intra-individual Variability in Response to Transcranial Direct Current Stimulation (tDCS) at Varying Current Intensities. Brain Stimul. 2015, 8, 1130–1137. [Google Scholar] [CrossRef]
- Guerra, A.; Petrichella, S.; Vollero, L.; Ponzo, D.; Pasqualetti, P.; Määttä, S.; Mervaala, E.; Könönen, M.; Bressi, F.; Iannello, G. Neurophysiological features of motor cortex excitability and plasticity in Subcortical Ischemic Vascular Dementia: A TMS mapping study. Clin. Neurophysiol. 2015, 126, 906–913. [Google Scholar]


| Characteristics | Value |
|---|---|
| Age, years (mean ± SD) | 59.4 ± 12.8 |
| Sex (Male:Female) | 20:6 |
| Stroke type (Infarction:Hemorrhage) | 13:13 |
| Lesion side (Left:Right) | 12:14 |
| Duration, months (mean ± SD) | 40.1 ± 29.4 |
| Initial FMA upper extremity score (mean ± SD) | 47.6 ± 10.2 |
| Mean Value (Units: mol × 10−3) | Integral Value (Units: mol × 10−3) | |||||||
|---|---|---|---|---|---|---|---|---|
| T0 | T1 | p-Value | Effect Size | T0 | T1 | p-Value | Effect Size | |
| oxyHb | ||||||||
| Ch. 32 | 0.324 (0.134) | 0.157 (0.674) | 0.033 * | −0.321 | 67.07 (63.91) | 32.46 (69.37) | 0.033 * | −0.321 |
| Ch. 34 | 0.275 (0.300) | 0.265 (0.295) | 0.570 | −0.086 | 57.13 (62.12) | 54.97 (61.13) | 0.570 | −0.086 |
| Ch. 35 | 0.306 (0.367) | 0.244 (0.412) | 0.445 | −0.115 | 63.45 (76.09) | 50.58 (85.39) | 0.445 | −0.115 |
| Ch. 39 | 0.183 (0.280) | 0.020 (0.351) | 0.733 | −0.051 | 38.01 (58.06) | 41.63 (72.84) | 0.733 | −0.051 |
| Ch. 41 | 0.130 (0.386) | 0.154 (0.476) | 0.592 | −0.081 | 27.00 (80.09) | 32.05 (98.65) | 0.592 | −0.081 |
| Ch. 43 | 0.137 (0.169) | 0.027 (0.384) | 0.088 | −0.257 | 28.53 (35.02) | 55.46 (79.42) | 0.088 | −0.257 |
| Ch. 44 | 0.181 (0.195) | 0.093 (0.216) | 0.062 | −0.281 | 37.52 (40.40) | 19.16 (44.68) | 0.062 | −0.281 |
| deoxyHb | ||||||||
| Ch. 32 | −0.429 (−0.927) | −0.509 (−1.420) | 0.858 | −0.027 | −8.889 (−19.206) | −10.533 (−29.428) | 0.858 | −0.027 |
| Ch. 34 | −0.609 (−1.146) | −0.893 (−1.789) | 0.115 | −0.237 | −12.589 (−23.740) | −18.495 (−37.060) | 0.115 | −0.237 |
| Ch. 35 | −0.732 (−1.306) | −0.532 (−1.244) | 0.910 | −0.017 | −15.175 (−27.041) | −11.011 (−25.757) | 0.910 | −0.017 |
| Ch. 39 | −0.352 (−0.703) | −0.505 (−0.748) | 0.189 | −0.198 | −7.289 (−14.552) | −10.450 (−15.496) | 0.189 | −0.198 |
| Ch. 41 | −0.292 (−1.021) | −0.226 (−0.574) | 0.291 | −0.159 | −6.056 (−21.140) | −4.668 (−11.889) | 0.291 | −0.159 |
| Ch. 43 | −0.475 (−1.016) | −0.754 (−1.201) | 0.465 | −0.110 | −9.858 (−21.050) | −15.610 (−24.840) | 0.465 | −0.110 |
| Ch. 44 | −0.280 (−0.797) | −0.652 (−1.074) | 0.149 | −0.218 | −5.792 (−16.481) | −13.558 (−22.251) | 0.149 | −0.218 |
| T0 | T1 | p-Value | Effect Size | |
|---|---|---|---|---|
| FMA upper extremity (score) | 47.6 (10.2) | 50.6 (10.3) | <0.001 * | 1.308 |
| FMA total (score) | 69.3 (14.1) | 73.7 (14.4) | <0.001 * | 1.009 |
| BBT (ea) | 30.0 (16.8) | 32.6 (17.4) | 0.001 * | 0.648 |
| FTT accuracy (%) | 33.6 (22.3) | 45.7 (27.0) | 0.001 * | 0.777 |
| FTT response time (ms) | 589.1 (106.4) | 575.3 (101.8) | 0.062 | −0.117 |
| rMT of affected hemisphere (%) | 51.6 (11.6) | 50.83 (9.7) | 0.259 | −0.231 |
| MEP amplitude of affected hemisphere (μV) | 430.1 (313.8) | 434.8 (363.7) | 0.665 | 0.088 |
| rMT of unaffected hemisphere (%) | 48.6 (9.6) | 46.8 (9.3) | 0.102 | −0.332 |
| MEP amplitude of unaffected hemisphere (μV) | 612.9 (306.4) | 734.3 (378.0) | 0.120 | 0.316 |
Publisher’s Note: MDPI stays neutral with regard to jurisdictional claims in published maps and institutional affiliations. |
© 2022 by the authors. Licensee MDPI, Basel, Switzerland. This article is an open access article distributed under the terms and conditions of the Creative Commons Attribution (CC BY) license (https://creativecommons.org/licenses/by/4.0/).
Share and Cite
Kim, H.; Kim, J.; Lee, G.; Lee, J.; Kim, Y.-H. Task-Related Hemodynamic Changes Induced by High-Definition Transcranial Direct Current Stimulation in Chronic Stroke Patients: An Uncontrolled Pilot fNIRS Study. Brain Sci. 2022, 12, 453. https://doi.org/10.3390/brainsci12040453
Kim H, Kim J, Lee G, Lee J, Kim Y-H. Task-Related Hemodynamic Changes Induced by High-Definition Transcranial Direct Current Stimulation in Chronic Stroke Patients: An Uncontrolled Pilot fNIRS Study. Brain Sciences. 2022; 12(4):453. https://doi.org/10.3390/brainsci12040453
Chicago/Turabian StyleKim, Heegoo, Jinuk Kim, Gihyoun Lee, Jungsoo Lee, and Yun-Hee Kim. 2022. "Task-Related Hemodynamic Changes Induced by High-Definition Transcranial Direct Current Stimulation in Chronic Stroke Patients: An Uncontrolled Pilot fNIRS Study" Brain Sciences 12, no. 4: 453. https://doi.org/10.3390/brainsci12040453
APA StyleKim, H., Kim, J., Lee, G., Lee, J., & Kim, Y.-H. (2022). Task-Related Hemodynamic Changes Induced by High-Definition Transcranial Direct Current Stimulation in Chronic Stroke Patients: An Uncontrolled Pilot fNIRS Study. Brain Sciences, 12(4), 453. https://doi.org/10.3390/brainsci12040453