
Seeking Overlapping Neuroanatomical Alterations between Dyslexia and Attention-Deficit/Hyperactivity Disorder: A Meta-Analytic Replication Study

 ,
,  ,
,  and
and
Abstract
1. Introduction
2. Materials and Methods
2.1. Dataset Construction
2.2. Coordinate-Based Meta-Analysis via PSI-SDM
2.3. Impact of Socio-Demographic and Clinical Variables
2.4. Brain Volume Sub-Analysis
2.5. Additional Analysis: Impact of Null Experiments
3. Results
3.1. Gray Matter Variations in ADHD Groups
3.2. Gray Matter Variations in Dyslexia Groups
3.3. Common Gray Matter Variations in Dyslexia and ADHD Groups
3.4. Additional Results: Impact of Null Experiments
3.5. Impact of Socio-Demographic and Clinical Variables
3.6. Brain Volume Sub-Analysis
4. Discussion
Limitations and Future Directions
5. Conclusions
Supplementary Materials
Author Contributions
Funding
Institutional Review Board Statement
Informed Consent Statement
Data Availability Statement
Conflicts of Interest
References
- McGrath, L.M.; Stoodley, C.J. Are there shared neural correlates between dyslexia and ADHD? A meta-analysis of voxel-based morphometry studies. J. Neurodev. Disord. 2019, 11, 31. [Google Scholar] [CrossRef]
- Sánchez-Morán, M.; Hernández, J.A.; Duñabeitia, J.A.; Estévez, A.; Bárcena, L.; González-Lahera, A.; Bajo, M.T.; Fuentes, L.J.; Aransay, A.M.; Carreiras, M. Genetic association study of dyslexia and ADHD candidate genes in a Spanish cohort: Implications of comorbid samples. PLoS ONE 2018, 13, e0206431. [Google Scholar] [CrossRef]
- Carlsson, T.; Molander, F.; Taylor, M.J.; Jonsson, U.; Bölte, S. Early environmental risk factors for neurodevelopmental disorders—A systematic review of twin and sibling studies. Dev. Psychopathol. 2020, 33, 1448–1495. [Google Scholar] [CrossRef]
- Micai, M.; Fulceri, F.; Caruso, A.; Guzzetta, A.; Gila, L.; Scattoni, M.L. Early behavioral markers for neurodevelopmental disorders in the first 3 years of life: An overview of systematic reviews. Neurosci. Biobehav. Rev. 2020, 116, 183–201. [Google Scholar] [CrossRef] [PubMed]
- Parenti, I.; Rabaneda, L.G.; Schoen, H.; Novarino, G. Neurodevelopmental Disorders: From Genetics to Functional Pathways. Trends Neurosci. 2020, 43, 608–621. [Google Scholar] [CrossRef] [PubMed]
- Battaglia, S.; Cardellicchio, P.; Di Fazio, C.; Nazzi, C.; Fracasso, A.; Borgomaneri, S. The Influence of Vicarious Fear-Learning in “Infecting” Reactive Action Inhibition. Front. Behav. Neurosci. 2022, 16, 267. [Google Scholar] [CrossRef]
- Tanaka, M.; Spekker, E.; Szabó, Á.; Polyák, H.; Vécsei, L. Modelling the neurodevelopmental pathogenesis in neuropsychiatric disorders. Bioactive kynurenines and their analogues as neuroprotective agents-in celebration of 80th birthday of Professor Peter Riederer. J. Neural. Transm. 2022, 129, 627–642. [Google Scholar] [CrossRef] [PubMed]
- Tanaka, M.; Tóth, F.; Polyák, H.; Szabó, Á.; Mándi, Y.; Vécsei, L. Immune Influencers in Action: Metabolites and Enzymes of the Tryptophan-Kynurenine Metabolic Pathway. Biomedicines 2021, 9, 734. [Google Scholar] [CrossRef]
- Salem, H.A.; Elsherbiny, N.; Alzahrani, S.; Alshareef, H.M.; Abd Elmageed, Z.Y.; Ajwah, S.M.; Hamdan, A.M.E.; Abdou, Y.S.; Galal, O.O.; El Azazy, M.K.A.; et al. Neuroprotective Effect of Morin Hydrate against Attention-Deficit/Hyperactivity Disorder (ADHD) Induced by MSG and/or Protein Malnutrition in Rat Pups: Effect on Oxidative/Monoamines/Inflammatory Balance and Apoptosis. Pharmaceuticals 2022, 15, 1012. [Google Scholar] [CrossRef]
- Bush, G.; Valera, E.M.; Seidman, L.J. Functional neuroimaging of attention-deficit/hyperactivity disorder: A review and suggested future directions. Biol. Psych. 2005, 57, 1273–1284. [Google Scholar] [CrossRef]
- Cubillo, A.; Halari, R.; Smith, A.; Taylor, E.; Rubia, K. A review of fronto-striatal and fronto-cortical brain abnormalities in children and adults with Attention Deficit Hyperactivity Disorder (ADHD) and new evidence for dysfunction in adults with ADHD during motivation and attention. Cortex 2012, 48, 194–215. [Google Scholar] [CrossRef] [PubMed]
- Sebastian, A.; Jung, P.; Krause-Utz, A.; Lieb, K.; Schmahl, C.; Tüscher, O. Frontal dysfunctions of impulse control—A systematic review in borderline personality disorder and attention-deficit/hyperactivity disorder. Front. Hum. Neurosci. 2014, 8, 698. [Google Scholar] [CrossRef] [PubMed]
- Rubia, K. Cognitive Neuroscience of Attention Deficit Hyperactivity Disorder (ADHD) and Its Clinical Translation. Front. Hum. Neurosci. 2018, 12, 100. [Google Scholar] [CrossRef] [PubMed]
- Damiani, S.; Tarchi, L.; Scalabrini, A.; Marini, S.; Provenzani, U.; Rocchetti, M.; Oliva, F.; Politi, P. Beneath the surface: Hyper-connectivity between caudate and salience regions in ADHD fMRI at rest. Eur. Child. Adolesc. Psychiatry 2021, 30, 619–631. [Google Scholar] [CrossRef] [PubMed]
- American Psychiatric Association. Diagnostic and Statistical Manual of Mental Disorders, Fth Edition (DSM-5), 5th ed.; American Psychiatric Publishing: Arlington, VA, USA, 2013. [Google Scholar]
- Maisog, J.M.; Einbinder, E.R.; Flowers, D.L.; Turkeltaub, P.E.; Eden, G.F. A meta-analysis of functional neuroimaging studies of dyslexia. Ann. N. Y. Acad. Sci. 2008, 1145, 237–259. [Google Scholar] [CrossRef]
- Richlan, F.; Kronbichler, M.; Wimmer, H. Functional abnormalities in the dyslexic brain: A quantitative meta-analysis of neuroimaging studies. Hum. Brain Mapp. 2009, 30, 3299–3308. [Google Scholar] [CrossRef]
- Paulesu, E.; Danelli, L.; Berlingeri, M. Reading the dyslexic brain: Multiple dysfunctional routes revealed by a new meta-analysis of PET and fMRI activation studies. Front. Hum. Neurosci. 2014, 8, 830. [Google Scholar] [CrossRef]
- Elnakib, A.; Soliman, A.; Nitzken, M.; Casanova, M.F.; Gimel’farb, G.; El-Baz, A. Magnetic resonance imaging findings for dyslexia: A review. J. Biomed. Nanotechnol. 2014, 10, 2778–2805. [Google Scholar] [CrossRef]
- Eckert, M. Neuroanatomical markers for dyslexia: A review of dyslexia structural imaging studies. Neuroscientist 2004, 10, 362–371. [Google Scholar] [CrossRef]
- Kibby, M.Y.; Kroese, J.M.; Krebbs, H.; Hill, C.E.; Hynd, G.W. The pars triangularis in dyslexia and ADHD: A comprehensive approach. Brain Lang. 2009, 111, 46–54. [Google Scholar] [CrossRef]
- Goradia, D.D.; Vogel, S.; Mohl, B.; Khatib, D.; Zajac-Benitez, C.; Rajan, U.; Robin, A.; Rosenberg, D.R.; Stanley, J.A. Distinct differences in striatal dysmorphology between attention deficit hyperactivity disorder boys with and without a comorbid reading disability. Psychiatry Res. Neuroimag. 2016, 258, 30–36. [Google Scholar] [CrossRef] [PubMed][Green Version]
- Jagger-Rickels, A.C.; Kibby, M.Y.; Constance, J.M. Global gray matter morphometry differences between children with reading disability, ADHD, and comorbid reading disability/ADHD. Brain Lang 2018, 185, 54–66. [Google Scholar] [CrossRef]
- Langer, N.; Benjamin, C.; Becker, B.L.C.; Gaab, N. Comorbidity of reading disabilities and ADHD: Structural and functional brain characteristics. Hum. Brain Mapp. 2019, 40, 2677–2698. [Google Scholar] [CrossRef] [PubMed]
- Ashburner, J.; Friston, K.J. Voxel-based morphometry--the methods. NeuroImage 2000, 11, 805–821. [Google Scholar] [CrossRef] [PubMed]
- Caspers, J.; Zilles, K.; Beierle, C.; Rottschy, C.; Eickhoff, S.B. A novel meta-analytic approach: Mining frequent co-activation patterns in neuroimaging databases. NeuroImage 2014, 90, 390–402. [Google Scholar] [CrossRef] [PubMed]
- Salimi-Khorshidi, G.; Smith, S.M.; Keltner, J.R.; Wager, T.D.; Nichols, T.E. Meta-analysis of neuroimaging data: A comparison of image-based and coordinate-based pooling of studies. NeuroImage 2009, 45, 810–823. [Google Scholar] [CrossRef]
- Samartsidis, P.; Montagna, S.; Nichols, T.E.; Johnson, T.D. The coordinate-based meta-analysis of neuroimaging data. Stat. Sci. 2017, 32, 580–599. [Google Scholar] [CrossRef]
- Smith, S.M.; Beckmann, C.F.; Ramnani, N.; Woolrich, M.W.; Bannister, P.R.; Jenkinson, M.; Matthews, P.M.; McGonigle, D.J. Variability in fMRI: A re-examination of inter-session differences. Hum. Brain Mapp. 2005, 24, 248–257. [Google Scholar] [CrossRef]
- Manuello, J.; Costa, T.; Cauda, F.; Liloia, D. Six actions to improve detection of critical features for neuroimaging coordinate-based meta-analysis preparation. Neurosci. Biobehav. Rev. 2022, 104659. [Google Scholar] [CrossRef]
- Müller, V.I.; Cieslik, E.C.; Laird, A.R.; Fox, P.T.; Radua, J.; Mataix-Cols, D.; Tench, C.R.; Yarkoni, T.; Nichols, T.E.; Turkeltaub, P.E.; et al. Ten simple rules for neuroimaging meta-analysis. Neurosci. Biobehav. Rev. 2018, 84, 151–161. [Google Scholar] [CrossRef]
- Eickhoff, S.B.; Laird, A.R.; Grefkes, C.; Wang, L.E.; Zilles, K.; Fox, P.T. Coordinate-based activation likelihood estimation meta-analysis of neuroimaging data: A random-effects approach based on empirical estimates of spatial uncertainty. Hum. Brain Mapp. 2009, 30, 2907–2926. [Google Scholar] [CrossRef] [PubMed]
- Eickhoff, S.B.; Nichols, T.E.; Laird, A.R.; Hoffstaedter, F.; Amunts, K.; Fox, P.T.; Bzdok, D.; Eickhoff, C.R. Behavior, sensitivity, and power of activation likelihood estimation characterized by massive empirical simulation. Neuroimage 2016, 137, 70–85. [Google Scholar] [CrossRef] [PubMed]
- Turkeltaub, P.E.; Eden, G.F.; Jones, K.M.; Zeffiro, T.A. Meta-analysis of the functional neuroanatomy of single-word reading: Method and validation. Neuroimage 2002, 16, 765–780. [Google Scholar] [CrossRef] [PubMed]
- Nani, A.; Manuello, J.; Mancuso, L.; Liloia, D.; Costa, T.; Vercelli, A.; Duca, S.; Cauda, F. The pathoconnectivity network analysis of the insular cortex: A morphometric fingerprinting. NeuroImage 2021, 225, 117481. [Google Scholar] [CrossRef] [PubMed]
- Mancuso, L.; Fornito, A.; Costa, T.; Ficco, L.; Liloia, D.; Manuello, J.; Duca, S.; Cauda, F. A meta-analytic approach to mapping co-occurrent grey matter volume increases and decreases in psychiatric disorders. NeuroImage 2020, 222, 117220. [Google Scholar] [CrossRef]
- Eickhoff, S.B.; Bzdok, D.; Laird, A.R.; Roski, C.; Caspers, S.; Zilles, K.; Fox, P.T. Co-activation patterns distinguish cortical modules, their connectivity and functional differentiation. NeuroImage 2011, 57, 938–949. [Google Scholar] [CrossRef]
- Albajes-Eizagirre, A.; Solanes, A.; Vieta, E.; Radua, J. Voxel-based meta-analysis via permutation of subject images (PSI): Theory and implementation for SDM. NeuroImage 2019, 186, 174–184. [Google Scholar] [CrossRef]
- Stoodley, C.J. Distinct regions of the cerebellum show gray matter decreases in autism, ADHD, and developmental dyslexia. Front. Syst. Neurosci. 2014, 8, 92. [Google Scholar] [CrossRef]
- Samea, F.; Soluki, S.; Nejati, V.; Zarei, M.; Cortese, S.; Eickhoff, S.B.; Tahmasian, M.; Eickhoff, C.R. Brain alterations in children/adolescents with ADHD revisited: A neuroimaging meta-analysis of 96 structural and functional studies. Neurosci. Biobehav. Rev. 2019, 100, 1–8. [Google Scholar] [CrossRef]
- Radua, J.; Mataix-Cols, D.; Phillips, M.L.; El-Hage, W.; Kronhaus, D.M.; Cardoner, N.; Surguladze, S. A new meta-analytic method for neuroimaging studies that combines reported peak coordinates and statistical parametric maps. Eur. Psychiatry 2012, 27, 605–611. [Google Scholar] [CrossRef]
- Ahrendts, J.; Rüsch, N.; Wilke, M.; Philipsen, A.; Eickhoff, S.B.; Glauche, V.; Perlov, E.; Ebert, D.; Hennig, J.; Tebartz Van Elst, L. Visual Cortex Abnormalities in Adults with ADHD: A Structural MRI Study. World J. Biol. Psychiatry 2011, 12, 260–270. [Google Scholar] [CrossRef] [PubMed]
- Bonath, B.; Tegelbeckers, J.; Wilke, M.; Flechtner, H.H.; Krauel, K. Regional Gray Matter Volume Differences Between Adolescents With ADHD and Typically Developing Controls: Further Evidence for Anterior Cingulate Involvement. J. Atten. Disord. 2018, 22, 627–638. [Google Scholar] [CrossRef] [PubMed]
- Bralten, J.; Greven, C.U.; Franke, B.; Mennes, M.; Zwiers, M.P.; Rommelse, N.N.J.; Hartman, C.; van der Meer, D.; O’Dwyer, L.; Oosterlaan, J.; et al. Voxel-Based Morphometry Analysis Reveals Frontal Brain Differences in Participants with ADHD and Their Unaffected Siblings. J. Psychiatry Neurosci. 2016, 41, 272–279. [Google Scholar] [CrossRef] [PubMed]
- Brieber, S.; Neufang, S.; Bruning, N.; Kamp-Becker, I.; Remschmidt, H.; Herpertz-Dahlmann, B.; Fink, G.R.; Konrad, K. Structural Brain Abnormalities in Adolescents with Autism Spectrum Disorder and Patients with Attention Deficit/Hyperactivity Disorder. J. Child Psychol. Psychiatry Allied Discip. 2007, 48, 1251–1258. [Google Scholar] [CrossRef]
- Carmona, S.; Vilarroya, O.; Bielsa, A.; Trèmols, V.; Soliva, J.C.; Rovira, M.; Tomàs, J.; Raheb, C.; Gispert, J.D.; Batlle, S.; et al. Global and Regional Gray Matter Reductions in ADHD: A Voxel-Based Morphometric Study. Neurosci. Lett. 2005, 389, 88–93. [Google Scholar] [CrossRef]
- He, N.; Li, F.; Li, Y.; Guo, L.; Chen, L.; Huang, X.; Lui, S.; Gong, Q. Neuroanatomical Deficits Correlate with Executive Dysfunction in Boys with Attention Deficit Hyperactivity Disorder. Neurosci. Lett. 2015, 600, 45–49. [Google Scholar] [CrossRef]
- Iannaccone, R.; Hauser, T.U.; Ball, J.; Brandeis, D.; Walitza, S.; Brem, S. Classifying Adolescent Attention-Deficit/Hyperactivity Disorder (ADHD) Based on Functional and Structural Imaging. Eur. Child Adolesc. Psychiatry 2015, 24, 1279–1289. [Google Scholar] [CrossRef]
- Johnston, B.A.; Mwangi, B.; Matthews, K.; Coghill, D.; Konrad, K.; Steele, J.D. Brainstem Abnormalities in Attention Deficit Hyperactivity Disorder Support High Accuracy Individual Diagnostic Classification. Hum. Brain Mapp. 2014, 35, 5179–5189. [Google Scholar] [CrossRef]
- Kappel, V.; Lorenz, R.C.; Streifling, M.; Renneberg, B.; Lehmkuhl, U.; Ströhle, A.; Salbach-Andrae, H.; Beck, A. Effect of Brain Structure and Function on Reward Anticipation in Children and Adults with Attention Deficit Hyperactivity Disorder Combined Subtype. Soc. Cogn. Affect. Neurosci. 2015, 10, 945–951. [Google Scholar] [CrossRef]
- Sutcubasi Kaya, B.; Metin, B.; Tas, Z.C.; Buyukaslan, A.; Soysal, A.; Hatiloglu, D.; Tarhan, N. Gray Matter Increase in Motor Cortex in Pediatric ADHD: A Voxel-Based Morphometry Study. J. Atten. Disord. 2018, 22, 611–618. [Google Scholar] [CrossRef]
- Kobel, M.; Bechtel, N.; Specht, K.; Klarhöfer, M.; Weber, P.; Scheffler, K.; Opwis, K.; Penner, I.K. Structural and Functional Imaging Approaches in Attention Deficit/Hyperactivity Disorder: Does the Temporal Lobe Play a Key Role? Psychiatry Res. Neuroimag. 2010, 183, 230–236. [Google Scholar] [CrossRef] [PubMed]
- Kumar, U.; Arya, A.; Agarwal, V. Neural Alterations in ADHD Children as Indicated by Voxel-Based Cortical Thickness and Morphometry Analysis. Brain Dev. 2017, 39, 403–410. [Google Scholar] [CrossRef]
- Lim, L.; Marquand, A.; Cubillo, A.A.; Smith, A.B.; Chantiluke, K.; Simmons, A.; Mehta, M.; Rubia, K. Disorder-Specific Predictive Classification of Adolescents with Attention Deficit Hyperactivity Disorder (ADHD) Relative to Autism Using Structural Magnetic Resonance Imaging. PLoS ONE 2013, 8, e63660. [Google Scholar] [CrossRef] [PubMed]
- McAlonan, G.M.; Cheung, V.; Cheung, C.; Chua, S.E.; Murphy, D.G.M.; Suckling, J.; Tai, K.S.; Yip, L.K.C.; Leung, P.; Ho, T.P. Mapping Brain Structure in Attention Deficit-Hyperactivity Disorder: A Voxel-Based MRI Study of Regional Grey and White Matter Volume. Psychiatry Res. Neuroimag. 2007, 154, 171–180. [Google Scholar] [CrossRef]
- Montes, L.G.A.; Ricardo-Garcell, J.; de la Torre, L.B.; Alcántara, H.P.; García, R.B.M.; Fernández-Bouzas, A.; Acosta, D.Á. Clinical Correlations of Grey Matter Reductions in the Caudate Nucleus of Adults with Attention Deficit Hyperactivity Disorder. J. Psychiatry Neurosci. 2010, 35, 238–246. [Google Scholar] [CrossRef]
- Moreno-Alcázar, A.; Ramos-Quiroga, J.A.; Radua, J.; Salavert, J.; Palomar, G.; Bosch, R.; Salvador, R.; Blanch, J.; Casas, M.; McKenna, P.J.; et al. Brain Abnormalities in Adults with Attention Deficit Hyperactivity Disorder Revealed by Voxel-Based Morphometry. Psychiatry Res. Neuroimag. 2016, 254, 41–47. [Google Scholar] [CrossRef] [PubMed]
- Overmeyer, S.; Bullmore, E.T.; Suckling, J.; Simmons, A.; Williams, S.C.R.; Santosh, P.J.; Taylor, E. Distributed Grey and White Matter Deficits in Hyperkinetic Disorder: MRI Evidence for Anatomical Abnormality in an Attentional Network. Psychol. Med. 2001, 31, 1425–1435. [Google Scholar] [CrossRef]
- Roman-Urrestarazu, A.; Lindholm, P.; Moilanen, I.; Kiviniemi, V.; Miettunen, J.; Jääskeläinen, E.; Mäki, P.; Hurtig, T.; Ebeling, H.; Barnett, J.H.; et al. Brain Structural Deficits and Working Memory FMRI Dysfunction in Young Adults Who Were Diagnosed with ADHD in Adolescence. Eur. Child Adolesc. Psychiatry 2016, 25, 529–538. [Google Scholar] [CrossRef]
- Sasayama, D.; Hayashida, A.; Yamasue, H.; Harada, Y.; Kaneko, T.; Kasai, K.; Washizuka, S.; Amano, N. Neuroanatomical Correlates of Attention-Deficit-Hyperactivity Disorder Accounting for Comorbid Oppositional Defiant Disorder and Conduct Disorder. Psychiatry Clin. Neurosci. 2010, 64, 394–402. [Google Scholar] [CrossRef]
- van Wingen, G.A.; van den Brink, W.; Veltman, D.J.; Schmaal, L.; Dom, G.; Booij, J.; Crunelle, C.L. Reduced Striatal Brain Volumes in Non-Medicated Adult ADHD Patients with Comorbid Cocaine Dependence. Drug Alcohol. Depend. 2013, 131, 198–203. [Google Scholar] [CrossRef]
- Villemonteix, T.; De Brito, S.A.; Kavec, M.; Balériaux, D.; Metens, T.; Slama, H.; Baijot, S.; Mary, A.; Peigneux, P.; Massat, I. Grey Matter Volumes in Treatment Naïve vs. Chronically Treated Children with Attention Deficit/Hyperactivity Disorder: A Combined Approach. Eur. Neuropsychopharmacol. 2015, 25, 1118–1127. [Google Scholar] [CrossRef] [PubMed]
- Yang, P.; Wang, P.N.; Chuang, K.H.; Jong, Y.J.; Chao, T.C.; Wu, M.T. Absence of Gender Effect on Children with Attention-Deficit/Hyperactivity Disorder as Assessed by Optimized Voxel-Based Morphometry. Psychiatry Res. Neuroimag. 2008, 164, 245–253. [Google Scholar] [CrossRef] [PubMed]
- Brambati, S.M.; Termine, C.; Ruffino, M.; Stella, G.; Fazio, F.; Cappa, S.F.; Perani, D. Regional Reductions of Gray Matter Volume in Familial Dyslexia. Neurology 2004, 63, 742–745. [Google Scholar] [CrossRef] [PubMed]
- Brown, W.E.; Eliez, S.; Menon, V.; Rumsey, J.M.; White, C.D.; Reiss, A.L. Preliminary Evidence of Widespread Morphological Variations of the Brain in Dyslexia. Neurology 2001, 56, 781–783. [Google Scholar] [CrossRef] [PubMed]
- Eckert, M.A.; Leonard, C.M.; Wilke, M.; Eckert, M.; Richards, T.; Richards, A.; Berninger, V. Anatomical Signatures of Dyslexia in Children: Unique Information from Manual and Voxel Based Morphometry Brain Measures. Cortex 2005, 41, 304–315. [Google Scholar] [CrossRef]
- Evans, T.M.; Flowers, D.L.; Napoliello, E.M.; Eden, G.F. Sex-Specific Gray Matter Volume Differences in Females with Developmental Dyslexia. Brain Struct. Funct. 2014, 219, 1041–1054. [Google Scholar] [CrossRef] [PubMed][Green Version]
- Hoeft, F.; Meyler, A.; Hernandez, A.; Juel, C.; Taylor-Hill, H.; Martindale, J.L.; McMillon, G.; Kolchugina, G.; Black, J.M.; Faizi, A.; et al. Functional and Morphometric Brain Dissociation between Dyslexia and Reading Ability. Proc. Natl. Acad. Sci. USA 2007, 104, 4234–4239. [Google Scholar] [CrossRef]
- Jednoróg, K.; Marchewka, A.; Altarelli, I.; Monzalvo Lopez, A.K.; van Ermingen-Marbach, M.; Grande, M.; Grabowska, A.; Heim, S.; Ramus, F. How Reliable Are Gray Matter Disruptions in Specific Reading Disability across Multiple Countries and Languages? Insights from a Large-Scale Voxel-Based Morphometry Study. Hum. Brain Mapp. 2015, 36, 1741–1754. [Google Scholar] [CrossRef]
- Kronbichler, M.; Wimmer, H.; Staffen, W.; Hutzier, F.; Mair, A.; Ladurner, G. Developmental Dyslexia: Gray Matter Abnormalities in the Occipitotemporal Cortex. Hum. Brain Mapp. 2008, 29, 613–625. [Google Scholar] [CrossRef]
- Liu, L.; You, W.; Wang, W.; Guo, X.; Peng, D.; Booth, J. Altered Brain Structure in Chinese Dyslexic Children. Neuropsychologia 2013, 51, 1169–1176. [Google Scholar] [CrossRef]
- Silani, G.; Frith, U.; Demonet, J.F.; Fazio, F.; Perani, D.; Price, C.; Frith, C.D.; Paulesu, E. Brain Abnormalities Underlying Altered Activation in Dyslexia: A Voxel Based Morphometry Study. Brain 2005, 128, 2453–2461. [Google Scholar] [CrossRef] [PubMed]
- Wai, T.S.; Niu, Z.; Jin, Z.; Perfetti, C.A.; Li, H.T. A Structural-Functional Basis for Dyslexia in the Cortex of Chinese Readers. Proc. Natl. Acad. Sci. USA 2008, 105, 5561–5566. [Google Scholar] [CrossRef]
- Steinbrink, C.; Vogt, K.; Kastrup, A.; Müller, H.P.; Juengling, F.D.; Kassubek, J.; Riecker, A. The Contribution of White and Gray Matter Differences to Developmental Dyslexia: Insights from DTI and VBM at 3.0 T. Neuropsychologia 2008, 46, 3170–3178. [Google Scholar] [CrossRef] [PubMed]
- Tamboer, P.; Scholte, H.S.; Vorst, H.C.M. Dyslexia and Voxel-Based Morphometry: Correlations between Five Behavioural Measures of Dyslexia and Gray and White Matter Volumes. Ann. Dyslexia 2015, 65, 121–141. [Google Scholar] [CrossRef] [PubMed]
- Vinckenbosch, E.; Robichon, F.; Eliez, S. Gray Matter Alteration in Dyslexia: Converging Evidence from Volumetric and Voxel-by-Voxel MRI Analyses. Neuropsychologia 2005, 43, 324–331. [Google Scholar] [CrossRef] [PubMed]
- Xia, Z.; Hoeft, F.; Zhang, L.; Shu, H. Neuroanatomical Anomalies of Dyslexia: Disambiguating the Effects of Disorder, Performance, and Maturation. Neuropsychologia 2016, 81, 68–78. [Google Scholar] [CrossRef]
- Yang, Y.H.; Yang, Y.; Chen, B.G.; Zhang, Y.W.; Bi, H.Y. Anomalous Cerebellar Anatomy in Chinese Children with Dyslexia. Front. Psychol. 2016, 7, 324. [Google Scholar] [CrossRef]
- Winkler, A.M.; Ridgway, G.R.; Webster, M.A.; Smith, S.M.; Nichols, T.E. Permutation inference for the general linear model. NeuroImage 2014, 92, 381–397. [Google Scholar] [CrossRef]
- Radua, J.; Romeo, M.; Mataix-Cols, D.; Fusar-Poli, P. A general approach for combining voxel-based meta-analyses conducted in different neuroimaging modalities. Curr. MedChem. 2013, 20, 462–466. [Google Scholar]
- Acar, F.; Seurinck, R.; Eickhoff, S.B.; Moerkerke, B. Assessing robustness against potential publication bias in Activation Likelihood Estimation (ALE) meta-analyses for fMRI. PLoS ONE 2018, 13, e0208177. [Google Scholar] [CrossRef]
- Laitin, D.D.; Miguel, E.; Alrababa’h, A.; Bogdanoski, A.; Grant, S.; Hoeberling, K.; Hyunjung Mo, C.; Moore, D.A.; Vazire, S.; Weinstein, J.; et al. Reporting all results efficiently: A RARE proposal to open up the file drawer. Proc. Natl. Acad. Sci. USA 2021, 118, e2106178118. [Google Scholar] [CrossRef] [PubMed]
- Amico, F.; Stauber, J.; Koutsouleris, N.; Frodl, T. Anterior Cingulate Cortex Gray Matter Abnormalities in Adults with Attention Deficit Hyperactivity Disorder: A Voxel-Based Morphometry Study. Psychiatry Res. Neuroimag. 2011, 191, 31–35. [Google Scholar] [CrossRef] [PubMed]
- Depue, B.E.; Burgess, G.C.; Bidwell, L.C.; Willcutt, E.G.; Banich, M.T. Behavioral Performance Predicts Grey Matter Reductions in the Right Inferior Frontal Gyrus in Young Adults with Combined Type ADHD. Psychiatry Res. Neuroimag. 2010, 182, 231–237. [Google Scholar] [CrossRef] [PubMed]
- Maier, S.; Perlov, E.; Graf, E.; Dieter, E.; Sobanski, E.; Rump, M.; Warnke, A.; Ebert, D.; Berger, M.; Matthies, S.; et al. Discrete Global but No Focal Gray Matter Volume Reductions in Unmedicated Adult Patients With Attention-Deficit/Hyperactivity Disorder. Biol. Psychiatry 2016, 80, 905–915. [Google Scholar] [CrossRef]
- Onnink, A.M.H.; Zwiers, M.P.; Hoogman, M.; Mostert, J.C.; Kan, C.C.; Buitelaar, J.; Franke, B. Brain Alterations in Adult ADHD: Effects of Gender, Treatment and Comorbid Depression. Eur. Neuropsychopharmacol. 2014, 24, 397–409. [Google Scholar] [CrossRef]
- Saad, J.F.; Griffiths, K.R.; Kohn, M.R.; Clarke, S.; Williams, L.M.; Korgaonkar, M.S. Regional Brain Network Organization Distinguishes the Combined and Inattentive Subtypes of Attention Deficit Hyperactivity Disorder. NeuroImage Clin. 2017, 15, 383–390. [Google Scholar] [CrossRef]
- Seidman, L.J.; Biederman, J.; Liang, L.; Valera, E.M.; Monuteaux, M.C.; Brown, A.; Kaiser, J.; Spencer, T.; Faraone, S.V.; Makris, N. Gray Matter Alterations in Adults with Attention-Deficit/Hyperactivity Disorder Identified by Voxel Based Morphometry. Biol. Psychiatry 2011, 69, 857–866. [Google Scholar] [CrossRef]
- Villemonteix, T.; De Brito, S.A.; Slama, H.; Kavec, M.; Balériaux, D.; Metens, T.; Baijot, S.; Mary, A.; Peigneux, P.; Massat, I. Grey Matter Volume Differences Associated with Gender in Children with Attention-Deficit/Hyperactivity Disorder: A Voxel-Based Morphometry Study. Dev. Cogn. Neurosci. 2015, 14, 32–37. [Google Scholar] [CrossRef]
- Eckert, M.A.; Berninger, V.W.; Vaden, K.I.; Gebregziabher, M.; Tsu, L. Gray Matter Features of Reading Disability: A Combined Meta-Analytic and Direct Analysis Approach. eNeuro 2016, 3, 11296–11301. [Google Scholar] [CrossRef]
- Pernet, C.; Andersson, J.; Paulesu, E.; Demonet, J.F. When All Hypotheses Are Right: A Multifocal Account of Dyslexia. Hum. Brain Mapp. 2009, 30, 2278–2292. [Google Scholar] [CrossRef]
- Laird, A.R.; Fox, P.M.; Price, C.J.; Glahn, D.C.; Uecker, A.M.; Lancaster, J.L.; Turkeltaub, P.E.; Kochunov, P.; Fox, P.T. ALE meta-analysis: Controlling the false discovery rate and performing statistical contrasts. Hum. Brain Mapp. 2005, 25, 155–164. [Google Scholar] [CrossRef] [PubMed]
- Eickhoff, S.B.; Laird, A.R.; Fox, P.M.; Lancaster, J.L.; Fox, P.T. Implementation errors in the GingerALE Software: Description and recommendations. Hum. Brain Mapp. 2017, 38, 7–11. [Google Scholar] [CrossRef] [PubMed]
- Tahmasian, M.; Sepehry, A.A.; Samea, F.; Khodadadifar, T.; Soltaninejad, Z.; Javaheripour, N.; Khazaie, H.; Zarei, M.; Eickhoff, S.B.; Eickhoff, C.R. Practical recommendations to conduct a neuroimaging meta-analysis for neuropsychiatric disorders. Hum. Brain Mapp. 2019, 40, 5142–5154. [Google Scholar] [CrossRef] [PubMed]
- Liloia, D.; Brasso, C.; Cauda, F.; Mancuso, L.; Nani, A.; Manuello, J.; Costa, T.; Duca, S.; Rocca, P. Updating and characterizing neuroanatomical markers in high-risk subjects, recently diagnosed and chronic patients with schizophrenia: A revised coordinate-based meta-analysis. Neurosci. Biobehav. Rev. 2021, 123, 83–103. [Google Scholar] [CrossRef]
- Mostofsky, S.H.; Reiss, A.L.; Lockhart, P.; Denckla, M.B. Evaluation of cerebellar size in attention-deficit hyperactivity disorder. J. Child. Neurol. 1998, 13, 434–439. [Google Scholar] [CrossRef]
- Goetz, M.; Vesela, M.; Ptacek, R. Notes on the role of the cerebellum in ADHD. Austin. J. Psychiatry Behav. Sci. 2014, 1, 1013. [Google Scholar]
- Stoodley, C.J. The Cerebellum and Neurodevelopmental Disorders. Cerebellum 2016, 15, 34–37. [Google Scholar] [CrossRef]
- Bruchhage, M.M.K.; Bucci, M.P.; Becker, E.B.E. Cerebellar involvement in autism and ADHD. Handd. Clin. Neurol. 2018, 155, 61–72. [Google Scholar] [CrossRef]
- Linkersdörfer, J.; Lonnemann, J.; Lindberg, S.; Hasselhorn, M.; Fiebach, C.J. Grey matter alterations co-localize with functional abnormalities in developmental dyslexia: An ALE meta-analysis. PLoS ONE 2012, 7, e43122. [Google Scholar] [CrossRef]
- Richlan, F.; Kronbichler, M.; Wimmer, H. Structural abnormalities in the dyslexic brain: A meta-analysis of voxel-based morphometry studies. Hum. Brain Mapp. 2013, 34, 3055–3065. [Google Scholar] [CrossRef]
- Yan, X.; Jiang, K.; Li, H.; Wang, Z.; Perkins, K.; Cao, F. Convergent and divergent brain structural and functional abnormalities associated with developmental dyslexia. eLife 2021, 10, e69523. [Google Scholar] [CrossRef]
- Albajes-Eizagirre, A.; Radua, J. What do results from coordinate-based meta-analyses tell us? NeuroImage 2018, 176, 550–553. [Google Scholar] [CrossRef] [PubMed]
- Shaywitz, S.E.; Escobar, M.D.; Shaywitz, B.A.; Fletcher, J.M.; Makuch, R. Evidence That Dyslexia May Represent the Lower Tail of a Normal Distribution of Reading Ability. NEJM 1992, 326, 145–150. [Google Scholar] [CrossRef] [PubMed]
- Peterson, R.L.; Pennington, B.F.; Olson, R.K. Subtypes of developmental dyslexia: Testing the predictions of the dual-route and connectionist frameworks. Cognition 2013, 126, 20–38. [Google Scholar] [CrossRef] [PubMed]
- Kern, J.K.; Geier, D.A.; Sykes, L.K.; Geier, M.R.; Deth, R.C. Are ASD and ADHD a Continuum? A Comparison of Pathophysiological Similarities Between the Disorders. JAD 2015, 19, 805–827. [Google Scholar] [CrossRef]
- Whitely, M. Attention deficit hyperactive disorder diagnosis continues to fail the reliability and validity tests. Aust. N. Z. J. Psychiatry 2015, 49, 497–498. [Google Scholar] [CrossRef]
- McLennan, J.D. Understanding attention deficit hyperactivity disorder as a continuum. Can. Fam. Physician Med. Fam. Can. 2016, 62, 979–982. [Google Scholar]
- Gnanavel, S.; Sharma, P.; Kaushal, P.; Hussain, S. Attention deficit hyperactivity disorder and comorbidity: A review of literature. World J. Clin. Cases 2019, 7, 2420–2426. [Google Scholar] [CrossRef]
- Darweesh, A.M.; Elserogy, Y.M.; Khalifa, H.; Gabra, R.H.; El-Ghafour, M.A. Psychiatric comorbidity among children and adolescents with dyslexia. MECP 2020, 27, 1–9. [Google Scholar] [CrossRef]


| VBM Experiments Included in the Original Coordinate-Based Meta-Analysis | Clinical Group | Control Group | Brain Volume Analysis | Comorbidity with Dyslexia or ADHD Noted in Exclusion Criteria | Co-Morbid Disorders Reported in Sample | ||||||||||
|---|---|---|---|---|---|---|---|---|---|---|---|---|---|---|---|
| N | % Male | Mean Age (yrs) | Age SD (yrs) | Age Range (yrs) | FSIQ | Medication | N | % Male | Mean Age (yrs) | Age SD (yrs) | Age Range (yrs) | ||||
| (A) ADHD | |||||||||||||||
| Ahrendts et al., 2011 [42] | 31 | 65% | 31.2 | 9.7 | 18–55 | N/A | 0% | 31 | 65% | 31.5 | 8.6 | 19–52 | yes | LD, psychiatric disorder, abuse/dependency | Anxiety |
| Bonath et al., 2018 [43] | 18 | 100% | 13.6 | 1.7 | 11–17 | N/A | 55.6% | 18 | 100% | 14.1 | 1.3 | 11–17 | yes | - | 1 ODD |
| Bralten et al., 2016 [44] | 307 | 68% | 17.1 | 3.4 | 8–26 | 97.08 | 88.6% | 196 | 51% | 16.7 | 3.1 | 9–24 | no | LD, psychiatric disorder, abuse/dependency | - |
| Brieber et al., 2007 [45] | 15 | 100% | 13.1 | 1.4 | 10–16 | N/A | 66.7% | 15 | 100% | 13.3 | 1.8 | 10–16 | yes | - | - |
| Carmona et al., 2005 [46] | 25 | 84% | 10.8 | 3.0 | N/A | >80 | 100% | 25 | 84% | 11.2 | 3.2 | N/A | yes | - | 11 anxiety, 2 MDD, 4 phobias, 6 tics, 7 obsessions |
| He et al., 2015 [47] | 37 | 100% | 9.9 | 2.4 | 7–16 | >90 | 0% | 35 | 100% | 10.7 | 2.6 | 8–15 | yes | - | - |
| Iannaccone et al., 2015 [48] | 20 | 61% | 14.5 | 1.5 | 12–16 | 108.46 | 65% | 20 | 50% | 14.8 | 1.2 | 12–16 | yes | - | 2 affective disorder, 3 AD, 3 anxiety/phobia, 2 dyscalculia, 2 CD |
| Johnston et al., 2014 [49] | 34 | 100% | 12.5 | 2.3 | N/A | N/A | 29.4% | 34 | 100% | 13.2 | 1.0 | N/A | no | - | 1 dyslexia, 3 ODD/CD |
| Kappel et al., 2015 (adults) [50] | 16 | 94% | 23.5 | 4.1 | 19–31 | N/A | 0% | 20 | 100% | 23.7 | 3.4 | N/A | no | - | 2 alcohol abuse, 1 multiple drug abuse |
| Kappel et al., 2015 (children) [50] | 14 | 71% | 9.8 | 1.3 | 8–12 | N/A | 0% | 10 | 80% | 11.0 | 1.3 | N/A | no | - | - |
| Kaya et al., 2018 [51] | 19 | 71% | 10.3 | 2.0 | 7–14 | N/A | 0% | 18 | 67% | 10.2 | 2.0 | 6–14 | no | - | - |
| Kobel et al., 2010 [52] | 14 | 100% | 10.4 | 1.3 | 9–13 | N/A | 100% | 12 | 100% | 10.9 | 1.6 | 9–13 | yes | - | 3 OCD-CD, 2 GAD, 2 OCD-GAD |
| Kumar et al., 2017 [53] | 18 | 100% | 9.6 | 1.8 | 7.5–13 | N/A | 0% | 18 | 100% | 9.7 | 1.9 | 7.5–13 | yes | LD, psychiatric disorder, abuse/dependency | - |
| Lim et al. 2013 [54] | 29 | 100% | 13.8 | 1.8 | 10.5–16.5 | N/A | 20% | 29 | 100% | 14.4 | 2.5 | 10.7–17.9 | no | LD | - |
| McAlonan et al., 2007 [55] | 28 | 100% | 9.9 | 2.0 | 6–13 | N/A | 100% | 31 | 100% | 9.6 | 1.8 | 6–13 | yes | - | 16 OCD, 2 CD |
| Montes et al., 2010 [56] | 20 | 50% | 29.0 | 4.0 | 25–35 | N/A | N/A | 20 | 50% | 27.6 | 2.6 | 25–35 | no | - | - |
| Moreno-Alcazar et al., 2016 [57] | 44 | 66% | 31.6 | 11.4 | 18–65 | N/A | 65.9% | 44 | 66% | 32.6 | 10.6 | 18–65 | no | - | - |
| Overmeyer et al., 2001 [58] | 18 | 83% | 10.4 | 1.7 | 8–13 | N/A | N/A | 16 | 94% | 10.3 | 2.2 | 7–14 | yes | LD, psychiatric disorder, abuse/dependency | 1 dyslexia, 2 ODD, 2 CD |
| Roman-Urrestarazu et al., 2016 [59] | 49 | 76% | 22.2 | 0.7 | 20–24 | 96.4 | 0% | 34 | 50% | 22.9 | 0.4 | 20–24 | no | - | - |
| Sasayama et al., 2010 [60] | 18 | 72% | 10.6 | 2.9 | 6–16 | 90.05 | 0% | 17 | 71% | 10.0 | 2.4 | 6–14 | yes | LD, psychiatric disorder, abuse/dependency | 6 ODD, 4 CD |
| van Wingen et al., 2013 [61] | 14 | 100% | 32.0 | 7.0 | N/A | N/A | 0% | 15 | 100% | 37.0 | 6.0 | N/A | yes | - | - |
| Villemonteix et al., 2015 (med naïve group) [62] | 33 | 55% | 10.3 | 1.4 | 7.3–12.9 | N/A | 0% | 24 | 50% | 10.0 | 1.2 | 7.3–12.9 | no | - | - |
| Villemonteix et al., 2015 (med group) [62] | 20 | 80% | 10.4 | 1.4 | 7.3–12.9 | N/A | 100% | 24 | 50% | 10.0 | 1.2 | 7.3–12.9 | no | - | - |
| Yang et al., 2008 [63] | 57 | 61% | 11.1 | N/A | N/A | 97.9 | 87.7% | 57 | 60% | 11.7 | N/A | N/A | yes | - | 5 LD, 14 ODD, 1 tic, 1 GAD |
| Totals, sample size, averages | 898 | 76% | 16.5 | - | - | - | - | 763 | 71% | 16,6 | - | - | - | - | - |
| (B) Dyslexia | |||||||||||||||
| Brambati et al., 2004 [64] | 10 | 50% | 31.6 | N/A | 13–57 | 107,1 | N/A | 11 | 45% | 27.4 | N/A | 14–55 | yes | Psychiatric disorder | - |
| Brown et al., 2001 [65] | 16 | 100% | 24.0 | 5.0 | 18–40 | >90 | N/A | 14 | 100% | N/A | N/A | N/A | no | ADHD | - |
| Eckert et al., 2005 [66] | 13 | 100% | 11.4 | 0.7 | 10.1–12.7 | N/A | N/A | 13 | 100% | 11.3 | 0.7 | 10.1–12.7 | yes | Psychiatric disorder | - |
| Evans et al., 2013 (male adults) [67] | 14 | 100% | 42.9 | 10.4 | N/A | 108.0 | 0% | 14 | 100% | 41.1 | 9.0 | N/A | yes | Psychiatric disorder | - |
| Evans et al., 2013 (female adults) [67] | 13 | 0% | 34.0 | 11.6 | N/A | 99.6 | 0% | 13 | 0% | 27.9 | 9.7 | N/A | yes | Psychiatric disorder | - |
| Evans et al., 2013 (male children) [67] | 15 | 100% | 9.6 | 1.3 | N/A | 101.7 | 0% | 15 | 100% | 8.3 | 2.1 | N/A | yes | Psychiatric disorder | - |
| Evans et al., 2013 (female children) [67] | 17 | 0% | 10.1 | 2.1 | N/A | 101.9 | 0% | 17 | 0% | 9.1 | 3.0 | N/A | yes | Psychiatric disorder | - |
| Hoeft et al., 2007 [68] | 19 | 53% | 14.4 | 1.9 | 7–16 | N/A | N/A | 19 | 53% | 14.4 | 2.4 | 7–16 | yes | Psychiatric disorder | - |
| Jednorog et al., 2015 [69] | 130 | 57% | 10.3 | 0.9 | 8.5–13.7 | >85 | N/A | 106 | 48% | 10.2 | 0.9 | 8.5–13.7 | yes | ADHD | - |
| Kronbichler et al., 2008 [70] | 13 | 100% | 15.9 | 0.8 | 14–16 | N/A | N/A | 15 | 100% | 15.5 | 0.6 | 14–16 | yes | Psychiatric disorder | - |
| Liu et al., 2013 [71] | 18 | 72% | 11.8 | 0.6 | 10.4–12.6 | >90 | 0% | 18 | 83% | 11.8 | 0.3 | 11.3–12.6 | yes | ADHD | - |
| Silani et al., 2005 [72] | 32 | 100% | 24.4 | 5.0 | N/A | 110 | N/A | 32 | 100% | 26.3 | 5.0 | N/A | no | - | - |
| Siok et al., 2008 [73] | 16 | 50% | 11.0 | 0.5 | 10.2–11.6 | N/A | N/A | 16 | 81% | 11.0 | 0.6 | 9.11–12.4 | yes | ADHD | - |
| Steinbrink et al., 2008 [74] | 8 | 75% | 20.1 | 3.9 | N/A | N/A | N/A | 8 | 75% | 23.7 | 4.3 | N/A | yes | Psychiatric disorder | - |
| Tamboer et al., 2015 [75] | 37 | 16% | 20.6 | 1.5 | N/A | N/A | N/A | 57 | 12% | 20.3 | 1.1 | N/A | yes | ADHD | - |
| Vinckenbosch et al., 2005 [76] | 13 | 100% | N/A | N/A | 17–30 | N/A | N/A | 10 | 100% | N/A | N/A | 17–30 | yes | ADHD | - |
| Xia et al., 2016 [77] | 24 | 58% | 12.5 | 0.7 | 10–15 | >80 | N/A | 24 | 50% | 12.5 | 0.4 | 10–15 | no | Psychiatric disorder | - |
| Yang et al., 2016 [78] | 9 | 33% | 12.6 | 0.6 | N/A | N/A | N/A | 14 | 43% | 12.3 | 1.0 | N/A | yes | ADHD | - |
| Totals, sample size, averages | 417 | 61% | 16.4 | - | - | - | - | 416 | 57% | 16.5 | - | - | - | - | - |
| VBM Experiments Not Included in the Original Coordinate-Based Meta-Analysis | Clinical Group | Control Group | Comorbidity with Dyslexia or ADHD Noted in Exclusion Criteria | Co-Morbid Disorders Reported in Sample | ||||||||||
|---|---|---|---|---|---|---|---|---|---|---|---|---|---|---|
| N | % Male | Mean Age (yrs) | Age SD (yrs) | Age Range (yrs) | FSIQ | Medication | N | % Male | Mean Age (yrs) | Age SD (yrs) | Age Range (yrs) | |||
| (A) ADHD | ||||||||||||||
| Amico et al., (2011) [83] | 20 | 75% | 33.6 | 10.2 | N/A | N/A | N/A | 20 | 75% | 34.7 | 10.7 | N/A | PD | 6 MDD, 7 depressive episodes |
| Depue et al., (2010) [84] | 31 | 61.10% | 20 | 1.7 | N/A | 114.2 | 77.4% | 21 | 38.90% | 19.3 | 1.1 | N/A | LD or psychiatric disorder | - |
| Maier et al., (2015) [85] | 131 | 48.90% | 34.5 | 10.0 | 18–58 | 113.1 | 0% | 95 | 47.40% | 37.7 | 10.5 | 18–58 | Neurological disorder | History of depression and/or psychopharmacotherapy |
| Onnink et al., (2013) [86] | 119 | 38.70% | 36.29 | 10.90 | N/A | 107.5 | 69% | 107 | 42.10% | 36.9 | 11.54 | N/A | Neurological disorder or psychiatric condition | - |
| Saad et al., (2017) [87] | 34 | 73.50% | 13.28 | 2.75 | 8–17 | N/A | 0% | 28 | 68% | 13.09 | 2.63 | 8–17 | - | ODD |
| Seidman et al., (2011) [88] | 24 | 51% | 37,3 | 12.6 | 18–59 | 116.0 | 87.5% | 54 | 46% | 34.3 | 11.3 | 18–59 | Neurological disorderabuse or dependence | LD, MDD |
| Villemonteix et al., (2015) [89] | 33 | 54.60% | 10,1 | 1.3 | 7.9–12.9 | 105.6 | 0% | 27 | 48.10% | 10.1 | 1.3 | 7.9–12.9 | LD, psychiatric disorder or neurological disorder | - |
| Totals, sample size, averages | 392 | 51% | 28.4 | - | - | - | - | 352 | 44% | 31.6 | - | - | - | - |
| (B) Dyslexia | ||||||||||||||
| Eckert et al., (2016) [90] | 164 | 60% | 10.8 | 2.59 | N/A | N/A | N/A | 129 | 60% | 10.8 | 2.73 | N/A | LD of a logographic written language system | - |
| Pernet et al., (2009) [91] | 38 | 89.50% | 27.3 | 7.9 | N/A | N/A | 0% | 39 | 89.70% | 27.8 | 5.8 | N/A | Neurological, psychiatric disorder or sensory deficits | - |
| Totals, sample size, averages | 202 | 66% | 13.9 | - | - | - | - | 168 | 67% | 14.7 | - | - | - | - |
| Region | MNI Coordinate | SDM | p ≤ 0.05 | Voxels | Cluster Breakdown | ||
|---|---|---|---|---|---|---|---|
| x | y | z | Z Score | (Corrected) | (Voxels) | ||
| ADHD > TDCs | |||||||
| No cluster found | |||||||
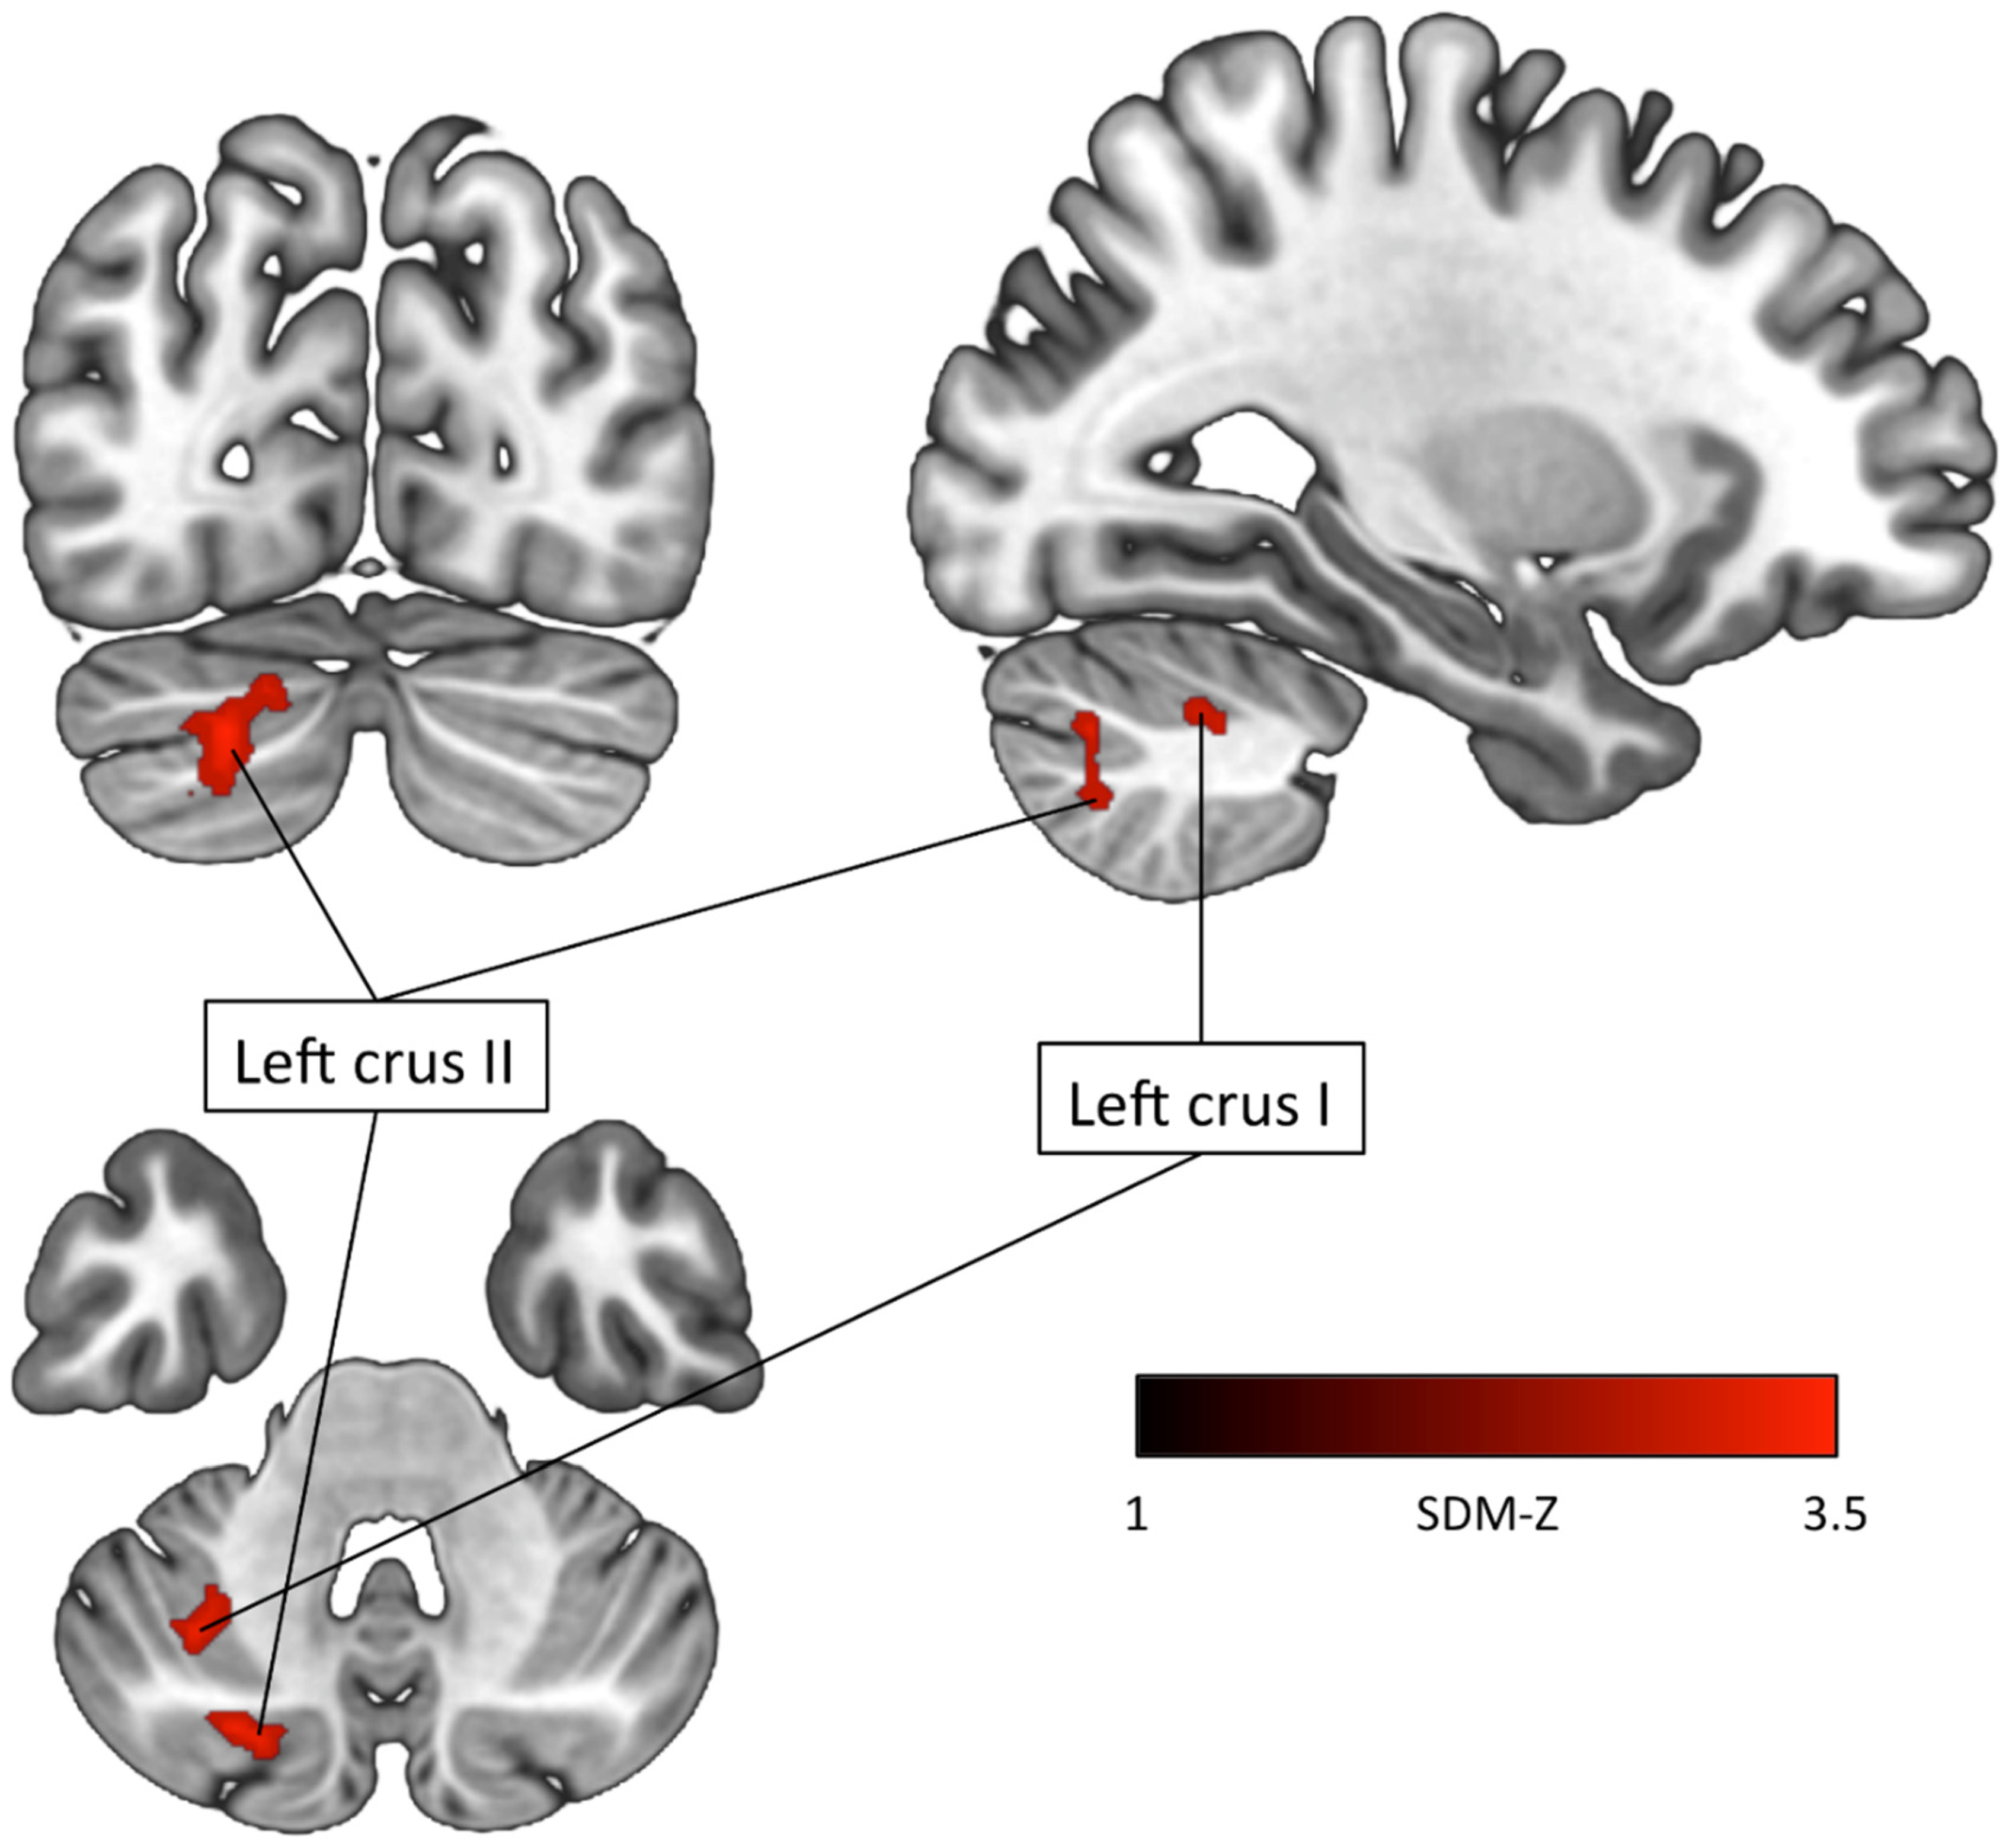
| ADHD < TDCs Left crus II (Cerebellum) | −22 | −78 | −36 | −3.569 | 0.02 | 120 | Left crus II (73) Left crus I (44) Left lobule VIIB (3) |
| Left crus I (Cerebellum) | −32 | −58 | −44 | −3.525 | 0.03 | 84 | Left crus II (51) Left crus I (11) Left lobule VIIB (10) Left lobule VI (9) Left lobule VII (2) Middle cerebellar peduncles (1) |
Publisher’s Note: MDPI stays neutral with regard to jurisdictional claims in published maps and institutional affiliations. |
© 2022 by the authors. Licensee MDPI, Basel, Switzerland. This article is an open access article distributed under the terms and conditions of the Creative Commons Attribution (CC BY) license (https://creativecommons.org/licenses/by/4.0/).
Share and Cite
Liloia, D.; Crocetta, A.; Cauda, F.; Duca, S.; Costa, T.; Manuello, J. Seeking Overlapping Neuroanatomical Alterations between Dyslexia and Attention-Deficit/Hyperactivity Disorder: A Meta-Analytic Replication Study. Brain Sci. 2022, 12, 1367. https://doi.org/10.3390/brainsci12101367
Liloia D, Crocetta A, Cauda F, Duca S, Costa T, Manuello J. Seeking Overlapping Neuroanatomical Alterations between Dyslexia and Attention-Deficit/Hyperactivity Disorder: A Meta-Analytic Replication Study. Brain Sciences. 2022; 12(10):1367. https://doi.org/10.3390/brainsci12101367
Chicago/Turabian StyleLiloia, Donato, Annachiara Crocetta, Franco Cauda, Sergio Duca, Tommaso Costa, and Jordi Manuello. 2022. "Seeking Overlapping Neuroanatomical Alterations between Dyslexia and Attention-Deficit/Hyperactivity Disorder: A Meta-Analytic Replication Study" Brain Sciences 12, no. 10: 1367. https://doi.org/10.3390/brainsci12101367
APA StyleLiloia, D., Crocetta, A., Cauda, F., Duca, S., Costa, T., & Manuello, J. (2022). Seeking Overlapping Neuroanatomical Alterations between Dyslexia and Attention-Deficit/Hyperactivity Disorder: A Meta-Analytic Replication Study. Brain Sciences, 12(10), 1367. https://doi.org/10.3390/brainsci12101367