
Comparison of Visual Fixation Trajectories in Toddlers with Autism Spectrum Disorder and Typical Development: A Markov Chain Model

 ,
,  , ,
, ,
Abstract
:1. Introduction
2. Method
2.1. Participants
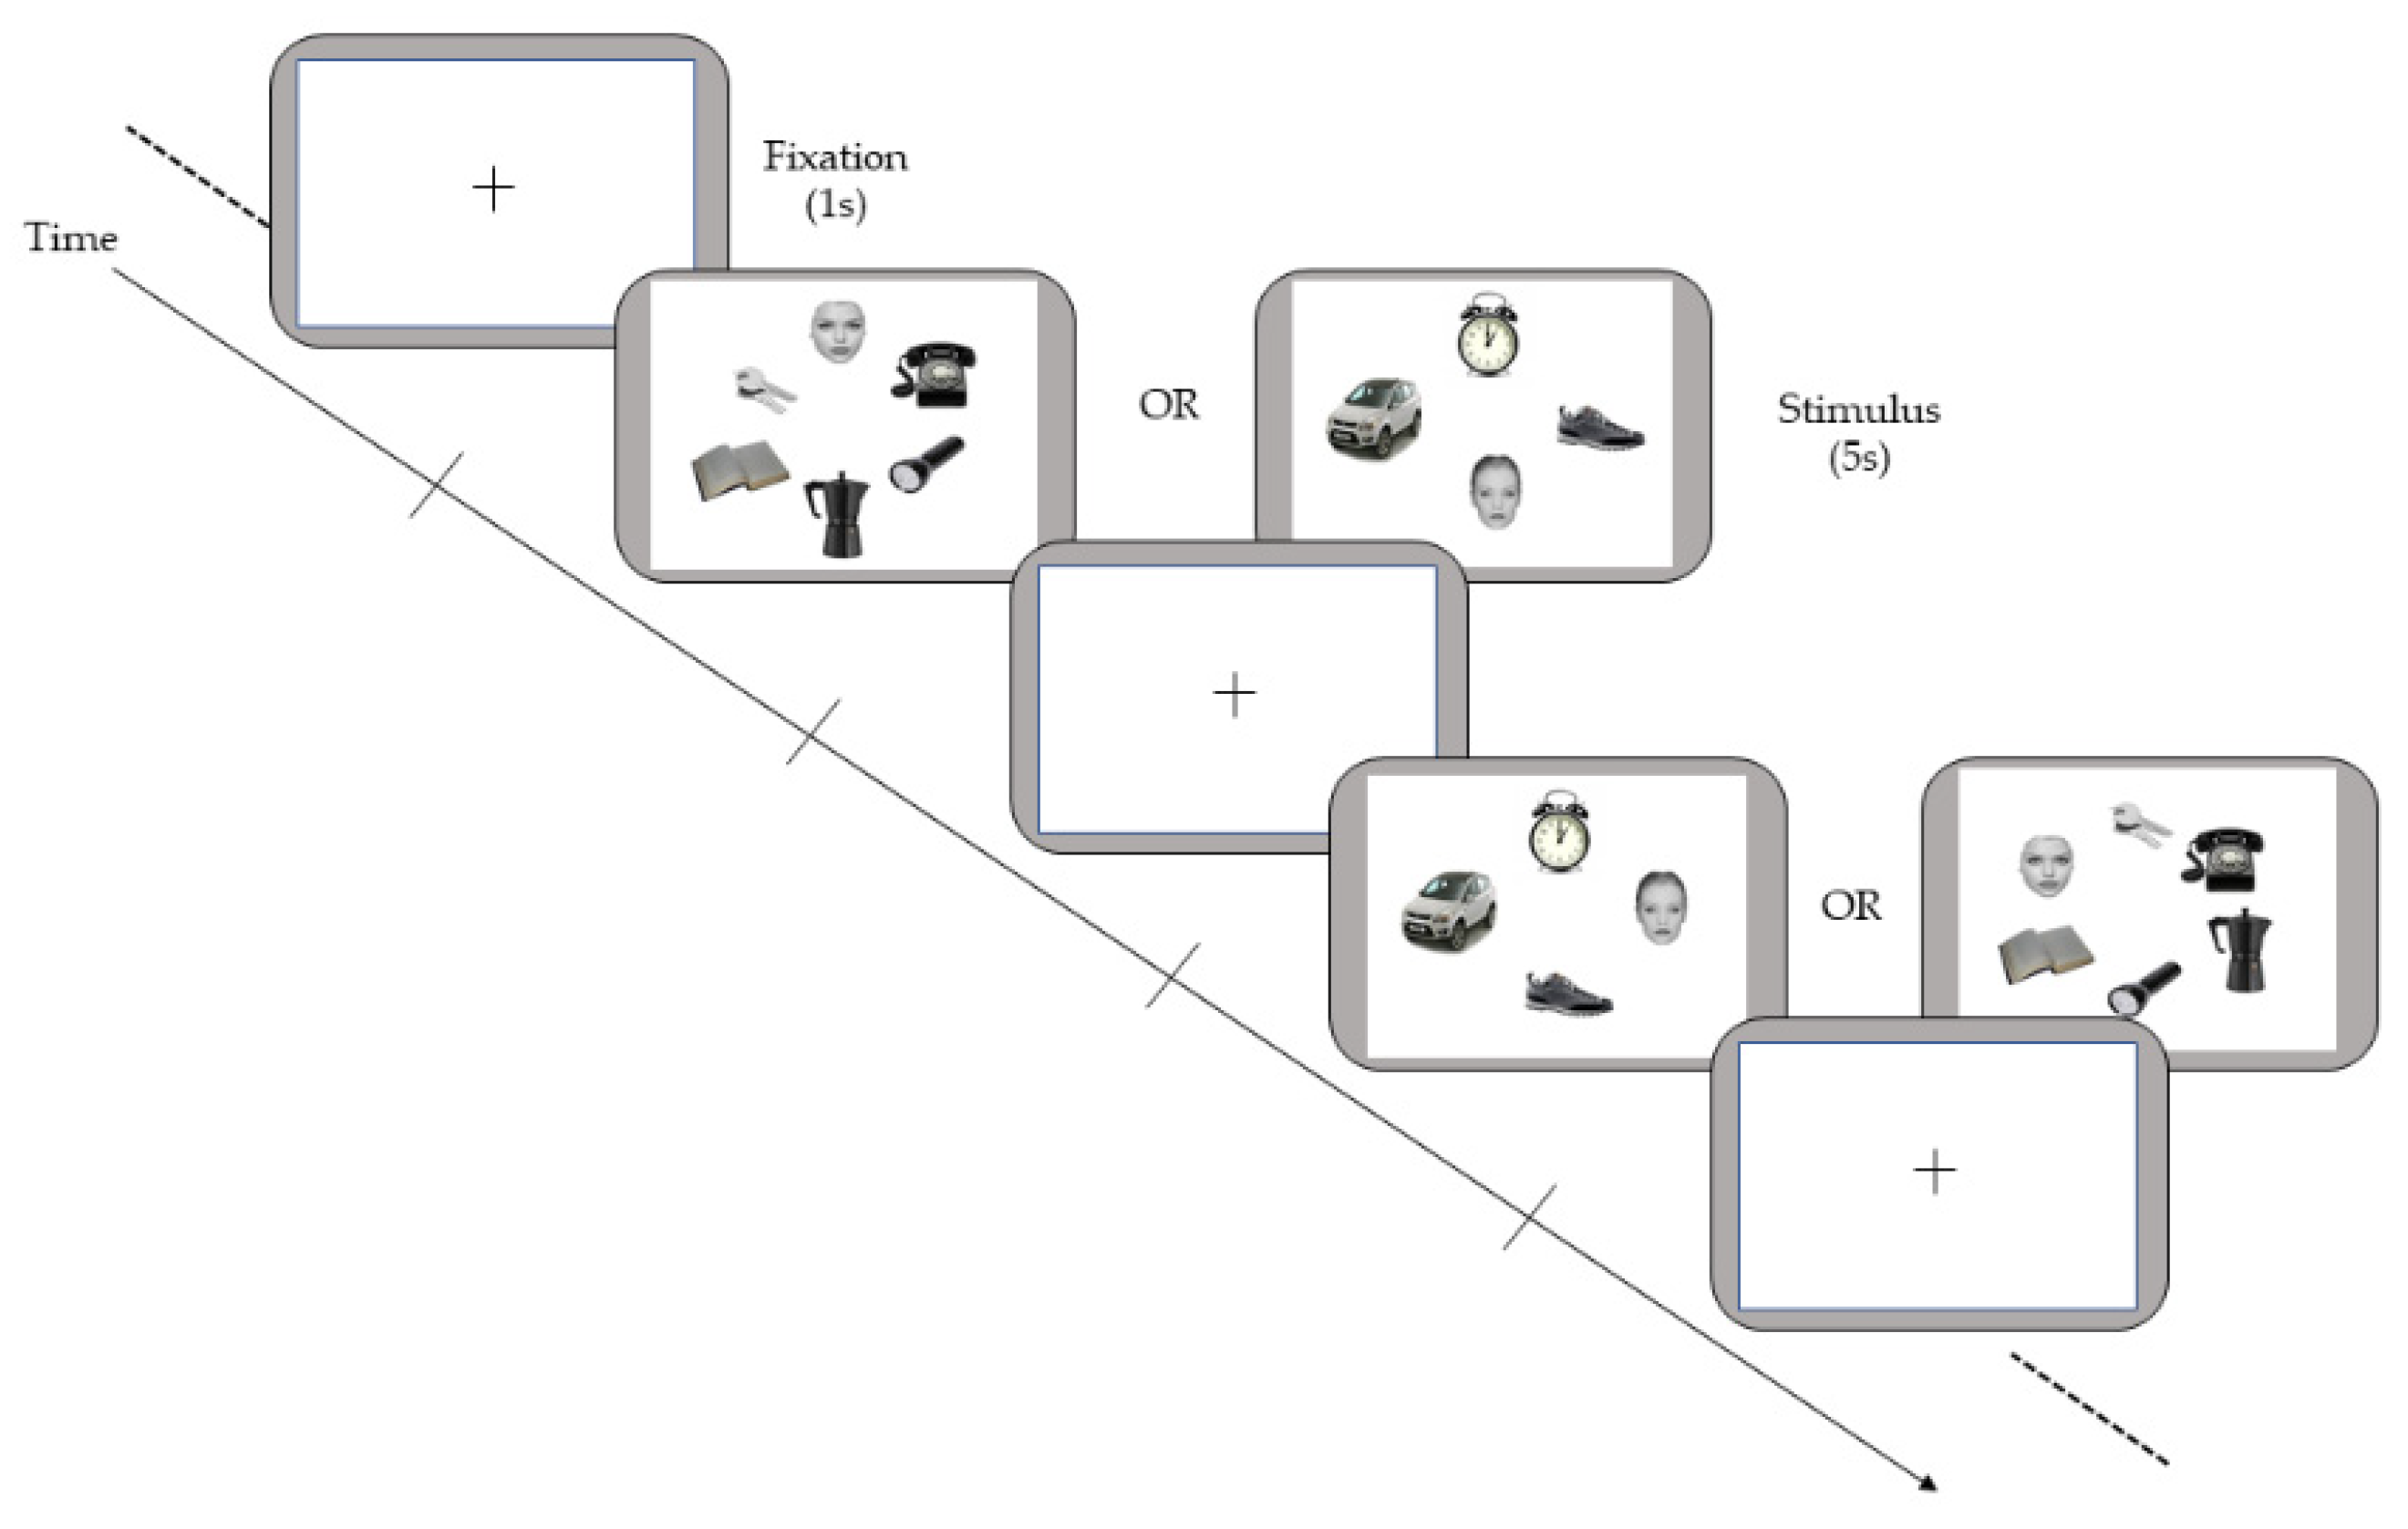
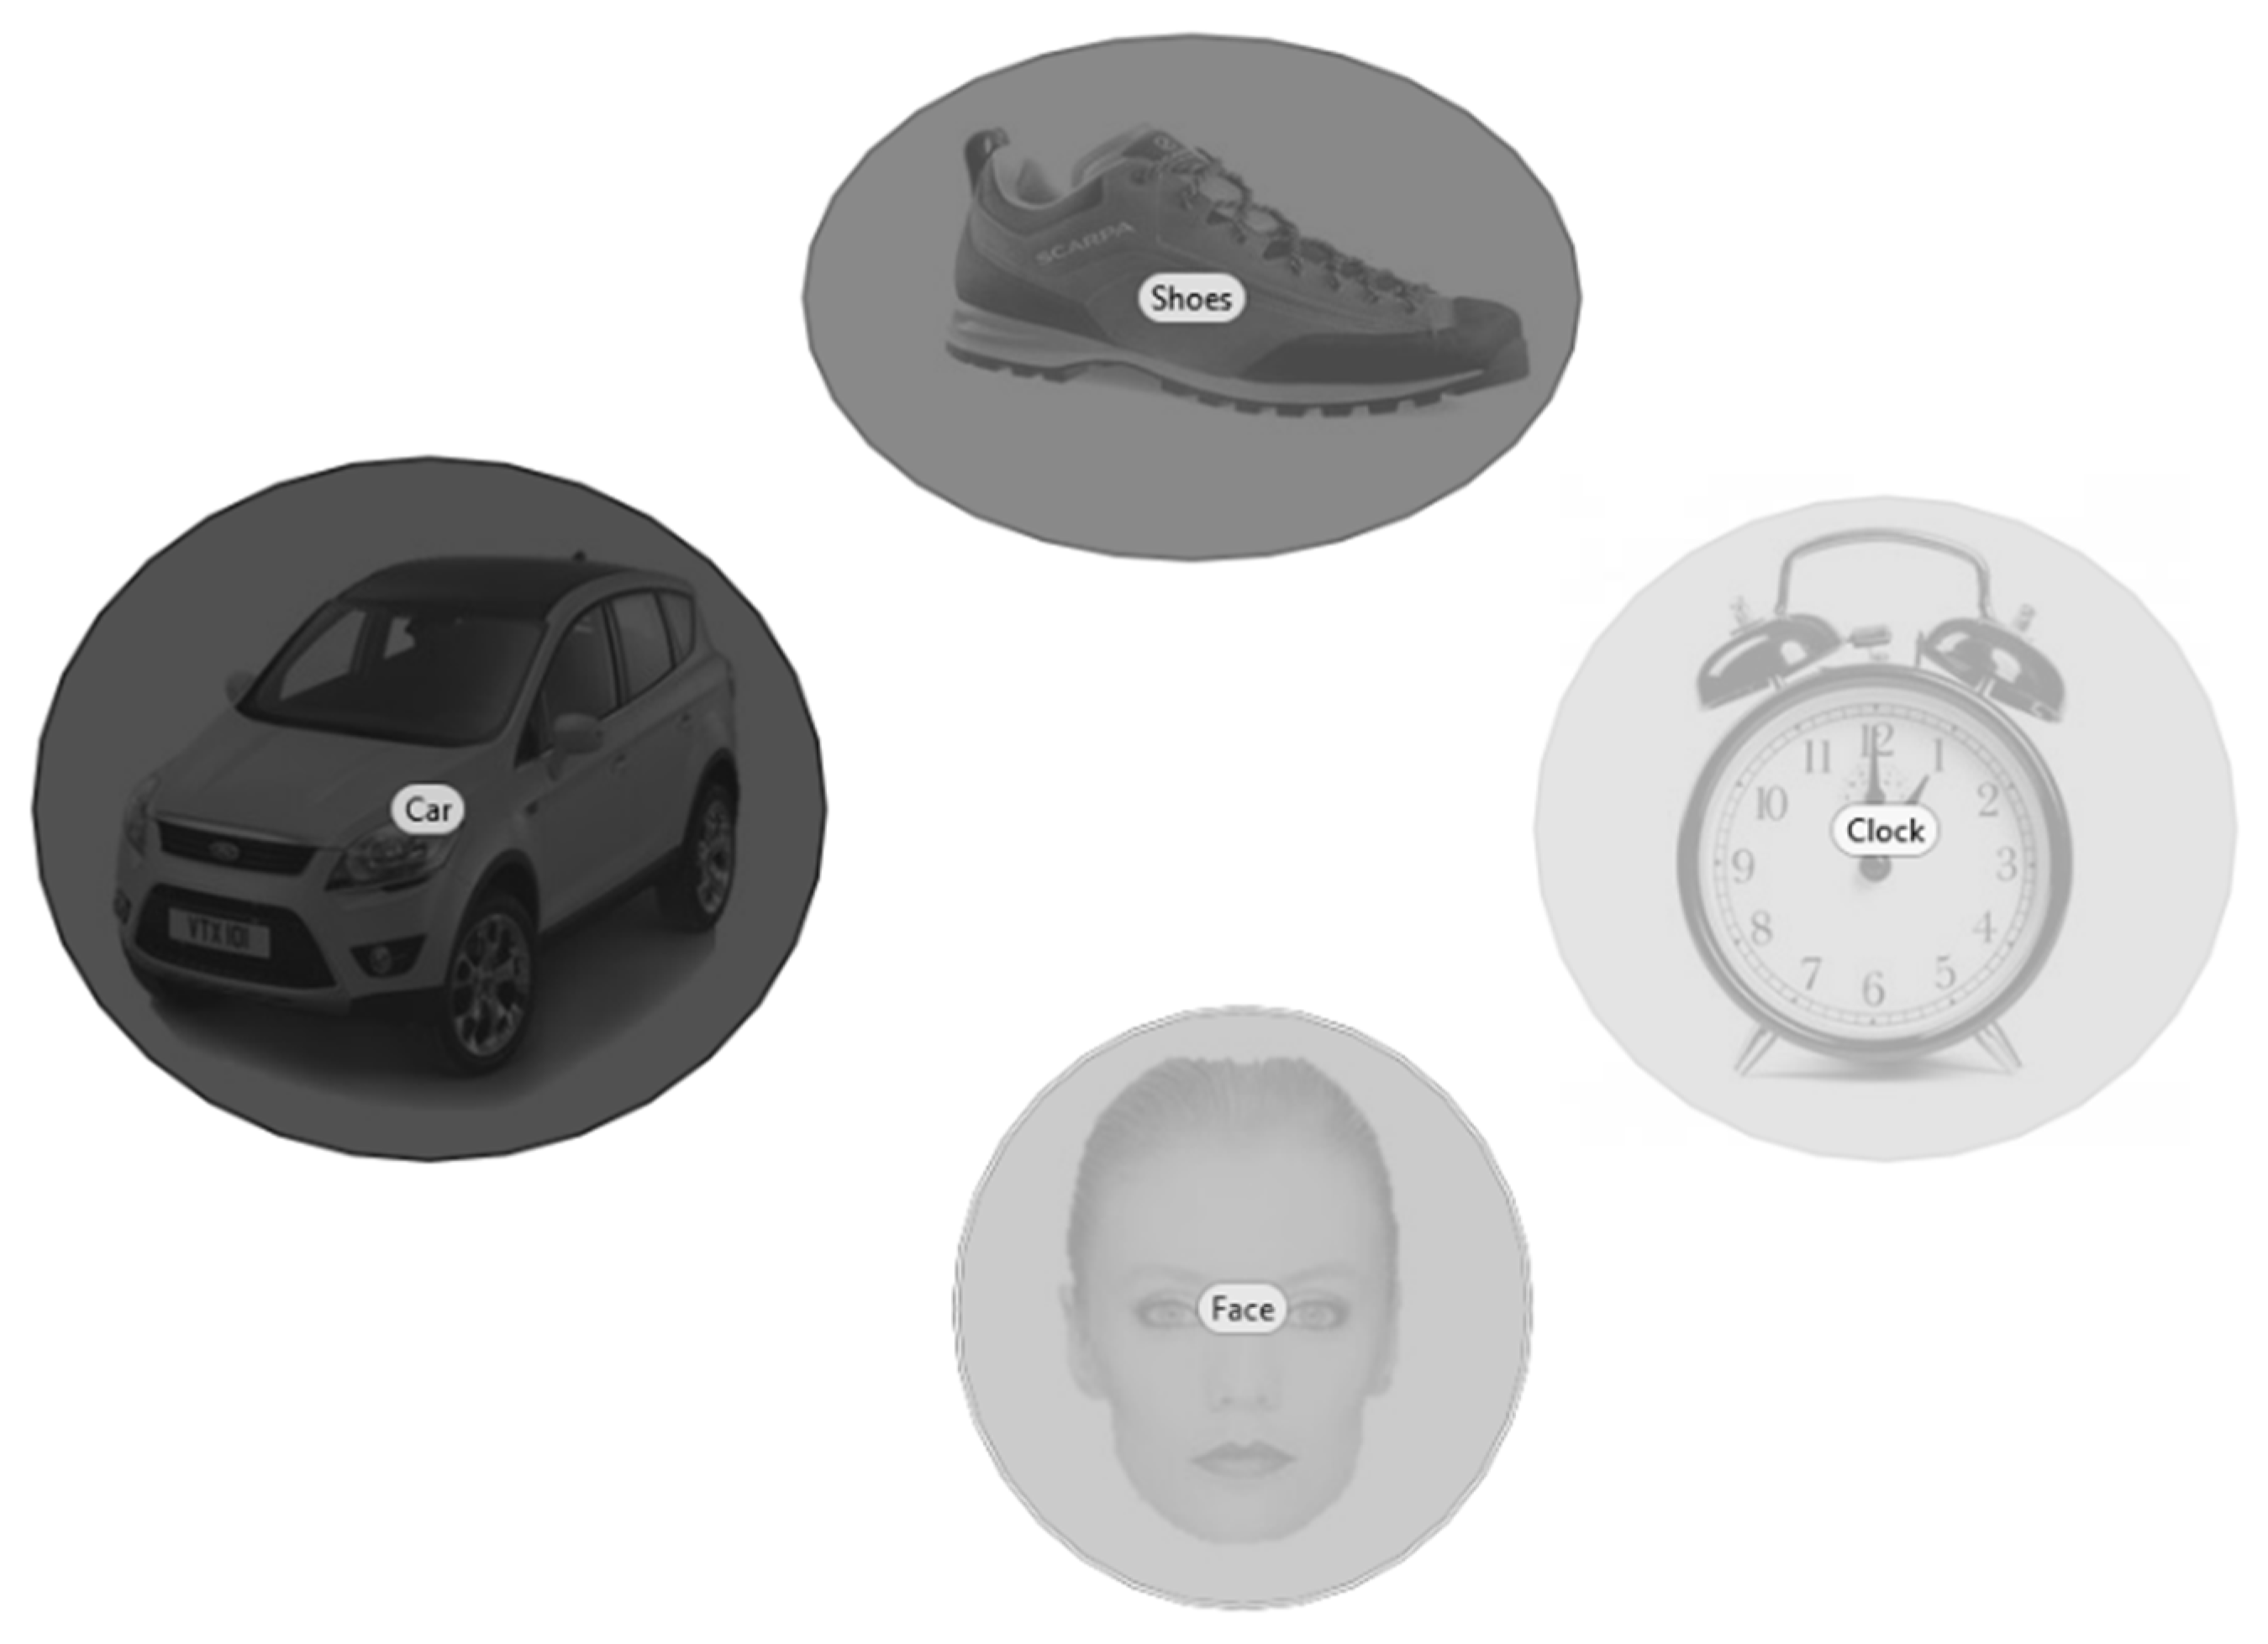
2.2. Experimental Paradigm
2.3. Apparatus
2.4. Procedure
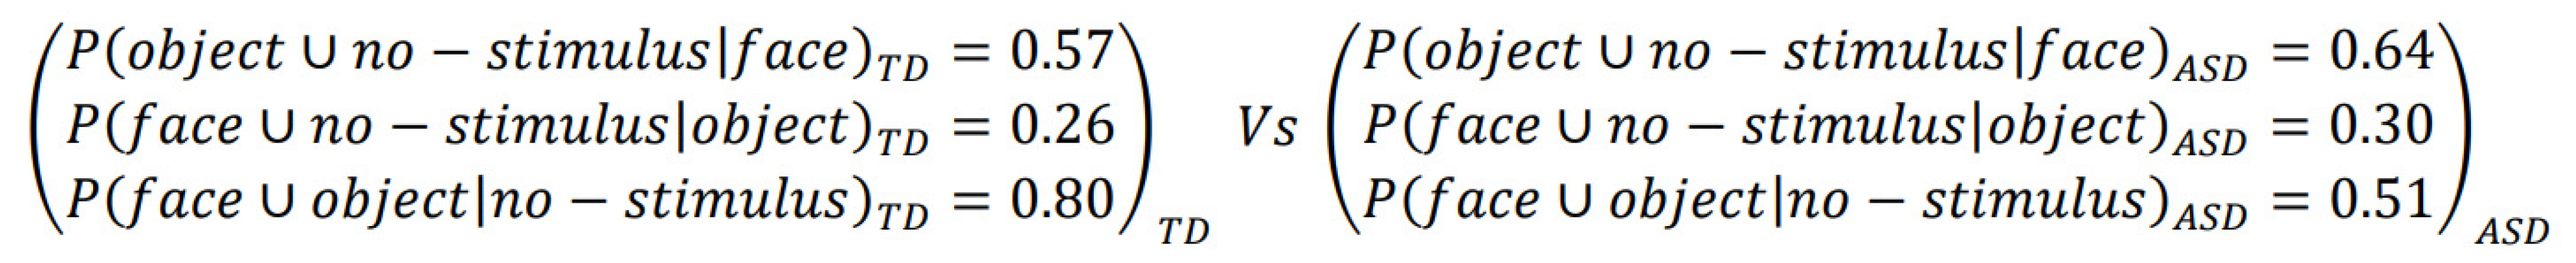
3. Data Analysis
4. Results
5. Discussion
6. Conclusions
Author Contributions
Funding
Institutional Review Board Statement
Informed Consent Statement
Data Availability Statement
Conflicts of Interest
References
- Di Giorgio, E.; Frasnelli, E.; Salva, O.R.; Scattoni, M.L.; Puopolo, M.; Tosoni, D. Corrigendum: Difference in Visual Social Predispositions Between Newborns at Low-and High-risk for Autism. Sci. Rep. 2016, 6, 26395. [Google Scholar] [CrossRef] [Green Version]
- Happé, F.; Frith, U. Annual research review: Towards a developmental neuroscience of atypical social cognition. J. Child Psychol. Psychiatry 2014, 55, 553–577. [Google Scholar] [CrossRef] [PubMed]
- de Haan, M.; Johnson, M.H.; Halit, H. Development of face-sensitive event-related potentials during infancy: A review. Int. J. Psychophysiol. 2003, 51, 45–58. [Google Scholar] [CrossRef]
- Simion, F.; Di Giorgio, E.; Leo, I.; Bardi, L. The processing of social stimuli in early infancy: From faces to biological motion perception. Prog. Brain Res. 2011, 189, 173–193. [Google Scholar] [CrossRef]
- Valenza, E.; Leo, I.; Gava, L.; Simion, F. Perceptual completion in newborn human infants. Child Dev. 2006, 77, 1810–1821. [Google Scholar] [CrossRef] [PubMed]
- Mazza, M.; Mariano, M.; Peretti, S.; Masedu, F.; Pino, M.C.; Valenti, M. The Role of Theory of Mind on Social Information Processing in Children with autism spectrum disorders: A Mediation Analysis. J. Autism Dev. Disord. 2017, 47, 1369–1379. [Google Scholar] [CrossRef]
- Pino, M.C.; Mazza, M.; Mariano, M.; Peretti, S.; Dimitriou, D.; Masedu, F.; Valenti, M.; Franco, F. Simple Mindreading Abilities Predict Complex Theory of Mind: Developmental Delay in autism spectrum disorders. J. Autism Dev. Disord. 2017, 47, 2743–2756. [Google Scholar] [CrossRef] [PubMed]
- Treisman, A.M.; Gelade, G. A feature-integration theory of attention. Cogn. Psychol. 1980, 12, 97–136. [Google Scholar] [CrossRef]
- Bindemann, M.; Burton, A.M.; Hooge, I.T.; Jenkins, R.; de Haan, E.H. Faces retain attention. Psychon. Bull. Rev. 2005, 12, 1048–1053. [Google Scholar] [CrossRef] [Green Version]
- Di Giorgio, E.; Leo, I.; Pascalis, O.; Simion, F. Is the face-perception system human-specific at birth? Dev. Psychol. 2012, 48, 1083–1090. [Google Scholar] [CrossRef]
- Fletcher-Watson, S.; Findlay, J.M.; Leekam, S.R.; Benson, V. Rapid detection of person information in a naturalistic scene. Perception 2008, 37, 571–583. [Google Scholar] [CrossRef] [PubMed]
- Lewis, M.B.; Edmonds, A.J. Searching for faces in scrambled scenes. Vis. Cogn. 2005, 12, 1309–1336. [Google Scholar] [CrossRef]
- Gliga, T.; Elsabbagh, M.; Andravizou, A.; Johnson, M. Faces attract infants’ attention in complex displays. Infancy 2009, 14, 550–562. [Google Scholar] [CrossRef]
- Johnson, M.H.; Dziurawiec, S.; Ellis, H.; Morton, J. Newborns’ preferential tracking of face-like stimuli and its subsequent decline. Cognition 1991, 40, 1–19. [Google Scholar] [CrossRef]
- Valenza, E.; Simion, F.; Cassia, V.M.; Umiltà, C. Face preference at birth. J. Exp. Psychol. Hum. Percept. Perform. 1996, 22, 892. [Google Scholar] [CrossRef]
- Farroni, T.; Johnson, M.H.; Menon, E.; Zulian, L.; Faraguna, D.; Csibra, G. Newborns’ preference for face-relevant stimuli: Effects of contrast polarity. Proc. Natl. Acad. Sci. USA 2005, 102, 17245–17250. [Google Scholar] [CrossRef] [Green Version]
- Valenti, M.; Vagnetti, R.; Masedu, F.; Pino, M.C.; Rossi, A.; Scattoni, M.L.; Mazza, M.; Eagle Group. Register-based cumulative prevalence of autism spectrum disorders during childhood and adolescence in Central Italy. Epidemiol. Biostat. Public Health 2019, 16. [Google Scholar] [CrossRef]
- Webb, S.J.; Neuhaus, E.; Faja, S. Face perception and learning in autism spectrum disorders. Q. J. Exp. Psychol. 2017, 70, 970–986. [Google Scholar] [CrossRef] [PubMed]
- Pino, M.C.; Masedu, F.; Vagnetti, R.; Attanasio, M.; Di Giovanni, C.; Valenti, M.; Mazza, M. Validity of Social Cognition Measures in the Clinical Services for Autism Spectrum Disorder. Front. Psychol. 2020, 11, 4. [Google Scholar] [CrossRef] [Green Version]
- Pino, M.C.; Vagnetti, R.; Masedu, F.; Attanasio, M.; Tiberti, S.; Valenti, M.; Mazza, M. Mapping the Network of Social Cognition Domains in Children With Autism Spectrum Disorder Through Graph Analysis. Front. Psychiatry 2020, 11, 579339. [Google Scholar] [CrossRef]
- Vagnetti, R.; Pino, M.C.; Masedu, F.; Peretti, S.; Le Donne, I.; Rossi, R.; Valenti, M.; Mazza, M. Exploring the social cognition network in young adults with autism spectrum disorder using graph analysis. Brain Behav. 2020, 10, e01524. [Google Scholar] [CrossRef] [PubMed] [Green Version]
- Frank, M.C.; Amso, D.; Johnson, S.P. Visual search and attention to faces during early infancy. J. Exp. Child Psychol. 2014, 118, 13–26. [Google Scholar] [CrossRef] [PubMed] [Green Version]
- Sasson, N.J.; Turner-Brown, L.M.; Holtzclaw, T.N.; Lam, K.S.; Bodfish, J.W. Children with autism demonstrate circumscribed attention during passive viewing of complex social and nonsocial picture arrays. Autism Res. 2008, 1, 31–42. [Google Scholar] [CrossRef] [Green Version]
- Hosozawa, M.; Tanaka, K.; Shimizu, T.; Nakano, T.; Kitazawa, S. How children with specific language impairment view social situations: An eye tracking study. Pediatrics 2012, 129, e1453–e1460. [Google Scholar] [CrossRef] [Green Version]
- Chawarska, K.; Macari, S.; Shic, F. Context modulates attention to social scenes in toddlers with autism. J. Child Psychol. Psychiatry 2012, 53, 903–913. [Google Scholar] [CrossRef] [Green Version]
- Pelphrey, K.; Sasson, N.J.; Reznick, J.S.; Paul, G.; Goldman, B.D.; Piven, J. Visual scanning of faces in autism. J. Autism Dev. Disord. 2002, 32, 249–261. [Google Scholar] [CrossRef]
- Senju, A.; Tojo, Y.; Dairoku, H.; Hasegawa, T. Reflexive orienting in response to eye gaze and an arrow in children with and without autism. J. Child Psychol. Psychiatry 2004, 45, 445–458. [Google Scholar] [CrossRef]
- Sasson, N.J.; Touchstone, E.W. Visual attention to competing social and object images by preschool children with autism spectrum disorder. J. Autism Dev. Disord. 2014, 44, 584–592. [Google Scholar] [CrossRef]
- Sadria, M.; Karimi, S.; Layton, A.T. Network centrality analysis of eye-gaze data in autism spectrum disorder. Comput. Biol. Med. 2019, 111, 103332. [Google Scholar] [CrossRef]
- Fletcher-Watson, S.; Leekam, S.R.; Benson, V.; Frank, M.C.; Findlay, J.M. Eye-movements reveal attention to social information in autism spectrum disorder. Neuropsychologia 2009, 47, 248–257. [Google Scholar] [CrossRef] [PubMed] [Green Version]
- Carette, R.; Elbattah, M.; Cilia, F.; Dequen, G.; Guérin, J.L.; Bosche, J. Learning to Predict Autism Spectrum Disorder based on the Visual Patterns of Eye-tracking Scanpaths. In Proceedings of the 12th International Joint Conference on Biomedical Engineering Systems and Technologies—HEALTHINF, Prague, Czech Republic, 22–24 February 2019; pp. 103–112. [Google Scholar] [CrossRef]
- Jiang, M.; Francis, S.M.; Srishyla, D.; Conelea, C.; Zhao, Q.; Jacob, S. Classifying individuals with ASD through facial emotion recognition and eye-tracking. In Proceedings of the 2019 41th Annual International Conference of the IEEE Engineering in Medicine and Biology Society (EMBC), Berlin, Germany, 23–27 July 2019; pp. 6063–6068. [Google Scholar] [CrossRef]
- Vu, T.; Tran, H.; Cho, K.W.; Song, C.; Lin, F.; Chen, C.W.; Hartley-McAndrew, M.; Doody, K.R.; Xu, W. Effective and efficient visual stimuli design for quantitative autism screening: An exploratory study. In Proceedings of the 2017 IEEE EMBS International Conference on Biomedical & Health Informatics (BHI), Orlando, FL, USA, 16–19 February 2017; pp. 297–300. [Google Scholar] [CrossRef]
- Kollias, K.F.; Syriopoulou-Delli, C.K.; Sarigiannidis, P.; Fragulis, G.F. The Contribution of Machine Learning and Eye-Tracking Technology in Autism Spectrum Disorder Research: A Systematic Review. Electronics 2021, 10, 2982. [Google Scholar] [CrossRef]
- Gagniuc, P.A. Markov Chains: From Theory to Implementation and Experimentation; John Wiley & Sons: Hoboken, NJ, USA, 2017. [Google Scholar] [CrossRef]
- Ulutas, B.H.; Özkan, N.F.; Michalski, R. Application of hidden Markov models to eye tracking data analysis of visual quality inspection operations. Cent. Eur. J. Oper. Res. 2019, 28, 761–777. [Google Scholar] [CrossRef] [Green Version]
- Kim, J.; Singh, S.; Thiessen, E.D.; Fisher, A.V. A hidden Markov model for analyzing eye-tracking of moving objects. Behav. Res. Methods 2020, 52, 1225–1243. [Google Scholar] [CrossRef] [Green Version]
- Jansen, A.R.; Marriott, K.; Yelland, G.W. Parsing of algebraic expressions by experienced users of mathematics. Eur. J. Cogn. Psychol. 2007, 19, 286–320. [Google Scholar] [CrossRef]
- Zhong, M.; Zhao, X.; Zou, X.C.; Wang, J.Z.; Wang, W. Markov chain based computational visual attention model that learns from eye tracking data. Pattern Recognit. Lett. 2014, 49, 1–10. [Google Scholar] [CrossRef]
- Devlin, S.P.; Riggs, S.L. Analyzing eye tracking data using a Markovian framework to assess differences in scan patterns. In Proceedings of the Human Factors and Ergonomics Society Annual Meeting, Austin, TX, USA, 9–13 October 2017; SAGE Publications: Los Angeles, CA, USA, 2017; Volume 61, pp. 1814–1818. [Google Scholar]
- Alie, D.; Mahoor, M.H.; Mattson, W.I.; Anderson, D.R.; Messinger, D.S. Analysis of eye gaze pattern of infants at risk of autism spectrum disorder using markov models. In Proceedings of the 2011 IEEE Workshop on Applications of Computer Vision (WACV), Kona, HI, USA, 5–7 January 2011; pp. 282–287. [Google Scholar]
- American Psychiatric Association. Diagnostic and Statistical Manual of Mental Disorders; DSM-V, 5 the dn; American Psychiatric Publishing: Arlington, VA, USA, 2013. [Google Scholar]
- Lord, C.; Rutter, M.; DiLavore, P.C.; Risi, S.; Gotham, K.; Bishop, S.L. Autism Diagnostic Observation Schedule, 2nd ed.; (ADOS-2) Manual (Part I): Modules 1–4; Western Psychological Services: Torrence, CA, USA, 2012. [Google Scholar]
- Hessels, R.S.; Kemner, C.; van den Boomen, C.; Hooge, I.T. The area-of-interest problem in eyetracking research: A noise-robust solution for face and sparse stimuli. Behav. Res. Methods 2016, 48, 1694–1712. [Google Scholar] [CrossRef] [Green Version]
- Sison, C.P.; Glaz, J. Simultaneous confidence intervals and sample size determination for multinomial proportions. J. Am. Stat. Assoc. 1995, 90, 366–369. [Google Scholar] [CrossRef]
- Kullback, S.; Kupperman, M.; Ku, H. Tests for Contingency Tables and Marltov Chains. Technometrics 1962, 4, 573–608. [Google Scholar] [CrossRef]
- R Core Team. R: A Language and Environment for Statistical Computing; R Foundation for Statistical Computing: Vienna, Austria, 2020. [Google Scholar]
- Spedicato, G.A. Discrete time Markov chains with R. R J. 2017, 9, 84–104. [Google Scholar] [CrossRef]
- Allen, G.; Courchesne, E. Attention function and dysfunction in autism. Front. Biosci. 2001, 6, 105–119. [Google Scholar] [CrossRef] [Green Version]
- Elsabbagh, M.; Holmboe, K.; Gliga, T.; Mercure, E.; Hudry, K.; Charman, T.; Baron-Cohen, S.; Bolton, P.; Johnson, M.H.; BASIS Team. Social and attention factors during infancy and the later emergence of autism characteristics. In Progress in Brain Research; Elsevier: Amsterdam, The Netherlands, 2011; Volume 189, pp. 195–207. [Google Scholar]
- Luna, B.; Doll, S.K.; Hegedus, S.J.; Minshew, N.J.; Sweeney, J.A. Maturation of executive function in autism. Biol. Psychiatry 2007, 61, 474–481. [Google Scholar] [CrossRef]
- Townsend, J.; Harris, N.S.; Courchesne, E. Visual attention abnormalities in autism: Delayed orienting to location. J. Int. Neuropsychol. Soc. 1996, 2, 541–550. [Google Scholar] [CrossRef]
- van der Geest, J.N.; Kemner, C.; Camfferman, G.; Verbaten, M.N.; van Engeland, H. Eye movements, visual attention, and autism: A saccadic reaction time study using the gap and overlap paradigm. Biol. Psychiatry 2001, 50, 614–619. [Google Scholar] [CrossRef]
- Elsabbagh, M.; Fernandes, J.; Webb, S.J.; Dawson, G.; Charman, T.; Johnson, M.H.; British Autism Study of Infant Siblings Team. Disengagement of visual attention in infancy is associated with emerging autism in toddlerhood. Biol. Psychiatry 2013, 74, 189–194. [Google Scholar] [CrossRef] [Green Version]
- Farrant, K.; Uddin, L.Q. Atypical developmental of dorsal and ventral attention networks in autism. Dev. Sci. 2016, 19, 550–563. [Google Scholar] [CrossRef] [Green Version]


| TD (N = 18) Mean (SD) | ASD (N = 18) Mean (SD) | T | p | |
|---|---|---|---|---|
| Age in month | 29.7 (4.84) | 30.7 (3.04) | −0.74 | 0.46 |
| Gender | 7 F; 11 M | 4 F; 14 M | 0.47 | |
| ADOS-2 Toddler Module | ||||
| Social Affect | 15.2 (3.27) | |||
| Restricted and Repetitive Behavior | 3.40 (2.07) | |||
| Total | 18.6 (4.5) | |||
| ADOS-2 Module 1 | ||||
| Social Affect | 12.7 (4.65) | |||
| Restricted and Repetitive Behavior | 4.23 (1.58) | |||
| Total | 17.0 (5.83) |
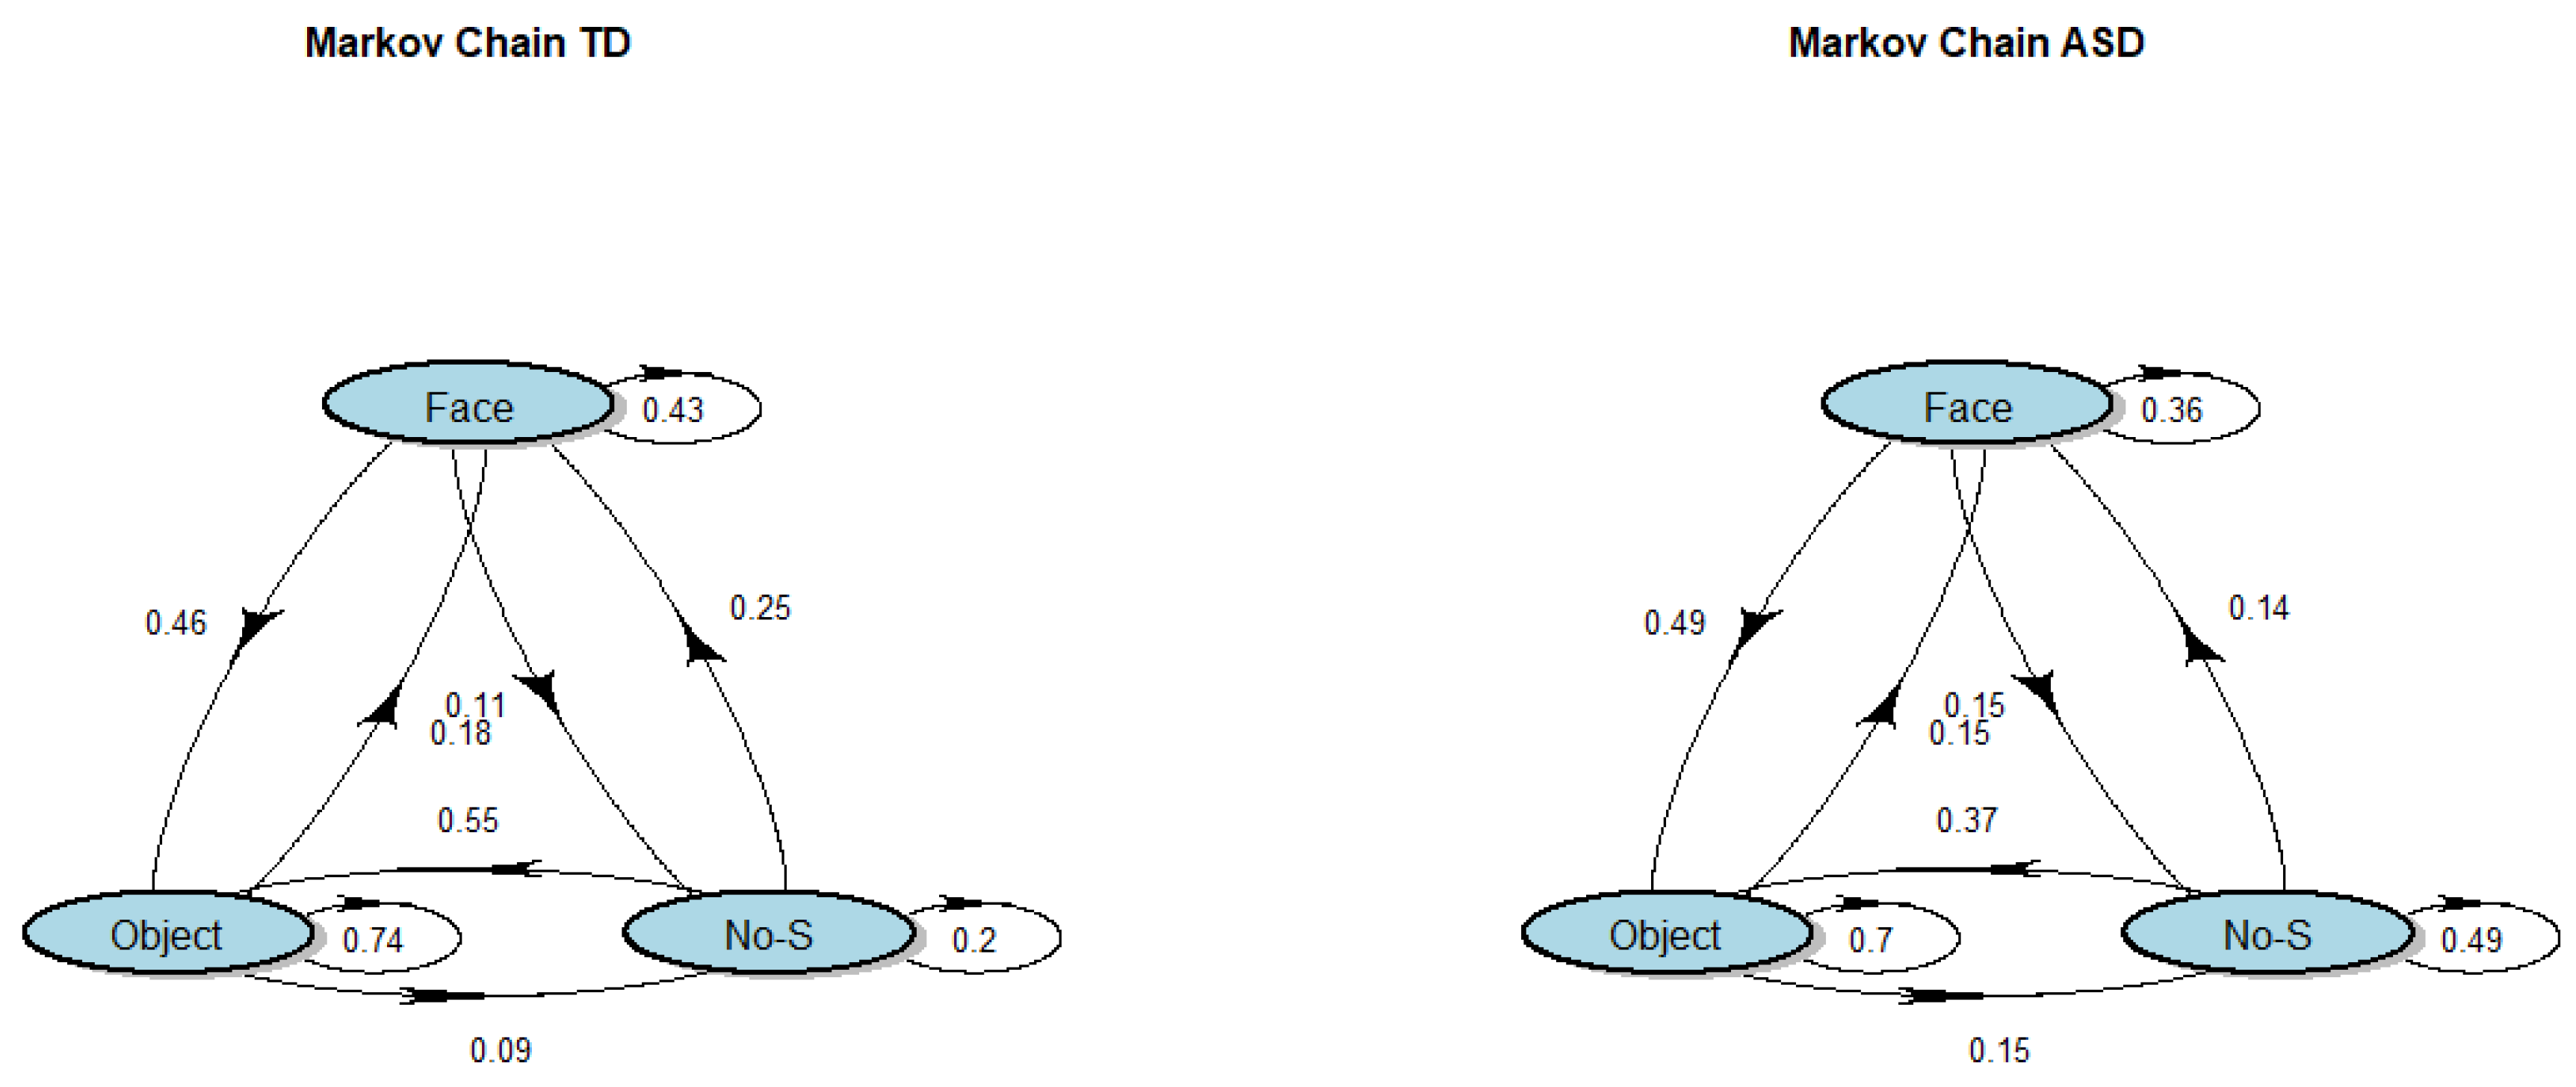
| Group | FACE | OBJECT | NO-STIMULUS | |
|---|---|---|---|---|
| FACE | TD | 0.43 [0.40–0.46] | 0.46 [0.43–0.50] | 0.11 [0.09–0.12] |
| ASD | 0.36 [0.29–0.43] | 0.49 [0.41–0.57] | 0.15 [0.10–0.19] | |
| OBJECT | TD | 0.18 [0.16–0.19] | 0.74 [0.71–0.76] | 0.08 * [0.08–0.10] |
| ASD | 0.15 [0.13–0.18] | 0.70 [0.65–0.76] | 0.15 * [0.12–0.17] | |
| NO-STIMULUS | TD | 0.25 * [0.21–0.29] | 0.55 * [0.49–0.60] | 0.20 * [0.17–0.24] |
| ASD | 0.14 * [0.10–0.18] | 0.37 * [0.30–0.43] | 0.49 * [0.41–0.57] |
| FACE | OBJECT | NO-STIMULUS | |
|---|---|---|---|
| TD | 0.25 [0.24–0.26] | 0.65 [0.64–0.66] | 0.10 [0.09–0.11] |
| ASD | 0.19 [0.17–0.21] | 0.59 [0.56–0.62] | 0.22 [0.20–0.24] |
Publisher’s Note: MDPI stays neutral with regard to jurisdictional claims in published maps and institutional affiliations. |
© 2021 by the authors. Licensee MDPI, Basel, Switzerland. This article is an open access article distributed under the terms and conditions of the Creative Commons Attribution (CC BY) license (https://creativecommons.org/licenses/by/4.0/).
Share and Cite
Masedu, F.; Vagnetti, R.; Pino, M.C.; Valenti, M.; Mazza, M. Comparison of Visual Fixation Trajectories in Toddlers with Autism Spectrum Disorder and Typical Development: A Markov Chain Model. Brain Sci. 2022, 12, 10. https://doi.org/10.3390/brainsci12010010
Masedu F, Vagnetti R, Pino MC, Valenti M, Mazza M. Comparison of Visual Fixation Trajectories in Toddlers with Autism Spectrum Disorder and Typical Development: A Markov Chain Model. Brain Sciences. 2022; 12(1):10. https://doi.org/10.3390/brainsci12010010
Chicago/Turabian StyleMasedu, Francesco, Roberto Vagnetti, Maria Chiara Pino, Marco Valenti, and Monica Mazza. 2022. "Comparison of Visual Fixation Trajectories in Toddlers with Autism Spectrum Disorder and Typical Development: A Markov Chain Model" Brain Sciences 12, no. 1: 10. https://doi.org/10.3390/brainsci12010010
APA StyleMasedu, F., Vagnetti, R., Pino, M. C., Valenti, M., & Mazza, M. (2022). Comparison of Visual Fixation Trajectories in Toddlers with Autism Spectrum Disorder and Typical Development: A Markov Chain Model. Brain Sciences, 12(1), 10. https://doi.org/10.3390/brainsci12010010