1. Introduction
The cerebellum is commonly seen as a structure that is primarily responsible for the coordination of voluntary movement, gait, posture, and speech [
1,
2,
3]. Recent research has shown there is clear evidence that the cerebellum is responsible not only for motor functions but also for cognition [
1,
4].
Based on cerebellar anatomy, it is not difficult to theoretically conclude that the cerebellum could be involved in cognition; i.e., we have approximately 16 billion neurons in the cerebral cortex compared to 69 billion neurons in the cerebellum, and the same analogy applies to cerebellar connections [
1,
5]. The cerebellum is connected to the brain via three peduncles (superior, middle, and inferior cerebellar peduncles), which form cerebellar pathways and connections to the brain. There are several afferent tracts (
cortico-ponto-cerebellar,
cortico-olivo-cerebellar,
cortico-reticulo-cerebellar,
spinocerebellar,
dorsal spinocerebellar,
ventral spinocerebellar,
cuneocerebellar,
vestibulocerebellar,
rostral spinocerebellar tract,
and vestibulocerebellar tract) and efferent tracts (
rubrospinal tract and cerebellovestibular tract) [
5,
6]. These tracts connect to the sensorimotor and association areas of the cerebral cortex [
7]. In functional magnetic resonance studies (fMRI), the functional topography of the cerebellum shows that sensorimotor tasks engage the cerebellar anterior lobe and lobule VIII, and cognitive tasks activate the posterolateral cerebellar hemispheres [
8,
9,
10]. Neuroimaging studies suggest that the cerebellum forms anatomical connections with the prefrontal cortex, which is important for normal cognitive function [
11,
12,
13]. Additionally, there is evidence that abnormal prefrontal–cerebellar connections are seen in patients with autism [
14,
15] and schizophrenia [
16].
In terms of cerebellar contribution to cognition, several mechanisms have been described. In particular,
cerebellar cognitive affective syndrome (CGAS) is characterized by impaired executive function (including planning, set-shifting, abstract reasoning, verbal fluency, working memory), visuospatial memory and perception impairment, personality changes, and impaired verbal fluency. These impairments were seen in patients with large, bilateral, or pan-cerebellar disorders. Cerebellar lesions were located in the posterior lobe, vermis, and anterior lobe [
1,
17,
18].
In
cerebellar stroke, lesion location is associated either with motor or cognitive deficits; i.e., anterior lobe lesions usually impact motor functions, and posterior lobe lesions are associated with worse cognitive scores [
8,
10,
18].
It is important to note
cerebellar changes with aging; i.e., with aging, there is a 10% to 40% decrease in the Purkinje cell layer and reduction in dorsal vermis volume [
1,
19,
20]. While the cerebellum is not the primary region of interest in aging and cognition, cell loss in this region could potentially lead to functional changes [
1].
In recent studies, there is evidence that the cerebellum contributes to cognitive functioning, and, thus, it should be noted when analyzing magnetic resonance examinations in patients with cognitive impairment.
In our study, we evaluated cerebellar white matter volume and cerebellar cortex volume in participants with normal cognition, mild cognitive impairment, and moderate/severe cognitive impairment.
2. Materials and Methods
2.1. Participant Groups and Montreal Cognitive Assessment Cutoff Scores
Participants with suspected cognitive impairment were admitted to the neurologist. All participants were evaluated by the board-certified neurologist, and the Montreal Cognitive Assessment (MoCA) was carried out. All participants had at least 16 years of higher education. We divided participants into 3 groups [
21,
22]:
- 1.
Participants with normal cognition (NC) with MoCA scores ≥27;
- 2.
Participants with mild cognitive impairment (MCI) with MoCA scores ≥18 and ≤23;
- 3.
Participants with moderate and severe cognitive impairment (SCI) with MoCA scores ≤17.
We excluded participants with MoCA scores of 24, 25, and 26 as these scores are inconclusive and can provide false-positive or false-negative results. Scores lower than 23 are not healthy with 88% accuracy and scores ≥27 are not pathological with 91% accuracy [
23]. Participant demographic data and MoCA results based on the participant group are shown in
Table 1.
Exclusion criteria for participants were clinically significant neurological diseases (tumors, major stroke, malformations, etc.), drug use, and alcohol abuse. Study participants did not have other significant pathological findings on magnetic resonance imaging (MRI).
Based on the neurological assessment and MRI data, participants in MCI and SCI groups had mixed types of cognitive impairment; i.e., we did not have participants in MCI and SCI groups that had clear evidence of one type of dementia (vascular dementia, Alzheimer’s disease, Lewy body dementia, or frontotemporal dementia). All patients had at least some T2 white matter hyperintensities and some degree of global cortical atrophy in combination with other cerebral lobe atrophies.
2.2. Magnetic Resonance Imaging (MRI) Data Acquisition and Post-Processing with Freesurfer
MRI scans were performed on a single site 3T scanner in a university hospital setting. For cerebellar parcellation, we used a sagittal 3D T1-weighted MP RAGE (Magnetization Prepared Gradient Echo) sequence with 1 mm voxel size. Scans were converted from DICOM format to neuroimaging informatics technology initiative (NIfTI) files and then post-processed. Cortical reconstruction and volumetric segmentation were performed with the FreeSurfer 7.2.0. image analysis suite, which is documented and freely available for download online (
http://surfer.nmr.mgh.harvard.edu/, accessed on 1 July 2021). The technical details of FreeSurfer processing steps and procedures are described in prior publications [
24,
25,
26,
27,
28,
29,
30,
31,
32,
33,
34,
35,
36,
37,
38,
39,
40,
41,
42].
2.3. Statistical Analysis
Statistical analysis was performed by using the software JASP Version 0.14.1 (Amsterdam, Netherlands). We analyzed descriptive statistics in all participant groups and performed the Kruskal–Wallis test to identify statistically significant differences between groups. Furthermore, we analyzed descriptive statistics for each participant group for both cerebellar white matter volume and cortex volume, including mean, median, standard deviation, minimum, and maximum values.
3. Results
We compared total cerebellum volume, white matter volume and cortex volume in both cerebellar hemispheres and performed the Kruskal–Wallis test to evaluate statistical significance between groups. In addition, we calculated mean, median, standard deviation, minimum, and maximum values for each participant group. Results are grouped based on cerebellar anatomical parcellation—left hemisphere white matter and cortex volume, right hemisphere white matter and cortex volume, and total cerebellum volume.
3.1. Left Cerebellum White Matter Volume
Left cerebellum white matter volume data were acquired from FreeSurfer parcellation statistical data. The descriptive statistics of participant groups are shown in
Table 2.
Comparing mean values in groups, we found the highest values in the normal cognition participant group and the lowest values were found in the mild cognitive impairment group (
Figure 1).
The Kruskal–Wallis test was conducted to assess differences between groups. No statistically significant changes were found between participant groups (H (2) = 3.476, p = 0.176).
3.2. Left Cerebellum Cortex Volume
Left cerebellum cortex volume data were acquired from FreeSurfer parcellation statistical data. The descriptive statistics of participant groups are shown in
Table 3.
Comparing mean values in the groups, we found the highest values in the normal cognition participant group, the lowest values were found in the mild cognitive impairment group, and the highest variability was found in the moderate/severe cognitive impairment group (
Figure 2).
The Kruskal–Wallis test was conducted to assess differences between groups. No statistically significant changes were found between participant groups (H (2) = 0.970, p = 0.616).
3.3. Right Cerebellum White Matter Volume
Right cerebellum white matter volume data were acquired from parcellation statistical data. The descriptive statistics of participant groups are shown in
Table 4.
Comparing mean values in groups, we found the highest values in the normal cognition participant group, and the lowest values were found in the moderate/severe cognitive impairment group (
Figure 3).
The Kruskal–Wallis test was conducted to assess differences between groups. No statistically significant changes were found between participant groups (H (2) = 2.987, p = 0.225).
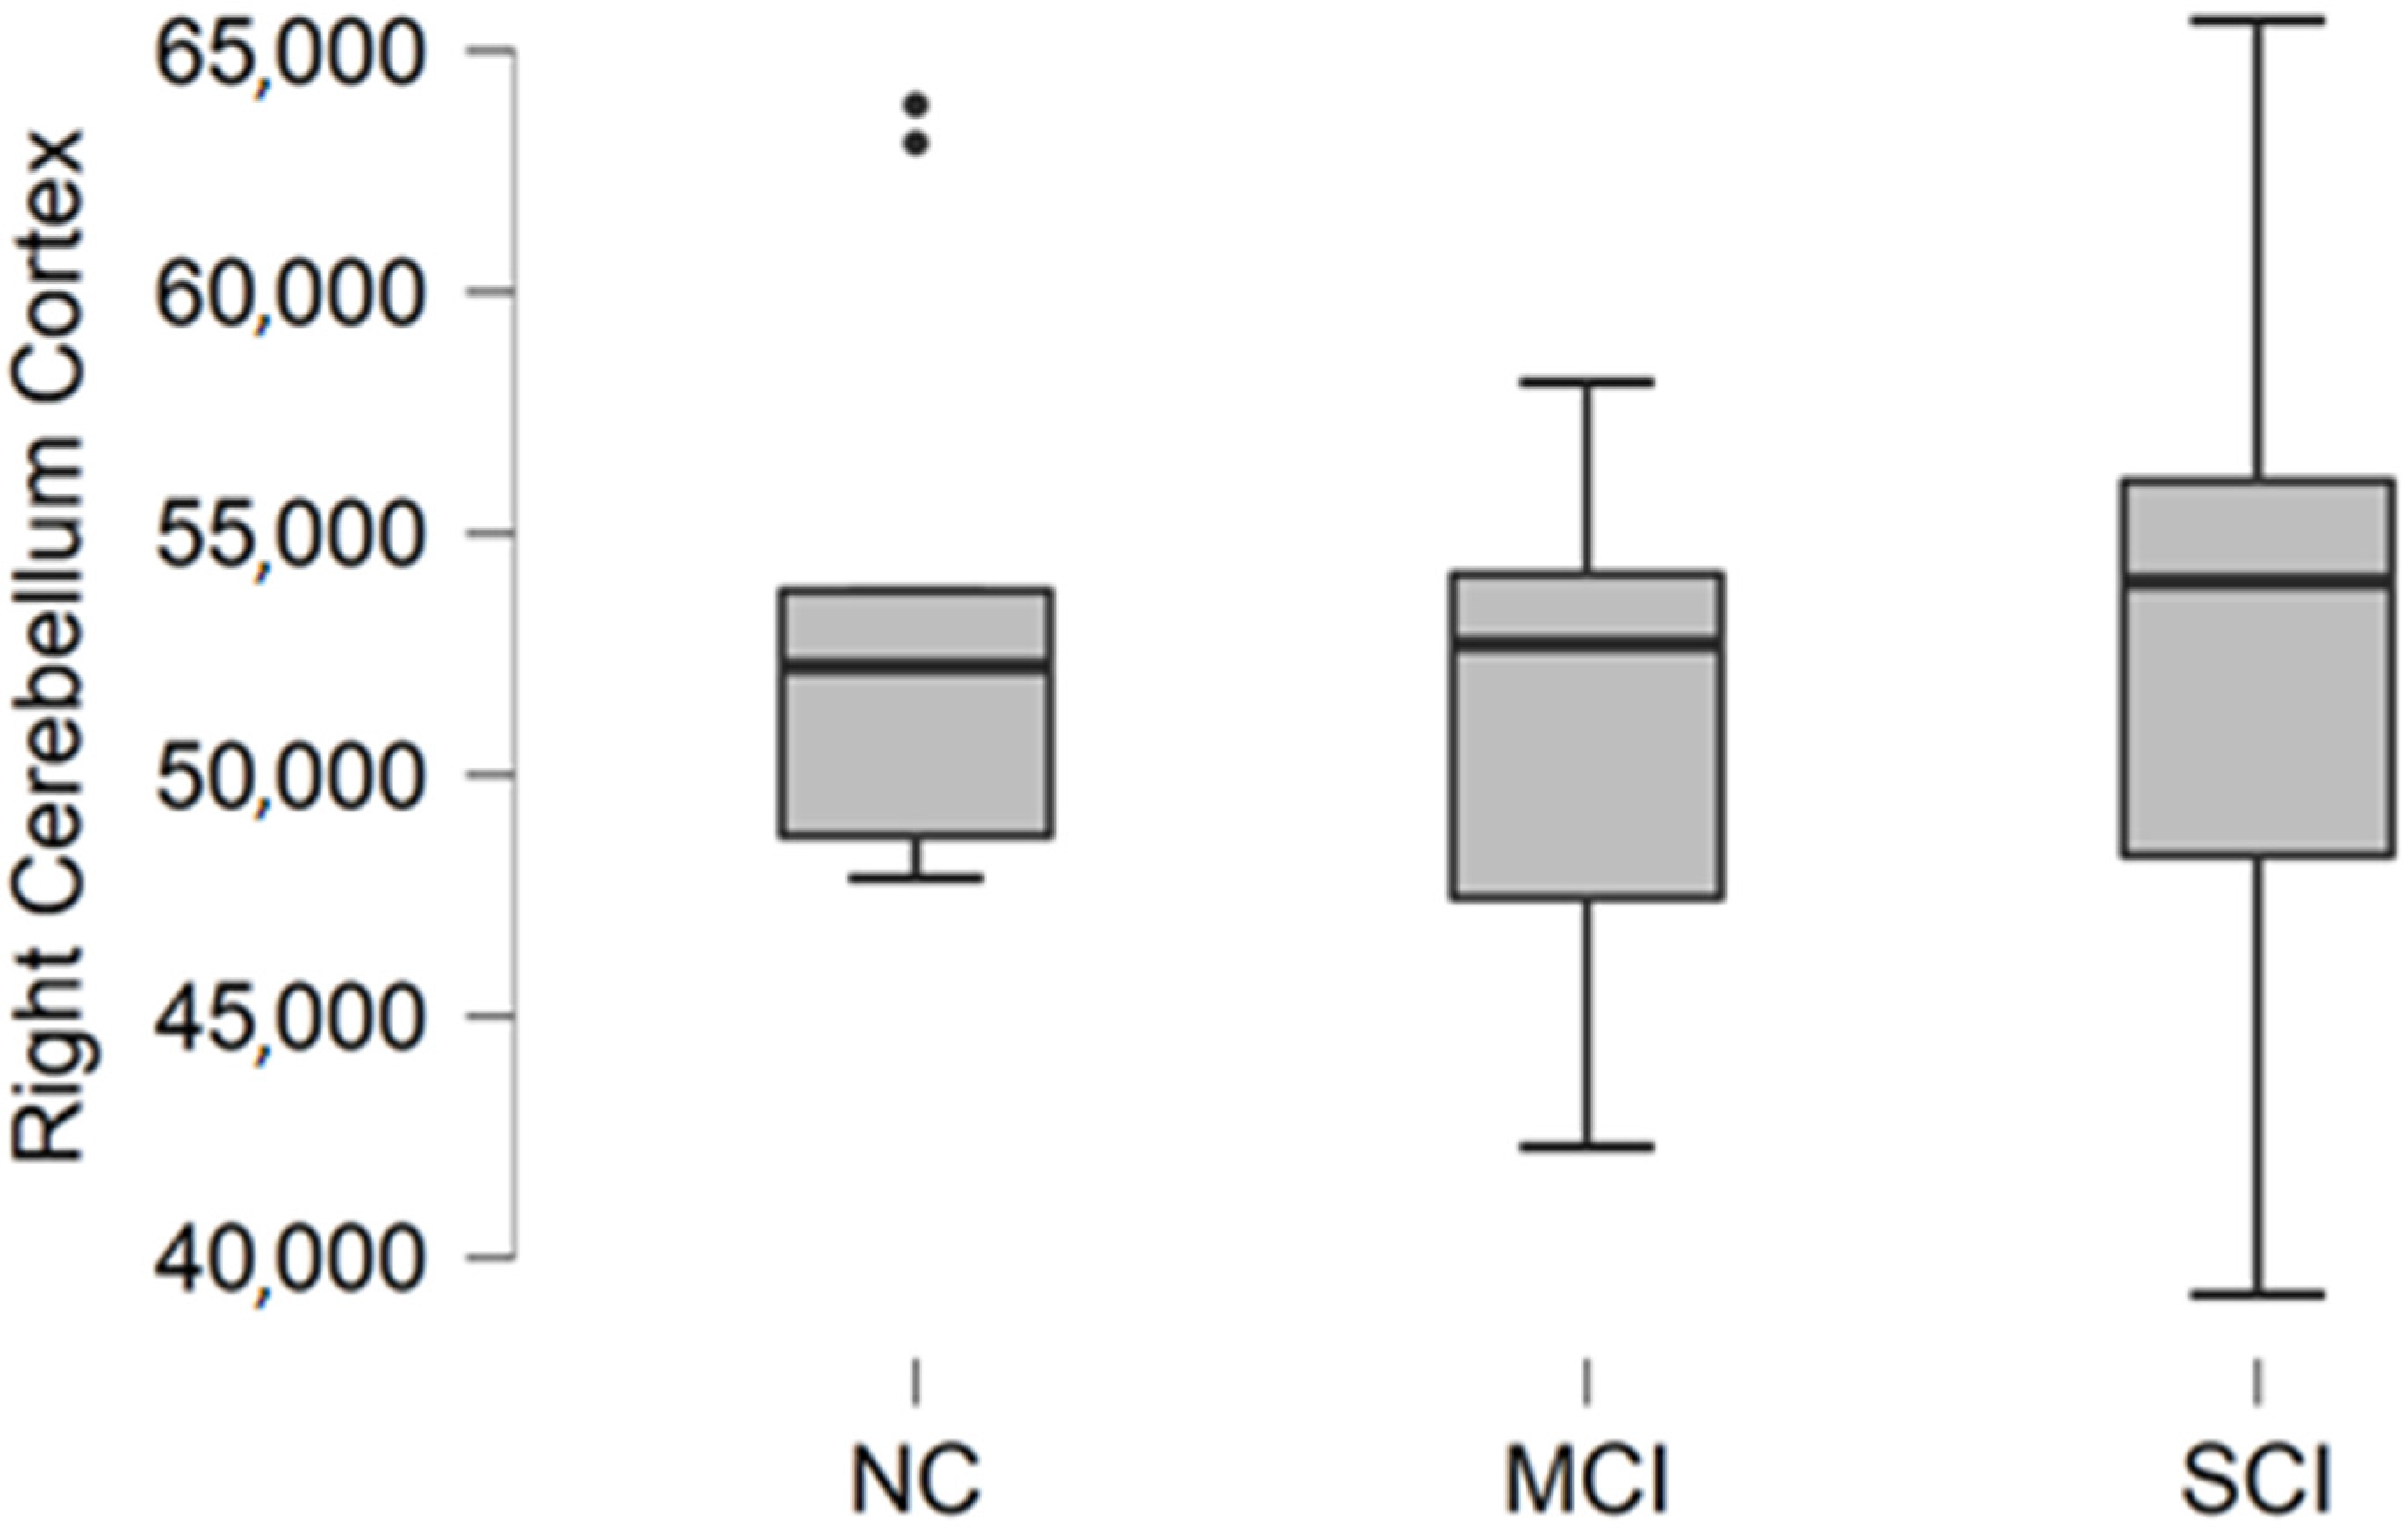
3.4. Right Cerebellum Cortex Volume
Right cerebellum cortex volume data were acquired from FreeSurfer parcellation statistical data. The descriptive statistics of participant groups are shown in
Table 5.
Comparing mean values in groups, we found the highest values in the normal cognition participant group, and the lowest values were found in the mild cognitive impairment group (
Figure 4).
The Kruskal–Wallis test was conducted to assess differences between groups. No statistically significant changes were found between participant groups (H (2) = 0.467, p = 0.792).
3.5. Total Cerebellum Volume
Total cerebellum volume was calculated as a sum of white matter and gray matter volume in the right and left cerebellum. The descriptive statistics of participant groups are shown in
Table 6.
Comparing mean values in groups, we found the highest values in the normal cognition participant group, and the lowest values were found in the mild cognitive impairment group (
Figure 5).
The Kruskal–Wallis test was conducted to assess differences between groups. No statistically significant changes were found between participant groups (H (2) = 1.188, p = 0.552).
4. Discussion
In our study, we focused on general cerebellar quantitative measurement, i.e., white matter and cortical volume in both cerebellar hemispheres.
Today, the cerebellum is recognized as an associative center of higher cognitive functions [
43,
44]. Thanks to the fMRI studies, it was possible to map functional cerebro-cerebellar connections and identify specific cerebellar regions that are responsible for cognition [
45].
Although the cerebellum contributes to cognition, when correlating cerebellar size, volume, or general structure, it has a poor correlation with cognitive tests. These findings have been reported in several articles:
Paradiso et al. correlated cerebellar volume with general intelligence, and although there was a positive correlation, it was not statistically significant [
46].
Bernard et al. analyzed the volume of several anatomical regions in the cerebellum (anterior part, crus 1, posterior part, and vermis) and correlated volumetric data with cognitive tasks (digit symbol, trails, spatial span, spatial learning, letter span, and verbal learning) and did not find a statistically significant relationship [
47].
Hoogenda et al. found a minor relationship between larger cerebellar volume and better cognition in healthy older adults, which further attenuated after correcting for cerebral volume, concluding that it is not the main leading structure in terms of cognition [
48].
Mitoma et al. in a consensus paper discussed cerebellar reserve and cerebellar cognitive reserve. The cerebellar reserve is defined as the capacity of the cerebellum to compensate and restore function in response to pathology. Regarding cerebellar cognitive reserve, there may be no structural or functional differences in different disease groups (i.e., Alzheimer’s disease, frontotemporal dementia, autism spectrum disorder, schizophrenia, and major depressive disorder) rather than compensatory reorganization changes that improve behavior and cognition [
49,
50].
In general, although we did not achieve statistically significant results in our study, it is important to be aware of cerebellar contribution to cognitive function, especially in diagnostic imaging in patients with cognitive impairment.
Further research is necessary to assess more detailed cerebellar anatomical volumetric measurements and correlate those findings with clinical data and cognitive testing.
Limitations
This was an exploratory study to assess the cerebellar white matter and cortical volume in association with cognitive impairment and dementia. The limitations of this study include cross-sectional design and a small participant cohort. In addition, it is necessary to note that there were significant differences in the mean age of the participants in study groups. The mean age for the NC group was younger than that for the MCI and SCI groups. Thus, we expected the differences between the NC group and either the MCI group or SCI group to be statistically significant, but we did not find any statistically significant differences.
5. Conclusions
In our study, we did not find statistically significant differences in cerebellar cortex volume and cerebellar white matter volume in participant groups with normal cognition, mild cognitive impairment, and dementia.
Author Contributions
Conceptualization, N.Z. and A.P.; methodology, N.Z., A.P., A.K., G.K. and O.G.; software, N.Z. and O.G.; validation, A.P. and G.K..; formal analysis, N.Z., A.P. and G.K.; investigation, A.K. and G.K.; resources, A.P. and G.K.; data curation, N.Z.; writing—original draft preparation, N.Z.; writing—review and editing, N.Z., A.P., A.K., G.K. and O.G.; visualization, N.Z.; supervision, A.P. and G.K.; project administration, N.Z. All authors have read and agreed to the published version of the manuscript.
Funding
The article has been developed with financing from the European Social Fund and the state budget within the project no. 8.2.2.0/20/I/004 “Support for involving doctoral students in scientific research and studies”.
Institutional Review Board Statement
The study was conducted according to the guidelines of the Declaration of Helsinki and approved by the Institutional Review Board of Riga East University Hospital (No. AP-144/10) and the Ethics committee at Riga East University Hospital Ethics Board (No. 08-A/19).
Informed Consent Statement
Informed consent was obtained from all subjects involved in the study.
Data Availability Statement
The data presented in this study are available on request from the corresponding author. The data are not publicly available due to data privacy.
Conflicts of Interest
The authors declare no conflict of interest.
References
- Rapoport, M.; van Reekum, R.; Mayberg, H. The Role of the Cerebellum in Cognition and Behavior. JNP 2000, 12, 193–198. [Google Scholar] [CrossRef]
- Manto, M.; Bower, J.M.; Conforto, A.B.; Delgado-García, J.M.; da Guarda, S.N.F.; Gerwig, M.; Habas, C.; Hagura, N.; Ivry, R.B.; Mariën, P.; et al. Consensus Paper: Roles of the Cerebellum in Motor Control—The Diversity of Ideas on Cerebellar Involvement in Movement. Cerebellum 2012, 11, 457–487. [Google Scholar] [CrossRef]
- Jimsheleishvili, S.; Dididze, M. Neuroanatomy, Cerebellum. In StatPearls; StatPearls Publishing: Treasure Island, FL, USA, 2021. [Google Scholar]
- Jacobs, H.I.L.; Hopkins, D.A.; Mayrhofer, H.C.; Bruner, E.; van Leeuwen, F.W.; Raaijmakers, W.; Schmahmann, J.D. The Cerebellum in Alzheimer’s Disease: Evaluating Its Role in Cognitive Decline. Brain 2018, 141, 37–47. [Google Scholar] [CrossRef] [PubMed]
- Herculano-Houzel, S. The Human Brain in Numbers: A Linearly Scaled-up Primate Brain. Front. Hum. Neurosci. 2009, 3, 31. [Google Scholar] [CrossRef]
- Voogd, J. The Human Cerebellum. J. Chem. Neuroanat. 2003, 26, 243–252. [Google Scholar] [CrossRef]
- Strick, P.L.; Dum, R.P.; Fiez, J.A. Cerebellum and Nonmotor Function. Annu. Rev. Neurosci. 2009, 32, 413–434. [Google Scholar] [CrossRef]
- Stoodley, C.J.; MacMore, J.P.; Makris, N.; Sherman, J.C.; Schmahmann, J.D. Location of Lesion Determines Motor vs. Cognitive Consequences in Patients with Cerebellar Stroke. NeuroImage Clin. 2016, 12, 765–775. [Google Scholar] [CrossRef]
- Keren-Happuch, E.; Chen, S.A.; Ho, M.R.; Desmond, J.E. A Meta-analysis of Cerebellar Contributions to Higher Cognition from PET and FMRI Studies. Hum. Brain Mapp 2012, 35, 593–615. [Google Scholar] [CrossRef]
- Stoodley, C.J.; Valera, E.M.; Schmahmann, J.D. Functional Topography of the Cerebellum for Motor and Cognitive Tasks: An FMRI Study. NeuroImage 2012, 59, 1560–1570. [Google Scholar] [CrossRef] [PubMed]
- Miller, E.K. The Prefontral Cortex and Cognitive Control. Nat. Rev. Neurosci. 2000, 1, 59–65. [Google Scholar] [CrossRef] [PubMed]
- Watson, T.; Becker, N.; Apps, R.; Jones, M. Back to Front: Cerebellar Connections and Interactions with the Prefrontal Cortex. Front. Syst. Neurosci. 2014, 8, 4. [Google Scholar] [CrossRef]
- Buckner, R.L.; Krienen, F.M.; Castellanos, A.; Diaz, J.C.; Yeo, B.T.T. The Organization of the Human Cerebellum Estimated by Intrinsic Functional Connectivity. J. Neurophysiol. 2011, 106, 2322–2345. [Google Scholar] [CrossRef]
- Fatemi, S.H.; Aldinger, K.A.; Ashwood, P.; Bauman, M.L.; Blaha, C.D.; Blatt, G.J.; Chauhan, A.; Chauhan, V.; Dager, S.R.; Dickson, P.E.; et al. Consensus Paper: Pathological Role of the Cerebellum in Autism. Cerebellum 2012, 11, 777–807. [Google Scholar] [CrossRef]
- Fernández, M.; Sierra-Arregui, T.; Peñagarikano, O. The Cerebellum and Autism: More than Motor Control; IntechOpen: London, UK, 2019; ISBN 978-1-78984-052-0. [Google Scholar]
- Andreasen, N.C.; Pierson, R. The Role of the Cerebellum in Schizophrenia. Biol. Psychiatry 2008, 64, 81–88. [Google Scholar] [CrossRef]
- Schmahmann, J.D.; Sherman, J.C. Cerebellar Cognitive Affective Syndrome. In International Review of Neurobiology; Schmahmann, J.D., Ed.; Review of Academic Press: Cambridge, MA, USA, 1997; Volume 41, pp. 433–440. [Google Scholar]
- Schmahmann, J.D. The Cerebellum and Cognition. Neurosci. Lett. 2019, 688, 62–75. [Google Scholar] [CrossRef] [PubMed]
- Hall, T.C.; Miller, A.K.H.; Corsellis, J.A.N. Variations in the Human Purkinje Cell Population According to Age and Sex. Neuropathol. Appl. Neurobiol. 1975, 1, 267–292. [Google Scholar] [CrossRef]
- Raz, N.; Torres, I.J.; Spencer, W.D.; White, K.; Acker, J.D. Age-Related Regional Differences in Cerebellar Vermis Observed in Vivo. Arch. Neurol. 1992, 49, 412–416. [Google Scholar] [CrossRef] [PubMed]
- Nasreddine, Z.S.; Phillips, N.A.; Bédirian, V.; Charbonneau, S.; Whitehead, V.; Collin, I.; Cummings, J.L.; Chertkow, H. The Montreal Cognitive Assessment, MoCA: A Brief Screening Tool For Mild Cognitive Impairment. J. Am. Geriatr. Soc. 2005, 53, 695–699. [Google Scholar] [CrossRef]
- FAQ|MoCA-Cognitive Assessment. Available online: https://www.mocatest.org/faq/ (accessed on 24 July 2021).
- Thomann, A.E.; Berres, M.; Goettel, N.; Steiner, L.A.; Monsch, A.U. Enhanced Diagnostic Accuracy for Neurocognitive Disorders: A Revised Cut-off Approach for the Montreal Cognitive Assessment. Alzheimers Res. Ther. 2020, 12, 39. [Google Scholar] [CrossRef] [PubMed]
- Segonne, F.; Dale, A.M.; Busa, E.; Glessner, M.; Salat, D.; Hahn, H.K.; Fischl, B. A Hybrid Approach to the Skull Stripping Problem in MRI. NeuroImage 2004, 22, 1060–1075. [Google Scholar] [CrossRef]
- Sled, J.G.; Zijdenbos, A.P.; Evans, A.C. A Nonparametric Method for Automatic Correction of Intensity Nonuniformity in MRI Data. IEEE Trans. Med. Imaging 1998, 17, 87–97. [Google Scholar] [CrossRef] [PubMed]
- Desikan, R.S.; Ségonne, F.; Fischl, B.; Quinn, B.T.; Dickerson, B.C.; Blacker, D.; Buckner, R.L.; Dale, A.M.; Maguire, R.P.; Hyman, B.T.; et al. An Automated Labeling System for Subdividing the Human Cerebral Cortex on MRI Scans into Gyral Based Regions of Interest. NeuroImage 2006, 31, 968–980. [Google Scholar] [CrossRef] [PubMed]
- Fischl, B.; Liu, A.; Dale, A.M. Automated Manifold Surgery: Constructing Geometrically Accurate and Topologically Correct Models of the Human Cerebral Cortex. IEEE Medical Imaging 2001, 20, 70–80. [Google Scholar] [CrossRef] [PubMed]
- Fischl, B.; van der Kouwe, A.; Destrieux, C.; Halgren, E.; Ségonne, F.; Salat, D.H.; Busa, E.; Seidman, L.J.; Goldstein, J.; Kennedy, D.; et al. Automatically Parcellating the Human Cerebral Cortex. Cerebral Cortex 2004, 14, 11–22. [Google Scholar] [CrossRef] [PubMed]
- Reuter, M.; Fischl, B. Avoiding Asymmetry-Induced Bias in Longitudinal Image Processing. NeuroImage 2011, 57, 19–21. [Google Scholar] [CrossRef]
- Fischl, B.; Sereno, M.I.; Dale, A. Cortical Surface-Based Analysis: II: Inflation, Flattening, and a Surface-Based Coordinate System. NeuroImage 1999, 9, 195–207. [Google Scholar] [CrossRef]
- Segonne, F.; Pacheco, J.; Fischl, B. Geometrically Accurate Topology-Correction of Cortical Surfaces Using Nonseparating Loops. IEEE Trans. Med. Imaging 2007, 26, 518–529. [Google Scholar] [CrossRef] [PubMed]
- Fischl, B.; Sereno, M.I.; Tootell, R.B.H.; Dale, A.M. High-Resolution Intersubject Averaging and a Coordinate System for the Cortical Surface. Human Brain Mapping 1999, 8, 272–284. [Google Scholar] [CrossRef]
- Reuter, M.; Rosas, H.D.; Fischl, B. Highly Accurate Inverse Consistent Registration: A Robust Approach. NeuroImage 2010, 53, 1181–1196. [Google Scholar] [CrossRef]
- Fischl, B.; Dale, A.M. Measuring the Thickness of the Human Cerebral Cortex from Magnetic Resonance Images. Proc. Nat. Acad. Sci. USA 2000, 97, 11050–11055. [Google Scholar] [CrossRef]
- Rosas, H.D.; Liu, A.K.; Hersch, S.; Glessner, M.; Ferrante, R.J.; Salat, D.H.; van der Kouwe, A.; Jenkins, B.G.; Dale, A.M.; Fischl, B. Regional and Progressive Thinning of the Cortical Ribbon in Huntington’s Disease. Neurology 2002, 58, 695–701. [Google Scholar] [CrossRef]
- Kuperberg, G.R.; Broome, M.; McGuire, P.K.; David, A.S.; Eddy, M.; Ozawa, F.; Goff, D.; West, W.C.; Williams, S.C.R.; van der Kouwe, A.; et al. Regionally Localized Thinning of the Cerebral Cortex in Schizophrenia. Arch. General Psychiatry 2003, 60, 878–888. [Google Scholar] [CrossRef] [PubMed]
- Jovicich, J.; Czanner, S.; Greve, D.; Haley, E.; van der Kouwe, A.; Gollub, R.; Kennedy, D.; Schmitt, F.; Brown, G.; MacFall, J.; et al. Reliability in Multi-Site Structural MRI Studies: Effects of Gradient Non-Linearity Correction on Phantom and Human Data. NeuroImage 2006, 30, 436–443. [Google Scholar] [CrossRef]
- Han, X.; Jovicich, J.; Salat, D.; van der Kouwe, A.; Quinn, B.; Czanner, S.; Busa, E.; Pacheco, J.; Albert, M.; Killiany, R.; et al. Reliability of MRI-Derived Measurements of Human Cerebral Cortical Thickness: The Effects of Field Strength, Scanner Upgrade and Manufacturer. NeuroImage 2006, 32, 180–194. [Google Scholar] [CrossRef]
- Fischl, B.; Salat, D.H.; van der Kouwe, A.J.W.; Makris, N.; Ségonne, F.; Quinn, B.T.; Dale, A.M. Sequence-Independent Segmentation of Magnetic Resonance Images. NeuroImage 2004, 23, S69–S84. [Google Scholar] [CrossRef] [PubMed]
- Salat, D.; Buckner, R.L.; Snyder, A.Z.; Greve, D.N.; Desikan, R.S.; Busa, E.; Morris, J.C.; Dale, A.; Fischl, B. Thinning of the Cerebral Cortex in Aging. Cerebral Cortex 2004, 14, 721–730. [Google Scholar] [CrossRef]
- Fischl, B.; Salat, D.H.; Busa, E.; Albert, M.; Dieterich, M.; Haselgrove, C.; van der Kouwe, A.; Killiany, R.; Kennedy, D.; Klaveness, S.; et al. Whole Brain Segmentation: Automated Labeling of Neuroanatomical Structures in the Human Brain. Neuron 2002, 33, 341–355. [Google Scholar] [CrossRef]
- Reuter, M.; Schmansky, N.J.; Rosas, H.D.; Fischl, B. Within-Subject Template Estimation for Unbiased Longitudinal Image Analysis. NeuroImage 2012, 61, 1402–1418. [Google Scholar] [CrossRef]
- Allen, G.; Courchesne, E. The Cerebellum and Non-Motor Function: Clinical Implications. Mol. Psychiatry 1998, 3, 207–210. [Google Scholar] [CrossRef][Green Version]
- Leiner, H.C.; Leiner, A.L.; Dow, R.S. Cognitive and Language Functions of the Human Cerebellum. Trends Neurosci. 1993, 16, 444–447. [Google Scholar] [CrossRef]
- Koziol, L.F.; Budding, D.; Andreasen, N.; D’Arrigo, S.; Bulgheroni, S.; Imamizu, H.; Ito, M.; Manto, M.; Marvel, C.; Parker, K.; et al. Consensus Paper: The Cerebellum’s Role in Movement and Cognition. Cerebellum 2014, 13, 151–177. [Google Scholar] [CrossRef]
- Paradiso, S.; Andreasen, N.C.; O’Leary, D.S.; Arndt, S.; Robinson, R.G. Cerebellar Size and Cognition: Correlations with IQ, Verbal Memory and Motor Dexterity. Neuropsychiatry Neuropsychol Behav Neurol. 1997, 10, 1–8. [Google Scholar]
- Bernard, J.A.; Leopold, D.R.; Calhoun, V.D.; Mittal, V.A. Regional Cerebellar Volume and Cognitive Function from Adolescence to Late Middle Age. Hum. Brain Mapp 2014, 36, 1102–1120. [Google Scholar] [CrossRef] [PubMed]
- Hoogendam, Y.Y.; van der Geest, J.N.; Niessen, W.J.; van der Lugt, A.; Hofman, A.; Vernooij, M.W.; Ikram, M.A. The Role of Cerebellar Volume in Cognition in the General Elderly Population. Alzheimer Dis. Assoc. Disord. 2014, 28, 352–357. [Google Scholar] [CrossRef] [PubMed]
- Bordignon, A.; Devita, M.; Sergi, G.; Coin, A. “Cerebellar Cognitive Reserve”: A Possible Further Area of Investigation. Aging Clin. Exp. Res. 2021. [Google Scholar] [CrossRef] [PubMed]
- Mitoma, H.; Buffo, A.; Gelfo, F.; Guell, X.; Fucà, E.; Kakei, S.; Lee, J.; Manto, M.; Petrosini, L.; Shaikh, A.G.; et al. Consensus Paper. Cerebellar Reserve: From Cerebellar Physiology to Cerebellar Disorders. Cerebellum 2020, 19, 131–153. [Google Scholar] [CrossRef] [PubMed]
Figure 1.
Mean left cerebellum white matter volume in mm3 with standard deviation in participant groups. Black dots represent outliers (i.e., exceptionally diverging values).
Figure 1.
Mean left cerebellum white matter volume in mm3 with standard deviation in participant groups. Black dots represent outliers (i.e., exceptionally diverging values).
Figure 2.
Mean left cerebellum cortex volume in mm3 with standard deviation in participant groups. Black dots represent outliers (i.e., exceptionally diverging values).
Figure 2.
Mean left cerebellum cortex volume in mm3 with standard deviation in participant groups. Black dots represent outliers (i.e., exceptionally diverging values).
Figure 3.
Mean right cerebellum white matter volume in mm3 with standard deviation in participant groups. Black dots represent outliers (i.e., exceptionally diverging values).
Figure 3.
Mean right cerebellum white matter volume in mm3 with standard deviation in participant groups. Black dots represent outliers (i.e., exceptionally diverging values).
Figure 4.
Mean right cerebellum cortex volume in mm3 with standard deviation in participant groups. Black dots represent outliers (i.e., exceptionally diverging values).
Figure 4.
Mean right cerebellum cortex volume in mm3 with standard deviation in participant groups. Black dots represent outliers (i.e., exceptionally diverging values).
Figure 5.
Mean total cerebellum volume values in mm3 with standard deviation in participant groups. Black dots represent outliers (i.e., exceptionally diverging values).
Figure 5.
Mean total cerebellum volume values in mm3 with standard deviation in participant groups. Black dots represent outliers (i.e., exceptionally diverging values).
Table 1.
Demographic data and MoCA scores in participant groups (NC—normal cognition, MCI—mild cognitive impairment, SCI—moderate and severe cognitive impairment).
Table 1.
Demographic data and MoCA scores in participant groups (NC—normal cognition, MCI—mild cognitive impairment, SCI—moderate and severe cognitive impairment).
| | Age | MoCA |
|---|
| | NC | MCI | SCI | NC | MCI | SCI |
|---|
| Participants | 9 | 9 | 10 | 9 | 9 | 10 |
| Female:Male | 6:3 | 4:5 | 6:4 | 6:3 | 4:5 | 6:4 |
| Mean | 55.1 | 71.4 | 74.8 | 28.7 | 20.9 | 10.1 |
| Std. Error of Mean | 5.4 | 2.4 | 3.3 | 0.3 | 0.7 | 1.3 |
| Median | 51.0 | 71.0 | 71.0 | 29.0 | 20.0 | 11.5 |
| Std. Deviation | 16.1 | 7.2 | 10.4 | 1.0 | 2.1 | 4.1 |
| Minimum | 35.0 | 58.0 | 66.0 | 27.0 | 18.0 | 4.0 |
| Maximum | 76.0 | 82.0 | 96.0 | 30.0 | 23.0 | 15.0 |
Table 2.
Descriptive statistics for left cerebellum white matter volume in participants with normal cognition (NC), mild cognitive impairment (MCI), and moderate/severe cognitive impairment (SCI).
Table 2.
Descriptive statistics for left cerebellum white matter volume in participants with normal cognition (NC), mild cognitive impairment (MCI), and moderate/severe cognitive impairment (SCI).
| | Left Cerebellum White Matter Volume, mm3 |
|---|
| | NC | MCI | SCI |
|---|
| Participants | 9 | 9 | 10 |
| Mean | 12,684.2 | 11,429.8 | 11,506.7 |
| Median | 12,750.5 | 10,647.7 | 11,726.8 |
| Std. Deviation | 1699.8 | 1849.2 | 1852.4 |
| Minimum | 9944.9 | 10,186.9 | 7885.2 |
| Maximum | 14,908.2 | 16,105.9 | 14,536.1 |
Table 3.
Descriptive statistics for left cerebellum cortex volume in participant groups with normal cognition (NC), mild cognitive impairment (MCI), and moderate/severe cognitive impairment (SCI).
Table 3.
Descriptive statistics for left cerebellum cortex volume in participant groups with normal cognition (NC), mild cognitive impairment (MCI), and moderate/severe cognitive impairment (SCI).
| | Left Cerebellum Cortex Volume, mm3 |
|---|
| | NC | MCI | SCI |
|---|
| Participants | 9 | 9 | 10 |
| Mean | 52,724.6 | 50,075.8 | 51,631.8 |
| Median | 52,665.2 | 51,573.7 | 51,431.8 |
| Std. Deviation | 5596.8 | 4919.9 | 6323.4 |
| Minimum | 46,530.4 | 41,886.6 | 40,268.9 |
| Maximum | 62,715.6 | 57,555.6 | 62,242.0 |
Table 4.
Descriptive statistics for right cerebellum white matter volume in participants with normal cognition (NC), mild cognitive impairment (MCI), and moderate/severe cognitive impairment (SCI).
Table 4.
Descriptive statistics for right cerebellum white matter volume in participants with normal cognition (NC), mild cognitive impairment (MCI), and moderate/severe cognitive impairment (SCI).
| | Right Cerebellum White Matter Volume, mm3 |
|---|
| | NC | MCI | SCI |
|---|
| Participants | 9 | 9 | 10 |
| Mean | 12,535.4 | 11,542.3 | 11,073.9 |
| Median | 12,279.9 | 11,124.0 | 11,237.1 |
| Std. Deviation | 1551.1 | 1542.9 | 2078.7 |
| Minimum | 10,220.2 | 9552.4 | 6591.0 |
| Maximum | 15,019.2 | 14,494.6 | 14,550.6 |
Table 5.
Descriptive statistics for right cerebellum cortex volume in participants with normal cognition (NC), mild cognitive impairment (MCI), and moderate/severe cognitive impairment (SCI).
Table 5.
Descriptive statistics for right cerebellum cortex volume in participants with normal cognition (NC), mild cognitive impairment (MCI), and moderate/severe cognitive impairment (SCI).
| | Right Cerebellum Cortex Volume, mm3 |
|---|
| | NC | MCI | SCI |
|---|
| Participants | 9 | 9 | 10 |
| Mean | 53,667.8 | 51,066.6 | 52,981.4 |
| Median | 52,242.6 | 52,704.6 | 54,000.4 |
| Std. Deviation | 5982.1 | 5194.9 | 7410.6 |
| Minimum | 47,858.8 | 42,292.4 | 39,232.7 |
| Maximum | 63,872.6 | 58,125.1 | 65,617.1 |
Table 6.
Descriptive statistics for total cerebellar volume in participants with normal cognition (NC), mild cognitive impairment (MCI), and moderate/severe cognitive impairment (SCI).
Table 6.
Descriptive statistics for total cerebellar volume in participants with normal cognition (NC), mild cognitive impairment (MCI), and moderate/severe cognitive impairment (SCI).
| | Total Cerebellum Volume, mm3 |
|---|
| | NC | MCI | SCI |
|---|
| Participants | 9 | 9 | 10 |
| Mean | 131,612.0 | 124,113.8 | 127,193.8 |
| Median | 131,689.9 | 125,600.9 | 130,447.9 |
| Std. Deviation | 14,099.5 | 11,921.3 | 16,451.6 |
| Minimum | 115,429.9 | 104,217.5 | 93,977.8 |
| Maximum | 155,494.1 | 140,885.4 | 152,585.8 |
| Publisher’s Note: MDPI stays neutral with regard to jurisdictional claims in published maps and institutional affiliations. |
© 2021 by the authors. Licensee MDPI, Basel, Switzerland. This article is an open access article distributed under the terms and conditions of the Creative Commons Attribution (CC BY) license (https://creativecommons.org/licenses/by/4.0/).


 ,
, 


