Abstract
Studies investigating human brain response to emotional stimuli—particularly high-arousing versus neutral stimuli—have obtained inconsistent results. The present study was the first to combine magnetoencephalography (MEG) with the bootstrapping method to examine the whole brain and identify the cortical regions involved in this differential response. Seventeen healthy participants (11 females, aged 19 to 33 years; mean age, 26.9 years) were presented with high-arousing emotional (pleasant and unpleasant) and neutral pictures, and their brain responses were measured using MEG. When random resampling bootstrapping was performed for each participant, the greatest differences between high-arousing emotional and neutral stimuli during M300 (270–320 ms) were found to occur in the right temporo-parietal region. This finding was observed in response to both pleasant and unpleasant stimuli. The results, which may be more robust than previous studies because of bootstrapping and examination of the whole brain, reinforce the essential role of the right hemisphere in emotion processing.
1. Introduction
The brain’s response to emotional stimuli—and the accompanying question of whether hemispheric asymmetries exist for such responses—remains controversial despite numerous investigations [1,2,3,4,5,6,7,8,9,10]. Studies reported variations in left and right hemisphere responses to positive and negative emotions. For instance, a left hemisphere lesion was reported to inhibit the perception of positive emotions, and unilateral right hemisphere brain damage was reported to inhibit the perception of negative emotions [11]. Some studies have reported a right hemisphere advantage for emotional face processing in patients with split-brain [12,13]. Evidence also suggests that happy and sad facial expressions in response to happy and sad movie clips were associated with right frontal lobe dominance [14]. Moreover, several studies reported a primary triggering of the right hemisphere for more sensitive stimuli [15,16].
Two main models have emerged to date which have sought to describe hemispheric lateralization in emotion processing: (1) the right hemisphere hypothesis, which posits right hemisphere dominance for all emotions, whether positive or negative [2,3,17], and (2) the valence hypothesis, which posits right hemisphere dominance for negative emotions and left hemisphere dominance for positive emotions [1,18,19]. While review studies have also examined these two hypotheses within the context of the relationship between the brain hemispheres, results have been mixed. For example, one meta-analysis of 105 functional magnetic resonance imaging (fMRI) studies (conducted from 1990 to 2008) with healthy participants and emotional faces as stimuli found no evidence for right hemisphere dominance; rather, evidence was found to support bilateral activation of emotion-related brain regions such as the amygdala, parahippocampal gyrus, and middle temporal gyrus [20]. In contrast, another review of 32 studies (conducted from 1993 to 2018 with frontotemporal lobar degeneration patients as participants) found that almost all of the examined studies supported the right hemisphere hypothesis [9]. Taken together, the existing evidence suggests that further studies investigating hemispheric specialization in emotion processing are needed.
In studies that targeted the brain’s emotional responses, results have been inconsistent—despite using the same study designs or analytical approaches. Such inconsistencies have been attributed to differences in participant groups (e.g., age), different stimuli (e.g., visual versus auditory) with different emotional categories (e.g., pleasant, unpleasant, anger, surprise, etc.), different levels of arousal, valence, and dominance (weak versus strong) within those stimuli, all of which could affect emotional responses in the human brain, and variations in study design, facilities, and analytical approaches [21,22]. Artificially increasing the number of samples by employing bootstrapping and random resampling can help address potential issues such as smaller sample sizes and limited stimuli presentation [23,24,25,26,27]. Such resampling methods have been used in many studies analyzing the brain’s response to emotional stimuli and have provided accurate results with high degrees of reliability [28,29,30,31,32,33,34,35,36].
This study used bootstrapping techniques to identify the brain regions showing the highest responses to high-arousing stimuli compared to neutral stimuli. As noted above, possible outcomes included either right hemispheric dominance for both pleasant and unpleasant versus neutral stimuli or right hemispheric dominance for unpleasant stimuli and left hemispheric dominance for pleasant versus neutral stimuli. Magnetoencephalography (MEG) was chosen because it provides higher spatial resolution than electroencephalography (EEG) and higher temporal resolution than other neuroimaging technologies such as fMRI and positron emission tomography (PET) [37,38,39,40]. Furthermore, because many studies reported that high-arousing stimuli elicited higher activation than neutral stimuli within 200–800 ms [41,42,43,44,45,46], with a maximum amplitude within 270–320 ms in MEG (M300, [40]), the study also focused on this time window.
2. Materials and Methods
2.1. Overview
Figure 1 summarizes the entire algorithm of this study. First, MEG data were measured from 17 healthy participants while they viewed three categories of pictures: pleasant, unpleasant, and neutral. Second, MEG data were preprocessed separately for each participant. Third, a bootstrap approach was performed to randomly resample the data from each participant separately by calculating the difference in brain response to high-arousing emotional versus neutral stimuli. Finally, those sensors that showed the maximum differences in most replications of bootstrapping were selected as the best sensors.
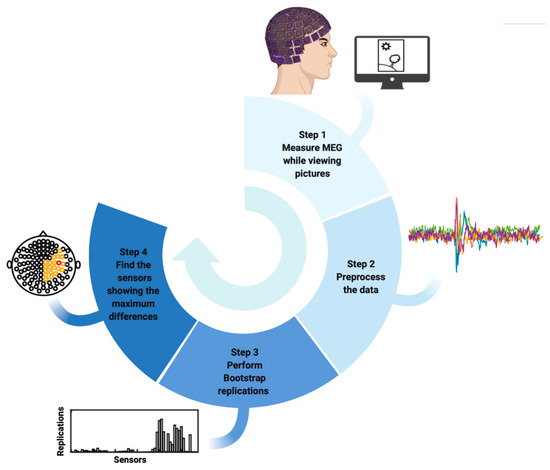
Figure 1.
Workflow of the proposed algorithm to find the MEG sensors showing greater differences in human brain response to high-arousing emotional stimuli compared to neutral stimuli.
2.2. Participants
Twenty-one healthy volunteers (12 females, aged 19 to 33 years; mean age, 27.5 years) participated in the study. Data from four participants were discarded (due to sleepiness, partial participation, or excessive movements). Data from the remaining 17 participants (11 females, aged 19 to 33 years; mean age, 26.9 years) were included in the study. Participants had no history of any neurological or psychiatric disorders and normal or corrected-to-normal vision and were not on any medications with central nervous system (CNS) effects. Informed written consent was provided by all participants before the experiment, and the details of the experiment were approved by the local Ethics Committee of the Jena University Hospital (Jena, Germany).
2.3. Stimuli and Design
One hundred and eighty color pictures were selected from the International Affective Picture System (IAPS) [47]. Sixty of the pictures were pleasant, 60 were neutral, and 60 were unpleasant. The selected pictures covered a wide range of content, e.g., happy families, household objects, sports scenes, attack scenes, etc. A description of the content and the numbers of the selected IAPS pictures are listed in Supplementary Table S1. All 180 pictures were then divided into three blocks of 60 pictures each, comprising 20 pictures from the pleasant category, 20 pictures from the unpleasant category, and 20 pictures from the neutral category in a pseudo-randomized order.
Participants were seated in the MEG scanner in a magnetically shielded and sound-sheltered room in the Bio-magnetic Center of Jena University Hospital. Pictures were presented on a white screen in front of participants with a viewing distance of approximately 105 cm and a viewing angle of 16.5° × 21.5°; the pictures had a maximum size of 30.9 cm × 41.5 cm. Each picture was shown on the screen for 6000 ms, followed by randomized inter-trial intervals of between 2000–6000 ms; there was a brief pause between blocks to allow participants to relax. Both the contrast (as measured with ImageJ (W. Rasband, NIH, Bethesda, MD, USA)) and the mean luminance (as measured with the MATLAB 9.3.0 Lab color-space toolbox; Mathworks, Natick, MA, USA) of the selected pictures in each picture category were matched. Participants were instructed to keep their eyes open and not to move their bodies while passively viewing pictures to reduce artifacts in the MEG data. The entire MEG measurement took approximately 45 min. When the task was completed, participants took a short break and were then were shown all the pictures again in the same order (outside the MEG room) and asked to rate them using the Self-Assessment Manikin (SAM; [48]) scale. This 7-point Likert scale denotes degree of arousal (1 to 7, relaxed to excited) and valence (1 to 7, pleasant to unpleasant). The ratings were used to verify that arousal levels were significantly higher for pleasant versus neutral pictures (p < 0.001), and unpleasant versus neutral pictures (p < 0.001) (see Supplementary Figure S1).
2.4. MEG Acquisition and Processing
The study used a 306-sensor Electa Neuromag Vectorview MEG system (Elekta Neuromag Oy, Helsinki, Finland) with 204 gradiometers and 102 magnetometers (with 24-bit digitization, 1 kHz sampling rate, and online low and high-pass filter at 330 and 0.1 Hz, respectively) to measure brain activity. Only data collected from the magnetometers were analyzed in this study. A 3D digitizer (3SPACE FASTRAK, Polhemus Inc., Colchester, VT, USA) was used to define participants’ anatomical landmarks (preauricular points and nasion). MEG sensor positions for all participants were aligned by applying Maxfilter Version 2.0.21 (Elekta Neuromag Oy) to the raw MEG data using the Signal Space Separation (SSS) method [49]. One thousand millisecond pre- to 2000 ms post-stimulus onset were defined as epochs with band-pass filtering of 1–30 Hz and down-sampling to 250 Hz. Independent Component Analysis (ICA) and visual detection were used to identify electrooculogram artifacts, electrocardiogram artifacts, and excessive movements. The event-related fields (ERFs) were calculated based on artifact-free data. The entire analysis was performed using Fieldtrip [50] in MATLAB.
2.5. Statistical Analysis
To find the brain regions that showed the highest responses to high-arousing emotional compared to neutral during M300, we performed the bootstrapping approach [24,25,26,27] in the present study. Bootstrapping is a random resampling method that is commonly used to assess accuracy, prediction error, variance, and several other similar measures [24,25,26,27,28]. Unlike permutation tests, which are mostly used for testing, bootstrapping is mostly used to generate large sample standard errors or confidence intervals. Bootstrapping is one of the simplest techniques among the many random resampling techniques due to its benefit of being fully automatic [24]. This approach is superior to other techniques (e.g., ANOVA) when the data distribution is non-normal or even unknown and when the sample size is small [27]. The analysis of distribution properties of variables under investigation revealed that the normality assumptions for our data set were not substantiated. In combination with the small sample size, bootstrap approaches are more appropriate than asymptotic, parametric confidence interval estimators. In the present study, bootstrapping was performed on each participant’s data. We initially had 60 trials in each stimulus category (i.e., pleasant, unpleasant, and neutral), but due to the removal of artifacts in the preprocessing steps, the number of remaining trials in these stimulus categories was not equal. For example, 54 trials were left in the pleasant category, 58 in the unpleasant category, and 55 in the neutral category. Therefore, we considered the number of trials in the category with the lowest number of trials for the bootstrapping subsample (i.e., 54 in our previous example). Then this number of trials was randomly selected (with sub-sampling) from the trials in each category and averaged over the 270–320 ms time interval of interest (M300). Thus, for each category, a vector of 102 values corresponding to 102 sensors was provided. Thereafter, the vector values of the neutral category were subtracted from the vector values of the pleasant and unpleasant categories separately and the maximum of these subtractions was obtained. It should be noted again that we did not combine pleasant and unpleasant but compared them separately to the neutral responses to see if different regions and hemispheres were responsible for the positivity and negativity of the effects. In this step, the sensors with a maximum difference equal to or above the 90th percentile (largest differences) were selected. This procedure was performed for 25,000 replications (Figure 2). The sensors which were above the 90th percentile in at least 20% of bootstrapping replications (orange sensors in Figure 3) were selected as sensors showing the highest brain responses to high-arousing emotional versus neutral stimuli. The threshold of 20% was considered because we wanted to find at least 10 sensors that showed the largest differences to see the distribution of these sensors, whether they corresponded to the same sensor locations or not. We then tested these results using the one-sample t-test to see if the selected sensors showed significantly higher responses to high-arousing emotional versus neutral stimuli. The sensors with significant p-values (p < 0.05) are highlighted in red in Figure 3. The total selected sensors of all bootstrapping replications for all participants were evaluated in a forest plot (separately for pleasant and unpleasant versus neutral) considering 95% confidence intervals to find out which sensors were most frequently selected for all participants (Figure 4).
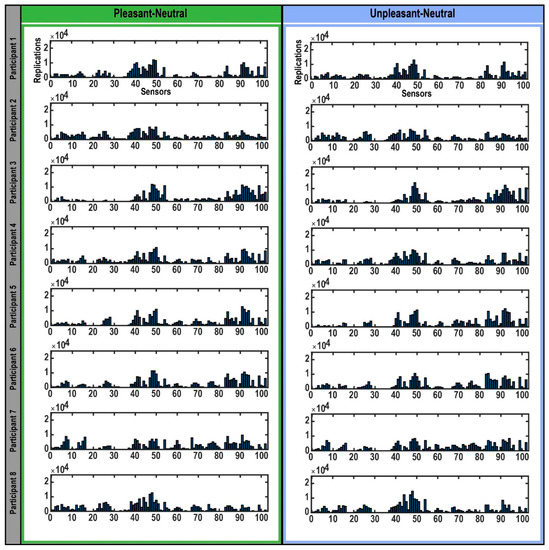
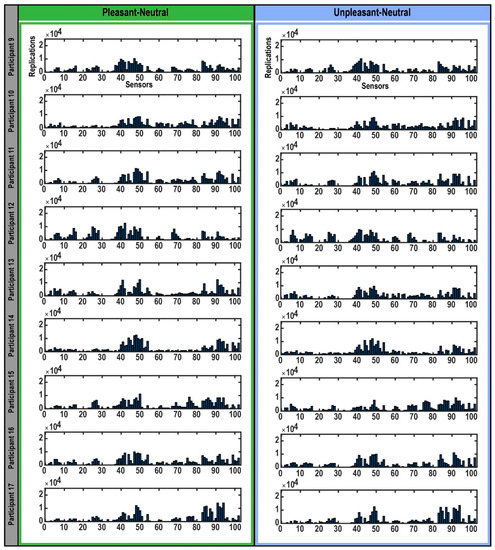
Figure 2.
Selection of sensors in bootstrapping replications. The bar plots represent the sensors that expressed the highest differences in each participant’s brain response to highly arousing pleasant (left) and unpleasant (right) emotional pictures compared to neutral pictures during the M300 time interval detected in each bootstrap replication. The Y-axis indicates the 25,000 bootstrap replications. The X-axis shows the 102 magnetometers encompassing the whole brain.
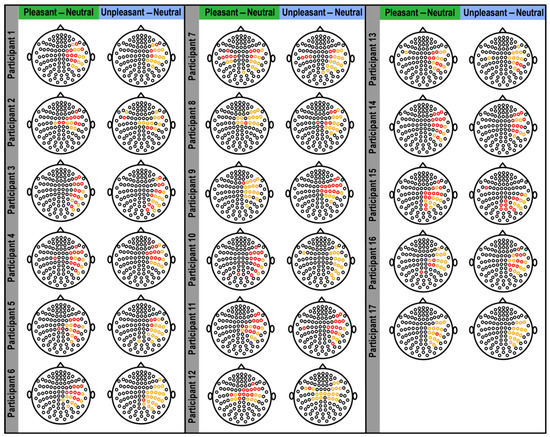
Figure 3.
Selected sensors showing the highest differences in brain responses to pleasant and unpleasant versus neutral pictures for each participant. The plots depict the magnetoencephalography (MEG) sensors across the entire head (small black circles). Highlighted sensors (in orange and red) indicate the sensors selected by bootstrapping, showing the largest differences in brain response to pleasant and unpleasant versus neutral pictures for each participant. The highlighted orange sensors are those that were selected by more than 20% of bootstrapping replications, and the red sensors are those that showed significantly higher responses to high-arousing emotional pictures versus neutral pictures within 20% of bootstrapping replications.
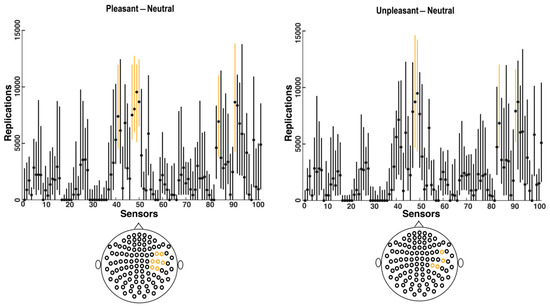
Figure 4.
Forest plot for all selected sensors by bootstrapping over all participants. Vertical lines show the 95% confidence intervals for the selected sensors based on 25,000 bootstrapping replications for all participants, with the median values represented by black dots. Orange lines show the most frequently selected sensors for all participants with the highest median and the highest lower limits in confidence intervals. The bottom graphs depict the location of the selected sensors (orange lines in the top figures) which are located in the right temporal and parietal regions.
3. Results
When the bootstrapping method was applied to each participant’s data (Figure 2), the MEG sensors that best identified the difference in brain response to pleasant and unpleasant versus neutral stimuli were found to be mostly within sensors numbered 40–50 and 84–102 (Figure 2), which were located in the right temporal and parietal regions (Figure 3). Related brain regions to the selected sensors were defined based on the Elekta Neuromag sensor locations (see Supplementary Figure S2) [33,42,51,52,53,54,55]. For most participants, these selected sensors showed significantly (p-value < 0.05) higher brain responses to high-arousing versus neutral pictures (red sensors in Figure 3). To evaluate these selected sensors by 25,000 bootstrapping replications across all participants, we plotted a forest plot showing the 95% CI of bootstrapping replications with the median across all participants (Figure 4). The best sensors were selected based on the highest median value together with the highest lower limit in the confidence intervals. Finally, sensor numbers 48, 49, 84, and 91 were selected as the sensors showing the highest brain responses to unpleasant versus neutral over all participants. These sensors were selected for at least 16 out of 17 participants. Comparing brain responses to pleasant versus neutral stimuli, sensors number 41, 47, 48, 49, 50, 84, and 91 were selected as the common sensors across all participants. These sensors were common in at least 14 out of 17 participants. All of these final selected sensors for both comparisons were located in the right temporal and parietal brain regions (Figure 4). Table 1 shows the details of how many of the participants showed these common sensors (repetition across participants), and in which of the participants these sensors showed the significantly higher brain responses to high-arousing versus neutral stimuli (highlighted with an asterisk). For instance, according to Table 1, sensor number 41 was selected for 16 participants by bootstrapping replications (95% CI (2277, 10,576); median = 7143) and showed significantly higher brain responses to pleasant versus neutral stimuli in participants: 1, 4, 6, 7, 10, 12, 13, 14, 15, 16. More details on the ranges of confidence intervals and medians of the replications related to these sensors can be found in this table.

Table 1.
Most frequently selected sensors comparing brain responses to high-arousing emotional versus neutral pictures across all participants. The most common sensors between participants, selected considering 95% confidence intervals of bootstrapping replications, are presented in this table. In highlighted participants with an asterisk, the brain responses to high-arousing versus neutral stimuli were significantly higher. The numerical values in the labeled 95% CI column represent the median as well as the 95% CI of the bootstrapping replications for the selected sensors (see orange sensors in Figure 4).
4. Discussion
This study used bootstrap methods that have not previously been used in other MEG/EEG studies to find differences in human brain response to high-arousing emotional versus neutral stimuli during the M300 time interval. The results suggest that the right hemisphere may be responsible for the largest differences in such responses, suggesting the right hemisphere may also be crucial for high-arousing emotional processing.
Our results support previous findings [3,4,5,6,7,8,9,15,16,42,56] that the right hemisphere is more involved in responding to emotion than the left hemisphere. For instance, Diamond and colleagues reported that the right hemisphere was the primary trigger and seemed to be responsible for more sensitive emotions [16], and Hecaen and Angelergues similarly demonstrated that primitive sensory data could be processed in the right hemisphere [15]. In another study, Wittling and Roschmann presented 54 adult participants with positive and negative movies to either their left or right hemisphere and found that participants reported a heightened emotional experience when either movie was shown to the right hemisphere [56]. Taken together, these findings support the right hemisphere hypothesis—that the right hemisphere is responsible for more primitive and nonverbal sensorimotor functions such as unconscious emotional processing, and that the left hemisphere is more responsible for prevalent verbal functions such as intentionality [3,4,5,6,7,8,9].
Notably, our results are in line with many animal and human neuroimaging studies that observed activation of the temporal and parietal regions in emotional and cognitive processing [10,21,57,58,59,60,61,62,63]. For instance, functional magnetic resonance (fMRI) studies have repeatedly reported higher blood oxygen level-dependent (BOLD) signals over the temporal region in response to high-arousing emotional versus neutral stimuli [57,64,65]. It should be noted, however, that other studies reported that this difference activated only the right or left temporal lobe for different types of arousal [51,57]. In one fMRI study, Aldhafeeri and colleagues reported bilateral activation of the temporal lobe in response to viewing pleasant versus neutral IAPS images and only right temporal lobe activation when viewing unpleasant versus neutral images [57]. In another MEG study, Hagan and colleagues reported a significant increase in the power of brain responses in the right superior and middle temporal gyrus to fear compared to neutral audio-visual stimuli [66]. In another study, Horton demonstrated high dominance of the right parietal region in response to positive emotions like joy and love [61]. Within this context, the present findings showed that the largest differences in response to high-arousing emotional versus neutral stimuli occurred in the right temporo-parietal region for most participants, regardless of whether the high-arousing stimuli were positive or negative. These findings are in line with previous studies that reported activation of the right temporal and parietal regions during high-arousing conditions such as happiness and sadness (e.g., [21,57,62]), as well as with results of a recent MEG study that reported activation of the right middle temporal gyrus during the processing of high-arousing pictures [67]. Moreover, our results are also consistent with the results of an fMRI study which tested the topography of affective states and found that the right temporo-parietal regions were essential for complexity, intensity (relates to arousal), and polarity (relates to valence) of emotional experiences [62].
It should be noted that the activity observed over the temporal and parietal regions in this study in response to high-arousing emotional stimuli may also be associated with the right amygdala and insula. For instance, a MEG study by Chen and colleagues found that activation of the right insula differentiated brain response to emotionally arousing versus neutral stimuli; in that study, the right insula was activated in response to both negative and positive stimuli [68]. However, other studies have consistently reported activation of the right insula solely in response to disgust and other negative stimuli (e.g., [69]. In addition, amygdalar activation may also be related to brain response to arousal within the 200–300 ms time interval [43,67]. Other studies have similarly noted higher activation of the right amygdala versus the left amygdala in response to high-arousing emotional stimuli [65] and unconscious processing of emotional stimuli [67,70,71,72], lending further credence to the aforementioned right hemisphere hypothesis [3,4,5,6,7,8,9].
Our study shows inline—or, in some cases, superior—results with many studies using other random resampling methods. For instance, an EEG study performed ANOVA to investigate oscillatory brain activities during the viewing of pleasant, unpleasant, and neutral pictures and found a right-hemispheric dominance of gamma oscillations for arousal stimuli [73]. Using ANOVA and permutation statistics in a MEG study, Moratti and colleagues found an arousal modulation in the right temporoparietal cortex of 15 healthy female participants [74]. In another EEG study using ANOVA, Guntekin and colleagues found higher delta coherence in the brain responses of 28 healthy subjects to unpleasant versus neutral pictures in several brain regions, including the right parietal area [75]. However, using 1000 Monte Carlo permutations with cluster correction in an EEG study, Duma and colleagues found no significant differences between the brain responses of thirty healthy participants to high versus low arousal sensory stimuli (faces or sounds) [76].
Taken together, our results reinforce the essential role of the right hemisphere in emotion processing. However, some limitations should be considered in further studies. First, the analysis performed here was based on sensor-level data; additional source-level analysis could provide complementary information. Second, the stimuli considered in this study were visual (selected from the IAPS); thus, it is worth testing whether performing the same analysis with audiovisual and audio stimuli would yield the same results. Third, consideration of other emotional categories (e.g., fear, anger, and surprise) versus neutral could also provide supporting information, rather than considering the basic emotional categories (i.e., pleasant, and unpleasant). Fourth, the arousal effect was the focus of the present study and testing our approach on the valence effect (i.e., pleasant versus unpleasant) is a proposed area for further study—in which case a different time interval should be considered, as valence and arousal are related to different stages of emotion processing [77].
5. Conclusions
The present study demonstrated that the right hemisphere may be responsible for the largest differences in brain response to both negative and positive high-arousing emotional versus neutral stimuli. In this study, we combined MEG with the bootstrapping method to identify the brain regions most likely to be responsible for these differences. Significant advantages to the study included our ability to look at the whole cortex, the use of bootstrapping methods to increase confidence intervals, and the use of MEG data, which have higher spatial resolution than EEG and higher temporal resolution than other neuroimaging technologies such as PET and fMRI.
Supplementary Materials
The following are available online at https://www.mdpi.com/article/10.3390/brainsci11080960/s1, Figure S1: arousal and valence levels for each picture category; Table S1: numbers and descriptions of IAPS pictures used in this experiment.
Author Contributions
Conceptualization, O.W.W. and C.M.K.; Data curation, M.K. and P.B.; Formal analysis, M.K. and P.B.; Funding acquisition, O.W.W. and C.M.K.; Investigation, M.K., P.B. and C.M.K.; Methodology, M.K., P.B. and C.M.K.; Project administration, O.W.W. and C.M.K.; Resources, O.W.W. and C.M.K.; Supervision, O.W.W. and C.M.K.; Validation, M.K., L.L. and P.B.; Visualization, M.K.; Writing—original draft, M.K.; Writing—review & editing, M.K., P.B., L.L., O.W.W., M.W., J.R.G., C.A.Z. and C.M.K. All authors have read and agreed to the published version of the manuscript.
Funding
This research was funded in part by BMBF (IRESTRA 16SV7209 and Schwerpunktprogramm BU 1327/4-1) and by the Intramural Research Program at the National Institute of Mental Health, National Institutes of Health (IRP-NIMH-NIH; ZIAMH002927).
Institutional Review Board Statement
The details of the study were approved by the local Ethics Committee of the Jena University Hospital (4415-04/15), Jena, Germany.
Informed Consent Statement
Informed consent was obtained from all participants involved in the study.
Acknowledgments
The authors gratefully thank R. Huonker, S. Heginger and T. Radtke for technical assistance and I. Henter for editorial assistance. We also express our gratitude to the anonymous reviewers who pointed out valuable comments that improved our manuscript. The authors acknowledge BioRender and Adobe Illustrator for the use of their image-making software.
Conflicts of Interest
C.A.Z. is listed as a co-inventor on a patent for the use of ketamine in major depression and suicidal ideation; as a co-inventor on a patent for the use of (2R,6R)-hydroxynorketamine, (S)-dehydronorketamine, and other stereoisomeric dehydroxylated and hydroxylated metabolites of (R,S)-ketamine metabolites in the treatment of depression and neuropathic pain; and as a co-inventor on a patent application for the use of (2R,6R)-hydroxynorketamine and (2S,6S)-hydroxynorketamine in the treatment of depression, anxiety, anhedonia, suicidal ideation, and post-traumatic stress disorders. He has assigned his patent rights to the U.S. government but will share a percentage of any royalties that may be received by the government. All other authors have no conflict of interest to disclose, financial or otherwise.
References
- Ahern, G.L.; Schwartz, G.E. Differential lateralization for positive versus negative emotion. Neuropsychologia 1979, 17, 693–698. [Google Scholar] [CrossRef]
- Borod, J.C.; Cicero, B.A.; Obler, L.K.; Welkowitz, J.; Erhan, H.M.; Santschi, C.; Grunwald, I.S.; Agosti, R.M.; Whalen, J.R. Right hemisphere emotional perception: Evidence across multiple channels. Neuropsychology 1998, 12, 446–458. [Google Scholar] [CrossRef] [PubMed]
- Gainotti, G. Emotional behavior and hemispheric side of the lesion. Cortex 1972, 8, 41–55. [Google Scholar] [CrossRef]
- Gainotti, G. Face familiarity feelings, the right temporal lobe and the possible underlying neural mechanisms. Brain Res. Rev. 2007, 56, 214–235. [Google Scholar] [CrossRef]
- Gainotti, G. Unconscious processing of emotions and the right hemisphere. Neuropsychologia 2012, 50, 205–218. [Google Scholar] [CrossRef] [PubMed]
- Gainotti, G. Is the difference between right and left ATLs due to the distinction between general and social cognition or between verbal and non-verbal representations? Neurosci. Biobehav. Rev. 2015, 51, 296–312. [Google Scholar] [CrossRef] [PubMed]
- Gainotti, G. Emotions and the Right Hemisphere: Can New Data Clarify Old Models? Neuroscientist 2019, 25, 258–270. [Google Scholar] [CrossRef]
- Gainotti, G. A historical review of investigations on laterality of emotions in the human brain. J. Hist. Neurosci. 2019, 28, 23–41. [Google Scholar] [CrossRef]
- Gainotti, G. The Role of the Right Hemisphere in Emotional and Behavioral Disorders of Patients With Frontotemporal Lobar Degeneration: An Updated Review. Front. Aging Neurosci. 2019, 11, 55. [Google Scholar] [CrossRef]
- Guntekin, B.; Basar, E. Emotional face expressions are differentiated with brain oscillations. Int. J. Psychophysiol. 2007, 64, 91–100. [Google Scholar] [CrossRef]
- Mandal, M.K.; Tandon, S.C.; Asthana, H.S. Right brain damage impairs recognition of negative emotions. Cortex 1991, 27, 247–253. [Google Scholar] [CrossRef]
- Gazzaniga, M.S.; Smylie, C.S. Facial recognition and brain asymmetries: Clues to underlying mechanisms. Ann. Neurol. 1983, 13, 536–540. [Google Scholar] [CrossRef]
- Sergent, J.; Bindra, D. Differential hemispheric processing of faces: Methodological considerations and reinterpretation. Psychol. Bull. 1981, 89, 541–554. [Google Scholar] [CrossRef]
- Werner, K.H.; Roberts, N.A.; Rosen, H.J.; Dean, D.L.; Kramer, J.H.; Weiner, M.W.; Miller, B.L.; Levenson, R.W. Emotional reactivity and emotion recognition in frontotemporal lobar degeneration. Neurology 2007, 69, 148–155. [Google Scholar] [CrossRef]
- Hécaen, H.; Reńe, A. La Cécité Psychique (Psychic Blindness); Masson Cie: Échandens, Switzerland, 1963. [Google Scholar]
- Diamond, M. Human sexual development: Biological foundations for social development. In Human Sexuality in Four Perspectives; Beach, F.A., Ed.; The Johns Hopkins University Press: Baltimore, MD, USA, 1977; pp. 22–61. [Google Scholar]
- Mandal, M.K.; Ambady, N. Laterality of facial expressions of emotion: Universal and culture-specific influences. Behav. Neurol. 2004, 15, 23–34. [Google Scholar] [CrossRef]
- Reuter-Lorenz, P.; Davidson, R.J. Differential contribution of the two cerebral hemispheres to the perception of happy and sad faces. Neuropsychologia 1981, 19, 609–613. [Google Scholar] [CrossRef]
- Rodway, P.; Wright, L.; Hardie, S. The valence-specific laterality effect in free viewing conditions: The influence of sex, handedness, and response bias. Brain Cogn. 2003, 53, 452–463. [Google Scholar] [CrossRef]
- Fusar-Poli, P.; Placentino, A.; Carletti, F.; Allen, P.; Landi, P.; Abbamonte, M.; Barale, F.; Perez, J.; McGuire, P.; Politi, P.L. Laterality effect on emotional faces processing: ALE meta-analysis of evidence. Neurosci. Lett. 2009, 452, 262–267. [Google Scholar] [CrossRef] [PubMed]
- Esslen, M.; Pascual-Marqui, R.D.; Hell, D.; Kochi, K.; Lehmann, D. Brain areas and time course of emotional processing. Neuroimage 2004, 21, 1189–1203. [Google Scholar] [CrossRef] [PubMed]
- Yuan, J.; Tian, Y.; Huang, X.; Fan, H.; Wei, X. Emotional bias varies with stimulus type, arousal and task setting: Meta-analytic evidences. Neurosci. Biobehav. Rev. 2019, 107, 461–472. [Google Scholar] [CrossRef]
- Wang, Z.; Wu, C.; Zheng, K.; Niu, X.; Wang, X. SMOTETomek-Based Resampling for Personality Recognition; IEEE Access: Piscataway, NJ, USA, 2019; Voloume 7, pp. 129678–129689. [Google Scholar]
- Efron, B.; Tibshirani, R.J. An Introduction to the Bootstrap; CRC Press: Boca Raton, FL, USA, 1994. [Google Scholar]
- Mooney, C.Z.; Mooney, C.F.; Mooney, C.L.; Duval, R.D.; Duvall, R. Bootstrapping: A Nonparametric Approach to Statistical Inference; SAGE: Newbury Park, CA, USA, 1993; Volume 95. [Google Scholar]
- Siniksaran, R. BootStrapPackage: A Package of Bootstrap Algorithms for Mean, Simple Linear Regression Models, and Correlation Coefficient. 2021. Available online: http://library.wolfram.com/infocenter/MathSource/815/ (accessed on 1 May 2021).
- Weisstein, E.W. Bootstrap Methods.From MathWorld—A Wolfram Web Resource. Available online: https://mathworld.wolfram.com/BootstrapMethods.html (accessed on 1 May 2021).
- Basiri, S.; Ollila, E.; Koivunen, V. Enhanced bootstrap method for statistical inference in the ICA model. Signal Process. 2017, 138, 53–62. [Google Scholar] [CrossRef]
- Calvetti, D.; Johnson, B.; Pascarella, A.; Pitolli, F.; Somersalo, E.; Vantaggi, B. Mining the Mind: Linear Discriminant Analysis of MEG source reconstruction time series supports dynamic changes in deep brain regions during meditation sessions. arXiv 2021, arXiv:2101.12559. [Google Scholar]
- Campopiano, A.; van Noordt, S.J.R.; Segalowitz, S.J. STATSLAB: An open-source EEG toolbox for computing single-subject effects using robust statistics. Behav. Brain Res. 2018, 347, 425–435. [Google Scholar] [CrossRef] [PubMed]
- Himmelberg, M.M.; Segala, F.G.; Maloney, R.T.; Harris, J.M.; Wade, A.R. Decoding Neural Responses to Motion-in-Depth Using EEG. Front. Neurosci. 2020, 14, 581706. [Google Scholar] [CrossRef] [PubMed]
- Hu, B.; Dong, Q.; Hao, Y.; Zhao, Q.; Shen, J.; Zheng, F. Effective brain network analysis with resting-state EEG data: A comparison between heroin abstinent and non-addicted subjects. J. Neural. Eng. 2017, 14, 046002. [Google Scholar] [CrossRef]
- Kheirkhah, M.; Baumbach, P.; Leistritz, L.; Brodoehl, S.; Götz, T.; Huonker, R.; Witte, O.W.; Klingner, C.M. The Temporal and Spatial Dynamics of Cortical Emotion Processing in Different Brain Frequencies as Assessed Using the Cluster-Based Permutation Test: An MEG Study. Brain Sci. 2020, 10, 352. [Google Scholar] [CrossRef]
- Kim, S.E.; Ba, D.; Brown, E.N. A Multitaper Frequency-Domain Bootstrap Method. IEEE Signal Process. Lett. 2018, 25, 1805–1809. [Google Scholar] [CrossRef] [PubMed]
- Martire, D.J.; Wong, S.; Workewych, A.; Pang, E.; Boutros, S.; Smith, M.L.; Ochi, A.; Otsubo, H.; Sharma, R.; Widjaja, E.; et al. Temporal-plus epilepsy in children: A connectomic analysis in magnetoencephalography. Epilepsia 2020, 61, 1691–1700. [Google Scholar] [CrossRef]
- Oya, H.; Kawasaki, H.; Howard, M.; Adolphs, R. Electrophysiological responses in the human amygdala discriminate emotion categories of complex visual stimuli. J. Neurosci. 2002, 22, 9502–9512. [Google Scholar] [CrossRef]
- Halchenko, Y.O.; Hanson, S.J.; Pearlmutter, B.A. Multimodal Integration: fMRI, MRI, EEG, MEG. Adv. Image Process. Magn. Reson. Imaging. 2005, 223–265. [Google Scholar]
- Hall, E.L.; Robson, S.E.; Morris, P.G.; Brookes, M.J. The relationship between MEG and fMRI. Neuroimage 2014, 102, 80–91. [Google Scholar] [CrossRef]
- Lystad, R.P.; Pollard, H. Functional neuroimaging: A brief overview and feasibility for use in chiropractic research. J. Can. Chiropr. Assoc. 2009, 53, 59–72. [Google Scholar]
- Malmivuo, J. Comparison of the properties of EEG and MEG in detecting the electric activity of the brain. Brain Topogr 2012, 25, 1–19. [Google Scholar] [CrossRef]
- Cuthbert, B.N.; Schupp, H.T.; Bradley, M.M.; Birbaumer, N.; Lang, P.J. Brain potentials in affective picture processing: Covariation with autonomic arousal and affective report. Biol. Psychol. 2000, 52, 95–111. [Google Scholar] [CrossRef]
- Kheirkhah, M.; Brodoehl, S.; Leistritz, L.; Götz, T.; Baumbach, P.; Huonker, R.; Witte, O.W.; Klingner, C.M. Automated emotion classification in the early stages of cortical processing: An MEG study. Artif. Intell. Med. 2021, 115, 102063. [Google Scholar] [CrossRef] [PubMed]
- Olofsson, J.K.; Nordin, S.; Sequeira, H.; Polich, J. Affective picture processing: An integrative review of ERP findings. Biol. Psychol. 2008, 77, 247–265. [Google Scholar] [CrossRef]
- Radilova, J. The Late Positive Component of Visual Evoked-Response Sensitive to Emotional Factors. Act. Nerv. Super. 1982, 334–337. [Google Scholar]
- Radilova, J. P300 and Emotional States Studied by Psychophysiological Methods. Int. J. Psychophysiol. 1989, 7, 364–366. [Google Scholar] [CrossRef]
- Radilova, J.; Figar, S.; Radil, T. Sexual Arousal and Visual-Perception. Act. Nerv. Super. 1983, 25, 168–170. [Google Scholar]
- Lang, P.J.B.; Margaret, M.; Cuthbert, B.N. International affective picture system (IAPS): Technical manual and affective ratings. NIMH Cent. Study Emot. Atten. 1997, 1, 39–58. [Google Scholar]
- Lang, P. Behavioral treatment and bio-behavioral assessment: Computer applications. Technol. Ment. Health Care Deliv. Syst. 1980, 119–137. [Google Scholar]
- Taulu, S.; Simola, J. Spatiotemporal signal space separation method for rejecting nearby interference in MEG measurements. Phys. Med. Biol. 2006, 51, 1759–1768. [Google Scholar] [CrossRef] [PubMed]
- Oostenveld, R.; Fries, P.; Maris, E.; Schoffelen, J.M. FieldTrip: Open source software for advanced analysis of MEG, EEG, and invasive electrophysiological data. Comput. Intell. Neurosci. 2011, 2011, 156869. [Google Scholar] [CrossRef]
- Abadi, M.K.; Subramanian, R.; Kia, S.M.; Avesani, P.; Patras, I.; Sebe, N. DECAF: MEG-Based Multimodal Database for Decoding Affective Physiological Responses. IEEE Trans. Affect. Comput. 2015, 6, 209–222. [Google Scholar] [CrossRef]
- Hauk, O. Vectorview Description—Meg Wiki, Elekta Neuromag Vectorview Syst. 2013. Available online: http://imaging.mrc-cbu.cam.ac.uk/meg/VectorviewDescription (accessed on 1 April 2021).
- Hu, Y.; Yin, C.; Zhang, J.; Wang, Y. Partial Least Square Aided Beamforming Algorithm in Magnetoencephalography Source Imaging. Front. Neurosci. 2018, 12, 616. [Google Scholar] [CrossRef] [PubMed]
- Kheirkhah, M.; Brodoehl, S.; Leistritz, L.; Götz, T.; Baumbach, P.; Huonker, R.; Witte, O.W.; Volk, G.F.; Guntinas-Lichius, O.; Klingner, C.M. Abnormal Emotional Processing and Emotional Experience in Patients with Peripheral Facial Nerve Paralysis: An MEG Study. Brain Sci. 2020, 10, 147. [Google Scholar] [CrossRef]
- Lopez, M.E.; Garcés, P.; Cuesta, P.; Castellanos, N.; Aurtenetxe, S.; Bajo, R.; Marcos, A.; Montenegro, M.; Yubero, R.; Del Pozo, F.; et al. Synchronization during an internally directed cognitive state in healthy aging and mild cognitive impairment: A MEG study. Age 2014, 36, 9643. [Google Scholar] [CrossRef] [PubMed]
- Wittling, W.; Roschmann, R. Emotion-Related Hemisphere Asymmetry: Subjective Emotional Responses to Laterally Presented Films. Cortex 1993, 29, 431–448. [Google Scholar] [CrossRef]
- Aldhafeeri, F.M.; Mackenzie, I.; Kay, T.; Alghamdi, J.; Sluming, V. Regional brain responses to pleasant and unpleasant IAPS pictures: Different networks. Neurosci. Lett. 2012, 512, 94–98. [Google Scholar] [CrossRef] [PubMed]
- Amaral, D.G. The amygdala, social behavior, and danger detection. Emot. Inside Out 2003, 1000, 337–347. [Google Scholar] [CrossRef]
- Dellacherie, D.; Hasboun, D.; Baulac, M.; Belin, P.; Samson, S. Impaired recognition of fear in voices and reduced anxiety after unilateral temporal lobe resection. Neuropsychologia 2011, 49, 618–629. [Google Scholar] [CrossRef]
- Dolcos, F.; LaBar, K.S.; Cabeza, R. Dissociable effects of arousal and valence on prefrontal activity indexing emotional evaluation and subsequent memory: An event-related fMRI study. Neuroimage 2004, 23, 64–74. [Google Scholar] [CrossRef] [PubMed]
- Horton, P.C. Positive emotions and the right parietal cortex. Psychiatr. Clin. N. Am. 1988, 11, 461–474. [Google Scholar] [CrossRef]
- Lettieri, G.; Handjaras, G.; Ricciardi, E.; Leo, A.; Papale, P.; Betta, M.; Pietrini, P.; Cecchetti, L. Emotionotopy in the human right temporo-parietal cortex. Nat. Commun. 2019, 10, 5568. [Google Scholar] [CrossRef] [PubMed]
- Zhang, H.; Japee, S.; Stacy, A.; Flessert, M.; Ungerleider, L.G. Anterior superior temporal sulcus is specialized for non-rigid facial motion in both monkeys and humans. Neuroimage 2020, 218, 116878. [Google Scholar] [CrossRef]
- Junghofer, M.; Sabatinelli, D.; Bradley, M.M.; Schupp, H.T.; Elbert, T.R.; Lang, P.J. Fleeting images: Rapid affect discrimination in the visual cortex. Neuroreport 2006, 17, 225–229. [Google Scholar] [CrossRef]
- Sabatinelli, D.; Bradley, M.M.; Fitzsimmons, J.R.; Lang, P.J. Parallel amygdala and inferotemporal activation reflect emotional intensity and fear relevance. Neuroimage 2005, 24, 1265–1270. [Google Scholar] [CrossRef] [PubMed]
- Hagan, C.C.; Woods, W.; Johnson, S.; Calder, A.J.; Green, G.; Young, A.W. MEG demonstrates a supra-additive response to facial and vocal emotion in the right superior temporal sulcus. Proc. Natl. Acad. Sci. USA 2009, 106, 20010–20015. [Google Scholar] [CrossRef] [PubMed]
- Styliadis, C.; Ioannides, A.A.; Bamidis, P.D.; Papadelis, C. Mapping the Spatiotemporal Evolution of Emotional Processing: An MEG Study Across Arousal and Valence Dimensions. Front. Hum. Neurosci. 2018, 12, 322. [Google Scholar] [CrossRef]
- Chen, Y.H.; Dammers, J.; Boers, F.; Leiberg, S.; Edgar, J.C.; Roberts, T.; Mathiak, K. The temporal dynamics of insula activity to disgust and happy facial expressions: A magnetoencephalography study. Neuroimage 2009, 47, 1921–1928. [Google Scholar] [CrossRef]
- Craig, A.D. How do you feel? Interoception: The sense of the physiological condition of the body. Nat. Rev. Neurosci. 2002, 3, 655–666. [Google Scholar] [CrossRef]
- Critchley, H.D.; Wiens, S.; Rotshtein, P.; Öhman, A.; Dolan, R. Neural systems supporting interoceptive awareness. Nat. Neurosci. 2004, 7, 189–195. [Google Scholar] [CrossRef] [PubMed]
- Morris, J.S.; Ohman, A.; Dolan, R.J. Conscious and unconscious emotional learning in the human amygdala. Nature 1998, 393, 467–470. [Google Scholar] [CrossRef] [PubMed]
- Morris, J.S.; Ohman, A.; Dolan, R.J. A subcortical pathway to the right amygdala mediating “unseen” fear. Proc. Natl. Acad. Sci. USA 1999, 96, 1680–1685. [Google Scholar] [CrossRef] [PubMed]
- Keil, A.; Müller, M.M.; Gruber, T.; Wienbruch, C.; Stolarova, M.; Elbert, T. Effects of emotional arousal in the cerebral hemispheres: A study of oscillatory brain activity and event-related potentials. Clin. Neurophysiol. 2001, 112, 2057–2068. [Google Scholar] [CrossRef]
- Moratti, S.; Strange, B.; Rubio, G. Emotional arousal modulation of right temporoparietal cortex in depression depends on parental depression status in women: First evidence. J. Affect. Disord. 2015, 178, 79–87. [Google Scholar] [CrossRef]
- Güntekin, B.; Femir, B.; Gölbaşı, B.T.; Tülay, E.; Başar, E. Affective pictures processing is reflected by an increased long-distance EEG connectivity. Cogn. Neurodynamics 2017, 11, 355–367. [Google Scholar] [CrossRef]
- Duma, G.M.; Mento, G.; Semenzato, L.; Tressoldi, P.E. EEG anticipation of random high and low arousal faces and sounds. F1000Research 2019, 8, 1508. [Google Scholar] [CrossRef]
- Smith, S.D.; McIver, T.A.; Di Nella, M.S.J.; Crease, M.L. The effects of valence and arousal on the emotional modulation of time perception: Evidence for multiple stages of processing. Emotion 2011, 11, 1305–1313. [Google Scholar] [CrossRef]
Publisher’s Note: MDPI stays neutral with regard to jurisdictional claims in published maps and institutional affiliations. |
© 2021 by the authors. Licensee MDPI, Basel, Switzerland. This article is an open access article distributed under the terms and conditions of the Creative Commons Attribution-NonCommercial (CC BY-NC) license (https://creativecommons.org/licenses/by-nc/4.0/).