Changes in the Brain Activity and Visual Performance of Patients with Strabismus and Amblyopia after a Compete Cycle of Light Therapy

 , ,
, ,  and
and 
Abstract
1. Introduction
2. Neuronic™
3. Materials and Methods
3.1. Inclusion Criteria
3.2. Exclusion Criteria
3.3. Data Collection
- Phase one:
- Detailed medical histories to establish the cause of strabismus and amblyopia were collected. Near and distance visual acuity and noncycloplegic objective refraction were performed. Cycloplegic objective refraction using two drops of 1% tropicamide [27], and ophthalmoscopy to establish the type of fixation under the cycloplegic effect was carried out.
- Phase two:
- Subjective refraction for the best optical correction was performed. Posteriori, the visual efficiency evaluation was carried out. It included near and distance visual acuity with the new prescription; measurements of the deviation and magnitude of strabismus; motor and sensory fusion; fixation and correspondence using the Macular Integration Test and Bagolini lenses; motility (paresis and paralysis) [28]; pupillary reflex; hyper-hypotropia; and the assessment of dissociated elements such as latent or manifest nystagmus, dissociated vertical deviation, angle variability, and limitation in abduction followed by horizontal incomitancies [25,29]. Patients with a visual acuity of ≤0.2 logMAR were reexamined after wearing the newly prescribed glasses for four weeks [30]. The type of strabismus was established based on the clinical data collected. Visual field measures were performed using the Functional Color Field Tester (FCFT) devised by the Bernell Corporation with the best optical correction. Except for visual fields measures which are explained below, the above-mentioned clinical testing for the visual performance of participants can be find in [16].Visual field measures were performed in monocular and under scotopic conditions, using the optical correction of the patient. For this purpose, a screen with a minimum resolution of 768–1024 as recommended by the FCFT manufacturers was used. The movement perception (white target), the functional visual fields (red-blue-green targets), and the blind spot were evaluated through the FCFT. The estimators of the parameters were as follows: diameters of 3.2 and 1.6 mm for the white target and the red, blue, and green targets, respectively. The target-presentation speed was of 36 mm/s; target brightness setting of 176 (no unit), and a random order of presentation regardless of target color. Targets were initially presented at 15 degrees from the center of the screen. The central fixation target was a single digit that randomly flashed at intervals of 1500 ms. Visual field measures were obtained before beginning any treatment (basal), after eight treatment sessions (to monitor progress), and after 20 sessions of LTH program (final) [17,18].
- Phase three:
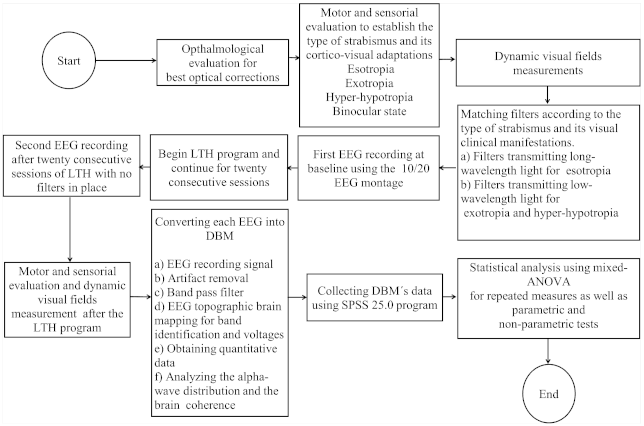
- Only patients who met the inclusion criteria were scheduled for the baseline brain activity measurement through electroencephalography (EEG), and the subsequent LTH program. Filters were matched according to the type of strabismus and the visual clinical manifestations as shown in the flowchart in Figure 2 which illustrates the steps followed in this research.
- Phase four:
- A second EEG recording after twenty consecutive sessions of LTH was performed. Visual performance and visual field measures were repeated after the complete cycle of LTH treatment.
- Phase five:
- qEEG data were obtained and the statistical analysis using the SPSS 25.0 program was performed.
3.4. EEG and LTH Parameters and Procedure
3.5. Statistical Analysis
4. Results
4.1. Demographic and Visual Measurements at Baseline
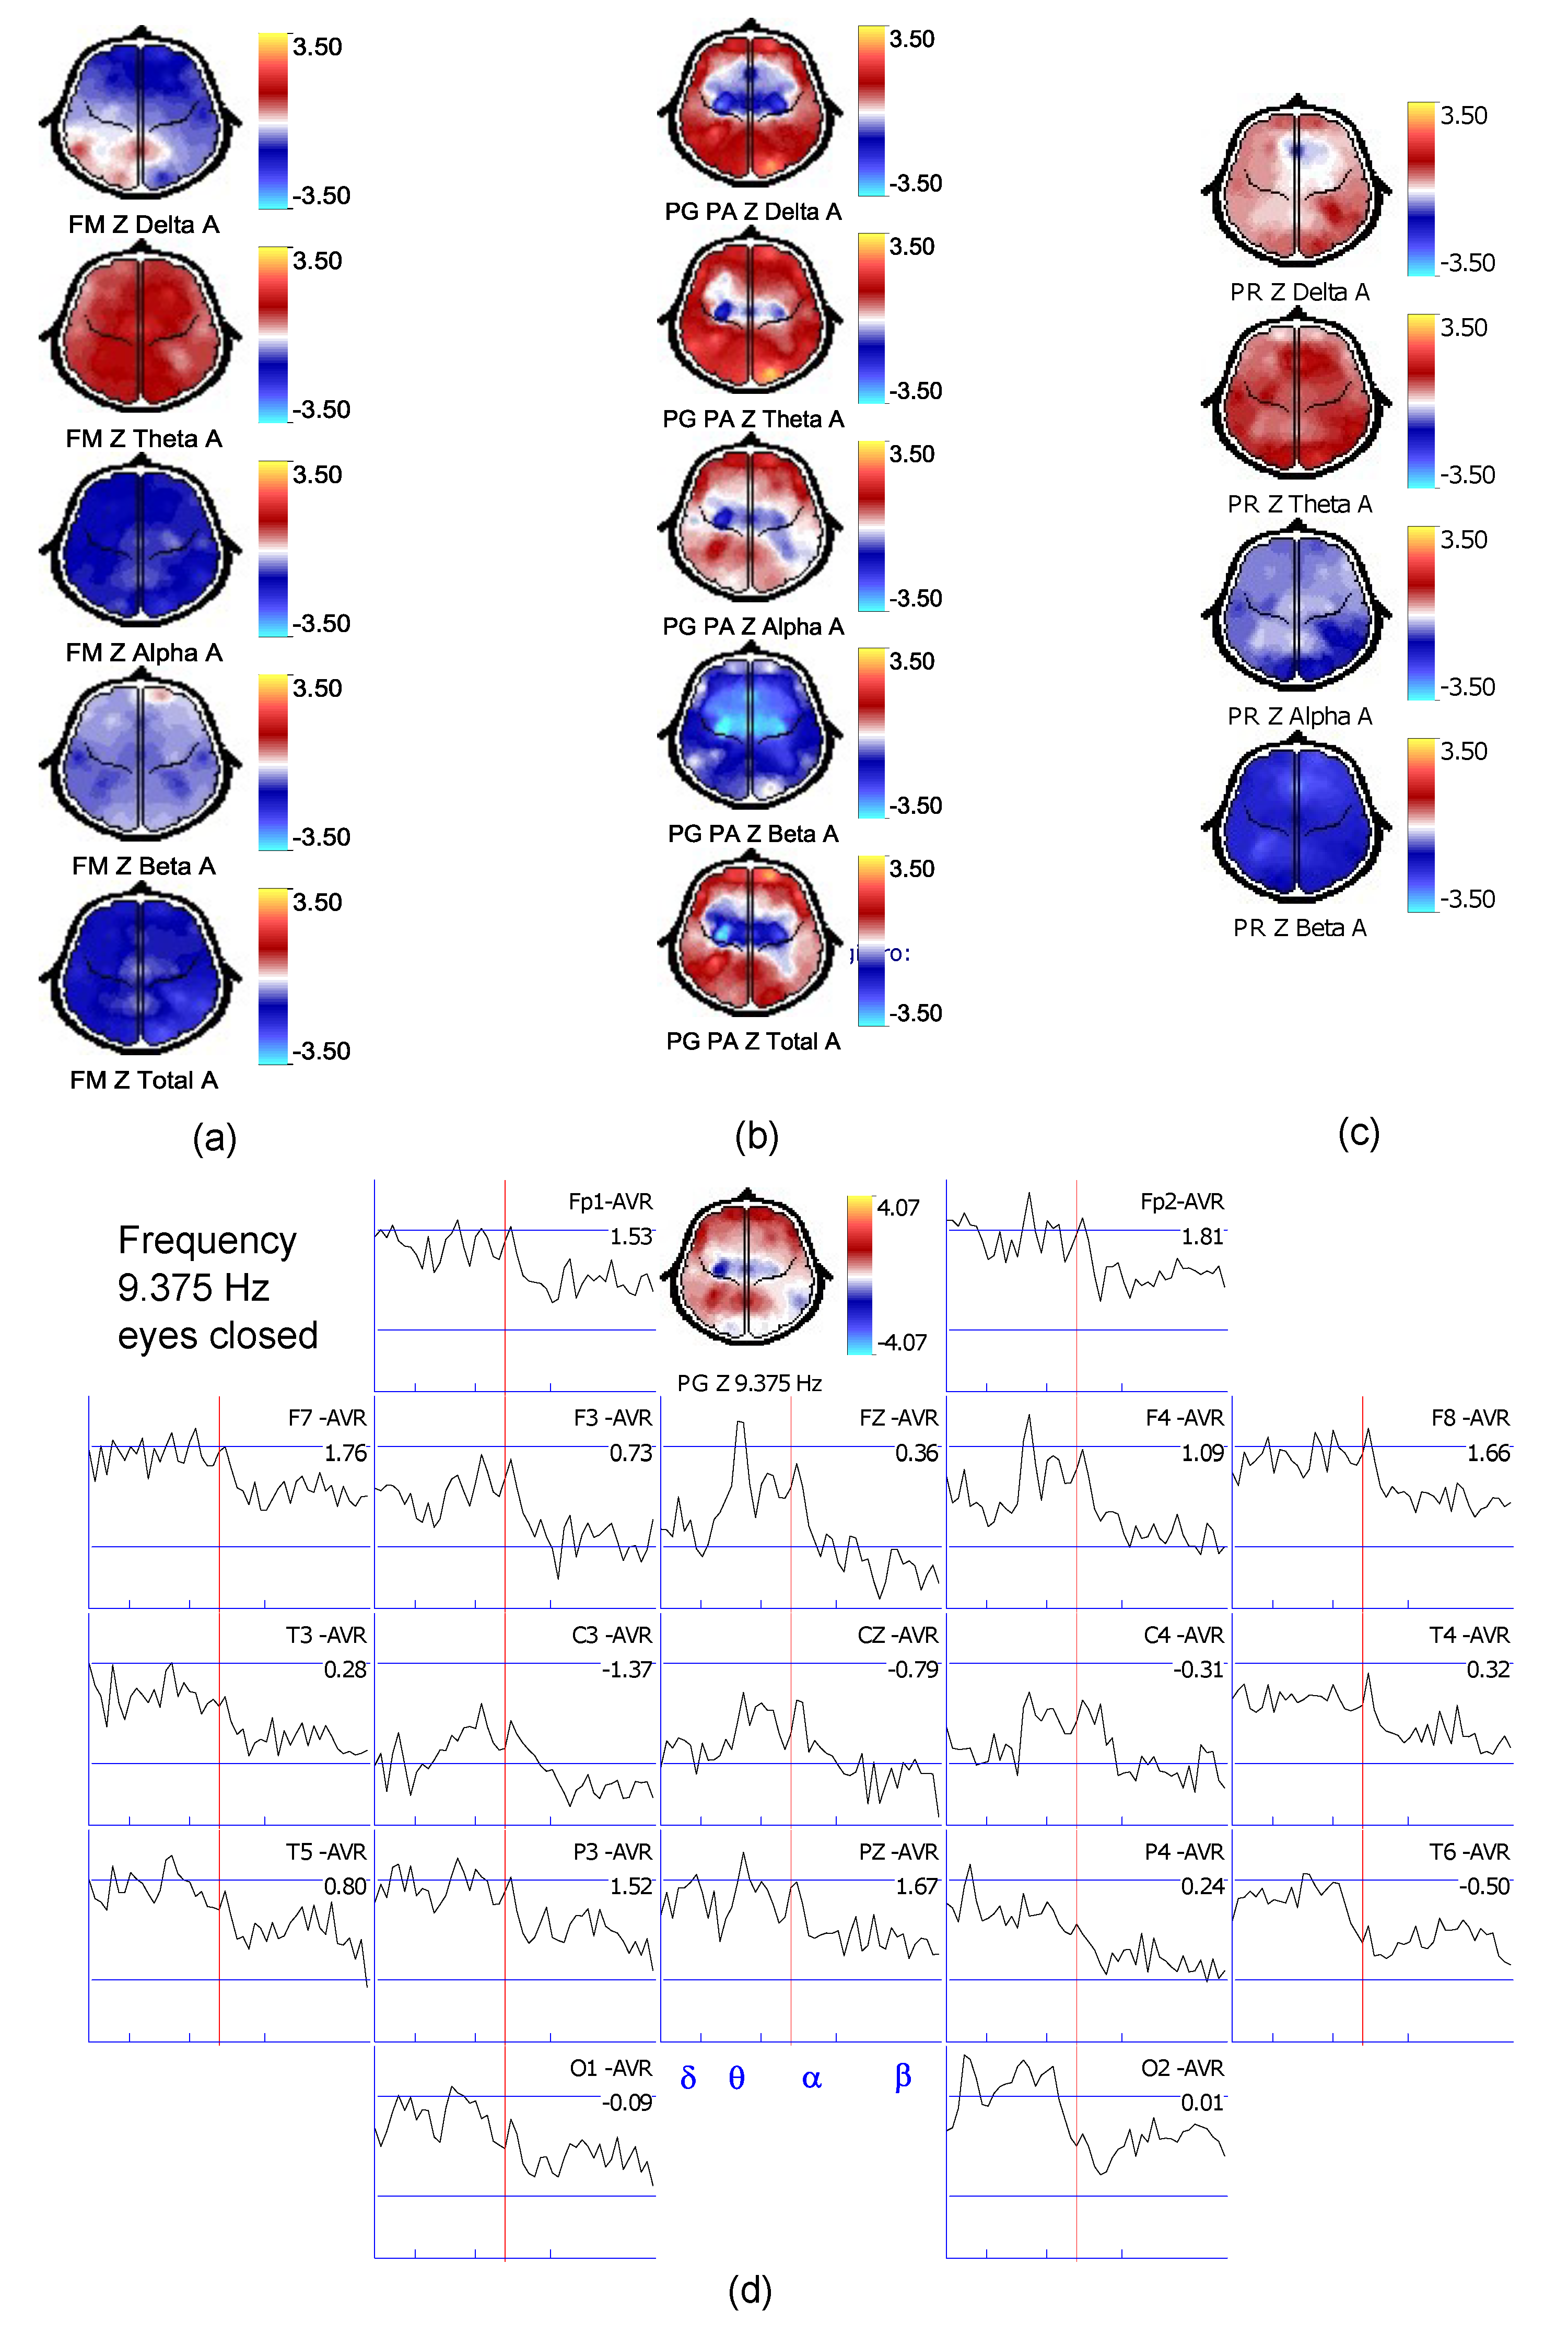
4.2. qEEG Measurements
4.3. Spearman Correlation Coefficients
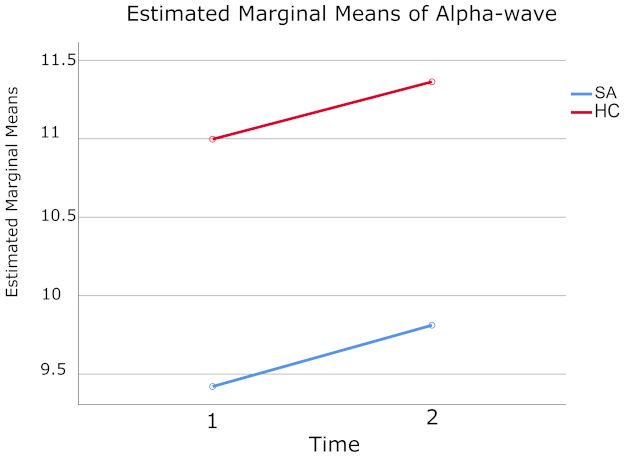
4.4. qEEG Differences in the Distribution of Alpha and Theta-Waves across the Brain, at Baseline, and after the Complete Cycle of LTH in SA Patients
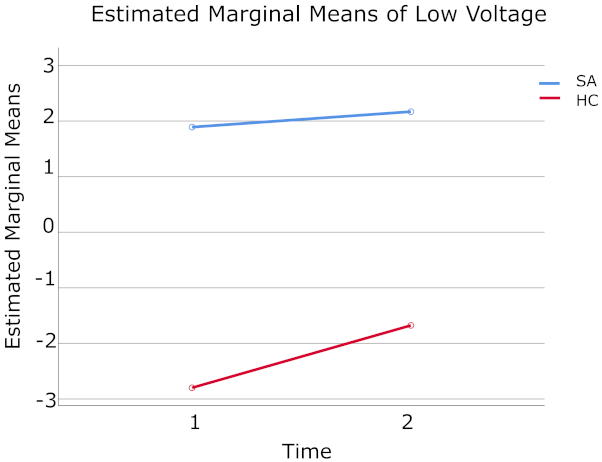
4.5. qEEG Differences Related to the Brain Coherence at Baseline and after the Complete Cycle of LTH in SA Patients
4.6. qEEG Differences in the Distribution of the Alpha-Wave across the Brain, and the State of Interhemispheric Synchronicity at Baseline, and after the Administration of LTH in HCs
4.7. Assessment of the LTH Effect on Clinical Metrics, Such As the Angle of Strabismus, Phoria State, Visual Acuity, Amount of Stereopsis, and Visual Fields
5. Discussion
5.1. The Alpha-Wave Activity and Interhemispheric Synchronicity
5.2. The Anteroposterior Gradient
5.3. The Theta-Wave Activity and Its Distribution
5.4. Spearman Correlations
5.5. Changes in Visual Metrics
6. Conclusions
Author Contributions
Funding
Institutional Review Board Statement
Informed Consent Statement
Data Availability Statement
Acknowledgments
Conflicts of Interest
Abbreviations
References
- Sporns, O.; Chialvo, D.R.; Kaiser, M.; Hilgetag, C.C. Organization, development and function of complex brain networks. Trends Cogn. Sci. 2004, 8, 418–425. [Google Scholar] [CrossRef]
- Friederichs, E.; Wahl, S. (Re)-wiring a brain with light: Clinical and visual processing findings after application of specific coloured glasses in patients with symptoms of a visual processing disorder (CVPD): Challenge of a possible new perspective? Med. Hypotheses 2017, 105, 49–62. [Google Scholar] [CrossRef] [PubMed]
- Zivin, J.A.; Albers, G.W.; Bornstein, N.; Chippendale, T.; Dahlof, B.; Devlin, T.; Fisher, M.; Hacke, W.; Holt, W.; Ilic, S.; et al. Effectiveness and safety of transcranial laser therapy for acute ischemic stroke. Stroke 2009, 40, 1359–1364. [Google Scholar] [CrossRef] [PubMed]
- Fifel, K.; Videnovic, A. Light therapy in Parkinson’s disease: Towards mechanism-based protocols. Trends Neurosci. 2018, 41, 252–254. [Google Scholar] [CrossRef] [PubMed]
- Suter, P.S.; Harvey, L.H. Vision Rehabilitation: Multidisciplinary Care of the Patient Following Brain Injury; CRC Press: Boca Raton, FL, USA, 2011. [Google Scholar]
- Scholl, B.; Tan, A.Y.; Priebe, N.J. Strabismus disrupts binocular synaptic integration in primary visual cortex. J. Neurosci. 2013, 33, 17108–17122. [Google Scholar] [CrossRef] [PubMed]
- Levi, D.M.; Knill, D.C.; Bavelier, D. Stereopsis and amblyopia: A mini-review. Vis. Res. 2015, 114, 17–30. [Google Scholar] [CrossRef] [PubMed]
- Barnes, G.; Hess, R.; Dumoulin, S.; Achtman, R.; Pike, G. The cortical deficit in humans with strabismic amblyopia. J. Physiol. 2001, 533, 281–297. [Google Scholar] [CrossRef]
- Shao, Y.; Li, Q.H.; Li, B.; Lin, Q.; Su, T.; Shi, W.Q.; Zhu, P.W.; Yuan, Q.; Shu, Y.Q.; He, Y.; et al. Altered brain activity in patients with strabismus and amblyopia detected by analysis of regional homogeneity: A resting-state functional magnetic resonance imaging study. Mol. Med. Rep. 2019, 19, 4832–4840. [Google Scholar] [CrossRef]
- Huang, X.; Li, H.J.; Zhang, Y.; Peng, D.C.; Hu, P.H.; Zhong, Y.L.; Zhou, F.Q.; Shao, Y. Microstructural changes of the whole brain in patients with comitant strabismus: Evidence from a diffusion tensor imaging study. Neuropsychiatr. Dis. Treat. 2016, 12, 2007. [Google Scholar]
- Tan, G.; Dan, Z.R.; Zhang, Y.; Huang, X.; Zhong, Y.L.; Ye, L.H.; Rong, R.; Ye, L.; Zhou, Q.; Shao, Y. Altered brain network centrality in patients with adult comitant exotropia strabismus: A resting-state fMRI study. J. Int. Med. Res. 2018, 46, 392–402. [Google Scholar] [CrossRef]
- Duan, Y.; Norcia, A.M.; Yeatman, J.D.; Mezer, A. The structural properties of major white matter tracts in strabismic amblyopia. Investig. Ophthalmol. Vis. Sci. 2015, 56, 5152–5160. [Google Scholar] [CrossRef]
- Ouyang, J.; Yang, L.; Huang, X.; Zhong, Y.L.; Hu, P.H.; Zhang, Y.; Pei, C.G.; Shao, Y. The atrophy of white and gray matter volume in patients with comitant strabismus: Evidence from a voxel-based morphometry study. Mol. Med. Rep. 2017, 16, 3276–3282. [Google Scholar] [CrossRef]
- Min, Y.L.; Su, T.; Shu, Y.Q.; Liu, W.F.; Chen, L.L.; Shi, W.Q.; Jiang, N.; Zhu, P.W.; Yuan, Q.; Xu, X.W.; et al. Altered spontaneous brain activity patterns in strabismus with amblyopia patients using amplitude of low-frequency fluctuation: A resting-state fMRI study. Neuropsychiatr. Dis. Treat. 2018, 14, 2351. [Google Scholar] [CrossRef]
- Joly, O.; Frankó, E. Neuroimaging of amblyopia and binocular vision: A review. Front. Integr. Neurosci. 2014, 8, 62. [Google Scholar] [CrossRef]
- Ibrahimi, D.; Mendiola-Santibañez, J.D.; Cruz Martínez, E.; Rodríguez-Reséndiz, J.; Pacheco, I.T. Cortical Activity at Baseline and During Light Stimulation in Patients With Strabismus and Amblyopia. IEEE Access 2021, 9, 22430–22446. [Google Scholar] [CrossRef]
- Gottlieb, R.L.; Wallace, L.B. Syntonic Phototherapy. Photomed. Laser Surg. 2010, 28, 449–452. [Google Scholar] [CrossRef]
- Wallace, L.B. The Theory and Practice of Syntonic Phototherapy: A Review. Optom. Vis. Dev. 2009, 40, 73–81. [Google Scholar]
- Chabot, R.; Coben, R.; Hirshberg, L.; Cantor, D. QEEG and VARETA based neurophysiological indices of brain dysfunction in attention deficit and autistic spectrum disorder. Austin J. Autism Relat. Disabil. 2015, 1, 1007. [Google Scholar]
- Thatcher, R.W.; Lubar, J.F. History of the scientific standards of QEEG normative databases. Introduction to Quantitative EEG and Neurofeedback: Advanced Theory and Applications; Academic Press: Cambridge, MA, USA, 2009; Volume 2, pp. 29–59. [Google Scholar]
- Schomer, D.L.; Da Silva, F.L. Niedermeyer’s Electroencephalography: Basic Principles, Clinical Applications, and Related Fields; Lippincott Williams & Wilkins: Philadelphia, PA, USA, 2012. [Google Scholar]
- Vandewalle, G.; Maquet, P.; Dijk, D.J. Light as a modulator of cognitive brain function. Trends Cogn. Sci. 2009, 13, 429–438. [Google Scholar] [CrossRef] [PubMed]
- Kinoshita, M.; Komatsu, H. Neural representation of the luminance and brightness of a uniform surface in the macaque primary visual cortex. J. Neurophysiol. 2001, 86, 2559–2570. [Google Scholar] [CrossRef]
- Natasha, G.; Tan, A.; Farhatnia, Y.; Rajadas, J.; Hamblin, M.R.; Khaw, P.T.; Seifalian, A.M. Channelrhodopsins: Visual regeneration and neural activation by a light switch. New Biotechnol. 2013, 30, 461–474. [Google Scholar]
- Griffin, J.R.; Borsting, E.J. Binocular Anomalies: Theory, Testing & Therapy, 2 Vols, 5th ed.; Optometric Extension Program Foundation: Timonium, MD, USA, 2010. [Google Scholar]
- Press, L.J. Applied Concepts in Vision Therapy; Optometric Extension Program Foundation: Timonium, MD, USA, 2013. [Google Scholar]
- Yazdani, N.; Sadeghi, R.; Momeni-Moghaddam, H.; Zarifmahmoudi, L.; Ehsaei, A. Comparison of cyclopentolate versus tropicamide cycloplegia: A systematic review and meta-analysis. J. Optom. 2018, 11, 135–143. [Google Scholar] [CrossRef] [PubMed]
- Maples, W. Visual factors that significantly impact academic performance. Optometry 2003, 74, 35–49. [Google Scholar] [PubMed]
- Scheiman, M.; Wick, B. Clinical Management of Binocular Vision: Heterophoric, Accommodative, and Eye Movement Disorders; Lippincott Williams & Wilkins: Philadelphia, PA, USA, 2008. [Google Scholar]
- Tailor, V.; Bossi, M.; Greenwood, J.A.; Dahlmann-Noor, A. Childhood amblyopia: Current management and new trends. Br. Med. Bull. 2016, 119, 75. [Google Scholar] [CrossRef]
- Teplan, M. Fundamentals of EEG measurement. Meas. Sci. Rev. 2002, 2, 1–11. [Google Scholar]
- Fan, L.; Li, H.; Zhuo, J.; Zhang, Y.; Wang, J.; Chen, L.; Yang, Z.; Chu, C.; Xie, S.; Laird, A.R.; et al. The human brainnetome atlas: A new brain atlas based on connectional architecture. Cereb. Cortex 2016, 26, 3508–3526. [Google Scholar] [CrossRef]
- Britton, J.W.; Frey, L.C.; Hopp, J.L.; Korb, P.; Koubeissi, M.Z.; Lievens, W.E.; Pestana-Knight, E.M.; St, E.L. Electroencephalography (EEG): An Introductory Text and Atlas of Normal and Abnormal Findings in Adults, Children, and Infants; Sociedad Estadounidense de Epilepsia: Chicago, IL, USA, 2016. [Google Scholar]
- Brouwer, A.; Nguyen, H.T.; Snoek, F.J.; van Raalte, D.H.; Beekman, A.T.F.; Moll, A.C.; Bremmer, M.A. Light therapy: Is it safe for the eyes? Acta Psychiatr. Scand. 2017, 136, 534–548. [Google Scholar] [CrossRef]
- Gruber, W.R.; Zauner, A.; Lechinger, J.; Schabus, M.; Kutil, R.; Klimesch, W. Alpha phase, temporal attention, and the generation of early event related potentials. Neuroimage 2014, 103, 119–129. [Google Scholar] [CrossRef]
- Klimesch, W. Alpha-band oscillations, attention, and controlled access to stored information. Trends Cogn. Sci. 2012, 16, 606–617. [Google Scholar] [CrossRef]
- Willeford, K.T.; Fimreite, V.; Ciuffreda, K.J. The effect of spectral filters on VEP and alpha-wave responses. J. Optom. 2016, 9, 110–117. [Google Scholar] [CrossRef]
- Sauseng, P.; Griesmayr, B.; Freunberger, R.; Klimesch, W. Control mechanisms in working memory: A possible function of EEG theta oscillations. Neurosci. Biobehav. Rev. 2010, 34, 1015–1022. [Google Scholar] [CrossRef]
- Nowack, W.J. Neocortical dynamics and human EEG rhythms. Neurology 1995, 45, 1793. [Google Scholar] [CrossRef]
- Fries, P. A mechanism for cognitive dynamics: Neuronal communication through neuronal coherence. Trends Cogn. Sci. 2005, 9, 474–480. [Google Scholar] [CrossRef]
- Prayag, A.S.; Münch, M.; Aeschbach, D.; Chellappa, S.L.; Gronfier, C. Light modulation of human clocks, wake, and sleep. Clocks Sleep 2019, 1, 193–208. [Google Scholar] [CrossRef]
- Rahman, S.A.; Flynn-Evans, E.E.; Aeschbach, D.; Brainard, G.C.; Czeisler, C.A.; Lockley, S.W. Diurnal spectral sensitivity of the acute alerting effects of light. Sleep 2014, 37, 271–281. [Google Scholar] [CrossRef]
- Abhang, P.A.; Gawali, B.W.; Mehrotra, S.C. Technological basics of EEG recording and operation of apparatus. In Introduction to EEG-and Speech-Based Emotion Recognition, Proceedings of the 2nd National Conference on Innovative Paradigms in Engineering and Technology, Hyderabad, India, 26–29, November 2013; Academic Press: Cambridge, MA, USA, 2016. [Google Scholar]
- Duffau, H. Brain plasticity and reorganization before, during, and after glioma resection. Glioblastoma 2016, 225–236. [Google Scholar]
- Ibrahimi, D.; Mendiola-Santibañez, J.D.; Gkaros, A.P. Analysis of the potential impact of strabismus with and without amblyopia on visual-perceptual and visual-motor skills evaluated using TVPS-3 and VMI-6 tests. J. Optom. 2020, 14, 166–175. [Google Scholar] [CrossRef]
- Pereira, J.; Direito, B.; Sayal, A.; Ferreira, C.; Castelo-Branco, M. Self-Modulation of Premotor Cortex Interhemispheric Connectivity in a Real-Time Functional Magnetic Resonance Imaging Neurofeedback Study Using an Adaptive Approach. Brain Connect. 2019, 9, 662–672. [Google Scholar] [CrossRef]


| Parameters | SA Mean ± SD | HCs Mean ± SD | p-Value |
|---|---|---|---|
| Male/female | 9/8 | 6/5 | - |
| Age (years) | 18.1 ± 10.5 | 22.3 ± 5.9 | 0.49 |
| Motor eye dominance | 11 R/6 L | 9 R/2 L | - |
| Handedness | 17 R | 10 R/1 L | - |
| Angle of esotropia (far/near) | 29.0 ± 14.84/27 ± 17.02 | - | - |
| Angle of exotropia (far/near) | 12.71 ± 8.30/25.43 ± 12.53 | - | - |
| Angle of hypertropia (far/near) | 9.2 ± 3.03/9.2 ± 3.03 | - | - |
| Visual Acuity OD (far/near) | 0.32 ± 0.37/0.24 ± 0.36 | 0.01 ± 0.03/0.03 ± 0.05 | 0.001/0.004 |
| Visual Acuity OS (far/near) | 0.35 ± 0.33/0.2 ± 0.25 | 0.01 ± 0.03/0.03 ± 0.05 | 0.001/0.002 |
| Stereopsis | 128.8 ± 252.1 | 25.82 ± 12.81 | <0.001 |
| Source | Type III Sum of Squares | F | Sig. | Partial Eta Square |
|---|---|---|---|---|
| Intercept | 5776.835 | 4072.123 | 0.000 | 0.994 |
| Groups | 32.667 | 23.027 | 0.000 | 0.470 |
| Error | 36.884 |
| SA and HC Groups | Mean | Std. Error | 95% Confidence Interval | |
|---|---|---|---|---|
| Lower Bound | Upper BOUND | |||
| SA | 9.616 | 0.204 | 9.196 | 10.036 |
| HC | 11.180 | 0.254 | 10.658 | 11.702 |
| Source | F | Sig. | Partial Eta Squared | |
|---|---|---|---|---|
| Time | Sphericity Assumed | 4.542 | 0.043 | 0.149 |
| Greenhouse-Geisser | 4.542 | 0.043 | 0.149 | |
| Huynh-Feldt | 4.542 | 0.043 | 0.149 | |
| Lower-bound | 4.542 | 0.043 | 0.149 |
| Time | Mean | Std. Error | 95% Confidence Interval | |
|---|---|---|---|---|
| Lower Bound | Upper Bound | |||
| 1 | 10.209 | 0.206 | 9.786 | 10.632 |
| 2 | 10.587 | 0.163 | 10.253 | 10.922 |
| SA and HC Groups | Mean | Std. Deviation | N | |
|---|---|---|---|---|
| Alpha-wave activity at baseline | SA | 9.42100 | 1.103814 | 17 |
| HC | 10.99718 | 0.996305 | 11 | |
| Total | 10.04021 | 1.305439 | 28 | |
| Alpha-wave activity after LTH | SA | 9.81153 | 0.815620 | 17 |
| HC | 11.36309 | 0.880818 | 11 | |
| Total | 10.42107 | 1.130057 | 28 |
| Source | Type III Sume of Squares | F | Sig. | Partial Eta Square |
|---|---|---|---|---|
| Intercept | 0.574 | 0.101 | 0.753 | 0.004 |
| Groups | 243.228 | 42.986 | 0.000 | 0.623 |
| Error | 147.116 |
| SA and HC Groups | Mean | Std. Error | 95% Confidence Interval | |
|---|---|---|---|---|
| Lower Bound | Upper Bound | |||
| SA | 2.030 | 0.408 | 1.191 | 2.869 |
| HC | −2.237 | 0.507 | −3.280 | −1.195 |
| SA and HC Groups | Mean | Std. Deviation | N | |
|---|---|---|---|---|
| Low-voltage activity at baseline | SA | 1.8912 | 2.86705 | 17 |
| HC | −2.7982 | 0.66296 | 11 | |
| Total | 0.0489 | 3.23623 | 28 | |
| Low-voltage activity after LTH | SA | 2.1688 | 2.46504 | 17 |
| HC | −1.6764 | 1.56305 | 11 | |
| Total | 0.6582 | 2.85709 | 28 |
| Source | F | Sig | Partial Eta Squared | |
|---|---|---|---|---|
| Time x Groups | Sphericity Assumed | 8.114 | 0.008 | 0.238 |
| Greenhouse-Geisser | 8.114 | 0.008 | 0.238 | |
| Huynh-Feldt | 8.114 | 0.008 | 0.238 | |
| Lower-bound | 8.114 | 0.008 | 0.238 |
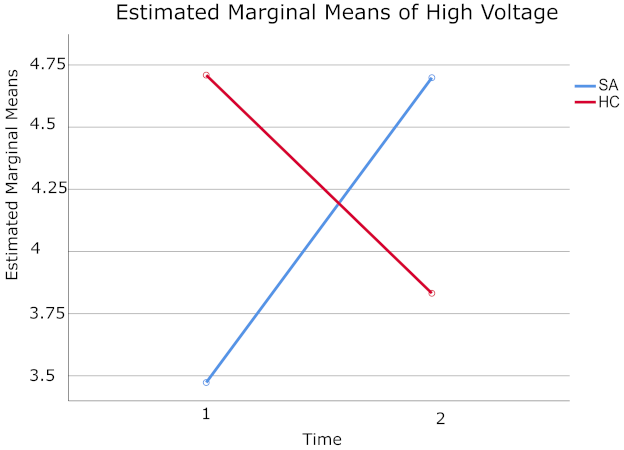
| SA and HC Groups | Time | Mean | Std. Error | 95% Confidence Interval | |
|---|---|---|---|---|---|
| Lower Bound | Upper Bound | ||||
| SA | 1 | 3.473 | 0.224 | 3.013 | 3.933 |
| 2 | 4.699 | 0.460 | 3.754 | 5.643 | |
| HC | 1 | 4.709 | 0.278 | 4.137 | 5.281 |
| 2 | 3.832 | 0.571 | 2.658 | 5.006 | |
| SA and HC Groups | Mean | Std. Deviation | N | |
|---|---|---|---|---|
| High voltage activity at baseline | SA | 3.4729 | 1.09514 | 17 |
| HC | 4.7091 | 0.54662 | 11 | |
| Total | 3.9586 | 1.09515 | 28 | |
| High voltage activity after LTH | SA | 4.6988 | 2.33463 | 17 |
| HC | 3.8318 | 0.78249 | 11 | |
| Total | 4.3582 | 1.90857 | 28 |
| Alpha-Wave Activity after LTH | |||
|---|---|---|---|
| Spearman’s rho | Alpha-wave activity at baseline | Correlation coefficient | 0.692 ** |
| Sig. (2-tailed) | 0.002 | ||
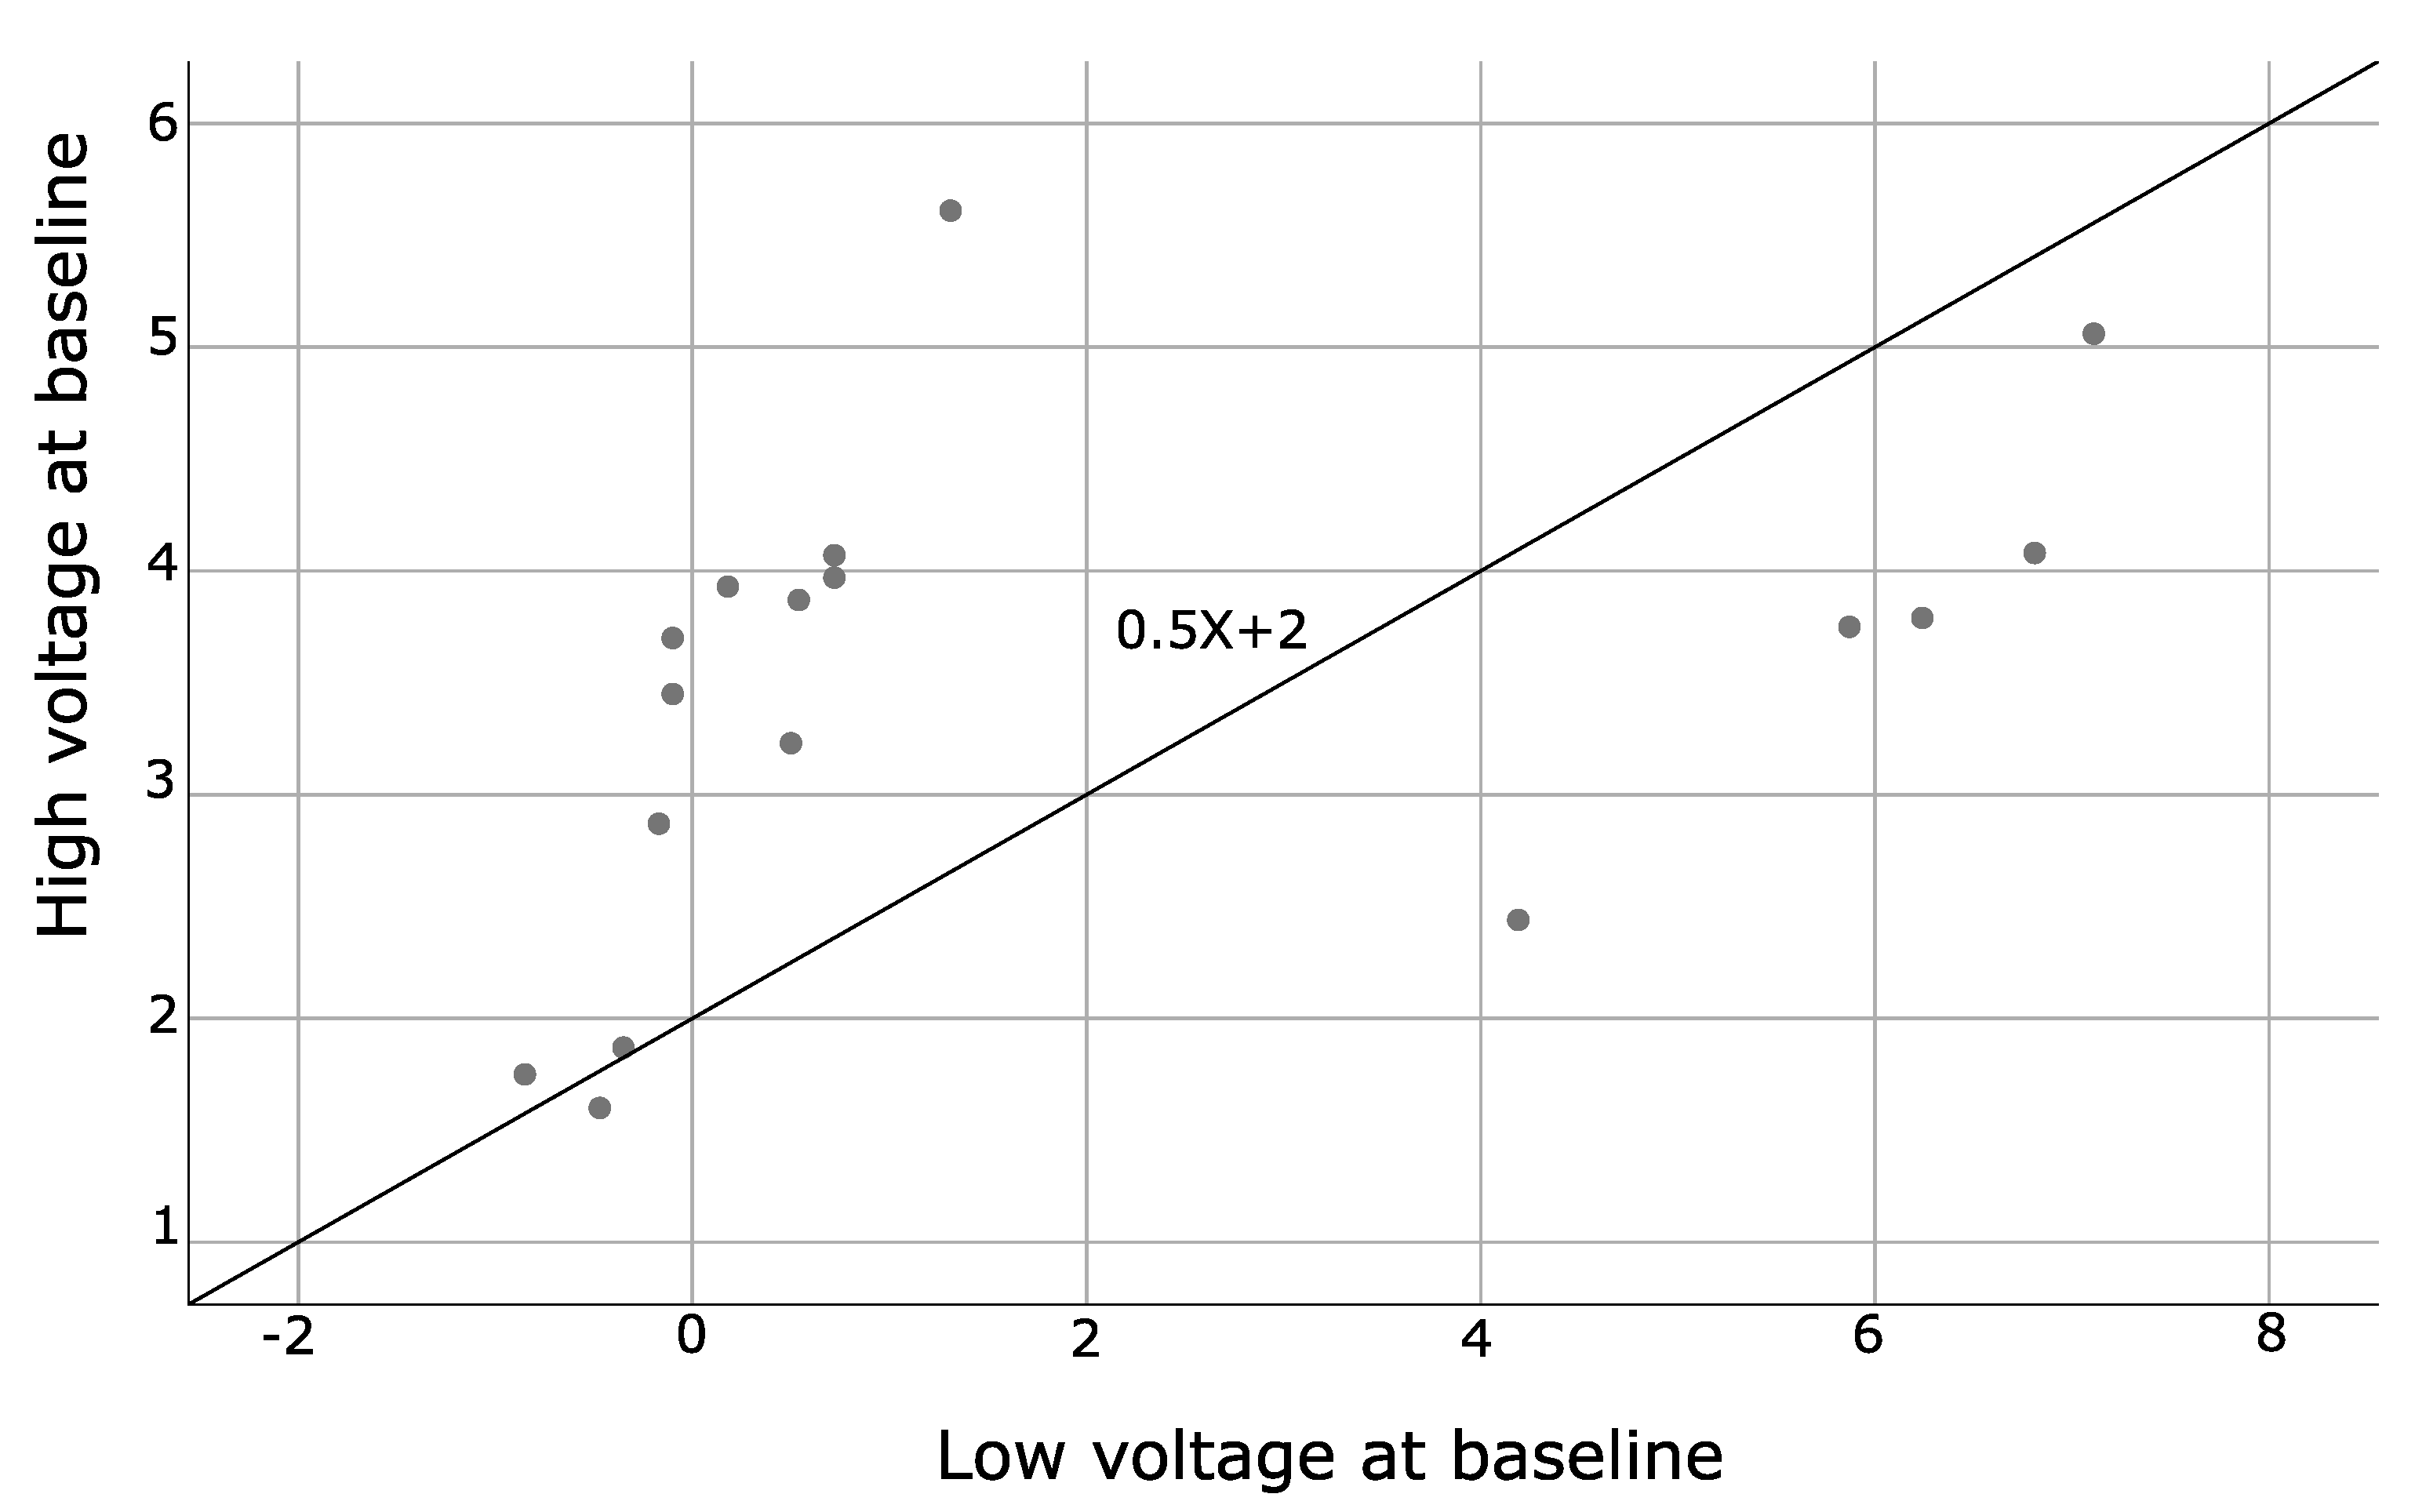
| High voltage at baseline | |||
| Spearman’s rho | Low voltage at baseline | Correlation coefficient | 0.729 ** |
| Sig. (2-tailed) | 0.001 | ||
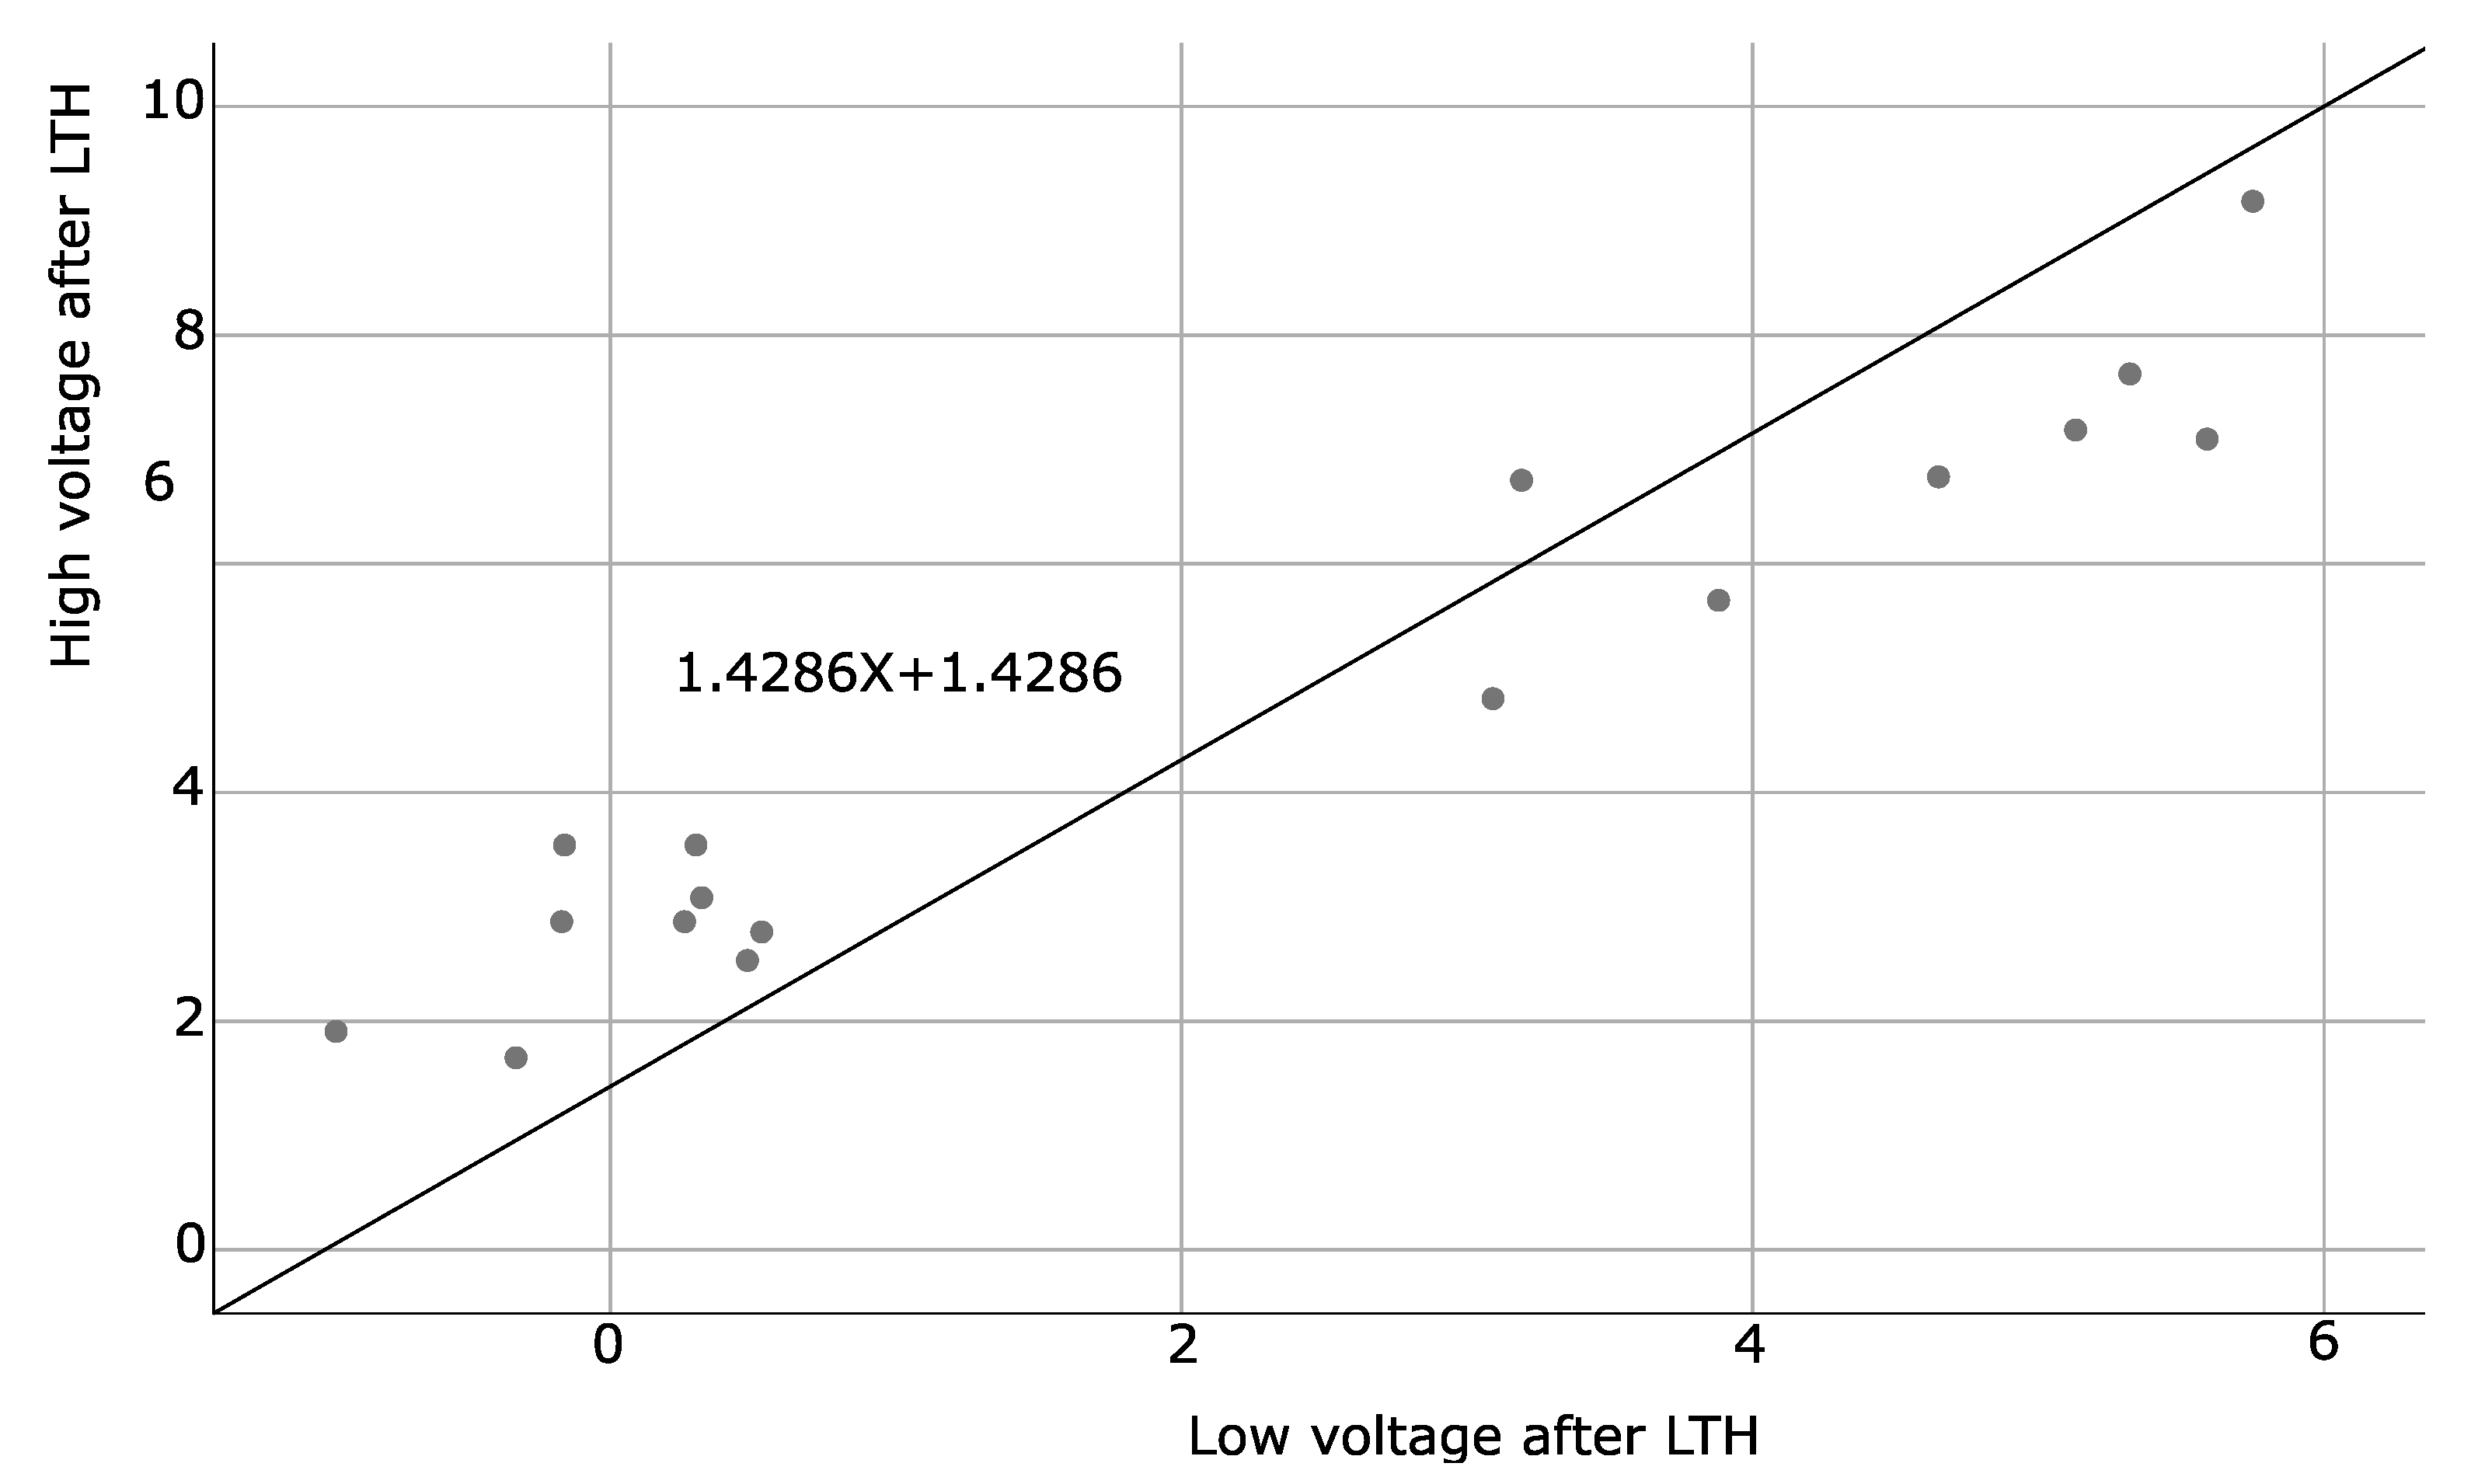
| High voltage after LS | |||
| Spearman’s rho | Low voltage after LTH | Correlation coefficient | 0.886 ** |
| Sig. (2-tailed) | <0.001 |
| Patients | Distribution of () | Distribution of () | Brain Coherence |
|---|---|---|---|
| 001 | Occipitals | Frontals | Synchrony |
| 002 | Parieto-occipitals | Fronto-centrals, predominating at centrals | Synchrony |
| 003 | Occipitals | Frontals and occipitals | Asynchrony of right temporal lobe |
| 004 | Frontals and left center-parietal lobe | Left frontal and right parietal lobe | Asynchrony |
| 005 | Right fronto-temporal and left parieto-occipital lobe | Frontals | Asynchrony of left temporal lobe |
| 006 | Occipitals | Right parieto-occipital lobe | Asynchrony of left temporal lobe |
| 007 | Frontals and occipitals | Frontals and centrals | Asynchrony of frontals and parieto-occipitals |
| 008 | Center-parietals | Right frontal and right parietal lobe | Synchrony |
| 009 | Left parietal lobe | Frontals and occipitals | Asynchrony of left parietal lobe |
| 010 | Left center-parietal lobe | Right frontal and right parietal lobe | Asynchrony of left centro-parietal lobe |
| 011 | Occipitals | Parieto-occipitals | Asynchrony of fronto-temporal and left parietal lobe |
| 012 | Left center-parietal lobe | Left parietal lobe | Asynchrony of left central and parietal lobe |
| 013 | Occipitals | Parietals and occipitals | Asynchrony of left frontal lobe |
| 014 | Left parieto-occipital lobe | Left parieto-occipital lobe | Asynchrony of left fronto-temporal lobe |
| 015 | Occipitals | Occipitals | Asynchrony of fronto-temporals |
| 016 | Occipitals | Right frontal lobe | Synchrony of occipitals |
| 017 | Parietals | Parietals | Asynchrony of left parietal lobe |
| Patients | Distribution of () | Distribution of () | Brain Coherence |
|---|---|---|---|
| 001 | Occipitals | Frontals | Asynchrony of left temporal lobe |
| 002 | Occipitals | Fronto-centrals and centrals | Synchrony |
| 003 | Occipitals | Frontals and occipitals | Synchrony of occipitals |
| 004 | Occipitals | Fronto-temporals and occipitals | Synchrony of occipitals |
| 005 | Occipitals | Frontals | Synchrony of occipitlas |
| 006 | Occipitals | Right parieto-occipital lobe | Synchrony of occipitals and parietals |
| 007 | Occipitals and parietals | Frontals and centrals | Synchrony of occipitals and parietals |
| 008 | Frontals and right centro-parietal lobe | Right frontal and right parietal lobe | Aynchrony of left frontal and centro-parietal lobe |
| 009 | Centro-parietals, predominating at centrals | Frontals and occipitals | Synchrony of centro-parietals |
| 010 | Occipitals | Right frontal lobe | Asynchrony of left temporal lobe |
| 011 | Occipitals and parietals | Fronto-temporals | Synchrony of parietals and occipitals |
| 012 | Occipitals | Temporals | Synchrony of occipitals |
| 013 | Occipitals | Parietals and occipitals | Asynchrony of left frontal lobe |
| 014 | Occipitals | Left frontal, parietal, temporal and occipital lobe | Synchrony of parieto-occipitals |
| 015 | Parietals | Frontals | Synchrony of occipitals |
| 016 | Occipitals | No theta-wave registered | Synchrony of occipitals |
| 017 | Parietals | Parietals | Synchrony parietals |
| Patients | Distribution of () at Baseline/after LTH | Brain Coherence at Baseline/after LTH |
|---|---|---|
| 001 | Occipitals/Occipitals | Synchrony of occipitals/Synchrony of occipitals |
| 002 | Occipitals/Occipitals | Asynchrony of parieto-occipitals/Synchrony of occipitals |
| 003 | Occipitals/Occipitals | Synchrony of parieto-occipitals/Synchrony occipitals |
| 004 | Parieto-occipitals/Parietals | Asynchrony of parieto-occipitals/Synchrony of occipitals |
| 005 | Parieto-occipitals/Occipitals | Asynchrony of parieto-occipitals/Synchrony of occipitals |
| 006 | Parietals/Occipitals | Synchrony of parietals/Synchrony of occipitals |
| 007 | Parietals/Occipitals | Synchrony of parietals/Synchrony of occipitals |
| 008 | Occipitals/Occipitals | Synchrony of parieto-occipitals/Synchrony of occipitals |
| 009 | Occipitals/Occipitals | Synchrony of occipitals/Synchrony of occipitals |
| 010 | Occipitals/Occipitals | Synchrony of occipitals/Synchrony of occipitlas |
| 011 | Occipitals/Occipitals | Synchrony of occipitals/Synchrony of occipitals |
| Parameters | HCs at Baseline | HCs after LTH | p-Value | SA at Baseline | SA after LTH | p-Value |
|---|---|---|---|---|---|---|
| Mean ± SD | Mean ± SD | Mean ± SD | Mean ± SD | |||
| VA OD Far | 0.01 ± 0.03 | 0.01 ± 0.03 | p > 0.05 | 0.32 ± 0.37 | 0.16 ± 0.24 | p < 0.001 |
| VA OD Near | 0.03 ± 0.05 | 0.03 ± 0.05 | p > 0.05 | 0.24 ± 0.36 | 0.12 ± 0.23 | p < 0.001 |
| VA OI Far | 0.01 ± 0.03 | 0.01 ± 0.03 | p > 0.05 | 0.35 ± 0.33 | 0.2 ± 0.27 | p < 0.001 |
| VA OI Near | 0.03 ± 0.05 | 0.03 ± 0.05 | p > 0.05 | 0.2 ± 0.25 | 0.14 ± 0.24 | p < 0.001 |
| Stereopsis | 25.82 ± 12.81 | 25.09 ± 13.99 | p = 0.001 | 128.8 ± 252.1 | 54.2 ± 73.31 | p < 0.001 |
| ET Far | - | - | - | 29.0 ± 14.84 | 19.13 ± 17.87 | p < 0.001 |
| ET Near | - | - | - | 27.0 ± 17.02 | 18.13 ± 18.47 | p = 0.001 |
| XT Far | - | - | - | 12.71 ± 8.3 | 8.14 ± 6.89 | p = 0.003 |
| XT Near | - | - | - | 25.43 ± 12.53 | 16.57± 10.52 | p = 0.001 |
| HT Far | - | - | - | 9.2 ± 3.03 | 5.17 ± 3.71 | p = 0.008 |
| HT Near | - | - | - | 9.2 ± 3.03 | 5.50 ± 3.45 | p = 0.005 |
| XF Near | 12.27 ± 5.69 | 14.18 ± 6.82 | p = 0.001 | - | - | - |
| Green OD | 15.79 ± 0.6 | 16.05 ± 0.85 | p = 0.003 | 15.38 ± 0.98 | 17.09 ± 0.39 | p < 0.001 |
| Green OI | 15.94 ± 0.42 | 16.31 ± 0.46 | p = 0.003 | 15.36 ± 0.9 | 17.25 ± 0.58 | p < 0.001 |
| Blue OD | 24.82 ± 0.81 | 24.9 ± 1.35 | p = 0.003 | 23.87 ± 0.85 | 25.69 ± 0.65 | p < 0.001 |
| Blue OI | 24.54 ± 0.6 | 25.14 ± 0.52 | p = 0.003 | 23.75 ± 1.2 | 25.95 ± 0.68 | p < 0.001 |
| Red OD | 23.45 ± 1.31 | 24.15 ± 1.14 | p = 0.003 | 23.02 ± 1.82 | 25.82 ± 0.67 | p < 0.001 |
| Red OI | 23.71 ± 1.28 | 24.52 ± 0.65 | p = 0.003 | 23.05 ± 1.48 | 25.98 ± 0.77 | p < 0.001 |
| White OD | 29.55 ± 0.75 | 29.65 ± 1.39 | p = 0.003 | 28.78 ± 1.43 | 31.04 ± 0.54 | p < 0.001 |
| White OI | 29.39 ± 1.37 | 29.99 ± 0.97 | p = 0.003 | 28.58 ± 1.73 | 31.09 ± 0.94 | p < 0.001 |
Publisher’s Note: MDPI stays neutral with regard to jurisdictional claims in published maps and institutional affiliations. |
© 2021 by the authors. Licensee MDPI, Basel, Switzerland. This article is an open access article distributed under the terms and conditions of the Creative Commons Attribution (CC BY) license (https://creativecommons.org/licenses/by/4.0/).
Share and Cite
Ibrahimi, D.; Mendiola-Santibañez, J.D.; Cruz-Martínez, E.; Gómez-Espinosa, A.; Torres-Pacheco, I. Changes in the Brain Activity and Visual Performance of Patients with Strabismus and Amblyopia after a Compete Cycle of Light Therapy. Brain Sci. 2021, 11, 657. https://doi.org/10.3390/brainsci11050657
Ibrahimi D, Mendiola-Santibañez JD, Cruz-Martínez E, Gómez-Espinosa A, Torres-Pacheco I. Changes in the Brain Activity and Visual Performance of Patients with Strabismus and Amblyopia after a Compete Cycle of Light Therapy. Brain Sciences. 2021; 11(5):657. https://doi.org/10.3390/brainsci11050657
Chicago/Turabian StyleIbrahimi, Danjela, Jorge D. Mendiola-Santibañez, Enoé Cruz-Martínez, Alfonso Gómez-Espinosa, and Irineo Torres-Pacheco. 2021. "Changes in the Brain Activity and Visual Performance of Patients with Strabismus and Amblyopia after a Compete Cycle of Light Therapy" Brain Sciences 11, no. 5: 657. https://doi.org/10.3390/brainsci11050657
APA StyleIbrahimi, D., Mendiola-Santibañez, J. D., Cruz-Martínez, E., Gómez-Espinosa, A., & Torres-Pacheco, I. (2021). Changes in the Brain Activity and Visual Performance of Patients with Strabismus and Amblyopia after a Compete Cycle of Light Therapy. Brain Sciences, 11(5), 657. https://doi.org/10.3390/brainsci11050657