Abstract
Background: There is growing interest in the use of new biomarkers such as glycated albumin (GA), but data are limited in acute ischemic stroke. We explored the impact of GA on short-term functional outcomes as measured using the modified Rankin Scale (mRS) at 3 months compared to glycated hemoglobin (HbA1c). Methods: A total of 1163 AIS patients from two hospitals between 2016 and 2019 were included. Patients were divided into two groups according to GA levels (GA < 16% versus GA ≥ 16%). Results: A total of 518 patients (44.5%) were included in the GA ≥ 16% group. After adjusting for multiple covariates, the higher GA group (GA ≥ 16%) had a 1.4-fold risk of having unfavorable mRS (95% CI 1.02–1.847). However, HbA1c was not significantly associated with 3-month mRS. In addition, GA ≥ 16% was independently associated with unfavorable short-term outcomes only in patients without diabetes. Conclusions: In light of these results, GA level might be a novel prognostic biomarker compared to HbA1c for short-term stroke outcome. Although the impact of GA is undervalued in the current stroke guidelines, GA monitoring should be considered in addition to HbA1c monitoring.
Keywords:
glycated albumin; glycated hemoglobin; brain ischemia; stroke; prognosis; biomarkers; blood glucose 1. Introduction
Glycated hemoglobin (HbA1c) reflects glycemic control over the past 2- to 3-month period and is considered the gold standard for the management of diabetes. Nonetheless, HbA1c has some clinical limitations; it does not reflect recent glycemic status, and a number of conditions (e.g., anemia, erythropoietin treatment, transfusion, and kidney disease) affect the test results [1,2]. Therefore, there is growing interest in using new biomarkers such as fructosamine or glycated albumin (GA), but there are limited data linking this indicator to outcomes in ischemic stroke. GA reflects glycemic control over approximately the last 2 to 4 weeks, reflecting the turnover of plasma proteins. Therefore, GA reflects relatively short-term control of glycemic status compared with HbA1c and could be a useful marker not influenced by situations that alter HbA1c levels. Additionally, because GA is measured by a standardized enzymatic methodology, the test is easy and fast to perform [3].
Multiple parameters, including initial glucose level, HbA1c, and glucose fluctuation, have been reported to predict poor stroke outcomes but remain controversial [3]. Traditionally, HbA1c is recognized as a well-known predictor of diabetic complications and cardiovascular outcomes [4,5,6,7]. However, several articles reported that HbA1c was not a good predictor of short-term outcomes, including in-hospital mortality, 6-month major adverse events, and all-cause mortality in the specific population [8,9]. In this regard, there has been some need to detect a novel index for diagnosing and managing glycemic control in covering the short-term effect in many critical illnesses. Furthermore, the role of GA in predicting stroke outcome in AIS has not been assessed previously. Therefore, we aimed to explore the impact of GA as a useful predictor for short-term functional outcome compared to HbA1c.
2. Materials and Methods
2.1. Study Population
We enrolled patients with acute ischemic stroke (AIS) or transient ischemic attack (TIA) who were admitted within 7 days of symptom onset to two stroke centers (Kangdong Sacred Heart Hospital, Hallym University College of Medicine, and Chuncheon Sacred Heart Hospital, Hallym University College of Medicine) from May 2016 through December 2019 into our prospective stroke registry system. Among a total of 1405 patients (541 patients from Kangdong Sacred Heart Hospital and 864 patients from Chuncheon Sacred Heart Hospital), fifty-eight subjects who were not evaluated for GA levels and 184 patients with TIA were excluded. As a result, a total of 1163 patients were included in this analysis (Figure 1).
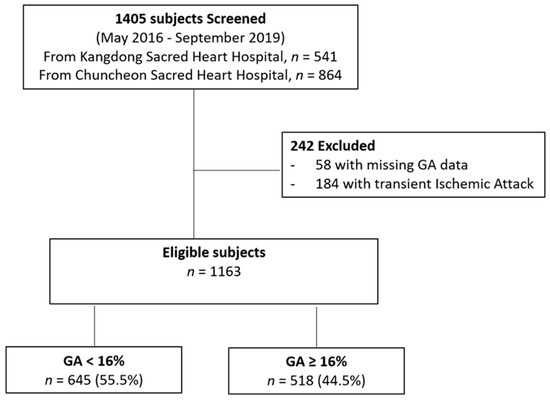
Figure 1.
Flow diagram of study population. GA, glycated albumin.
All patients received standard and optimal medical therapy during hospitalization. The institutional review boards of the three centers (Kangdong Sacred Heart Hospital IRB no. 2020-02-006-001 and Chuncheon Sacred Heart Hospital IRB no. 2017-89) approved the study protocol, and written informed consent was obtained from all participants or from the next of kin when the patient’s agreement was not possible.
2.2. Clinical Information
All patients underwent diagnostic tests, including routine blood tests, neuroimaging, extracranial and intracranial vascular imaging, and cardiac studies. Demographic information including age and gender; stroke risk factors including hypertension (previous use of antihypertensive medication, systolic blood pressure > 140 mm Hg, or diastolic blood pressure >90 mm Hg at discharge), diabetes (previous use of antidiabetic medication under the diagnosis of diabetes, HbA1c ≥6.5%, fasting blood glucose >7.0 mmol/L (>126 mg/dL) at discharge), dyslipidemia (previous use of lipid-lowering medication, total cholesterol >6.0 mmol/L (>240 mg/dL), or low-density lipoprotein cholesterol >4.14 mmol/L (>160 mg/dL) at admission), smoking history, and atrial fibrillation; stroke subtypes according to the Trial of Org 10172 in Acute Stroke Treatment (TOAST) classification; and laboratory data. Body weight and height were measured upon admission. Body mass index (BMI) was calculated as the weight (kg) divided by the square of the height (m). Obesity status as a categorical variable was established by dividing BMI into four levels according to BMI quartiles (Q1, <21.57; Q2, 21.57–23.78; Q3, 23.78–25.97; and Q4, ≥25.97 kg/m2). The lowest BMI category was used as a reference level. GA levels were measured by an enzymatic method using albumin-specific proteinase and ketoamine oxidase (Beckman Coulter AU5821 Biochemical Analyzer; Tokyo, Japan). Since the reference interval for GA is different from what was observed in other studies [10,11,12], we divided the population into two groups (GA < 16% versus GA ≥ 16%).
Initial neurological severity (INS) was estimated using the National Institute of Health Stroke scale (NIHSS) score on admission. Based on the previous literature, a mild stroke was defined as NIHSS 0–7, while moderate to severe stroke was defined as NIHSS ≥ 8 [13]. The short-term functional outcome was estimated using the modified Rankin Scale (mRS) at 3 months after stroke onset. The short-term functional outcome was dichotomized (favorable outcome, 3-month mRS 0–2; unfavorable outcome, 3-month mRS 3–6).
2.3. Statistical Analysis
The distribution of demographic, clinical, laboratory, and stroke subtype data according to GA levels (GA < 16% versus GA ≥ 16%) was analyzed using the χ2 test and Student’s t-test, as appropriate. The trend in baseline data was also calculated using the χ2 test for trends in proportion. We also used one-way analysis of variance (ANOVA).
Values for the continuous variables are expressed as the means ± standard deviation (SD). Odds ratios (ORs) and 95% confidence intervals (CIs) were expressed for the results and probability values. A probability value of ≤0.05 was considered statistically significant. Analyses were performed using SPSS version 26.0 (SPSS Inc., Chicago, IL, USA).
2.4. Data Availability Statement
All data generated or analyzed during this study are included in this published article. Anonymized data will be shared by reasonable request from any qualified investigator.
3. Results
3.1. Analysis I: Levels of Glycated Albumin and Short-Term Functional Outcome
Among the 1163 subjects, the mean age was 69.7 ± 13.2 years, and 60.1% were men. The baseline demographic and clinical characteristics are shown in Table 1. A total of 518 patients (44.5%) were included in the GA ≥ 16% group. Patients with GA ≥ 16% were older and had some prevalent conventional vascular risk factors, such as prior ischemic stroke, hypertension, diabetes, and dyslipidemia. However, patients with GA ≥ 16% did not have high initial stroke severity, and unfavorable short-term functional outcomes (3-month mRS, 3–6) were prevalent (27.4% versus 39.7%) (Table 1).

Table 1.
Baseline characteristics according to levels of glycated albumin.
After categorizing all patients into the two groups according to short-term functional outcome (favorable, 3-month mRS = 0–2, versus unfavorable, 3-month mRS = 3–6), patients with unfavorable short-term outcome were older, less obese, and more likely to have conventional vascular risk factors, including prior ischemic stroke, hypertension, and atrial fibrillation (Table 2). While HbA1c was not significantly different between the two groups (6.22 ± 1.33 versus 6.25 ± 1.37), GA levels were significantly elevated in subjects with unfavorable outcomes (16.30 ± 4.58 versus 17.20 ± 4.61). Figure 2A shows the distribution of short-term functional outcomes (3-month mRS) according to GA levels.
Table 2.
Baseline characteristics according to short-term functional outcomes.
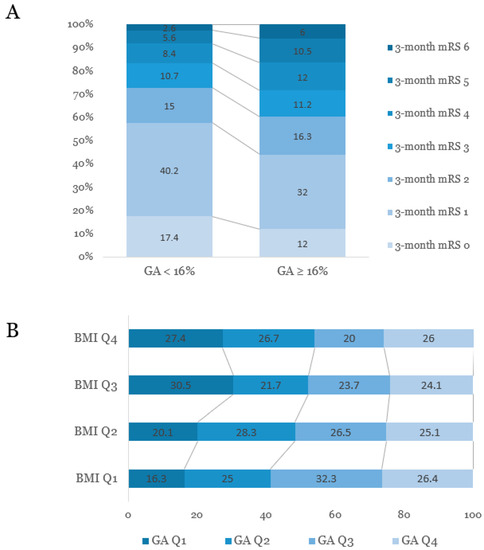
Figure 2.
(A) Distribution of mRS scores at three months after stroke onset according to the levels of glycated albumin. (B) Associations between quartiles of glycated albumin and obesity status based on body mass index. GA, glycated albumin; BMI, body mass index; Q, quartile; mRS, modified Rankin Scale.
As the severity of obesity increased, the age decreased. As obesity severity increased, the level of HbA1c values, proportion of patients with DM, and proportion of patients with HbA1c ≥6.5% increased. However, the proportion of subjects with higher GA levels (p for trend = 0.003) and the GA/HbA1c ratio showed decreasing trends (Figure 2B and Supplementary Table).
We adjusted for age, sex, BMI, prior ischemic stroke history, hypertension, smoking, atrial fibrillation, anticoagulation treatment, TOAST classification, hemoglobin, triglyceride, blood urea nitrogen, high-sensitivity C-reactive protein (hsCRP), initial stroke severity, and GA (Table 3). After adjusting for multiple covariates, when compared to the lower GA group (GA < 16%), the higher GA group (GA ≥ 16%) had a 1.4-fold risk of having unfavorable short-term functional outcomes (OR 1.374; 95% CI 1.022–1.847). Increased age, prior ischemic stroke, TOAST classification, hsCRP, and initial stroke severity (NIHSS ≥8) were statistically significant predictors of unfavorable short-term outcomes.
Table 3.
Effect of GA on unfavorable short-term outcomes (compared to favorable 3-month mRS 0–2).
In addition, analyses of the effects of several glycemic control parameters on short-term functional outcomes are shown in Table 4. When GA was replaced by other glycemic control parameters in the same model, only continuous levels of GA and GA ≥ 16% were significantly associated with unfavorable stroke outcomes at 3 months (3-month mRS 3–6), while continuous levels of HbA1c and HbA1c ≥ 6.5 failed to show a significant association.
Table 4.
Effect of glycemic control parameters on unfavorable short-term outcomes (compared to favorable 3-month mRS 0–2).
In order to reduce the influence of people whose function was not good before the stroke, 44 subjects with pre-mRS scores of 4 or 5 were excluded. Among a total of 1119 patients, multivariate binary logistic regression was conducted. After adjusting for multiple covariates, when compared to the lower GA group (GA < 16%), the higher GA group (GA ≥ 16%) had a 1.4-fold risk of having unfavorable short-term functional outcomes (OR 1.399; 95% CI 1.033–1.894) (this table is not shown).
3.2. Analysis III: Levels of Glycoalbumin and Short-Term Functional Outcome by Glucose Tolerance Status
To investigate the relationship between GA and short-term functional outcome by glucose tolerance status, patients were classified into two groups based on diabetes history. In the binary logistic regression, after adjusting for multiple covariates, GA ≥ 16% was independently associated with unfavorable short-term outcomes only in patients without diabetes (Table 5).
Table 5.
Effect of GA on unfavorable short-term outcomes (compared to favorable 3-month mRS 0-2) based on the presence of diabetes.
4. Discussion
The main findings of this study were as follows: (1) patients with a higher GA level (GA ≥ 16%) had unfavorable short-term functional outcomes at 3 months after stroke onset; (2) a higher GA and higher GA/A1c ratio were significantly associated with unfavorable short-term functional outcomes at 3 months after stroke onset, but HbA1c was not; and (3) a higher GA level was associated with unfavorable short-term functional outcomes at 3 months after stroke onset only in patients without diabetes.
Several studies have demonstrated that GA is associated with vascular calcification and mortality [1,14]. In the Atherosclerosis Risk in Communities (ARIC) study of 11,104 participants, elevated baseline GA was significantly associated with cardiovascular outcomes even after adjustment for traditional risk factors, with especially strong associations in patients with diabetes mellitus (DM) [1]. In 49 hemodialysis subjects with type 2 DM, GA was significantly associated with the presence of peripheral vascular calcification and seems to be a better indicator of glycemic control than HbA1c [14]. However, few studies have evaluated the role of GA in IS patients [3,15]. In a subanalysis of the CHANCE (Clopidogrel in High-Risk Patients with Acute Nondisabling Cerebrovascular Events) trial, GA could be a potential marker to predict the effects of dual and single antiplatelet therapy on recurrent stroke [15]. In a total of 296 AIS patients with DM, higher GA (≥16%) was significantly associated with severe stroke (NIHSS > 14) and a large infarct volume [3]. Nevertheless, the relationship between GA and stroke outcome has not been assessed previously. In the present study, higher GA (≥16%) could increase the risk of unfavorable short-term functional outcomes after stroke. One explanation for this finding is that higher GA increases infarct volume [3]. According to previous reports, GA may be a good marker of macrovascular complications, while HbA1c is a good marker of microvascular complications [3]. In this regard, it is partially explained that large artery atherosclerosis (LAA) etiology accounts for a larger proportion in the group with higher GA in this study.
Interestingly, we found that when GA was replaced by HbA1c (either as a continuous variable or as a binary variable with a cutoff of HbA1c ≥ 6.5%) in the same model, HbA1c failed to prove the significant association in this study. We should not generalize this result. Conventionally, HbA1c has been a well-recognized predictor of cardiovascular outcomes in previous reports. Some authors demonstrated that HbA1c was a potential indicator for in-hospital death in patients with acute coronary syndrome [16] and was a good predictor of acute and long-term mortality in patients with AIS [17]. Furthermore, in a total of 534 subjects with AIS treated with mechanical thrombectomy, HbA1c ≥ 6.5% was an independent predictor of a poor outcome at 3 months after AIS [5]. However, the results are still controversial. Similar to our study, some prior articles reported that HbA1c was not an independent predictor of short-term outcomes [8,9]. In a retrospective study of 317 diabetic patients with acute coronary syndrome, HbA1c levels before admission were not related to short-term cardiovascular outcomes, including in-hospital mortality, 6-month major adverse cardiovascular events (MACE), and all-cause mortality [8]. In an observational multicenter study of 608 patients with acute myocardial infarction, HbA1c was not associated with 7-day mortality or 30-day mortality [9]. We cannot explain the exact pathomechanism, and we suggest that GA might also be an important indicator along with HbA1c [18].
Interestingly, we found that the effect of GA on short-term stroke outcome would differ according to concomitant DM. After classification by DM, the effect of GA on functional outcome at 3 months was significant only in patients without DM (OR 1.774, 95% CI 1.154–2.636). Consistent with our results, among all 2496 participants with AIS (2077 nondiabetic versus 419 diabetic), elevated admission glucose levels were associated with an increased risk for 30-day case fatality in patients without DM [19]. According to Huh et al., fasting glucose and postprandial glucose could influence the GA/A1c ratio in the prediabetes and type 2 DM groups, while those variables did not influence the GA/A1c ratio in the normal glucose tolerance group [20]. This result suggests that the influence of glycemic control parameters may be different according to glucose tolerance status. We hypothesized that in patients with previously identified DM, glucose-insulin homeostasis, drug interaction, and insulin resistance may also affect the result. This finding is meaningful because it suggests that since the DM state itself is an adverse factor, GA or GA/A1c cannot be an appropriate index without considering glycemic control status. Further well-designed studies to investigate the relationship between glycemic control indicators and glucose tolerance status are needed.
Interestingly, the effect of BMI on GA might also be considered to evaluate the role of GA on stroke outcome. According to previous reports, despite inconsistent results, obesity seems to be negatively associated with GA or GA/A1c [20,21,22,23]. In this study, BMI showed a significantly positive correlation with HbA1c, while BMI was negatively correlated with GA or GA/A1c (Supplementary Table). At present, the reasons for the negative influence of BMI on GA are not clear. However, a possible explanation is as follows: (1) Salas-Salvado et al. demonstrated that albumin levels are lower in obese subjects than in nonobese counterparts [24]. However, Miyashita et al. found that obese children had higher albumin concentrations than nonobese children [25], and Koga et al. reported no correlation between BMI and albumin levels [21]. (2) Turnover of albumin may be increased in obese patients. Since chronic low-grade systemic inflammation is involved in obese subjects, inflammation might increase the catabolic rate of albumin and decrease the rate of albumin synthesis. The authors did not provide the exact mechanism but hypothesized that inflammation represented by elevated hsCRP was significantly associated with BMI, which could result in lower GA [21]. In our study, when BMI increased, while GA showed a decreasing trend, albumin showed an increasing trend. Therefore, we suggest that it affects albumin turnover rather than the albumin concentration itself. Although we have not been able to draw any conclusions in this paper, the results suggest an important hypothesis for the next study.
The major strength is that this is a multicenter study with a relatively large sample size. In this regard, GA is expected to be a new glucose control marker in patients with AIS. However, several limitations should be noted in our study. First, this was a cross-sectional observational study design. Second, although we controlled for some confounders in this statistical model, some confounding factors may affect the result. Third, we did not evaluate all conditions affecting protein metabolism, such as thyroid dysfunction, liver cirrhosis, and nephrotic syndrome. Fourth, we could not present changes in blood sugar tests during admission or infarct growth at symptom aggravation. Therefore, we cannot provide direct evidence that GA, an indicator reflecting glucose fluctuation, is related to worse functional outcome. Finally, although we considered the effect of glucose tolerance status by DM status, we did not adjust for insulin resistance status because of the lack of serum insulin levels.
5. Conclusions
In conclusion, we suggest that GA levels are associated with short-term functional outcomes after AIS and might be a better prognostic biomarker than HbA1c. Although the role of GA in stroke outcome is undervalued in the current treatment guidelines, monitoring GA in addition to HbA1c could improve glycemic control in patients with AIS.
Supplementary Materials
The following are available online at https://www.mdpi.com/2076-3425/11/3/337/s1, Table S1: Correlations between body mass index and Glycemic control indicators.
Author Contributions
Y.K.: study concept and design, data analysis and interpretation, and drafting of the manuscript. S.-H.L.: data analysis and interpretation and review of the results. B.-W.Y.: study concept and design, data interpretation and review of the results. M.K.K.: data interpretation, review of the results and review of the manuscript. T.J.K.: review of the results and review of the manuscript. H.-Y.J., E.-J.L., J.B., K.J. and K.-W.N.: review of the manuscript. All authors have read and agreed to the published version of the manuscript.
Funding
This work was supported by the Basic Science Research Program through the National Research Foundation of Korea funded by the Ministry of Science and ICT (NRF-2018R1C1B5086320) and supported by the Hallym University Research Fund 2020 (HURF-2020-37).
Institutional Review Board Statement
The study was conducted according to the guidelines of the Declaration of Helsinki and approved by the Institutional Review Board of the two centers (Kangdong Sacred Heart Hospital IRB no. 2020-02-006-001 and Chuncheon Sacred Heart Hospital IRB no. 2017-89).
Informed Consent Statement
Informed consent was obtained from all subjects involved in the study.
Data Availability Statement
All data generated or analyzed during this study are included in this published article. Anonymized data will be shared by reasonable request from any qualified investigator.
Conflicts of Interest
The authors declare no conflict of interest.
Abbreviations
| GA | glycated albumin |
| AIS | acute ischemic stroke |
| HbA1c | glycated hemoglobin |
| mRS | modified Rankin Scale |
| TIA | transient ischemic attack |
| TOAST | Trial of Org 10172 in Acute Stroke Treatment |
| BMI | body mass index |
| Q | quartile |
| INS | initial neurological severity |
| NIHSS | National Institute of Health Stroke scale |
| SD | standard deviation |
| ORs | odds ratios |
| CIs | confidence intervals |
| hsCRP | high-sensitivity C-reactive protein |
| LAA | large artery atherosclerosis |
| MACE | major adverse cardiovascular events |
References
- Selvin, E.; Rawlings, A.M.; Lutsey, P.L.; Maruthur, N.; Pankow, J.S.; Steffes, M.; Coresh, J. Fructosamine and Glycated Albumin and the Risk of Cardiovascular Outcomes and Death. Circulation 2015, 132, 269–277. [Google Scholar] [CrossRef]
- Sacks, D.B.; Arnold, M.; Bakris, G.L.; Bruns, D.E.; Horvath, A.R.; Kirkman, M.S.; Lernmark, A.; Metzger, B.E.; Nathan, D.M. Guidelines and recommendations for laboratory analysis in the diagnosis and management of diabetes mellitus. Clin. Chem. 2011, 57, e1–e47. [Google Scholar] [CrossRef]
- Lee, S.H.; Jang, M.U.; Kim, Y.; Park, S.Y.; Kim, C.; Kim, Y.J.; Sohn, J.H. Effect of Prestroke Glycemic Variability Estimated Glycated Albumin on Stroke Severity and Infarct Volume in Diabetic Patients Presenting With Acute Ischemic Stroke. Front. Endocrinol. 2020, 11, 230. [Google Scholar] [CrossRef] [PubMed]
- Wang, H.; Cheng, Y.; Chen, S.; Li, X.; Zhu, Z.; Zhang, W. Impact of Elevated Hemoglobin A1c Levels on Functional Outcome in Patients with Acute Ischemic Stroke. J. Stroke Cerebrovasc. Dis. Off. J. Natl. Stroke Assoc. 2019, 28, 470–476. [Google Scholar] [CrossRef]
- Choi, K.H.; Kim, J.H.; Kang, K.W.; Kim, J.T.; Choi, S.M.; Lee, S.H.; Park, M.S.; Kim, B.C.; Kim, M.K.; Cho, K.H. HbA1c (Glycated Hemoglobin) Levels and Clinical Outcome Post-Mechanical Thrombectomy in Patients with Large Vessel Occlusion. Stroke 2018, Strokeaha118021598. [Google Scholar] [CrossRef] [PubMed]
- Sun, C.; Wu, C.; Zhao, W.; Wu, L.; Wu, D.; Li, W.; Wei, D.; Ma, Q.; Chen, H.; Ji, X. Glycosylated Hemoglobin A1c Predicts Intracerebral Hemorrhage with Acute Ischemic Stroke Post-Mechanical Thrombectomy. J. Stroke Cerebrovasc. Dis. Off. J. Natl. Stroke Assoc. 2020, 29, 105008. [Google Scholar] [CrossRef]
- Diprose, W.K.; Wang, M.T.M.; McFetridge, A.; Sutcliffe, J.; Barber, P.A. Glycated hemoglobin (HbA1c) and outcome following endovascular thrombectomy for ischemic stroke. J. Neurointerv. Surg. 2020, 12, 30–32. [Google Scholar] [CrossRef]
- Chan, C.Y.; Li, R.; Chan, J.Y.; Zhang, Q.; Chan, C.P.; Dong, M.; Yan, B.P.; Lam, Y.Y.; Yu, C.M. The value of admission HbA(1c) level in diabetic patients with acute coronary syndrome. Clin. Cardiol. 2011, 34, 507–512. [Google Scholar] [CrossRef] [PubMed]
- Tian, L.; Zhu, J.; Liu, L.; Liang, Y.; Li, J.; Yang, Y. Hemoglobin A1c and short-term outcomes in patients with acute myocardial infarction undergoing primary angioplasty: An observational multicenter study. Coron. Artery Dis. 2013, 24, 16–22. [Google Scholar] [CrossRef] [PubMed]
- Wu, W.C.; Ma, W.Y.; Wei, J.N.; Yu, T.Y.; Lin, M.S.; Shih, S.R.; Hua, C.H.; Liao, Y.J.; Chuang, L.M.; Li, H.Y. Serum Glycated Albumin to Guide the Diagnosis of Diabetes Mellitus. PLoS ONE 2016, 11, e0146780. [Google Scholar] [CrossRef]
- Hsu, P.; Ai, M.; Kanda, E.; Yu, N.-C.; Chen, H.-L.; Chen, H.-W.; Cheng, M.-H.; Kohzuma, T.; Schaefer, E.J.; Yoshida, M. A comparison of glycated albumin and glycosylated hemoglobin for the screening of diabetes mellitus in Taiwan. Atherosclerosis 2015, 242, 327–333. [Google Scholar] [CrossRef]
- Araki, T.; Ishikawa, Y.; Okazaki, H.; Tani, Y.; Toyooka, S.; Satake, M.; Miwa, U.; Tadokoro, K. Introduction of glycated albumin measurement for all blood donors and the prevalence of a high glycated albumin level in Japan. J. Diabetes Investig. 2012, 3, 492–497. [Google Scholar] [CrossRef] [PubMed]
- Wahlgren, N.; Ahmed, N.; Dávalos, A.; Ford, G.A.; Grond, M.; Hacke, W.; Hennerici, M.G.; Kaste, M.; Kuelkens, S.; Larrue, V.; et al. Thrombolysis with alteplase for acute ischaemic stroke in the Safe Implementation of Thrombolysis in Stroke-Monitoring Study (SITS-MOST): An observational study. Lancet 2007, 369, 275–282. [Google Scholar] [CrossRef]
- Yamada, S.; Inaba, M.; Shidara, K.; Okada, S.; Emoto, M.; Ishimura, E.; Nishizawa, Y. Association of glycated albumin, but not glycated hemoglobin, with peripheral vascular calcification in hemodialysis patients with type 2 diabetes. Life Sci. 2008, 83, 516–519. [Google Scholar] [CrossRef]
- Li, J.; Wang, Y.; Wang, D.; Lin, J.; Wang, A.; Zhao, X.; Liu, L.; Wang, C.; Wang, Y. Glycated albumin predicts the effect of dual and single antiplatelet therapy on recurrent stroke. Neurology 2015, 84, 1330–1336. [Google Scholar] [CrossRef]
- Pan, W.; Lu, H.; Lian, B.; Liao, P.; Guo, L.; Zhang, M. Prognostic value of HbA1c for in-hospital and short-term mortality in patients with acute coronary syndrome: A systematic review and meta-analysis. Cardiovasc. Diabetol. 2019, 18, 169. [Google Scholar] [CrossRef] [PubMed]
- Hjalmarsson, C.; Manhem, K.; Bokemark, L.; Andersson, B. The role of prestroke glycemic control on severity and outcome of acute ischemic stroke. Stroke Res. Treat. 2014, 2014, 694569. [Google Scholar] [CrossRef] [PubMed]
- Koga, M. Glycated albumin; clinical usefulness. Clin. Chim. Acta Int. J. Clin. Chem. 2014, 433, 96–104. [Google Scholar] [CrossRef]
- Zsuga, J.; Gesztelyi, R.; Kemeny-Beke, A.; Fekete, K.; Mihalka, L.; Adrienn, S.M.; Kardos, L.; Csiba, L.; Bereczki, D. Different effect of hyperglycemia on stroke outcome in non-diabetic and diabetic patients—A cohort study. Neurol. Res. 2012, 34, 72–79. [Google Scholar] [CrossRef]
- Huh, J.H.; Kim, K.J.; Lee, B.W.; Kim, D.W.; Kang, E.S.; Cha, B.S.; Lee, H.C. The relationship between BMI and glycated albumin to glycated hemoglobin (GA/A1c) ratio according to glucose tolerance status. PLoS ONE 2014, 9, e89478. [Google Scholar] [CrossRef] [PubMed]
- Koga, M.; Otsuki, M.; Matsumoto, S.; Saito, H.; Mukai, M.; Kasayama, S. Negative association of obesity and its related chronic inflammation with serum glycated albumin but not glycated hemoglobin levels. Clin. Chim. Acta Int. J. Clin. Chem. 2007, 378, 48–52. [Google Scholar] [CrossRef] [PubMed]
- Wang, F.; Ma, X.; Hao, Y.; Yang, R.; Ni, J.; Xiao, Y.; Tang, J.; Bao, Y.; Jia, W. Serum glycated albumin is inversely influenced by fat mass and visceral adipose tissue in Chinese with normal glucose tolerance. PLoS ONE 2012, 7, e51098. [Google Scholar] [CrossRef] [PubMed]
- Koga, M.; Matsumoto, S.; Saito, H.; Kasayama, S. Body mass index negatively influences glycated albumin, but not glycated hemoglobin, in diabetic patients. Endocr. J. 2006, 53, 387–391. [Google Scholar] [CrossRef] [PubMed]
- Salas-Salvado, J.; Bullo, M.; Garcia-Lorda, P.; Figueredo, R.; Del Castillo, D.; Bonada, A.; Balanza, R. Subcutaneous adipose tissue cytokine production is not responsible for the restoration of systemic inflammation markers during weight loss. Int. J. Obes. 2006, 30, 1714–1720. [Google Scholar] [CrossRef] [PubMed]
- Miyashita, Y.; Nishimura, R.; Morimoto, A.; Matsudaira, T.; Sano, H.; Tajima, N. Glycated albumin is low in obese, type 2 diabetic patients. Diabetes Res. Clin. Pract. 2007, 78, 51–55. [Google Scholar] [CrossRef] [PubMed]
Publisher’s Note: MDPI stays neutral with regard to jurisdictional claims in published maps and institutional affiliations. |
© 2021 by the authors. Licensee MDPI, Basel, Switzerland. This article is an open access article distributed under the terms and conditions of the Creative Commons Attribution (CC BY) license (http://creativecommons.org/licenses/by/4.0/).