Article

Reduced Interhemispheric Coherence after Cerebellar Vermis Output Perturbation

by
Elena Laura Georgescu Margarint
1,†,
Ioana Antoaneta Georgescu
1,†,
Carmen-Denise-Mihaela Zahiu
1,*,
Alexandru Răzvan Șteopoaie
1,
Stefan-Alexandru Tirlea
1,
Daniela Popa
1,2,
Ana-Maria Zagrean
1,* and
Leon Zagrean
1
1
Division of Physiology and Neuroscience, Carol Davila University of Medicine and Pharmacy, 050474 Bucharest, Romania
2
Institut de biologie de l’Ecole normale supérieure (IBENS), Ecole normale supérieure, CNRS, INSERM, PSL Research University, 75005 Paris, France
*
Authors to whom correspondence should be addressed.
These authors contributed equally to the work.
Brain Sci. 2020, 10(9), 621; https://doi.org/10.3390/brainsci10090621
Submission received: 9 August 2020 / Revised: 26 August 2020 / Accepted: 4 September 2020 / Published: 8 September 2020
(This article belongs to the Special Issue Brain Plasticity and Motor Control—Series II)

Abstract

:
Motor coordination and motor learning are well-known roles of the cerebellum. Recent evidence also supports the contribution of the cerebellum to the oscillatory activity of brain networks involved in a wide range of disorders. Kainate, a potent analog of the excitatory neurotransmitter glutamate, can be used to induce dystonia, a neurological movement disorder syndrome consisting of sustained or repetitive involuntary muscle contractions, when applied on the surface of the cerebellum. This research aims to study the interhemispheric cortical communication between the primary motor cortices after repeated kainate application on cerebellar vermis for five consecutive days, in mice. We recorded left and right primary motor cortices electrocorticograms and neck muscle electromyograms, and quantified the motor behavior abnormalities. The results indicated a reduced coherence between left and right motor cortices in low-frequency bands. In addition, we observed a phenomenon of long-lasting adaptation with a modification of the baseline interhemispheric coherence. Our research provides evidence that the cerebellum can control the flow of information along the cerebello-thalamo-cortical neural pathways and can influence interhemispheric communication. This phenomenon could function as a compensatory mechanism for impaired regional networks.

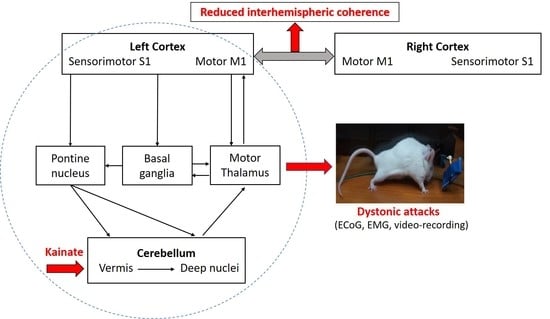
Graphical Abstract

1. Introduction

Interhemispheric communication in the brain is fundamental for the generation of synchronized neural activities, which favor task-related high performance and efficient cognitive and emotional abilities. The entire brain activity is an organized system of rhythms responsible for different physiological functions [1]. Human studies have shown hemispheric asymmetry in motor control when analyzing the primary motor cortex and supplementary motor area. In these studies, wrist movements generated lower coherence levels between the two cerebral cortical structures, suggesting a lack of symmetry in their coupling. This phenomenon was also found in other motor and psychiatric diseases such as Parkinson’s disease and attention-deficit hyperactive disorder (ADHD) [2,3,4,5].
The cerebellum is involved in the functional regulation of the neocortex’s motor areas by influencing the brain oscillations through the cerebello-thalamo-cortical circuit [6,7,8]. Recently, more and more evidence has emerged that demonstrates the cerebellum’s ability to operate in a much more sophisticated manner than initially thought. The cerebellum has been found to generate efficient and harmonized activities, using local networks that synchronize via particular membrane and synaptic mechanisms [9]. There are multiple gap junctions at the inferior olive level and between the stellate cells from the molecular layer [10], but also between the Golgi cells from the granular layer [11]. This particular organization indicates that the cerebellum holds the necessary functional structure for high neuronal synchronization and can even generate rhythmic activities using the local microcircuits [12,13]. The neurons found in the olivo-cerebellar system can thus exhibit an autorhythmic firing pattern and create oscillations, especially in the theta band. This firing pattern is also influenced by cerebellar Golgi cells [14].
The cerebellum has been found to also have a role in dystonia, a heterogeneous motor disorder characterized by sustained muscle contractions and sometimes abnormal repetitive movements or postures [15,16]. Several animal and human studies showed that changes in the activity, structure, connectivity with other brain regions and plasticity of the cerebellum are linked with dystonia [17,18,19,20,21,22]. A recent study demonstrated that a protocol of continuous theta-burst stimulation could not decrease the excitability of the motor cortex in subjects with cervical dystonia, demonstrating altered cerebellar plasticity and altered connectivity [23]. Dystonia can be triggered pharmacologically by applying kainate on the surface of the cerebellum, which alters cerebellum signaling. Kainate is a potent excitatory cyclic analog of L-glutamate and agonist of kainate ionotropic glutamate receptors [24,25,26]. Several studies have successfully mapped the localization of kainate receptors. They can be found at different levels of expression in the amygdala [27], basal ganglia [28], and cerebellum [29].
In this study, we evaluated the cerebellum involvement in motor cortex interhemispheric communication in the case of dystonia induced in mice by repeatedly activating the vermis’s surface with kainate for five consecutive days. Moreover, we searched for possible correlations between dystonic behavior and interhemispheric coherence.

2. Materials and Methods

2.1. Animals

The study was conducted after the consent of the ethical committee of Carol Davila University of Medicine and Pharmacy, Bucharest, Romania (ethical committee code: PO-35-F-03), respecting The European Communities Council Directive 2010/63/EU of the European Parliament concerning the ethical conduct for animal experiments. Tests were carried out on 12–16-week-old Swiss albino male mice (n = 10), weighing 35–47 g, that were kept in standard conditions with free access to water and food.

2.2. Surgery

Mice were anesthetized with 3–4% isoflurane (RomPharm, Romania) for induction and 2% isoflurane for the rest of the surgery. Buprenorphine (Sigma-Aldrich, Saint Louis, MS, USA, 50 µg/kg body weight) was administrated before and every 24 h after surgery for 3 days to control the pain. The level of anesthesia was adjusted using the withdrawal reflex threshold to a pain stimulus. The body temperature was maintained at 37 °C with a surgical heating pad (FHC Inc., Maine ME, USA). A volume of 1 ml of 1% lidocaine was injected subcutaneously on the midline of the scalp, then the soft tissue was removed, and the skull was exposed. For implanting the electrodes for electrocorticogram (ECoG) recordings, three craniotomies (1 mm diameter) were performed with an electric drill under stereotaxic guidance (David Kopf Instruments, California CA, USA) as follows: two at the level of the left and right primary motor cortices (2.2 mm anterior to the bregma and 2.2 mm lateral, left and right, to the sagittal suture), and one for the ground, reference electrode (2 mm posterior and 2 mm to the right of lambda). The electrodes were manufactured from nichrome bendable wire of 0.15 mm width (Kanthal, Hallstahamar, Sweden), and implanted after de-insulating their contact regions with the tissues and with the pins of the W2100-HS4-opto Headstage (Multi-Channel Systems) to increase the signal’s quality. The electromyogram (EMG) electrode was inserted in the neck muscles (Figure 1a). The wires were attached to the pins and then fixed with Super Bond glue (Dental Adhesive Resin Cement, Sun Medical CO, Japan) and with dental adhesive (Pi-Ku-Plast HP 36, Bredent GmbH, Germany). A guide cannula used for kainate administration was fixed vertically on the cerebellar lobule 6 on the vermis (Figure 1a,b), under stereotaxic control.

2.3. Kainate Microinjection and ECoG and EMG Recordings

Mice were left for 4 days to recover post-surgery before the beginning of the experiments. ECoG and EMG recordings were conducted in awake animals in an open field using a Multi-Channel Systems W2100 wireless interface board (Figure 1a). The acquisition was performed with a 4-channel W2100-HS4-opto Headstage (the total weight of the headstage was 1.9 g + 3.8 g for the battery) and using an acquisition frequency of 1 kHz. The behavior of the mice in the open field was video tracked for all recordings. On the baseline day, no kainate microinjection was performed, and the mice were recorded for 150 min. Over the next 5 days, the mice were recorded for 10 min before and 150 min after the kainate 0.75 ± 0.1 μL (100 μg/mL) (Sigma) microinjection [14]. For this procedure, mice were briefly anesthetized with 3–4% isoflurane, and the recording started 2–3 min thereafter.

2.4. Data Analysis

Dystonic motor behavior was evaluated, both on-site and online. A previously published scale was used to estimate the severity of symptoms [21,24] in which 0 = normal motor behavior; 1 = slightly abnormal motor behavior, no abnormal postures; 2 = minor motor impairment, abnormal postures when stimulated; 3 = moderate impairment, spontaneous dystonic postures that appear often; and 4 = severe disability, prolonged dystonic postures. The dystonia score was estimated for every 10 min. The total time of walking, active wake percentage (AW%), in the arena was expressed as a percentage of the recording’s whole time.
Data analysis included only recordings with no artifacts. ECoG data were visually evaluated to exclude contaminated recording intervals. Changes of coherence were evaluated on the baseline day, and before and after kainate for the next five consecutive days. The MATLAB function mscohere with 2 s windows overlapping 1 s from the 1 kHz signal was applied to obtain coherence values from power spectral density values of pairs from left to right primary motor cortex ECoGs. The results were then expressed by dividing them into frequency bands: delta: 0.5–3.5 Hz, theta: 4–12.5 Hz; beta: 13–30 Hz; low-gamma: 30.5–48 Hz; high-gamma: 52–100 Hz. Frequencies surrounding 50 Hz were not taken into consideration. The resulting data were processed in Microsoft Excel software, and then in GraphPad 8.4.3 for the performance of statistical tests. For all intervals, days and frequency bands, the D’Agostino and Pearson omnibus normality test was applied. The mixed-effects model (REML) test and Wilcoxon matched-pairs signed-rank test were used as the data was paired. For multiple comparisons, Dunn’s multiple comparison test was added to compare every kainate day to the baseline day.
Results are shown as mean ± the standard error of the mean (SEM), and a p-value < 0.05 was considered statistically significant. EMG analysis was comprised of calculating the power spectral density (from 1 to 200 Hz) with the Welch method with the pwelch MATLAB function. The imaginary part of coherence was calculated in order to exclude volume conduction [30]. Muscle activation parameters were calculated: mean power frequency and median frequency, root mean square and average rectified value. Furthermore, the relationship between behavior and interhemispheric coherence was evaluated by calculating the correlations between dystonia score, active wake percentage, and interhemispheric coherence per frequency band. The Pearson correlation coefficients (r) values and p values for significance were calculated.

3. Results

3.1. Electromyography and Behavior Parameters Reveal Increased Muscular Activity after Cerebellar Kainate Injections

After the kainate cerebellar vermis application, mice showed impaired motor behavior. There was an increased dystonia score, decreased active wake percentages (Figure 1d), and increased muscle activation suggested by the EMG parameters, as we previously showed [15]. Mice usually remained in a prolonged muscle contraction for a few minutes, followed by periods of decreased symptoms. This phenotype resembles other studies using similar methods and is considered as dystonic [16]. EMG traces indicated increased activity during abnormal postures (Figure 1c).

3.2. Interhemispheric Coherence between Primary Motor Cortices before and after Repeated Cerebellar Vermis Kainate Application Was Reduced

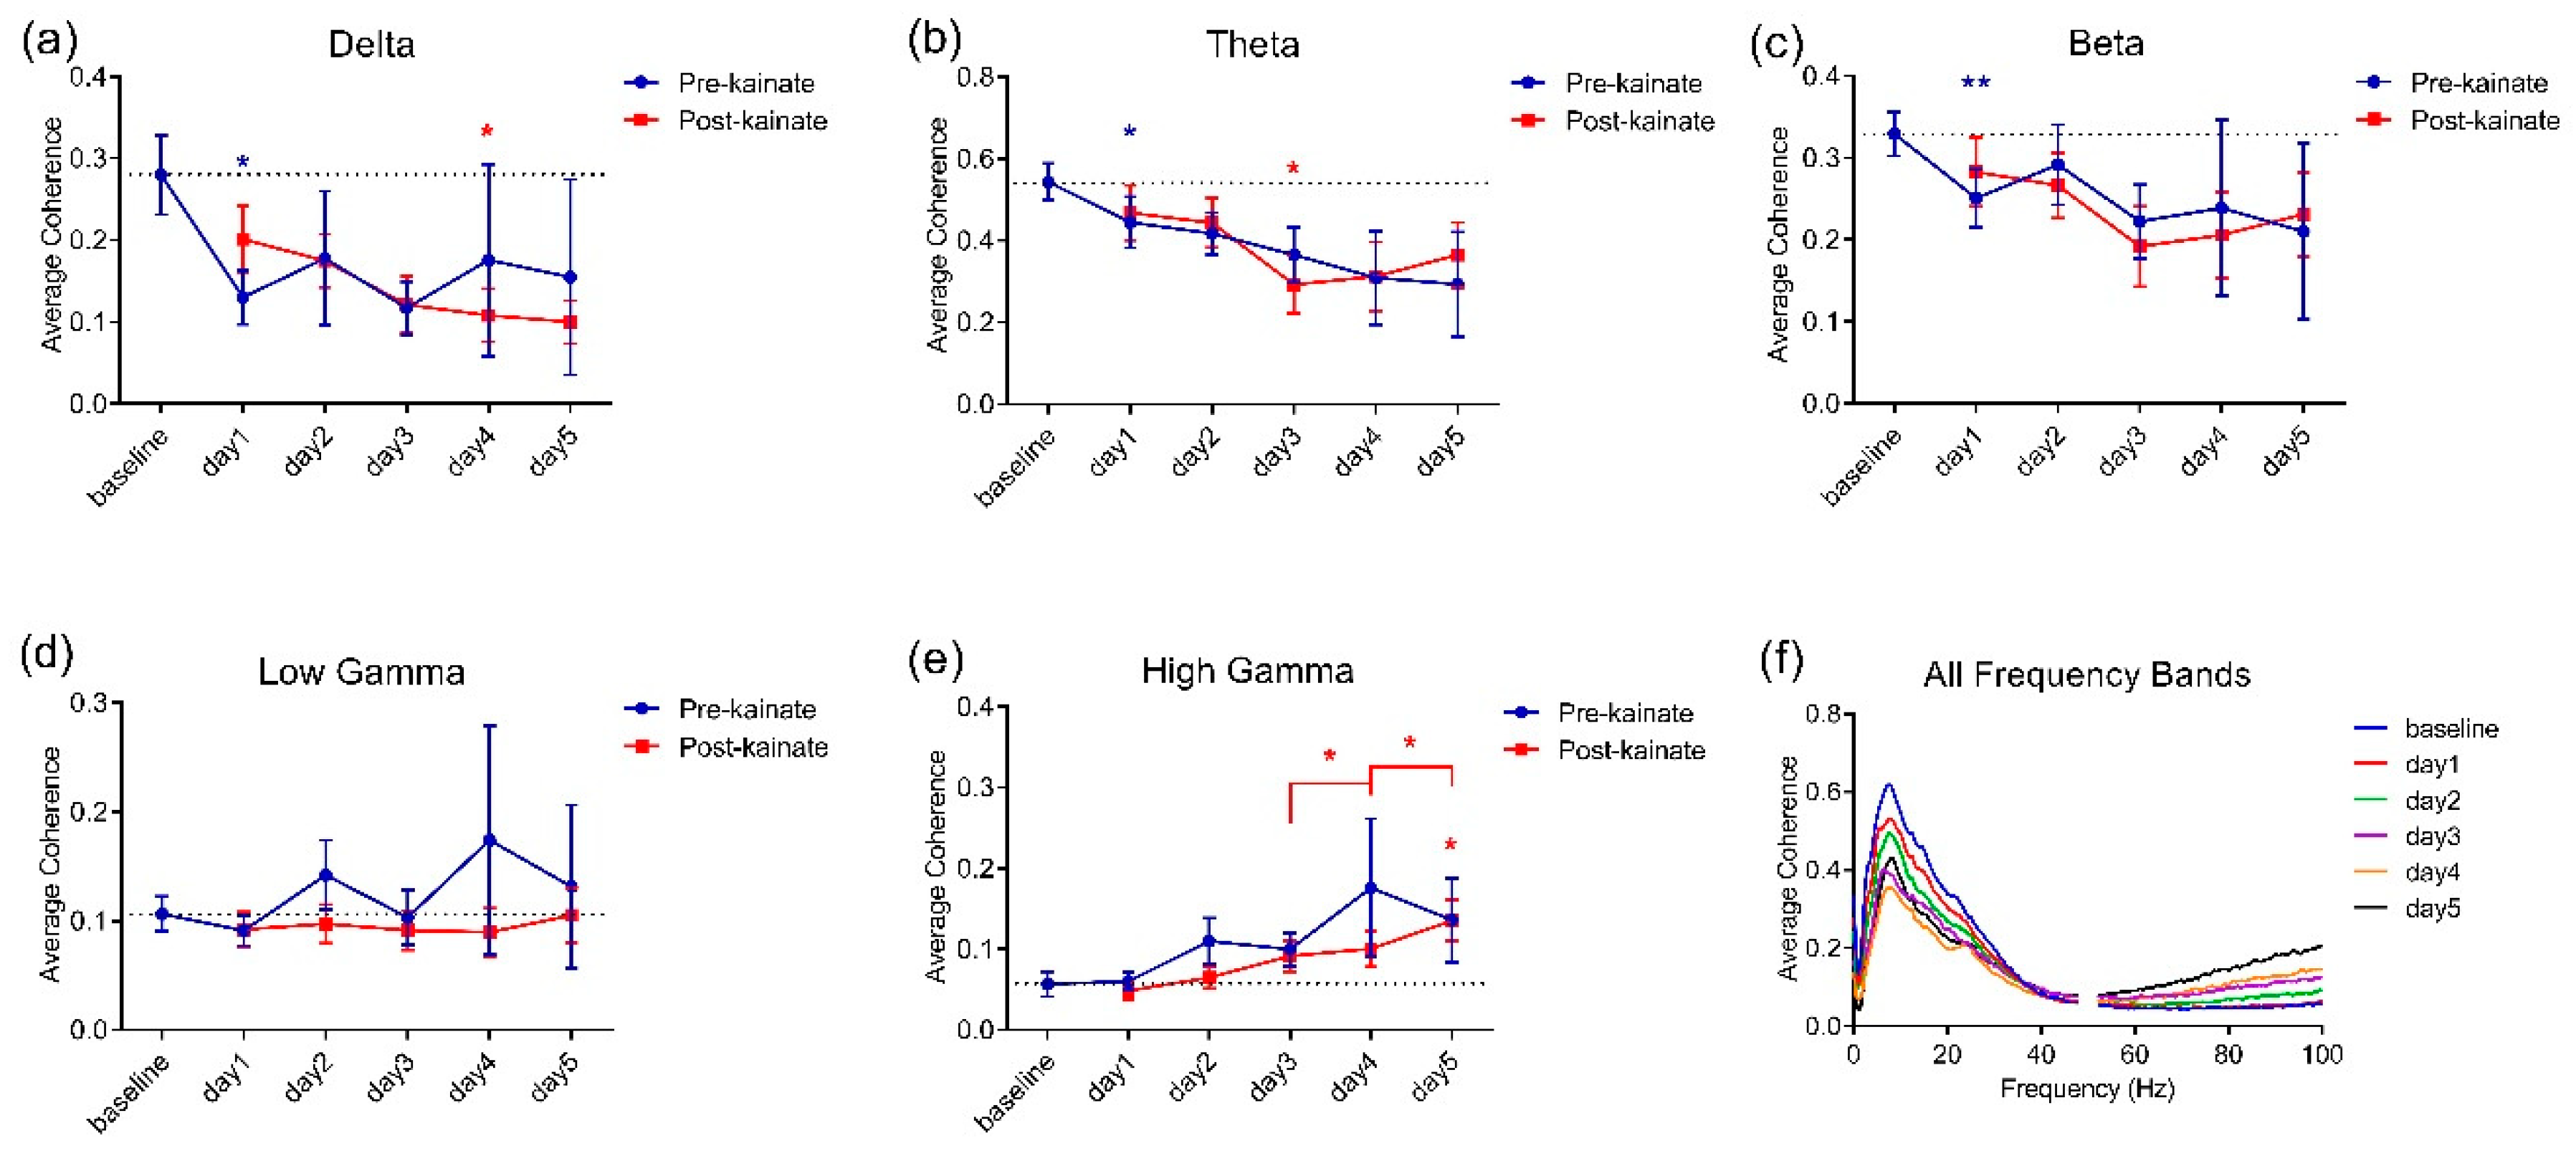
When comparing baseline day values to the values from the days of kainate application on the cerebellar vermis, the left–right motor cortices coherence was reduced in low-frequency bands (Figure 2a–c). The differences were significant in delta and theta bands in kainate days 4 and 3, respectively (Figure 2a,b). In the high gamma band, the coherence decreased slightly on the first day of kainate application and then gradually increased until day 5, when the change was significant (Figure 2e). We also observed that after day 3, there was a rising trend in theta, beta, and low gamma bands in days 4 and 5, with a significant change only for the high gamma band. The recordings in the pre-kainate state had a similar trend, with a decrease in the delta, theta, and beta bands, with significant changes for day 1, and a tendency to increase in the high-gamma band, suggesting a possible compensatory mechanism. Statistical indicators are shown in Table 1. The imaginary part of coherence did not show volume conduction (Figure 3a,b), according to the statistical indicators presented in Table 2.

3.3. Correlations between Motor Behavior and Interhemispheric Coherence between Primary Motor Cortices

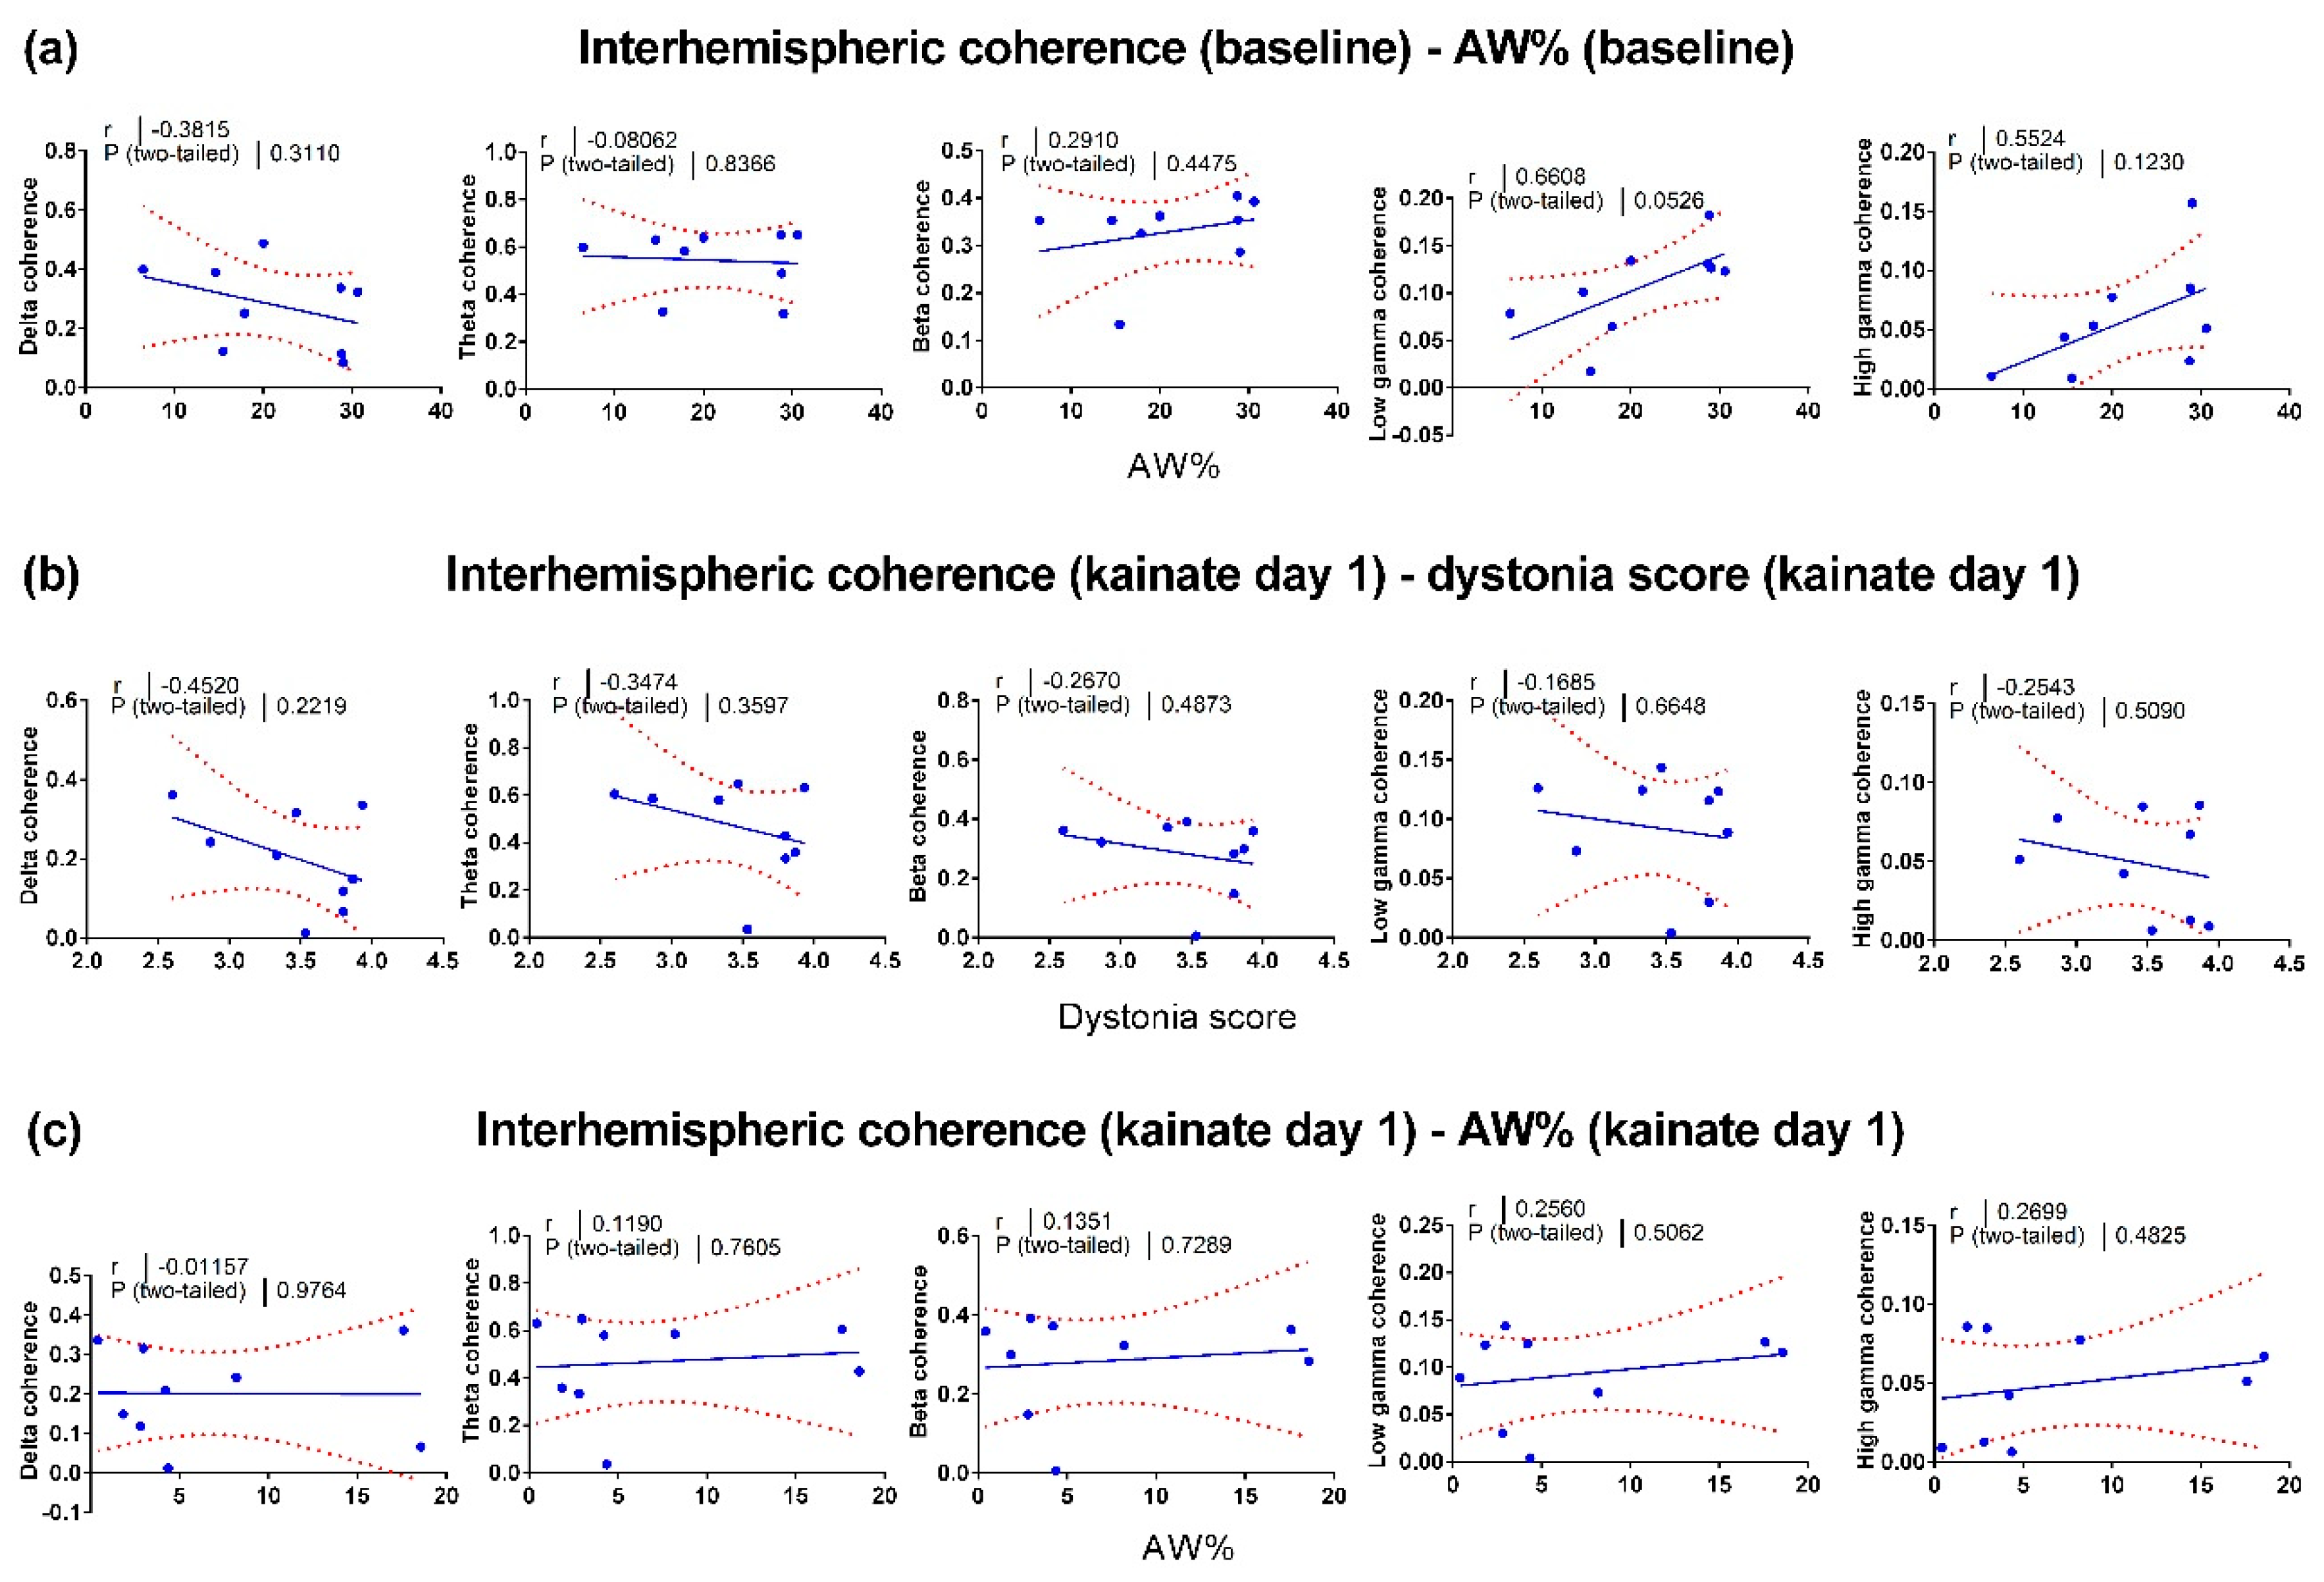
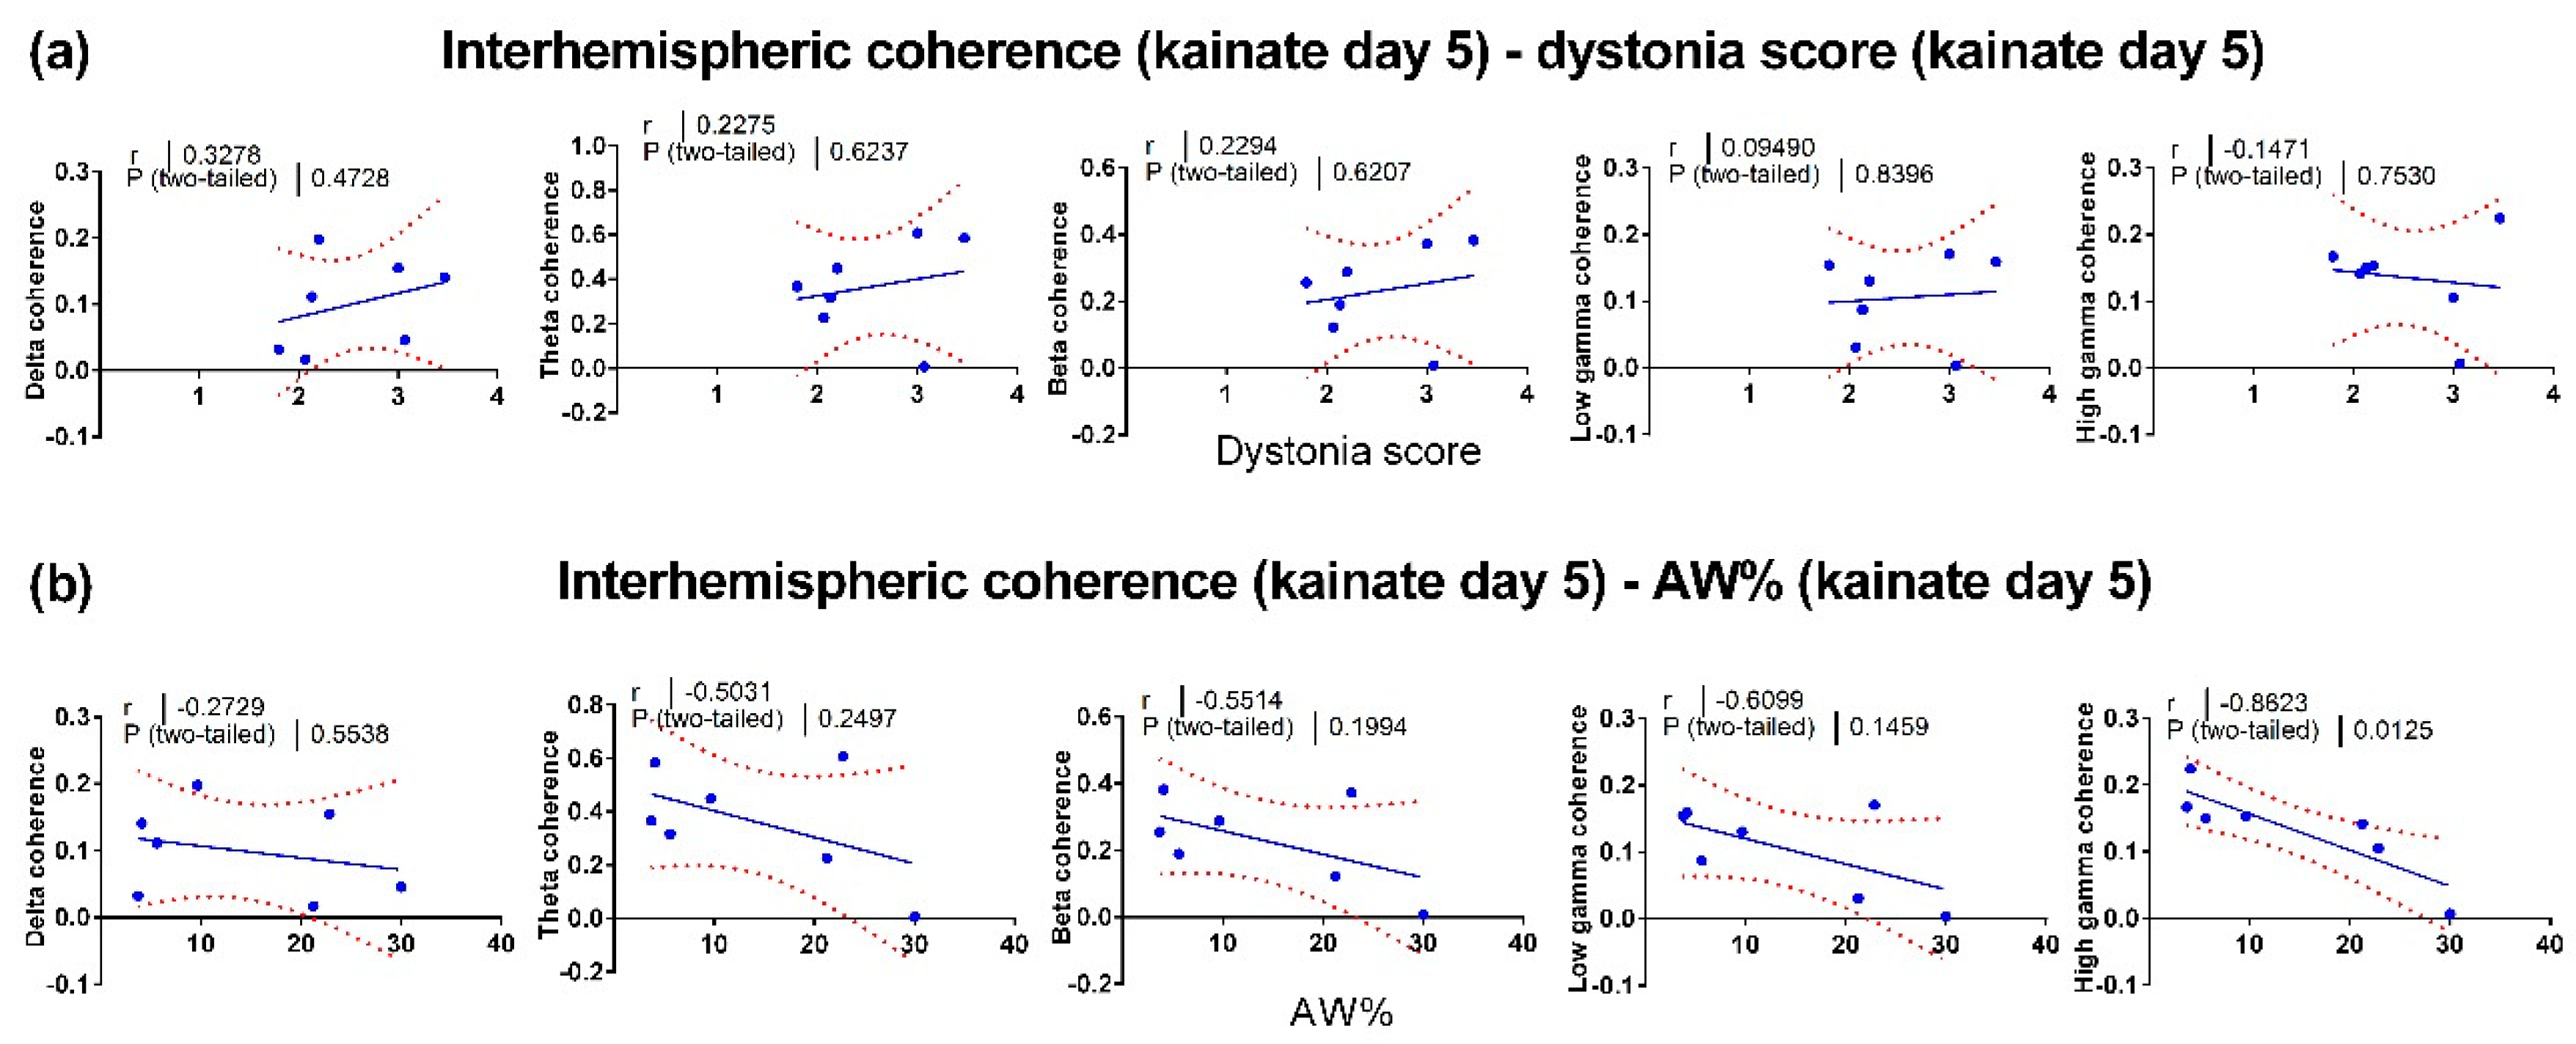
To find a possible connection between the neural activity changes and motor behavior changes, we evaluated the relationship between locomotor activity and interhemispheric coherence. Firstly, we assessed the baseline correlations (Figure 4a). Then, we evaluated the correlations between the dystonia score (Figure 4b), the active wake percentage (Figure 4c) versus the interhemispheric coherence from the first kainate administration day. Additionally, we calculated the correlations between the dystonia score (Figure 5a) and active wake percentages (Figure 5b) versus interhemispheric coherence per frequency band on day 5. We found little or no relationship between behavior and cortical interhemispheric communication for both kainate day 1 and kainate day 5. One possible explanation is the lack of variability of dystonia scores and the small number of animals. Average dystonia scores were high due to the severity of the phenotype after the kainate administration (Figure 1d).

4. Discussion

The cerebellum is implicated in motor control and cognitive functions as it receives input through the cerebro-ponto-cerebellar pathway and the cerebro-olivo-cerebellar pathway [31] and sends projections to the prefrontal, premotor and primary motor cortex [32]. These anatomical connections are functionally meaningful, and the cerebellum is suggested to be a gateway that modulates motor circuits and cortical oscillatory activity [24].
The cortical electrical activity varies over the cortex and in a specific area when performing a motor task. Quantitative ECoG gives us insights into the communication between brain regions. Power spectral analysis of the ECoG signal assesses the primary cerebral rhythms and reflects the cortical activation or inhibition. Furthermore, coherence is a useful parameter that measures the synchronicity between two oscillatory signals. Coherence is also used as a marker of the functional coupling of different brain regions [33,34,35]. Increased coherence between two ECoG signals suggests a synchronized neuronal activity, thus increased communication between the recorded brain areas. Low coherence suggests neuronal populations that are acting independently, so they have decreased functional connectivity in between them.
In this study, we examined the influence of cerebellar vermis activation with kainate applied on the dura mater over the interhemispheric communication between motor cortices, assessed as motor cortices ECoG coherence. We found that kainate triggers behavioral and motor symptoms characteristic to dystonia quantifiable by the dystonia score, active wake % and EMG parameters [24]. A decrease in the left–right motor cortex coherence was found across all spectral frequency bands, but significant changes were found only for delta and theta bands. These modifications suggest that the cerebellum has a strong influence over these brain areas, revealing a capacity to modulate motor cortex oscillatory activity. No significant correlations were found between behavior and coherence between left and right primary motor cortices per band of frequency. Furthermore, after the repeated triggering of the dystonic attacks, we found a functional adaptation of the interhemispheric coherence throughout the days of the kainate application. Likewise, processes of compensation have been found to take place for the motor-parietal and motor-sensorimotor coherences after repeated cerebellar vermis kainate application [24]. Thus, compensatory activity and motor circuit plasticity occur when the output of the cerebellum is impaired.
The ECoG, EMG, and behavioral changes induced by kainate microinjection on the cerebellar vermis are mediated by the cerebellar Purkinje cells as the mice lacking Purkinje cells did not display motor behavior abnormalities [21]. The Purkinje cells in the cerebellar cortex process the input signals from the cortico-cerebellar pathways through the climbing fibers and mossy fibers and integrate the local inhibitory signals of the stellate and basket cells, to modulate the cerebellar nuclei neurons activity through GABA-ergic synapses [36]. Therefore, Purkinje cell stimulation results in a reduced cerebellar excitatory output to the motor cortex. The cerebello-thalamo-cortical pathway terminates on both inhibitory and excitatory neurons in the motor cortex. Thus, the reduced cerebellar output may increase or decrease the inhibition within the motor cortex [37].
Movements vary from simple to complex motor tasks, during mice exploratory activity or grooming behavior. They involve the activation of an entire network of cortical and subcortical areas: cerebellum, thalamus, basal ganglia, pons, and sensory-motor cortices. All of these centers should coordinate their activity within the network and with other neural networks to have a normal, precise, and correct movement. The left–right motor cortices coherence during separate movements of the wrists showed a higher coherence when moving the right wrist, for all right-handed subjects. In addition, the power suppression was higher in the left motor cortex during the right wrist movements than the power suppression done by the right motor cortex during left wrist movements.
Moreover, a strong modulation for cerebro-muscular coherence was observed in the gamma band (26–40 Hz), especially in isometric contraction conditions. However, strong variations were noticed in the beta band (13–24 Hz) between static and dynamic conditions, suggesting a functional role of oscillatory activity coupling in the motor system [38]. Low-frequency oscillations participate in sensory-motor control and the formation of memories, also occurring during sleep. They are thought to spread through cerebro-cerebellar loops comprising multiple structures, such as the prefrontal cortex, sensory-motor cortex, premotor area, posterior parietal cortex, thalamus, and the cerebellum, ultimately returning to the cerebral cortex. The integrity of this loop ensures the generation of the movement sequence, which requires attention, decision making, and sensory-motor control. Voluntary movements can trigger oscillatory cortical activity in the prefrontal regions that propagate to all structures, using the cerebellum as a relay [3].
Interestingly, during bimanual force generation, when the isometric contraction was voluntary, the motor cortices coherence decreased in the 8–13 Hz band. The changes in oscillatory activity in this frequency band, in humans, called the alpha band, are interpreted as being involved in the suppression of unwanted EMG activity, correction of movement error, or suppression of task-irrelevant activity during finger movements [39]. Similarly, in our study, there was a significant decrease in theta band coherence, which includes the 8–13 Hz frequency interval. During the dystonic behavior, there were mainly tonic contractions of the muscles on both sides of the body.
Furthermore, dysfunctions of the cortico-subcortical circuits have been associated with multiple psychiatric phenotypes. The basal ganglia-thalamo-cortical circuits have been shown to contribute to the development of multiple behavioral and cognitive impairments. One explanation might be that motor abnormalities can influence the fronto-striatal circuitry, whose dysfunction can trigger affective disorders by altering the limbic circuitry [40]. Primary focal dystonia is a genetic disorder in which decreased amounts of dopamine can be found in the nigrostriatal neurons [41], representing a consequence of an anomalous cortico-striatal circuitry. Recent evidence has shown that social phobia, social anxiety, and obsessive-compulsive disorder are significantly higher in this pathology [42]. Patients with primary focal dystonia show distinct neuropsychiatric and personality profiles on the anxiety spectrum, such as obsessive-compulsive and avoidant personality disorders, and often manifest social phobia, agoraphobia, and panic disorder [43].
A faulty interhemispheric communication was also noticed in several other neurobehavioral disorders, such as ADHD, autism (including Asperger’s syndrome), and Tourette’s syndrome. Strikingly, individuals affected by these types of disorders show skills at different levels of development and performance, indicating a functional disconnection syndrome, where enhanced abilities occur with increased network coherence and reduced abilities with low network coherence [2]. This dissymmetry can sometimes be associated with anatomical asymmetries [44], or brain regions with tardy development. Interestingly, there is evidence supporting the fact that individuals diagnosed with autism, ADHD, and Asperger’s syndrome present with asymmetrical brain regions and reduced coherences between corresponding left–right structures. Another change is the activation of the right hemisphere, which is responsible for cognitive, motor, sensory, and autonomic functions. The impairments found in autistic spectrum disorder may come from the preferential use of the local networks and the impossibility of synchronizing the activity of the two hemispheres, more so as the left hemisphere is mainly specialized in local processing and the right hemisphere in global processing. People affected by the mentioned disorders present with decreased motor and cognitive abilities, especially regarding language and thought, such as motor planning, working memory, abstract reasoning, cognitive flexibility, temporal sequencing, and generativity. Dopamine is considered the principal neurotransmitter involved in the development of executive intelligence and the control of the skills associated with the left hemisphere [45]. Thus, it was proposed that a unilateral (dopaminergic) increased hemispheric stimulation can induce temporal oscillations within the thalamo-cortical pathway, creating a compensatory oscillatory cortical activity, similar to the one found in the functional hemisphere. Increasing the baseline oscillation of a hemisphere can improve the coordination and coherence between the hemispheres, and thus enhance motor and cognitive abilities [2].
The highly increased dopaminergic activity was also observed in the mesolimbic areas of obsessive-compulsive [46] and schizophrenic [47] patients. In contrast, in Tourette’s syndrome, excessive dopamine was found in the basal ganglia, as well as the thalamus, striatum and fronto-cortical circuits [48]. Moreover, mania was found in persons who exhibited excessive dopamine in both medial and lateral dopaminergic systems [49]. However, the thalamo-cortical circuits seem to be highly implicated in maintaining balance and coordination across different areas in the brain, a function exerted by keeping a temporal coherence between implicated regions, mostly sensory, motor and association areas, even though they are located very far from each other. All of the above mentioned regions provide a feedforward flow of information. In humans, there is evidence showing that 40–50 Hz or even higher oscillatory rates, are the rates at which attention-demanding cognitive tasks are best processed [50]. This gamma-band local synchronization can facilitate neural communication in several regions implicated in language, vision, and memory, but also in sensorimotor processes [51]. The neuronal activity found in association areas, including prefrontal, posterior parietal, inferotemporal cortex, and other subcortical regions, show that the top-down influences can shape the intrinsic dynamic of thalamo-cortical networks. This activity creates a predictive nature of self-generated fluctuations of neuronal excitability levels in these areas, proving that maintaining a proper coherence among the related structures is especially important [52]. Before movements are executed, motor and premotor areas activate [53], helping the selection of response, setting the movement parameters (direction, latency, speed), and coordinating specific neural populations that are needed for the dynamic organization of that movement [54]. These processes are usually related to the same modulation source, often the prefrontal cortex [55]. Besides the firing rate modulation that occurs during this phenomenon, changes in neuronal synchrony also happen, especially for the motor and premotor neuronal networks [56].
It is known that a more active hemisphere or one operating at a different frequency of oscillation can alter the hemispheres’ ability to synchronize and maintain a temporal coherence between large areas of the brain, thus hindering the connectivity between distant neurons [2]. Moreover, in humans, positron-emission tomography studies show an additional essential role of the cerebellum in cognitive functions, being part of the cerebello-thalamic-prefrontal network supporting various mental activities that require gamma-band synchrony and temporal, fluid coordination of thoughts. This is also indicated by the fact that this network becomes dysfunctional in several cognitive-affective disorders, such as schizophrenia [57].

5. Conclusions

The results of the present study show low coherences between the left and right motor cortices for delta, theta and beta bands, and abnormal postures and repetitive movements when perturbing the cerebellar output. Therefore, the cerebello-thalamo-prefrontal circuits might play a considerable role in maintaining synchrony between the two hemispheres. Our study offers novel insights about the cerebellum’s contribution to interhemispheric communication and how cerebellar activation modulates the motor cortices connectivity during dystonic postures and movements.

Author Contributions

E.L.G.M., I.A.G., C.-D.-M.Z., L.Z., D.P., A.-M.Z. designed the experiments and wrote the manuscript; E.L.G.M., I.A.G., C.-D.-M.Z., S.-A.T., A.R.Ș. performed the experiments and analyzed the data. All authors have read and agreed to the published version of the manuscript.

Funding

This work was supported by TE European Young Team PN-II-RU-TE-2014-4 project (CEROSCO)/UEFISCDI (Executive Unit for Higher Education, Research, Development and Innovation) to DP and by Carol Davila University of Medicine and Pharmacy Bucharest to AMZ.

Conflicts of Interest

The authors disclose no conflict of interest.

References

  1. Buzsáki, G. Rhythms of the Brain; Oxford University Press: Oxford, UK, 2006; ISBN 9780195301069. [Google Scholar]
  2. Melillo, R.; Leisman, G. Autistic Spectrum Disorders as Functional Disconnection Syndrome. Rev. Neurosci. 2009, 20, 111–131. [Google Scholar] [CrossRef] [PubMed]
  3. Ni, Z.; Pinto, A.D.; Lang, A.E.; Chen, R. Involvement of the cerebellothalamocortical pathway in Parkinson disease. Ann. Neurol. 2010, 68, 816–824. [Google Scholar] [CrossRef] [PubMed]
  4. Yuvaraj, R.; Murugappan, M.; Ibrahim, N.M.; Kenneth, S.; Iqbal, O.M.; Mohamad, K.; Palaniappan, R.; Satiyan, M. Inter-hemispheric EEG coherence analysis in Parkinson’s disease: Assessing brain activity during emotion processing. J. Neural Transm. 2014. [Google Scholar] [CrossRef] [PubMed]
  5. Blesa, J.; Juri, C.; García-Cabezas, M.Á.; Adánez, R. Inter-hemispheric asymmetry of nigrostriatal dopaminergic lesion: A possible compensatory mechanism in Parkinson’s disease. Front. Syst. Neurosci. 2011, 5, 1–7. [Google Scholar] [CrossRef] [PubMed] [Green Version]
  6. Rastogi, A.; Cash, R.; Dunlop, K.; Vesia, M.; Kucyi, A.; Ghahremani, A.; Downar, J.; Chen, J.; Chen, R. Modulation of cognitive cerebello-cerebral functional connectivity by lateral cerebellar continuous theta burst stimulation. Neuroimage 2017, 158, 48–57. [Google Scholar] [CrossRef] [PubMed]
  7. Proville, R.D.; Spolidoro, M.; Guyon, N.; Dugué, G.P.; Selimi, F.; Isope, P.; Popa, D.; Léna, C. Cerebellum involvement in cortical sensorimotor circuits for the control of voluntary movements. Nat. Neurosci. 2014, 17, 1233–1239. [Google Scholar] [CrossRef]
  8. Steriade, M. Two channels in the cerebellothalamocortical system. J. Comp. Neurol. 1995, 354, 57–70. [Google Scholar] [CrossRef]
  9. D’Angelo, E.; Mazzarello, P.; Prestori, F.; Mapelli, J.; Solinas, S.; Lombardo, P.; Cesana, E.; Gandolfi, D.; Congi, L. The cerebellar network: From structure to function and dynamics. Brain Res. Rev. 2011, 66, 5–15. [Google Scholar] [CrossRef]
  10. Mann-Metzer, P.; Yarom, Y. Electrotonic coupling synchronizes interneuron activity in the cerebellar cortex. Prog. Brain Res. 2000, 124, 115–122. [Google Scholar] [CrossRef]
  11. Dugué, G.P.; Brunel, N.; Hakim, V.; Schwartz, E.; Chat, M.; Lévesque, M.; Courtemanche, R.; Léna, C.; Dieudonné, S. Electrical Coupling Mediates Tunable Low-Frequency Oscillations and Resonance in the Cerebellar Golgi Cell Network. Neuron 2009, 61, 126–139. [Google Scholar] [CrossRef] [Green Version]
  12. De Zeeuw, C.I.; Hoebeek, F.E.; Schonewille, M. Causes and Consequences of Oscillations in the Cerebellar Cortex. Neuron 2008, 58, 655–658. [Google Scholar] [CrossRef] [PubMed] [Green Version]
  13. D’Angelo, E. The critical role of Golgi cells in regulating spatio-temporal integration and plasticity at the cerebellum input stage. Front. Neurosci. 2009, 2, 35–46. [Google Scholar] [CrossRef] [PubMed] [Green Version]
  14. Forti, L.; Cesana, E.; Mapelli, J.; D’Angelo, E. Ionic mechanisms of autorhythmic firing in rat cerebellar Golgi cells. J. Physiol. 2006, 574, 711–729. [Google Scholar] [CrossRef] [PubMed]
  15. Albanese, A.; Bhatia, K.; Bressman, S.B.; DeLong, M.R.; Fahn, S.; Fung, V.S.C.; Hallett, M.; Jankovic, J.; Jinnah, A.; Klein, C.; et al. Phenomenology and classification of dystonia: A consensus update. Mov. Disord. 2013, 28, 863–873. [Google Scholar] [CrossRef] [PubMed] [Green Version]
  16. Albanese, A. How many dystonias? Clinical evidence. Front. Neurol. 2017, 8. [Google Scholar] [CrossRef] [Green Version]
  17. Shakkottai, V.G.; Batla, A.; Bhatia, K.; Dauer, W.T.; Dresel, C.; Niethammer, M.; Eidelberg, D.; Raike, R.S.; Smith, Y.; Jinnah, H.A.; et al. Current Opinions and Areas of Consensus on the Role of the Cerebellum in Dystonia. Cerebellum 2017, 16, 577–594. [Google Scholar] [CrossRef]
  18. Neychev, V.K.; Fan, X.; Mitev, V.I.; Hess, E.J.; Jinnah, H.A. The basal ganglia and cerebellum interact in the expression of dystonic movement. Brain 2008, 131, 2499–2509. [Google Scholar] [CrossRef]
  19. Fremont, R.; Tewari, A.; Angueyra, C.; Khodakhah, K. A role for cerebellum in the hereditary dystonia DYT1. Elife 2017. [Google Scholar] [CrossRef]
  20. Tewari, A.; Fremont, R.; Khodakhah, K. It’s not just the basal ganglia: Cerebellum as a target for dystonia therapeutics. Mov. Disord. 2017, 32, 1537–1545. [Google Scholar] [CrossRef]
  21. Pizoli, C.; Jinnah, H.A.; Billingsley, M.L.; Hess, E.J. Abnormal cerebellar signaling induces dystonia in mice. J. Neurosci. 2002, 22, 7825–7833. [Google Scholar] [CrossRef] [Green Version]
  22. Brighina, F.; Fierro, B.; Romano, M.; Puma, A.; Giglia, F.; Saia, V.; Giglia, G. Effects of cerebellar TMS on motor cortex of patients with focal dystonia: A preliminary report. Exp. Brain Res. 2009, 192, 651–656. [Google Scholar] [CrossRef] [PubMed]
  23. Porcacchia, P.; Alvarez de Toledo, A.; Rodrıguez-Baena, A.; Martın-Rodrıguez, J.F.; Palomar, F.J.; Vargas-Gonzalez, L.; Jesus, S.; Koch, G.; Mir, P. Abnormal cerebellar connectivity and plasticity in isolated cervical dystonia. PLoS ONE 2019, 14, e0211367. [Google Scholar] [CrossRef] [PubMed] [Green Version]
  24. Georgescu, E.L.; Georgescu, I.A.; Zahiu, D.C.; Morozan, V.P.; Pana, A.; Zagrean, A.; Popa, D. Oscillatory cortical activity in an animal model of dystonia caused by cerebellar dysfunction. Front. Cell. Neurosci. 2018, 12, 1–23. [Google Scholar] [CrossRef] [PubMed] [Green Version]
  25. Ilie, A.; Spulber, S.; Avramescu, S.; Nita, D.A.; Zagrean, A.-M.; Zagrean, L.; Moldovan, M. Delayed ischemic electrocortical suppression during rapid repeated cerebral ischemia and kainate-induced seizures in rat. Eur. J. Neurosci. 2006, 23, 2135–2144. [Google Scholar] [CrossRef] [PubMed]
  26. Raike, R.S.; Pizoli, C.E.; Weisz, C.; van den Maagdenberg, A.M.J.M.; Jinnah, H.A.; Hess, E.J. Limited regional cerebellar dysfunction induces focal dystonia in mice. Neurobiol. Dis. 2013, 49, 200–210. [Google Scholar] [CrossRef] [PubMed] [Green Version]
  27. Rogawski, M.A.; Wenk, G.L. The neuropharmacological basis for the use of memantine in the treatment of Alzheimer’s disease. CNS Drug Rev. 2003, 9, 275–308. [Google Scholar] [CrossRef]
  28. Jin, S.-H.H.; Lin, P.; Auh, S.; Hallett, M. Abnormal functional connectivity in focal hand dystonia: Mutual information analysis in EEG. Mov. Disord. 2011, 26, 1274–1281. [Google Scholar] [CrossRef]
  29. Wisden, W.; Seeburg, P.H. A Complex Mosaic of High-Affinity Kainate Receptors in Rat Brain. J. Neurosci. 1993, 13, 3582–3598. [Google Scholar] [CrossRef] [Green Version]
  30. Nolte, G.; Bai, O.; Wheaton, L.; Mari, Z.; Vorbach, S.; Hallett, M. Identifying true brain interaction from EEG data using the imaginary part of coherency. Clin. Neurophysiol. 2004, 115, 2292–2307. [Google Scholar] [CrossRef]
  31. Schmahmann, J.D.; Pandya, D.N. Anatomic Organization of the Basilar Pontine Projections from Prefrontal Cortices in Rhesus Monkey. J. Neurosci. 1997, 17, 438–458. [Google Scholar] [CrossRef]
  32. Middleton, F.A.; Strick, P.L. Basal-ganglia “projections” to the prefrontal cortex of the primate. J. Neurosci. 2001, 21, 700–712. [Google Scholar] [CrossRef] [PubMed]
  33. Guevara, M.A.; Corsi-Cabrera, M. EEG coherence or EEG correlation? Int. J. Psychophysiol. 1996, 23, 145–153. [Google Scholar] [CrossRef]
  34. Lowet, E.; Roberts, M.J.; Bonizzi, P.; Karel, J.; De Weerd, P. Quantifying neural oscillatory synchronization: A comparison between spectral coherence and phase-locking value approaches. PLoS ONE 2016, 11. [Google Scholar] [CrossRef] [PubMed] [Green Version]
  35. Bowyer, S.M. Coherence a measure of the brain networks: Past and present. Neuropsychiatr. Electrophysiol. 2016, 2, 1. [Google Scholar] [CrossRef]
  36. Person, A.L.; Raman, I.M. Synchrony and neural coding in cerebellar circuits. Front. Neural Circuits 2012, 6, 1–32. [Google Scholar] [CrossRef] [Green Version]
  37. Daskalakis, Z.J.; Paradiso, G.O.; Christensen, B.K.; Fitzgerald, P.B.; Gunraj, C.; Chen, R. Exploring the connectivity between the cerebellum and motor cortex in humans. J. Physiol. 2004, 557, 689–700. [Google Scholar] [CrossRef]
  38. Gross, J.; Pollok, B.; Dirks, M.; Timmermann, L.; Butz, M.; Schnitzler, A. Task-dependent oscillations during unimanual and bimanual movements in the human primary motor cortex and SMA studied with magnetoencephalography. Neuroimage 2005, 26, 91–98. [Google Scholar] [CrossRef]
  39. Long, J.; Tazoe, T.; Soteropoulos, D.S.; Perez, M.A. Interhemispheric connectivity during bimanual isometric force generation. J. Neurophysiol. 2016, 1196–1207. [Google Scholar] [CrossRef] [Green Version]
  40. Alexander, G.E.; Crutcher, M.D.; Delong, M.R. Basal ganglia-thalamocortical circuits: Parallel substrates for motor, oculomotor, “prefrontal”; and “limbic”; functions. Prog. Brain Res. 1990, 85, 119–149. [Google Scholar]
  41. de Carvalho Aguiar, P.M.; Ozelius, L.J. Classification and genetics of dystonia. Neurology 2002, 1, 316–325. [Google Scholar] [CrossRef]
  42. Dias, F.M.V.; Kummer, A.; Doyle, F.C.P.; Harsányi, E.; Cardoso, F.; Fontenelle, L.F.; Teixeira, A.L. Psychiatric disorders in primary focal dystonia and in Parkinson’s disease. Neuropsychiatr. Dis. Treat. 2011, 7, 111–116. [Google Scholar] [CrossRef] [PubMed] [Green Version]
  43. Lencer, R.; Steinlechner, S.; Stahlberg, J.; Rehling, H.; Orth, M.; Baeumer, T.; Rumpf, H.; Meyer, C.; Klein, C.; Muenchau, A.; et al. Primary focal dystonia: Evidence for distinct neuropsychiatric and personality profiles. J. Neurol. Neurosurg. Psychiatry 2009, 1176–1179. [Google Scholar] [CrossRef] [PubMed] [Green Version]
  44. Leisman, G.; Ashkenazi, M. Aetiological factors in dyslexia: Iv. Cerebral hemispheres are functionally equivalent. Neuroscience 1980, 11, 157–164. [Google Scholar] [CrossRef]
  45. Previc, F.H. Dopamine and the origins of human intelligence. Brain Cogn. 1999, 41, 299–350. [Google Scholar] [CrossRef] [PubMed] [Green Version]
  46. Wong, D.F.; Braši, J.R.; Singer, H.S.; Schretlen, D.J.; Zhou, Y.; Nandi, A.; Maris, M.A.; Alexander, M.; Ye, W.; Rousset, O.; et al. Mechanisms of Dopaminergic and Serotonergic Neurotransmission in Tourette Syndrome: Clues from an in vivo Neurochemistry Study with PET. Neuropsychopharmacology 2008, 33, 1239–1251. [Google Scholar] [CrossRef] [PubMed]
  47. Brisch, R.; Saniotis, A.; Wolf, R.; Bielau, H.; Bernstein, H.; Steiner, J.; Bogerts, B.; Braun, K.; Jankowski, Z.; Kumaratilake, J.; et al. The role of dopamine in schizophrenia from a neurobiological and evolutionary perspective: Old fashioned, but still in vogue. Front. Psychiatry 2014, 5, 47. [Google Scholar] [CrossRef]
  48. Mink, J.W. Basal ganglia dysfunction in Tourette’s syndrome: A new hypothesis. Pediatr. Neurol. 2001, 25, 190–198. [Google Scholar] [CrossRef]
  49. Ashok, A.H.; Marques, T.R.; Jauhar, S.; Nour, M.M.; Goodwin, G.M.; Young, A.H.; Howes, O.D. The dopamine hypothesis of bipolar affective disorder: The state of the art and implications for treatment. Mol. Psychiatry 2017, 22, 666–679. [Google Scholar] [CrossRef]
  50. Herrmann, C.S.; Lenz, D.; Junge, S.; Busch, N.A.; Maess, B. Memory matches evoke human gamma-responses. BMC Neurosci. 2004, 5, 1–8. [Google Scholar] [CrossRef] [Green Version]
  51. Lachaux, J.P.; Jung, J.; Mainy, N.; Dreher, J.C.; Bertrand, O.; Baciu, M.; Minotti, L.; Hoffmann, D.; Kahane, P. Silence is golden: Transient neural deactivation in the prefrontal cortex during attentive reading. Cereb. Cortex 2008, 18, 443–450. [Google Scholar] [CrossRef] [Green Version]
  52. Engel, A.K.; Fries, P.; Singer, W. Dynamic predictions: Oscillations and syncronny in top-down processing. Nat. Rev. Neurosci. 2001, 2, 704–716. [Google Scholar] [CrossRef] [PubMed]
  53. Riehle, A.; Requin, J. The predictive value for performance speed of preparatory changes in neuronal activity of the monkey motor and premotor cortex. Behav. Brain Res. 1993, 53, 35–49. [Google Scholar] [CrossRef]
  54. Crammond, D.J.; Kalaska, J.F. Prior information in motor and premotor cortex: Activity during the delay period and effect on pre-movement activity. J. Neurophysiol. 2000, 84, 986–1005. [Google Scholar] [CrossRef] [PubMed]
  55. Miller, E.K.; Cohen, J.D. An integrate theory of PFC function. Annu. Rev. Neurosci. 2001, 24, 167–202. [Google Scholar] [CrossRef] [PubMed] [Green Version]
  56. Riehle, A.; Grammont, F.; Diesmann, M.; Grün, S. Dynamical changes and temporal precision of synchronized spiking activity in monkey motor cortex during movement preparation. J. Physiol. 2000, 94, 569–582. [Google Scholar] [CrossRef]
  57. Andreasen, N.C.; O’Leary, D.S.; Cizadlo, T.; Arndt, S.; Rezai, K.; Boles Ponto, L.L.; Watkins, G.L.; Hichwa, R.D. Schizophrenia and cognitive dysmetria: A positron-emission tomography study of dysfunctional prefrontal-thalamic-cerebellar circuitry. Proc. Natl. Acad. Sci. USA 1996, 93, 9985–9990. [Google Scholar] [CrossRef] [Green Version]
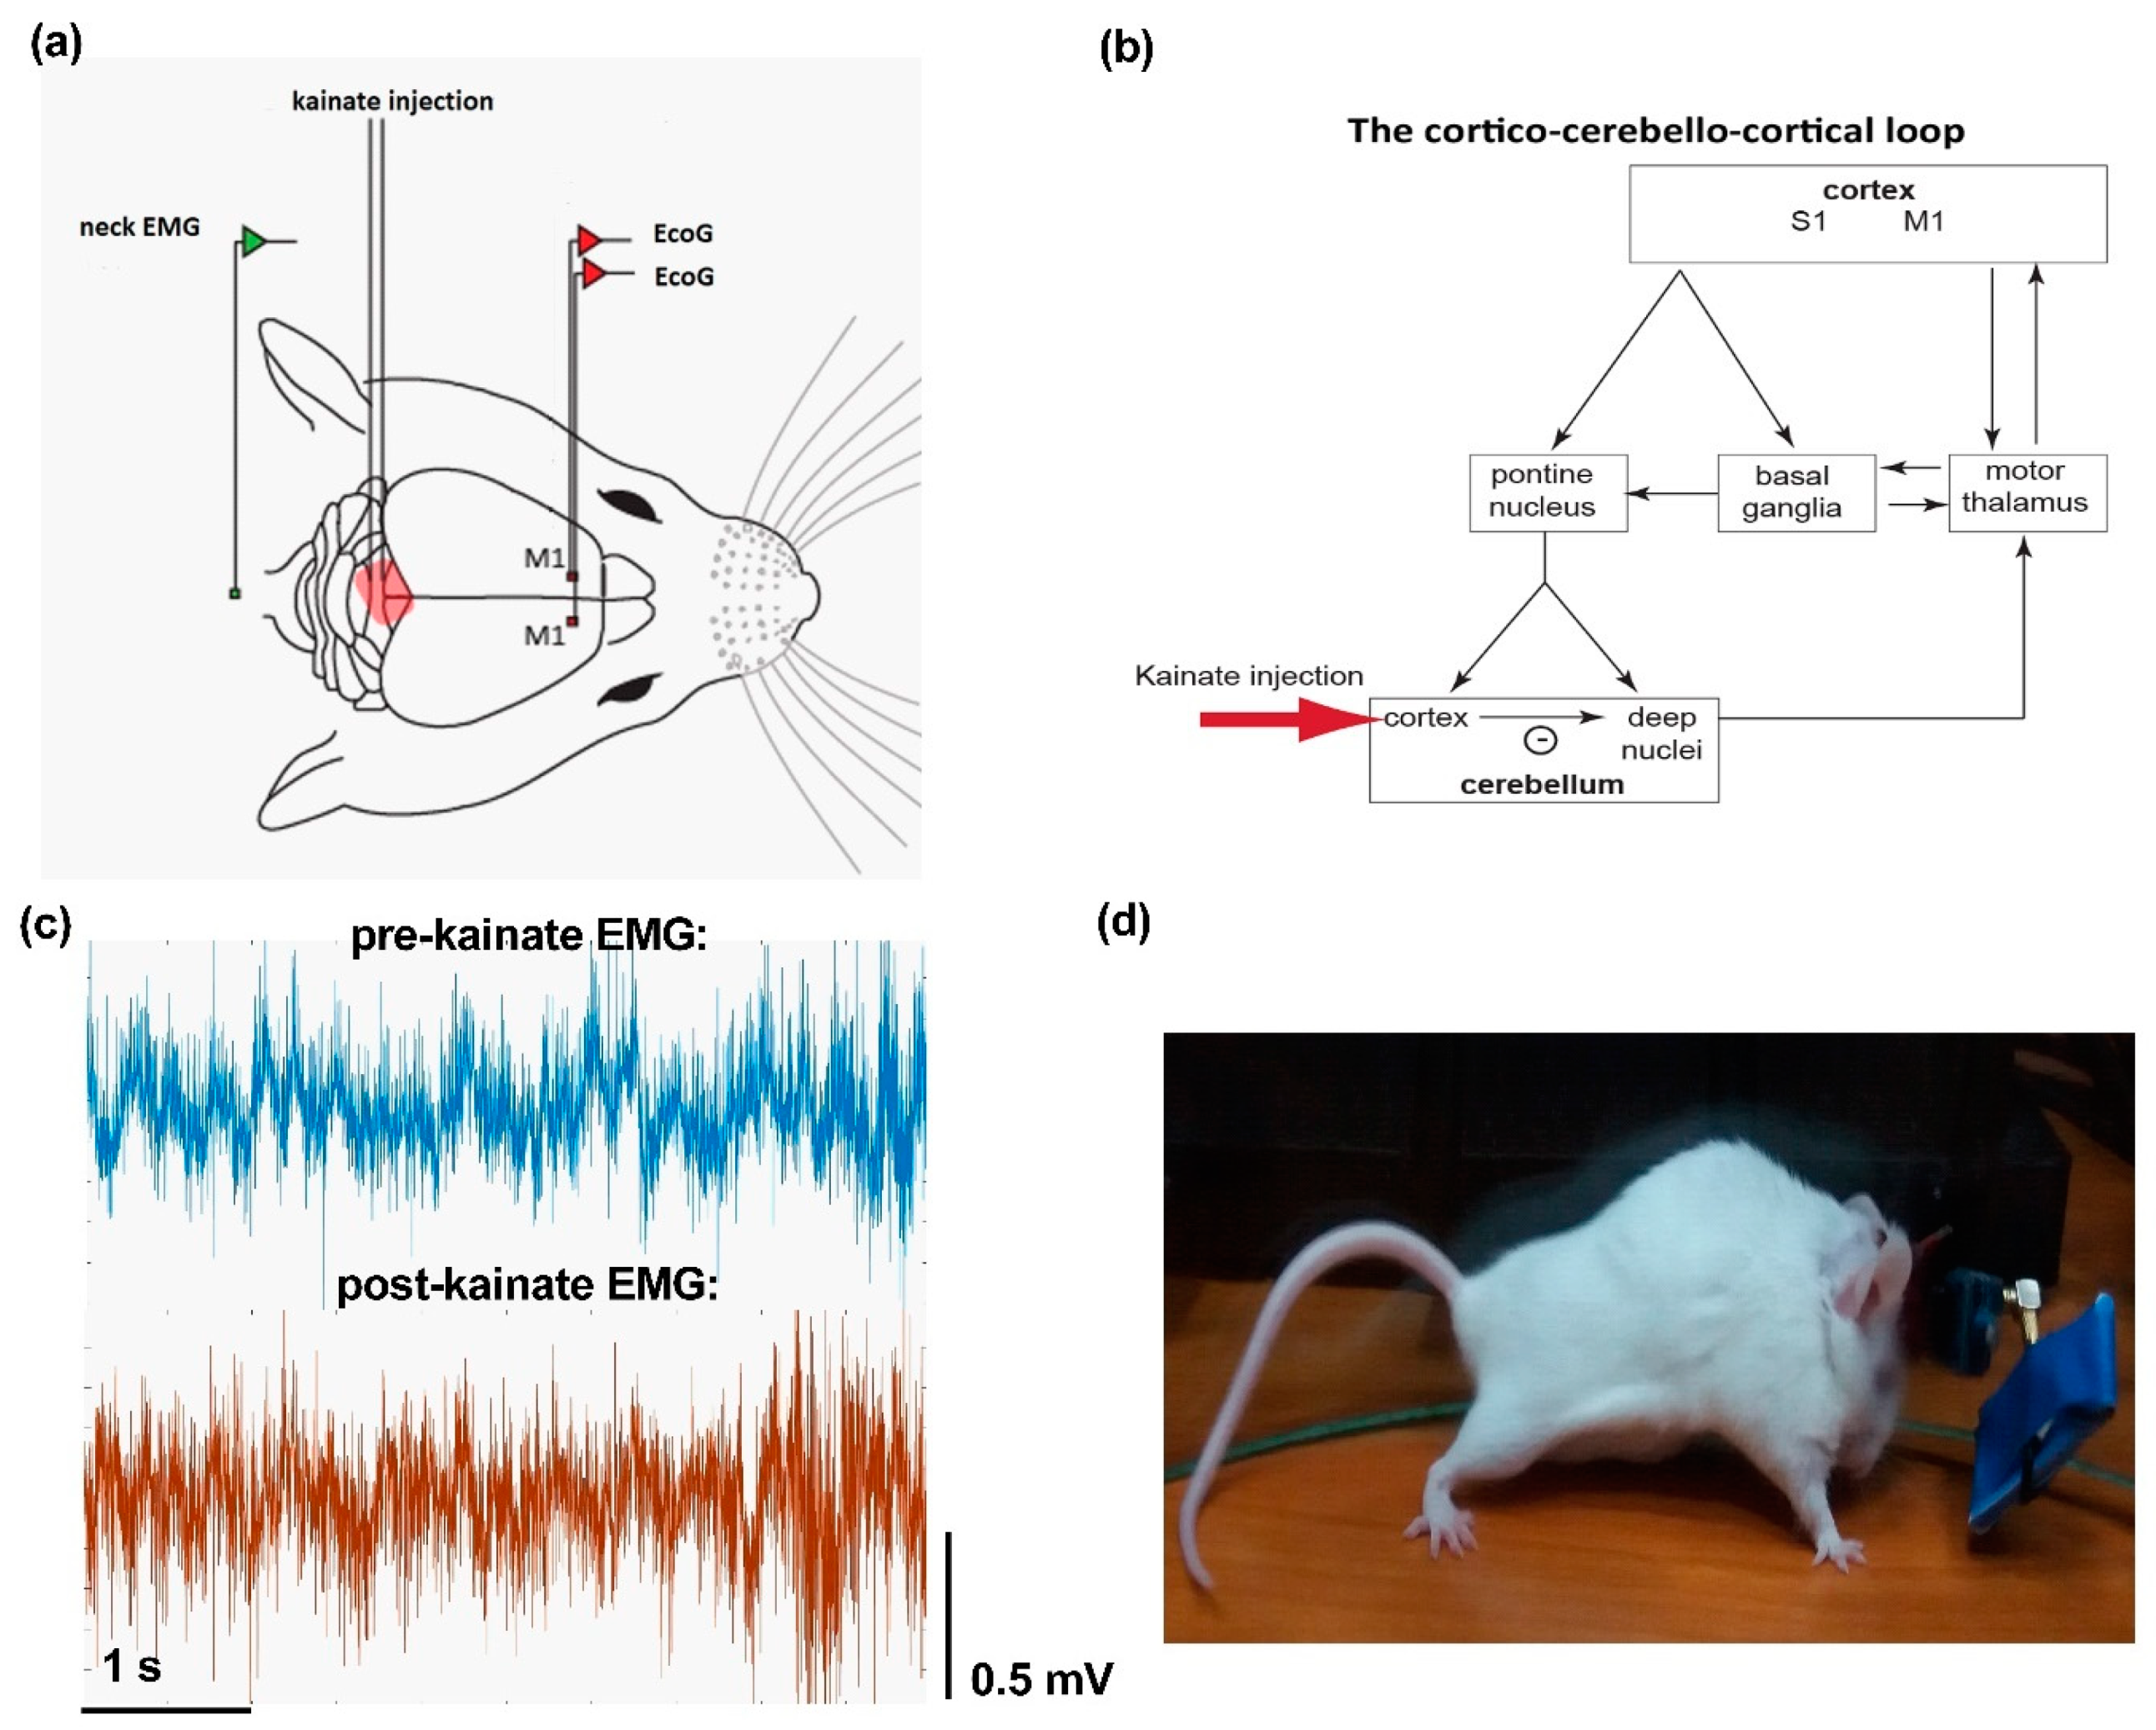
Figure 1. (a) Schematic representation of the experiment setup (adaptation after Georgescu et al. [15]); placement of the electrodes for the left and right primary motor cortices (M1) electrocorticograms (ECoGs). (b) Diagram of the cortico-cerebellar-cortico-circuit (S1 is an acronym for sensorimotor cortex) and indication of the site of kainate application. (c) Example of electromyogram (EMG) traces before and after the kainate cerebellar vermis administration. (d) The phenotypic effect of the kainate administration with intense truncal muscle contractions.
Brainsci 10 00621 g001
Figure 2. Average interhemispheric coherence between primary motor cortices before (baseline day) and after 5 days of repeated vermis cerebellar kainate administration across different frequency spectral bands. (a) Delta band (0.5–3.5 Hz). (b) Theta band (4–12.5 Hz). (c) Beta band (13–30 Hz). (d) Low-gamma band (30.5–48 Hz). (e) High-gamma band (52–100 Hz) frequencies in baseline day and kainate administration day. (f) For each frequency band, the coherences are expressed as average ± the standard error of the mean (* for p < 0.05 and ** for p < 0.01, day of kainate application versus baseline day; statistical tests detailed in Table 1).
Brainsci 10 00621 g002
Figure 3. (a) Imaginary interhemispheric coherence during baseline and kainate day per frequency band. Results are expressed as average ± the standard error of the mean. (b) Imaginary interhemispheric coherences across 0.5–100 Hz frequencies (average) (** for p < 0.01).
Brainsci 10 00621 g003
Figure 4. Pearson correlations between left and right motor cortices interhemispheric coherence and behavior in baseline and the first day of cerebellar kainate application. (a) Linear regression of active wake percentage in baseline day versus interhemispheric coherence (delta, theta, beta, low gamma, high gamma bands). (b) Linear regression of dystonia score versus interhemispheric coherence (delta, theta, beta, low gamma, high gamma bands) in kainate day 1. (c) Linear regression of active wake percentage versus interhemispheric coherence (delta, theta, beta, low gamma, high gamma bands) in kainate day 1. Each point corresponds to one subject. The plain and dotted curves denote the 95% tolerance and confidence intervals of the linear regression, correspondingly. R and p values are indicated above on each graph.
Brainsci 10 00621 g004
Figure 5. Pearson correlations between left and right motor cortices (interhemispheric) coherence and behavior on the fifth day of cerebellar kainate application. (a) Linear regression of dystonia score in kainate day 5 versus interhemispheric coherence (delta, theta, beta, low gamma, high gamma bands). (b) Linear regression of active wake percentage versus interhemispheric coherence (delta, theta, beta, low gamma, high gamma bands) in kainate day 5. Each point corresponds to one subject. The plain and dotted curves denote the 95% tolerance and confidence intervals of the linear regression, correspondingly. R and p values are indicated above on each graph.
Brainsci 10 00621 g005
Table 1. Interhemispheric coherence between primary motor cortices. Statistical data (Figure 2a–f).
Interhemispheric Coherence between Primary Motor Cortices
Frequency BandTestp-Value
Delta pre-kainateMixed-effects model (REML)
F (1.953, 15.23) = 0.6940
0.5114
day 0 vs. day 1Dunnett’s multiple comparisons test (1)0.0125 (*)
day 0 vs. day 210.8189
day 0 vs. day 310.0874
day 0 vs. day 410.8051
day 0 vs. day 510.6919
Delta post-kainateMixed-effects model (REML)
F (1.662, 12.30) = 4.097
0.0492 (*)
day 0 vs. day 110.0752
day 0 vs. day 210.3924
day 0 vs. day 310.1531
day 0 vs. day 410.0499 (*)
day 0 vs. day 510.0800
Theta pre-kainateMixed-effects model (REML)
F (1.553, 12.11) = 1.768
0.2129
day 0 vs. day 110.0135 (*)
day 0 vs. day 210.0807
day 0 vs. day 310.0833
day 0 vs. day 410.1715
day 0 vs. day 510.1715
Theta post-kainateMixed-effects model (REML)
F (2.134, 15.37) = 5.300
0.0164
day 0 vs. day 110.0985
day 0 vs. day 210.1417
day 0 vs. day 310.0262
day 0 vs. day 410.0868
day 0 vs. day 510.1221
Beta pre-kainateMixed-effects model (REML)
F (1.538, 12.00) = 0.5601
0.5414
day 0 vs. day 110.0029 (**)
day 0 vs. day 210.9615
day 0 vs. day 310.0986
day 0 vs. day 410.8681
day 0 vs. day 510.7087
Beta post-kainateMixed-effects model (REML)
F (2.265, 16.76) = 2.576
0.1006
day 0 vs. day 110.1348
day 0 vs. day 210.1190
day 0 vs. day 310.1300
day 0 vs. day 410.1999
day 0 vs. day 510.1267
Low gamma pre-kainateMixed-effects model (REML)
F (0.9834, 7.670) = 0.7102
0.4225
day 0 vs. day 110.2172
day 0 vs. day 210.7971
day 0 vs. day 310.9998
day 0 vs. day 410.9465
day 0 vs. day 510.9955
Low gamma post-kainateMixed-effects model (REML)
F (1.458, 10.79) = 0.6411
0.4982
day 0 vs. day 110.5557
day 0 vs. day 210.7443
day 0 vs. day 310.7968
day 0 vs. day 410.6618
day 0 vs. day 510.9999
High gamma pre-kainateMixed-effects model (REML)
F (1.253, 9.772) = 1.800
0.2140
day 0 vs. day 110.9370
day 0 vs. day 210.4573
day 0 vs. day 310.1390
day 0 vs. day 410.5823
day 0 vs. day 510.4789
High gamma post-kainateMixed-effects model (REML)
F (2.549, 18.86) = 5.603
0.0084 (**)
day 0 vs. day 110.8771
day 0 vs. day 210.9507
day 0 vs. day 310.5170
day 0 vs. day 410.1885
day 0 vs. day 510.0102 (*)
Delta pre-kainate
day 3 vs. day 4Wilcoxon matched-pairs signed rank test (2)0.6406
day 4 vs. day 520.2969
Delta post-kainate
day 3 vs. day 420.8438
day 4 vs. day 520.2188
Theta pre-kainate
day 3 vs. day 420.3828
day 4 vs. day 520.5781
Theta post-kainate
day 3 vs. day 42>0.9999
day 4 vs. day 520.4375
Beta pre-kainate
day 3 vs. day 420.7422
day 4 vs. day 520.1094
Beta post-kainate
day 3 vs. day 42>0.9999
day 4 vs. day 520.3750
Low gamma pre-kainate
day 3 vs. day 420.8438
day 4 vs. day 520.4688
Low gamma post-kainate
day 3 vs. day 42>0.9999
day 4 vs. day 520.3750
High gamma pre-kainate
day 3 vs. day 420.1953
day 4 vs. day 52>0.9999
High gamma post-kainate
day 3 vs. day 420.0156(*)
day 4 vs. day 520.0313(*)
Legend: * p < 0.05, ** p < 0.01.
Table 2. Imaginary interhemispheric coherence between primary motor cortices. Statistical data (Figure 3a,b).
Imaginary Interhemispheric Coherence between Primary Motor Cortices
Frequency BandTestp-Value
Delta post-kainateMixed-effects model (REML)
F (0.9522, 7.617) = 0.3628
0.5541
day 0 vs. day 1Tukey’s multiple comparisons test (3)0.8356
day 0 vs. day 530.9514
day 1 vs. day 530.9885
Theta post-kainateMixed-effects model (REML)
F (0.8259, 6.607) = 0.001127
0.9543
day 0 vs. day 130.9019
day 0 vs. day 530.9617
day 1 vs. day 530.8733
Beta post-kainateMixed-effects model (REML)
F (1.316, 10.53) = 0.2092
0.7226
day 0 vs. day 130.5070
day 0 vs. day 530.9933
day 1 vs. day 530.7590
Low gamma post-kainateMixed-effects model (REML)
F (0.9655, 7.724) = 2.428
0.1591
day 0 vs. day 130.6644
day 0 vs. day 530.5433
day 1 vs. day 530.0896
High gamma post-kainateMixed-effects model (REML)
F (1.082, 8.658) = 17.85
0.0022 (**)
day 0 vs. day 130.7502
day 0 vs. day 530.0093 (**)
day 1 vs. day 530.0028 (**)
Legend: ** p < 0.01.