Article

Cholinergic System and NGF Receptors: Insights from the Brain of the Short-Lived Fish Nothobranchius furzeri

1
Department Veterinary Medicine and Animal Production, University of Naples Federico II, Naples I-80137, Italy
2
CESMA—Centro Servizi metereologici e Tecnologici Avanzati, University of Naples Federico II, I-80126 Naples, Italy
*
Author to whom correspondence should be addressed.
Brain Sci. 2020, 10(6), 394; https://doi.org/10.3390/brainsci10060394
Submission received: 31 May 2020 / Revised: 17 June 2020 / Accepted: 17 June 2020 / Published: 20 June 2020
(This article belongs to the Special Issue Effects of Neurotrophic Factors)

Abstract

:
Nerve growth factor (NGF) receptors are evolutionary conserved molecules, and in mammals are considered necessary for ensuring the survival of cholinergic neurons. The age-dependent regulation of NTRK1/NTRKA and p75/NGFR in mammalian brain results in a reduced response of the cholinergic neurons to neurotrophic factors and is thought to play a role in the pathogenesis of neurodegenerative diseases. Here, we study the age-dependent expression of NGF receptors (NTRK1/NTRKA and p75/NGFR) in the brain of the short-lived teleost fish Nothobranchius furzeri. We observed that NTRK1/NTRKA is more expressed than p75/NGFR in young and old animals, although both receptors do not show a significant age-dependent change. We then study the neuroanatomical organization of the cholinergic system, observing that cholinergic fibers project over the entire neuroaxis while cholinergic neurons appear restricted to few nuclei situated in the equivalent of mammalian subpallium, preoptic area and rostral reticular formation. Finally, our experiments do not confirm that NTRK1/NTRKA and p75/NGFR are expressed in cholinergic neuronal populations in the adult brain of N. furzeri. To our knowledge, this is the first study where NGF receptors have been analyzed in relation to the cholinergic system in a fish species along with their age-dependent modulation. We observed differences between mammals and fish, which make the African turquoise killifish an attractive model to further investigate the fish specific NGF receptors regulation.

1. Introduction

The brain of teleost fish has received much attention in the last decades, with regards to basic and applied neuroscientific research [1,2]. Among fish species, the most well studied model organism is Danio rerio, commonly known as zebrafish, widely employed in genetics research, neurophenotyping and central nervous system (CNS) drug screening, as well as in modeling complex neurological and psychiatric disorders [3]. On the other hand, the process of brain aging in the teleost has received much less attention so far [4,5]. For brain aging studies, the African turquoise killifish, Nothobranchius furzeri, has emerged as a powerful model, due to its natural lifespan ranging between 4 and 9 months, related ageing hallmarks and the available approaches for experimentally modulating the lifespan [6,7]. In the course of aging, N. furzeri shows reduced learning performances, paralleled by gliosis and reduced adult neurogenesis [4]. In addition, brain displays evolutionary conserved miRNA regulation [8,9].
Recently, our group has dedicated a lot of research efforts to identify the pattern of expression of all neurotrophins in the brain of the African turquoise killifish [9,10,11,12,13]. Neurotrophins constitute a family of evolutionary well-conserved molecules, and act in multiple context-dependent biological functions, including neuronal cell death and survival, neurite outgrowth and neuronal differentiation [14]. They play pleiotropic as well as fundamental roles in the central nervous system (CNS) of vertebrates and are thus deeply involved in several neurodegenerative conditions [15,16]. However, their actions depend upon the binding to different classes of receptors, tyrosin kinase receptors (NTRKs), and member of the tumor necrosis factor, commonly named p75/NGFR [14].
In teleost fish lineage, specific NTRK receptors gene duplication has occurred [17], resulting in five genes encoding for NTRK-receptors. Differently from NTRK2/NTRKB and NTRK3/NTRKC, which exist in two isoforms, the duplicated NTRK1/NTRKA-gene was lost early in the fish lineage and only one isoform is available in the fish genome [18]. During fish development, NTRK1/NTRKA appears 24 h post fertilization in cranial nerves and rostral hindbrain [18]. Immunohistochemical studies have documented that protein encoding NTRK1/NTRKA is distributed in the brain of adult N. furzeri [19] and zebrafish [20] and it is considered a marker of crypt cells in the olfactory organ of fish [21,22] where it seems to mediate the immune antiviral response [23]. The teleost p75/NGFR gene family has been poorly characterized so far. This receptor is one of the molecular components of the Nogo/NgR signaling pathway, which is known to be conserved in zebrafish [24,25]. Genes orthologous to those encoding the three mammalian ligands, NgR and the co-receptor p75, are represented in the fish genome. Numerous killifish species, including N. furzeri, possess only one copy of p75/NGFR orthologs. Differently, in the zebrafish genome, the most accredited hypothesis supports the persistence of at least two isoforms, p75/NGFR1a and p75/NGFR1b [26]. In zebrafish, genes encoding p75/NGFR show a striking similarity in the spatial and temporal expression patterns to that observed in mammalian species [27,28,29,30].
The balance between NTRK receptors and p75/NGFR is crucial to the functional outcome of neurotrophin binding; sufficient amounts of activated NTRKs, for example, can suppress apoptotic pathways activated by p75/NGFR [31,32]. p75/NGFR, when complexed with NTRK1/NTRKA, increases NGF signaling through NTRK1/NTRKA to enhance survival and neurite outgrowth [33]. In mammals, NGF and related receptors are necessary for ensuring the survival of cholinergic neurons [34,35]. The expression of NTRK1/NTRKA mRNA appears to be restricted to neurons of the basal forebrain and caudate-putamen, with features of cholinergic cells and to magnocellular neurons of several brainstem nuclei [36]. Similarly, p75/NGFR expression is colocalized exclusively with cholinergic neurons in the basal forebrain, and it is among the earliest cholinergic markers expressed during development [37]. During zebrafish development, p75/NGFR is localized in the cholinergic cells of the ventral basal forebrain, in mid- and hindbrain nuclei, cranial ganglia, the region of the locus coeruleus and in dorsal root ganglia [38]. In mammalian brain, the age-dependent downregulation of NTRK1/NTRKA and p75/NGFR results in a reduced response of the cholinergic neurons to neurotrophic factors and is thought to play a role in the pathogenesis of neurodegenerative diseases [39,40,41,42].
Acetylcholine is synthesized from choline and acetyl CoA by the transferase enzyme choline acetyl-transferase (ChaT), a specific marker commonly used as a reliable indicator of cholinergic neurons [43]. The cholinergic system is an important ubiquitous system in vertebrate brains, and it is implicated in processes such as the modulation of behavior, learning and memory, the sleep-wakefulness cycle and superior cognitive functions [44]. Cholinergic neurons and fibers are localized in homologous brain areas of non-mammalian vertebrates, reinforcing the idea of an evolutionary conservation of the system, although in each group species-specific features have been reported [45,46,47,48,49,50,51,52,53].
Based on this evidence, here we propose to investigate the age-dependent regulation of NTRK1/NTRKA and p75/NGFR in the brain of N. furzeri, their pattern of expression, and evaluate if cholinergic neurons are the main source of NTRK1/NTRKA and p75/NGFR in the adult brain of the killifish. To accomplish this aim, we therefore also studied the neuroanatomical organization of the cholinergic system in adult specimens of African turquoise killifish.

2. Materials and Methods

2.1. Animals and Tissue Sampling

The experimental protocols were approved by the Animal Welfare Body of University of Naples Federico II (2015/0023947). Experiments were performed on the Nothobranchius furzeri MZM–04/10 strain of both sexes. Animals’ maintenance was performed as previously described [54]. Young (5 weeks post hatching), adult (14 weeks post hatching) and old (27 weeks post hatching) animals were euthanized with a 0.1% solution of ethyl 3-aminobenzoate methane sulfonate (MS—222; Sigma, St. Louis, MO, USA; A-5040). In order to avoid the effect of circadian rhythms and feeding, all animals were suppressed around 10 a.m. For RNA extraction, fish were decapitated, brains were rapidly dissected, kept in sterile tubes (Eppendorf) with 500 µL of RNAlater (Qiagen, Hilden, Germany), and stored at 4 °C until RNA extraction.
For fluorescence in situ hybridization, combined fluorescence in situ hybridization and immunofluorescence (IF), and light immunohistochemistry, animals were decapitated, heads were rapidly excised and fixed in a sterile solution of paraformaldehyde (PFA) 4% in phosphate buffered saline (PBS) overnight (ON). Successively, brains were dissected and incubated in 30% sucrose solution ON, 4 °C, and then in 20% sucrose solution ON, 4 °C; finally, they were embedded in a cryomounting medium and stored at −80 °C. Serial transversal sections of 14 µm thickness were cut with a Leica cryostat (Leica, Deerfield, IL, USA).
For light immunohistochemistry, 5 heads of adult animals were collected and fixed in solution of PFA) 4%, processed for paraffin embedding, and serial transversal and sagittal sections of 7 µm thickness were obtained.

2.2. RNA Isolation and cDNA Synthesis

Tissues were taken out of RNAlater and cleaned with sterile pipettes. N. furzeri total RNA was isolated from 12 animals with QIAzol (Qiagen), as previously described [10]. Homogenization was performed using a TissueLyzer II (Qiagen) at 20 Hz for 2–3 × 1 min. Total RNA was then quantitated with Eppendorf BioPhotometer (Hamburg, Germany). Five hundred nanograms of each sample was retrotranscribed to cDNA in a 20 µL volume, using the QuantiTect® Reverse Transcription Kit (Qiagen), following the supplier’s protocol. Newly synthetized cDNAs were then diluted to a final volume of 200 µL with ultra-pure sterile water to an approximate final cDNA concentration of 40 ng/µL.

2.3. Quantitative Real Time-PCR

Primers were designed with the Primer3 tool. All reactions were performed in triplicate and negative control (water) was always included. Reactions were performed in a 20 µL volume containing 1 µL of diluted cDNA, using BrightGreen 2X qPCR MasterMix kit (abm®, Richmond, BC, Canada) following the manufacturer’s instructions. After the initial heat activation for 2 min at 95 °C, a 2-step cycling was run (denaturation 5 s at 95 °C, combined annealing/extension 10 s at 60 °C) for 35 cycles. Primers were the following:
NTRK1/NTRKA: forward 5′-ATGGTGCAATTGGACATTGA-3′; reverse 5′-TACAGCCAGGTGATGTTTGG-3′;
p75/NGFR: forward 5′-ACCGTGTCGAGACTCACAGA-3′; reverse 5′-TGTAGGGCTGTGCACTGTGT-3′.

2.4. Statistical Analysis

Expression levels of NTRK1/NTRKA and p75/NGFR mRNAs were analyzed by the ΔΔCt method and normalized to the housekeeping gene TATA box binding protein (TBP): forward 5′-CGGTTGGAGGGTTTAGTCCT-3′; reverse 5′-GCAAGACGATTCTGGGTTTG-3′). Fold changes represent the difference in expression levels of the two receptors between the time points analyzed, respectively with young and old age TATA-binding protein (TBP) cDNAs. The relative ΔΔ curve threshold was built on fold changes values and the p-value was <0.01. Statistical analysis of quantitative real-time data was done by an unpaired two-tailed t test and Pearson correlation by using GraphPad Prism 8 (GraphPad Software, San Diego, CA, USA).

2.5. In Vitro Transcription and Probe Synthesis

mRNA probes to identify NGF mRNA receptors were synthetized by in vitro transcription (IVT) using the MAXIscript™ SP6/T7 in vitro transcription kit (Catalogue number AM1312, Invitrogen by Thermo Fisher Scientific, Carlsbad, CA. USA) and following the manufacturer’s instructions. One microgram of the DNA template was transcribed to RNA in 20 µL volume reaction, using primers associated with the T7 promoter sequence (NTRK1/NTRKA forward 5′-ATGGATGGAAACCCTGAGCC-3′; NTRK1/NTRKA T7 reverse 5′-GGTAATACGACTCACTATAGG_GTGTGTTTGAAGCTGCTCGA-GTTGATGTGGGTCGGCTTA-3′; p75/NGFR forward 5′-TCGATGAAGAGCCATGTTTG-3′, p75/NGFR T7 reverse 5′-GGTAATACGACTCACTATAGG_GCCTCATCTGGGAGTGGTAA-3′) and a DIG RNA Labeling Mix, 10× concentration (Roche, Basel, Switzerland) containing digoxigenin labeled uracil. After the IVT reaction, the product was briefly centrifuged and incubated at 37 °C for 1 h. Then 1 µL of turbo DNase 1 was added, the sample was mixed well and incubated for 15 min at 37 °C. One microliter of EDTA 0.5 M was added to stop the reaction. Reaction product was analyzed by gel electrophoresis and quantified.

2.6. Fluorescence In Situ Hybridization

In situ hybridization was performed on cryosections using sterile solutions and materials. Sections were dried for 2 h at room temperature (RT), well washed in 1 × DEPC/PBS and treated with 10 µg/µL Proteinase K (Sigma–Aldrich), diluted 1:200 in DEPC/PBS for 10 min. Sections were then washed twice in 2 mg/mL glycine, 5 min each to inactivate proteinase K. Sections were post fixed in PFA 4% for 20 min and well washed in 1× DEPC/PBS at RT. Thereafter, the prehybridization was carried out in a hybridization solution (HB) containing 50% formamide, 25% 20× SSC, 50 µg/mL Heparin, 10 µg/mL yeast RNA, 0.1% Tween 20 and 0.92% citric acid at 52 °C for 1 h. All probes were denatured for 10 min at 80 °C and sections were then incubated, in HB containing riboprobes concentration of 500 pg/µL, ON at 52 °C. Post-hybridization washes were carried out at 52 °C as follows: 2 × 20 min in 1× SSC, 2 × 10 min in 0.5× SSC and then in 1× DEPC/PBS at RT. Sections were blocked in the blocking solution (BS) containing 10% normal sheep serum heat inactivated and 0.5% blocking reagent (Roche, Basel, Switzerland) for 1 h at RT. Later, sections were incubated in a 1:2000 dilution of anti-digoxigenin Fab fragments conjugated with alkaline phosphatase (Roche) in BS, 2 h at RT. Sections were well washed in 1× DEPC/PBS. The chromogenic reaction was carried out by using Fast Red tablets (Sigma-Aldrich) in Tris buffer and incubating the slides at RT in the dark and was observed every 20 min until signal detection. Finally, sections were washed in 1× DEPC/PBS at RT and mounted with the Fluoreshield mounting medium with DAPI as counterstaining for the nuclei.

2.7. Combined Fluorescence In Situ Hybridization with Immunofluorescence

After the detection of the ISH chromogenic reaction, sections of adult animals were well washed in DEPC/PBS, and incubated at RT for 1 h with a blocking serum (normal goat serum 1:5 in PBS containing 0.1% Triton X-100, Sigma) and subsequently with primary antiserum (Anti-ChaT, cat. #AB143, Merck Millipore, Burlington, MA. USA) 1:100, at 4 °C ON. DEPC/PBS washes preceded the incubation with the secondary antibodies: goat anti-rabbit IgG (H+L) Alexa fluor™ Plus 488 (1:1000, Invitrogen by Thermo Fisher Scientific, ref. A32731).

2.8. Light Immunohistochemistry

Immunohistochemistry was conducted on cryo- and paraffin embedded sections according to previous protocols [54]. Cryosections were dried for 2 h at RT. For paraffin sections, slides were dewaxed and hydrated. All sections were rinsed in distilled water for 5 min. Antigen retrieval was performed by microwave oven treating (10 min, 750 W) with citrate tampon (0.01 M, pH 6.00). Endogenous peroxidase activity was blocked with 3% H2O2 treatment (20 min, RT). After three washes (5 min, RT) with PBS, slides were pre-incubated with normal goat serum (NGS), 1:5 diluted in PBS for 30 min in humid chamber, RT and then incubated with rabbit Anti-ChaT (Merck Millipore, cat. #AB143), 1:1000 at 4 °C ON. After the washes in PBS, sections were incubated at RT for 30 min with Dako EnVision + System − HRP labeled polymer. The immunoreactivity of the cells was visualized using a freshly prepared solutions of 3,3′—diaminobenzidine tetrahydrochlride (Sigma Aldrich) activated with a solution of 0.03% H2O2, after which the sections were mounted.

2.9. Microscopy

Images were analyzed by Leica—DM6B (Leica, Wetzlar, Germany) and processed with LasX software (Leica, Microsystems, Wetzlar, Germany). The digital raw images were optimized for image resolution, contrast, evenness of illumination and background using Adobe Photoshop CC 2018 (Adobe Systems, San Jose, CA, USA). Anatomical structures were identified according to the adult N. furzeri brain atlas [55].

3. Results

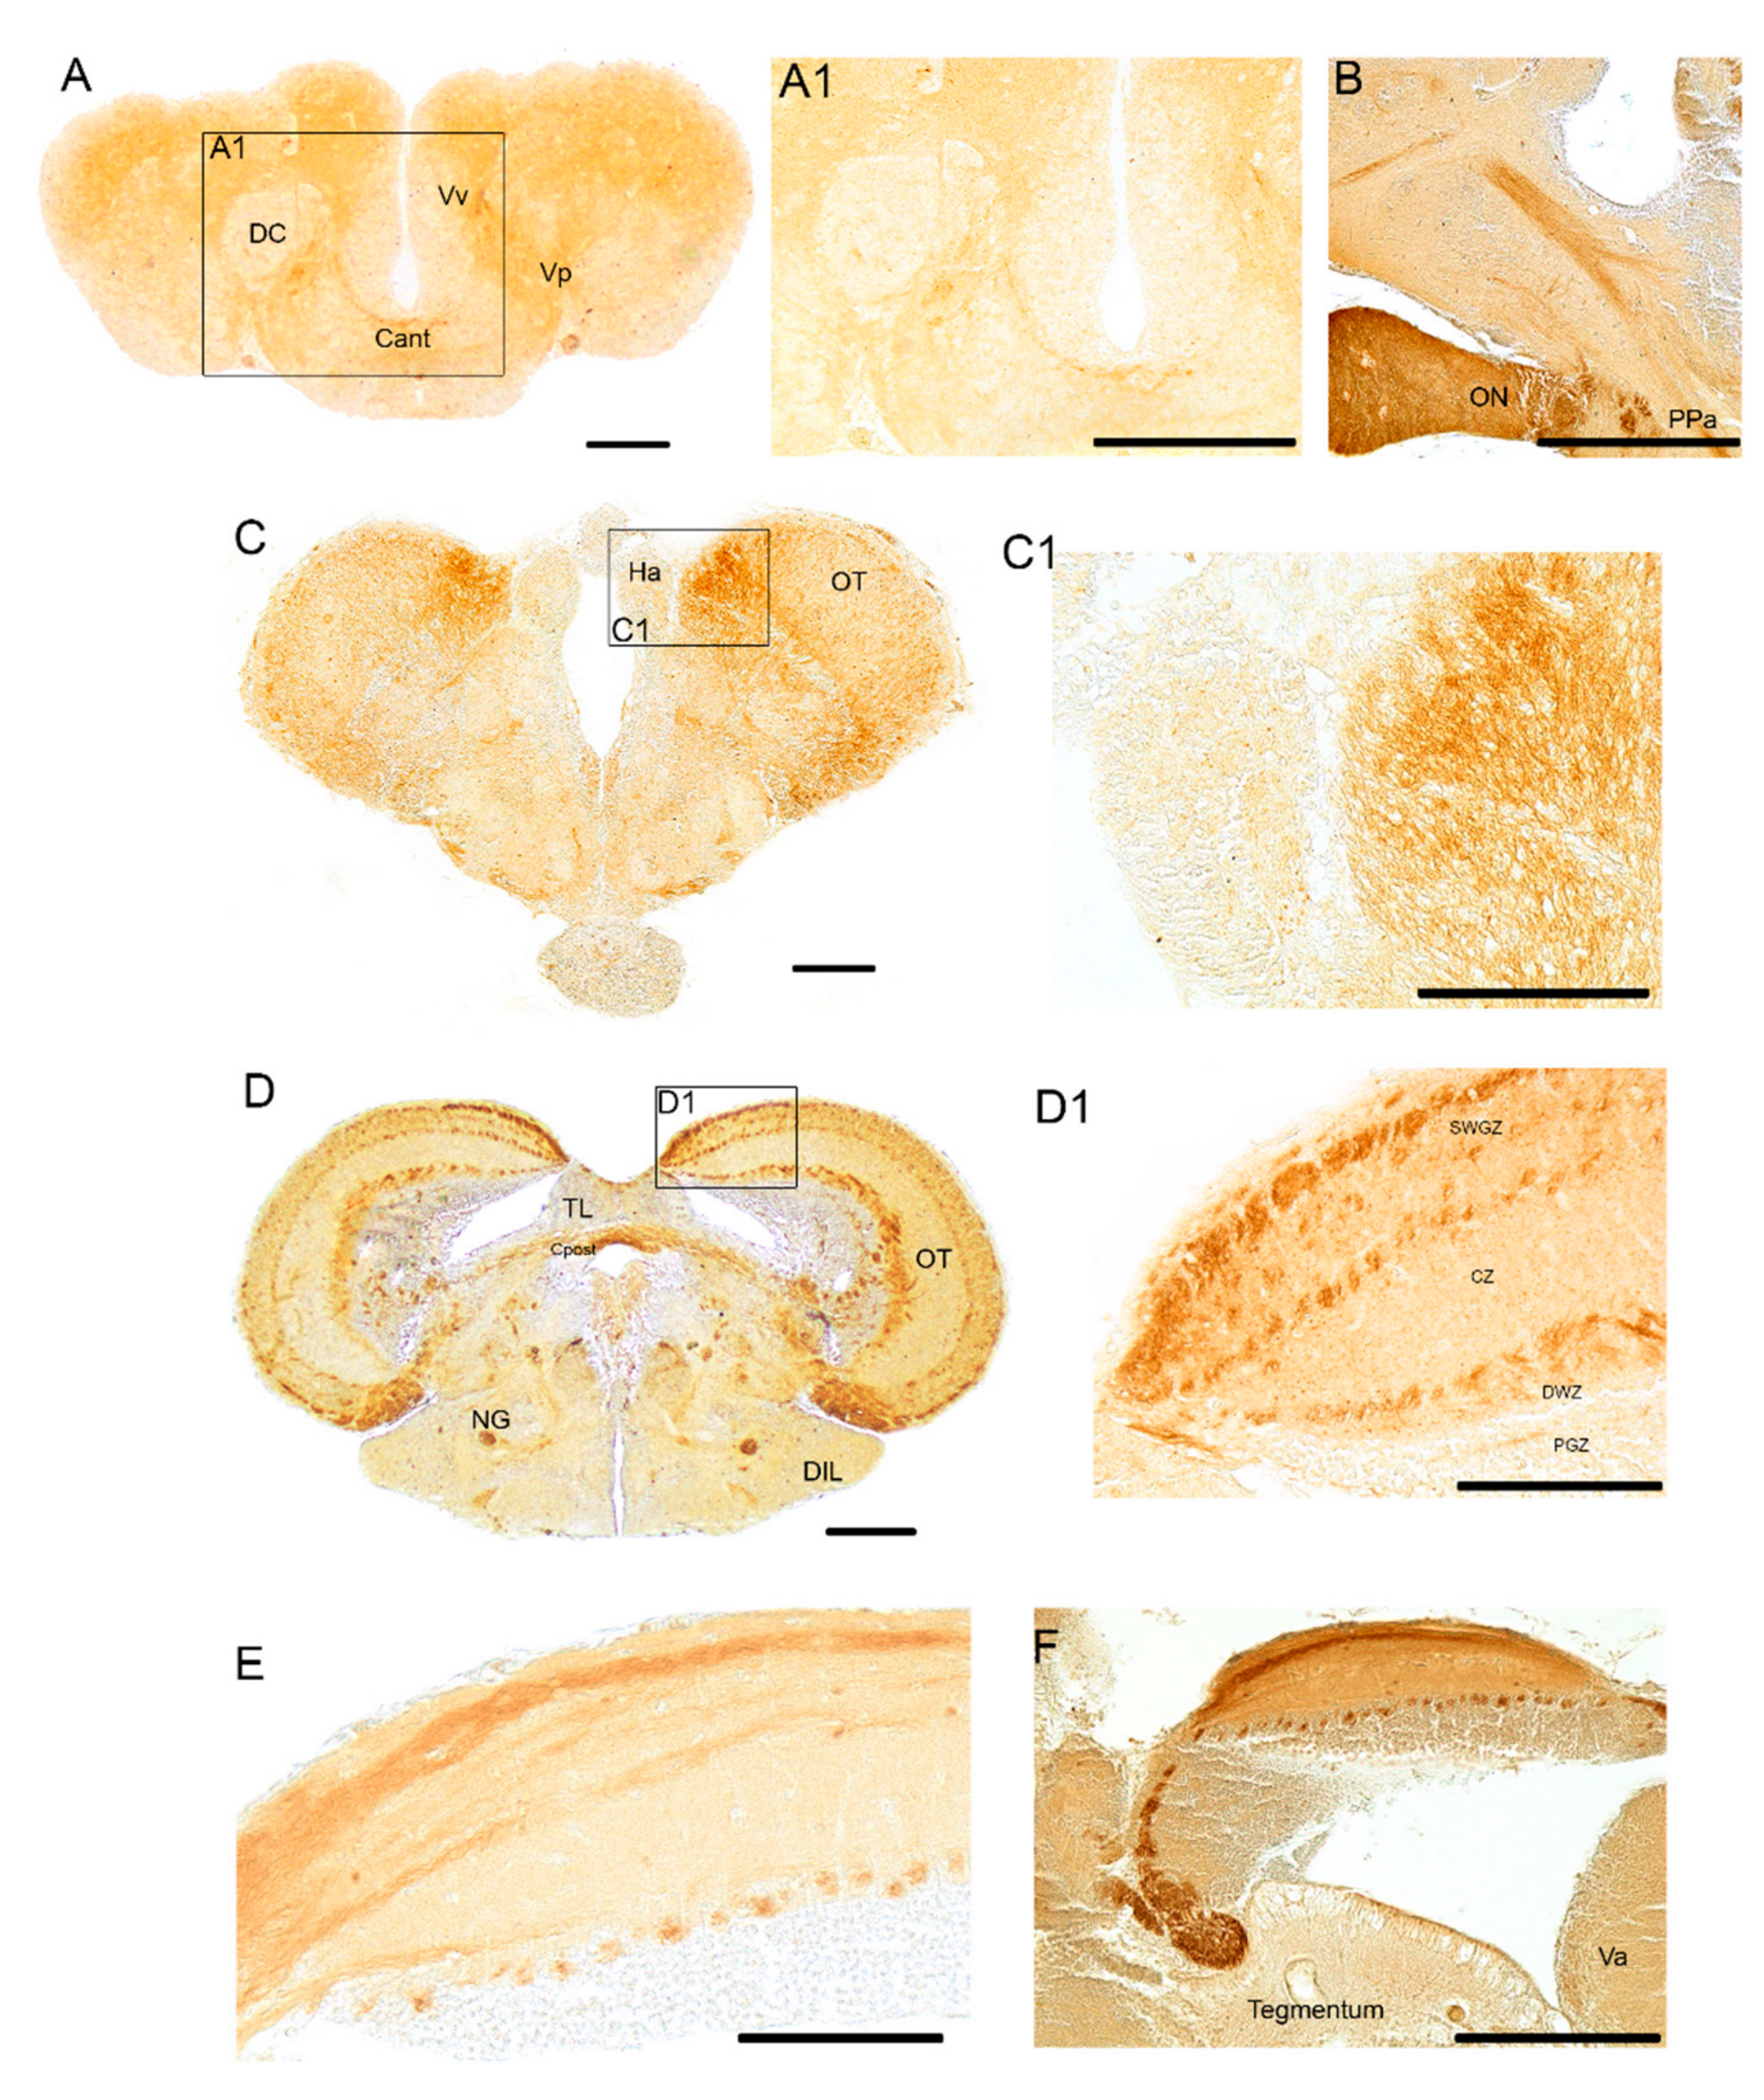
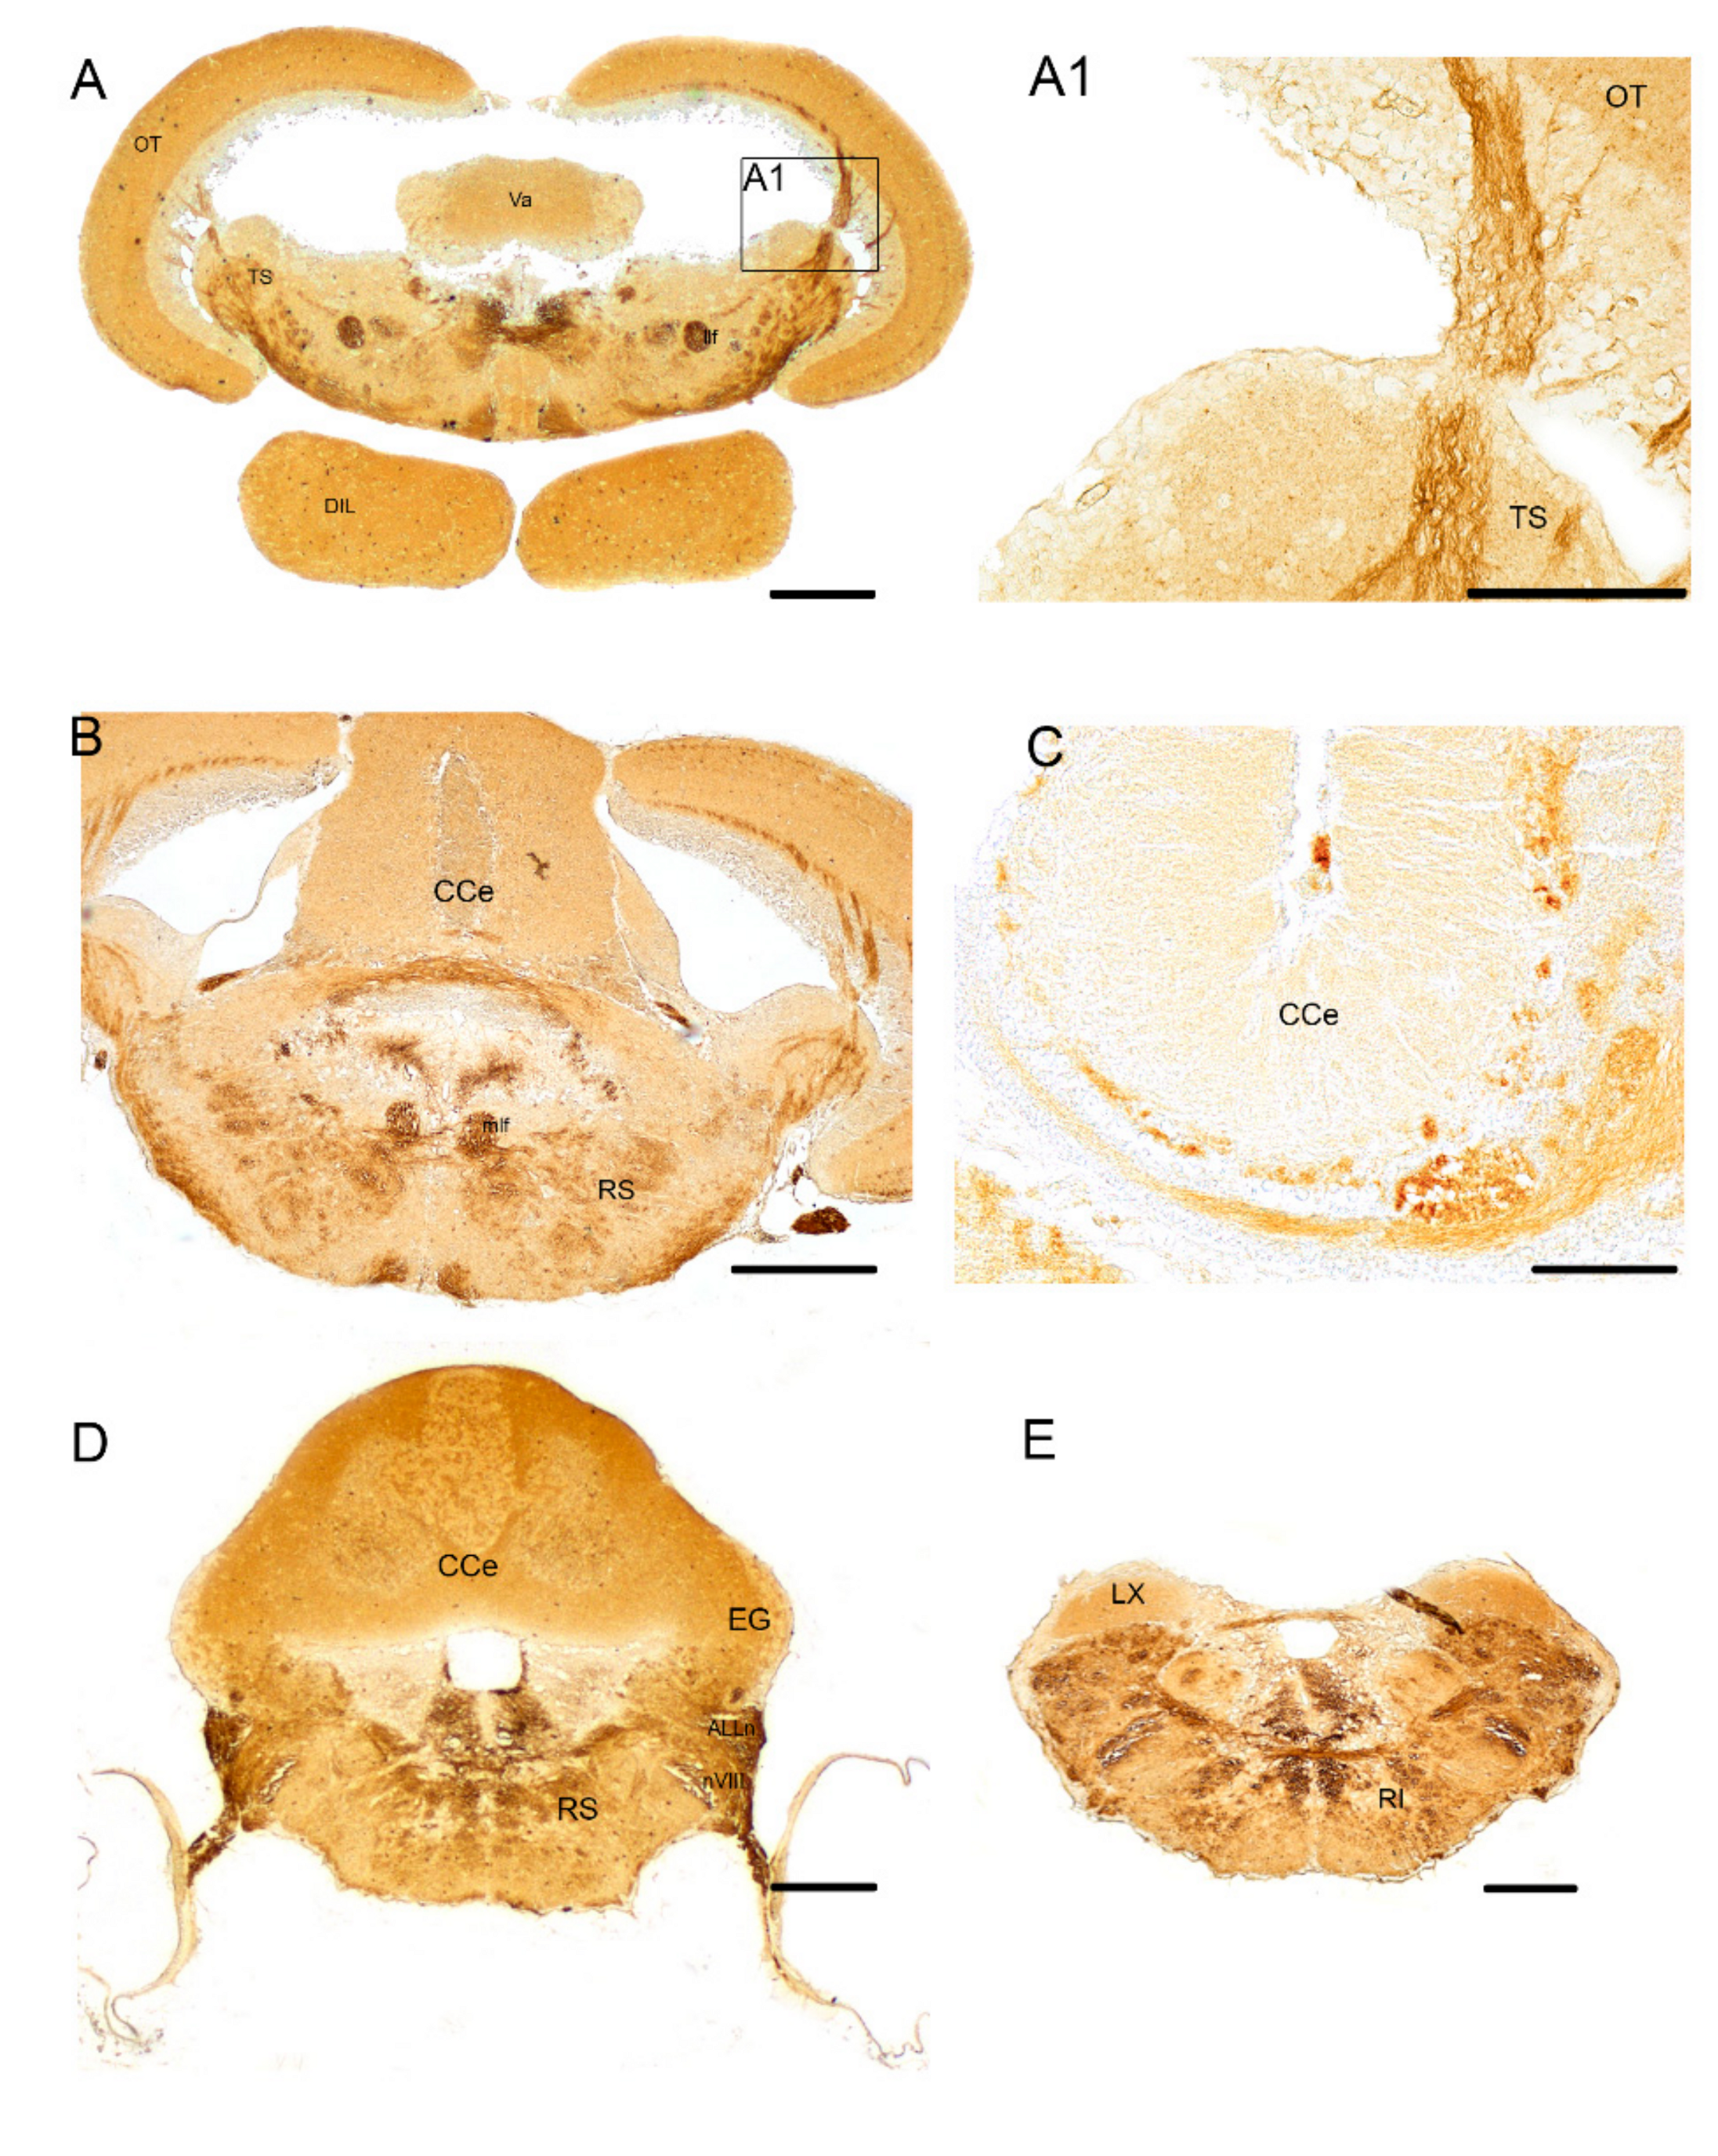
3.1. Pattern of Distribution of ChaT in the Adult Brain of N. furzeri

We characterized the neuroanatomical organization of the cholinergic system in the adult N. furzeri, an overview of the immunohistochemical distribution is given in Figure 1A,B.
Forebrain
Numerous immunopositive fibers were distributed in the olfactory bulbs, and in the telencephalon (Figure 2A,A1), mostly in the ventral (Vv) and posterior (Vp) divisions of ventral telencephalon. Intense immunoreactivity was observed in the varicose fibers of the anterior commissure (Figure 2A,A1). A group of a few positive neurons was observed in the ventral telencephalon and in the preoptic area (Figure 2B) in the rostral diencephalon. We named these two cholinergic groups respectively Ch-1 and Ch-2, according to the mammalian brain homologies of mammalian septum and basal forebrain cholinergic neurons [56,57]. Intense immunoreactivity was observed in the lateral forebrain bundle, faintly stained appeared the cells in the ventro-lateral part of habenular nucleus, and in the whole thalamic area (Figure 2C); Intense staining was detected in fibers in the preglomerular nucleus, in proximity of the ventricle (Figure 2C) and in neuronal projections of the central pretectal nucleus (Figure 2C,C1).
Midbrain
An intense immunoreactive bundle of neuronal projections ascending toward the optic tect (OT) was observed in its most cranial part (Figure 1A and Figure 2D–F). In the OT, immunoreactivity was seen in fibers of the deep white zone and superficial white and gray zone (Figure 2D,E).
Immunoreactivity to ChaT was seen in fibers, displaced along the dorsal margin of longitudinal tori and in the posterior commissure (Figure 2D). Wide distribution of positive fibers was seen in the posterior thalamic area/anterior midbrain tegmentum. More ventrally, few positive neurons were detected in the diffuse inferior lobe of the hypothalamus (Figure 1A and Figure 2D). Strongly immunoreactive fibers were seen in the lateral forebrain bundle (Figure 3A), medial forebrain bundle, central griseum (Figure 3A), ansulate commissure, cruciate tecto-bulbar tract and the semicircular tori projecting towards the optic tect (Figure 3A,B).
Hindbrain
In the cerebellum, a bundle of immunoreactive fibers running over the valvula and body of cerebellum were intensely immunoreactive to ChaT (Figure 1A and B,C). Widespread positive fibers were detected in the rostral, intermediate and caudal reticular formation of the medulla oblongata (Figure 1A and Figure 3B,D,F), and moderately dense fibers in the ventral rhombencephalic commissure, and caudal part of the tectobulbar tract (Figure 3D,F). A group of a few positive neurons was observed in the nucleus of rostral reticular formation (Figure 1A and Figure 3B). We named this group Ch-3, according to the mammalian brain homologous of the pedunculopontine nucleus and dorsolateral tegmental group [58,59]. Along the ventricle, a mesh of ChaT positive fibers was detected (Figure 1A and Figure 3D). Intense immunoreactivity was seen in neuronal projections from the octavolateral area running over the inner ear (Figure 3D). With the exception of the most caudal part of the vagal lobe, which appears devoid of immunoreactive neuronal projections, a dense mesh of positive fibers was appreciable over the entire medulla oblongata (Figure 3F).

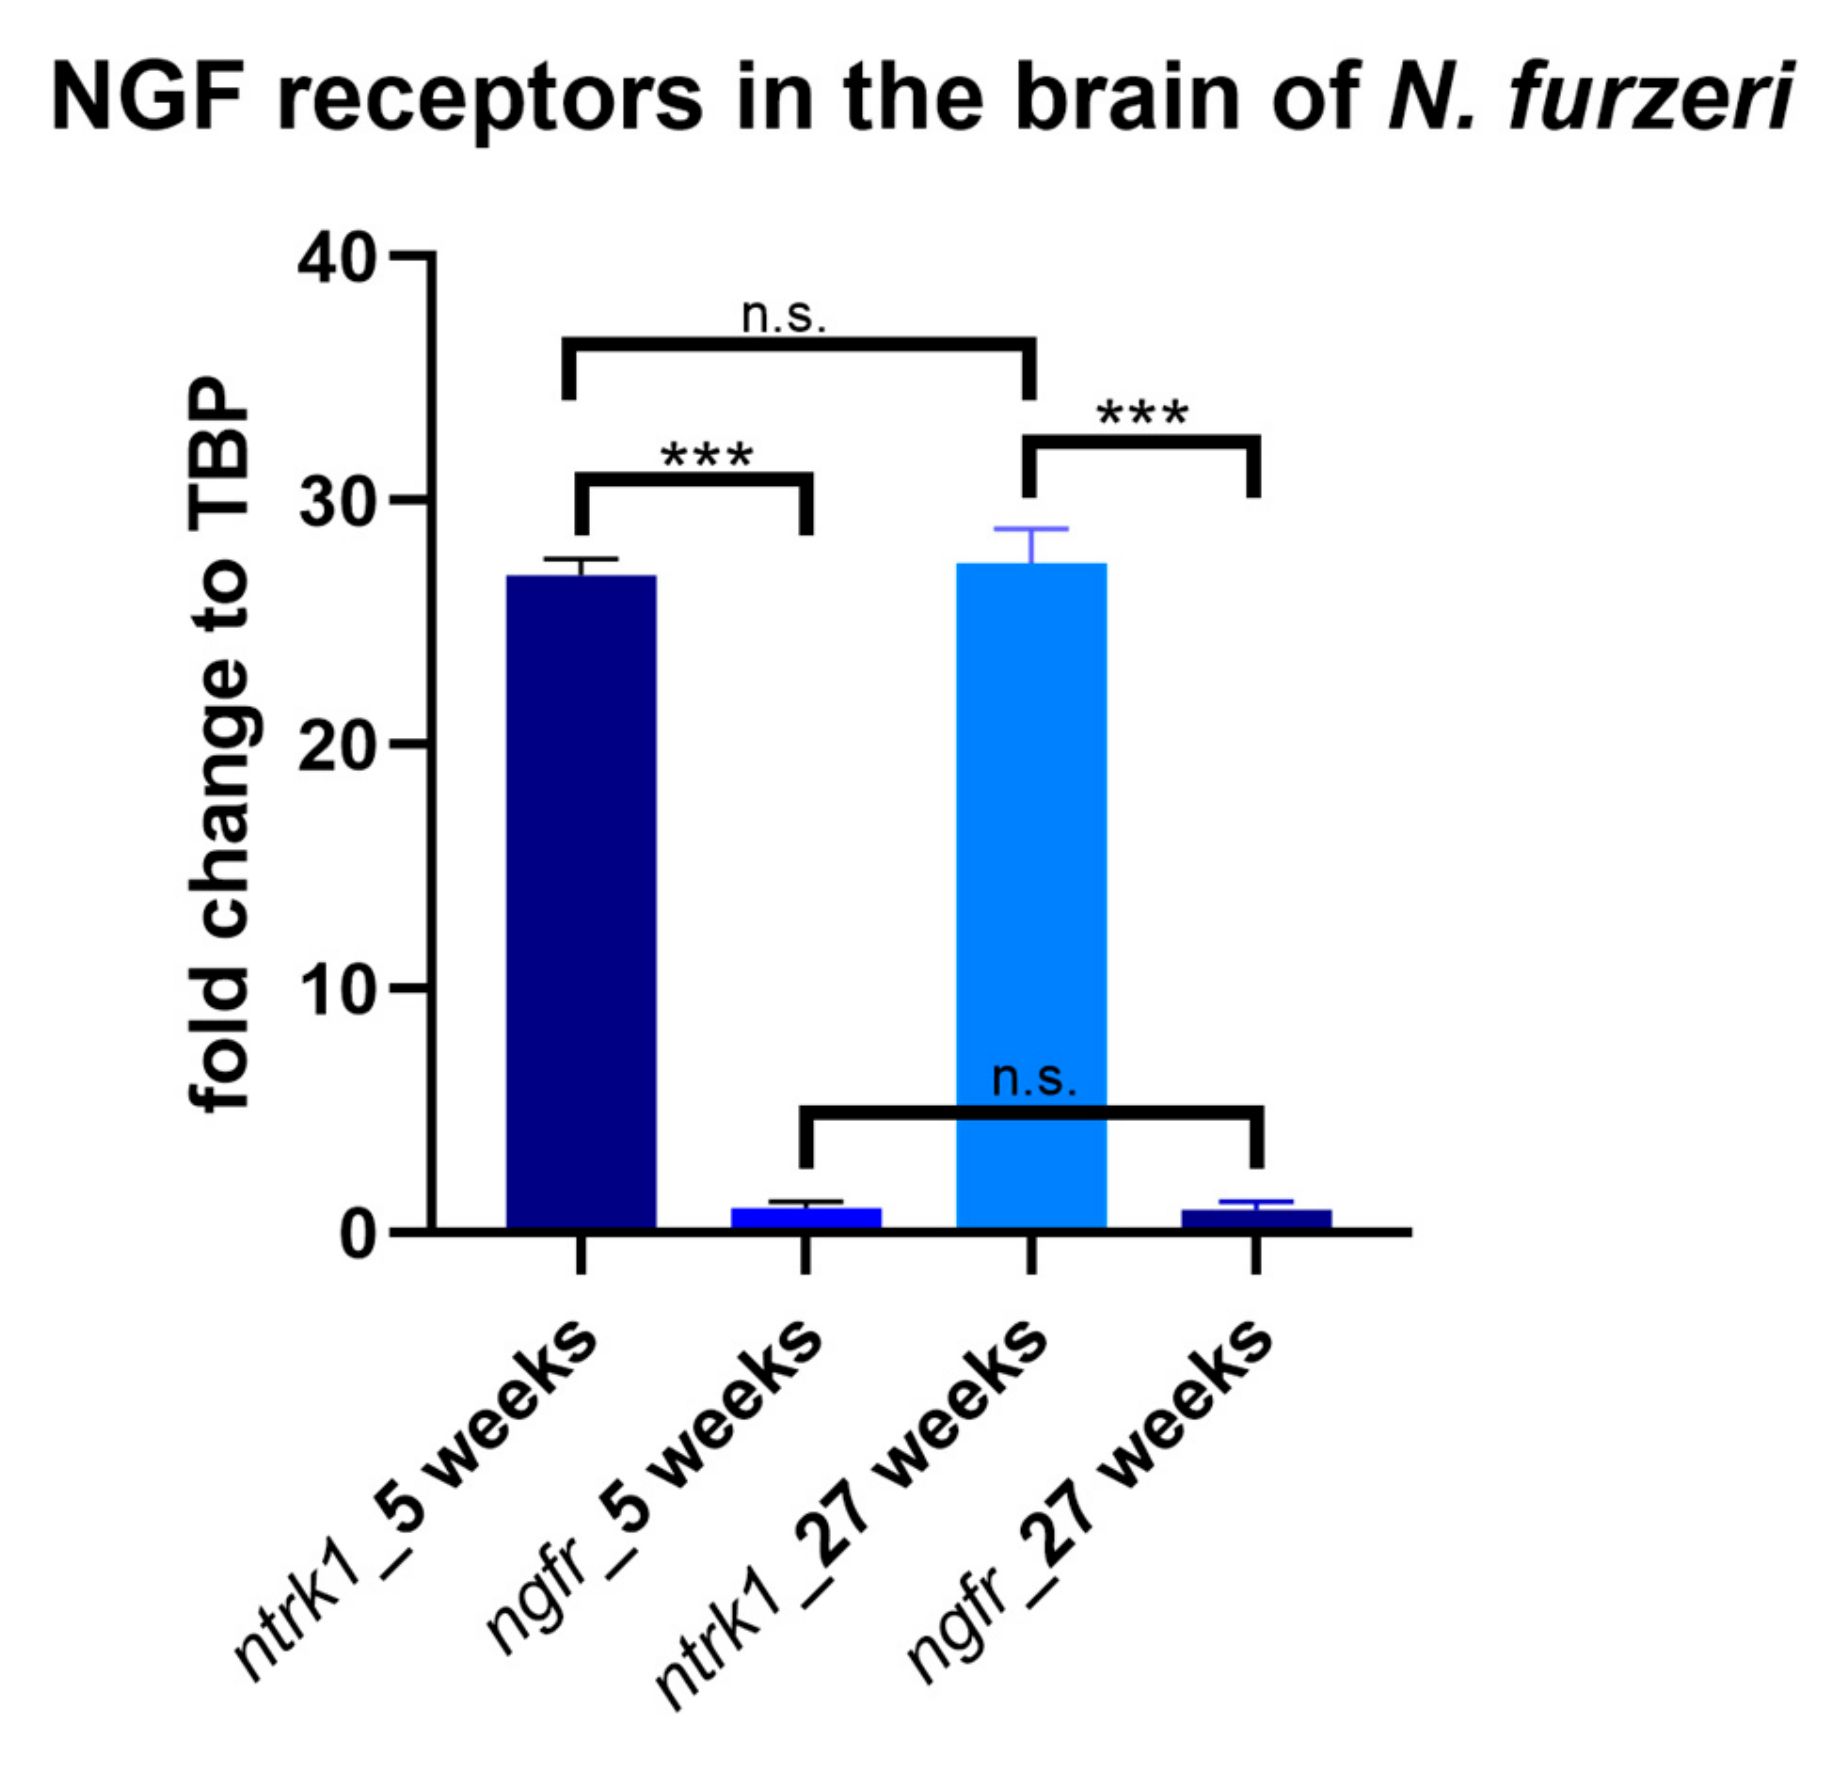
3.2. Age-Dependent Expression of NTRK1/NTRKA and p75/NGFR in the Brain of N. furzeri

NTRK1/NTRKA and p75/NGFR mRNAs are both expressed in the brain of N. furzeri with differences in their expression levels. Quantitative measurements revealed that either NTRK1/NTRKA and p75/NGFR display unchanged expression levels in the brain at 5 and 27 weeks post hatching (NTRK1/NTRKA p value = 0.27; p75/NGFR p value = 0.54; Figure 4). A statistically significant difference was observed between the expression levels of NTRK1/NTRKA and p75/NGFR at 5 weeks (p value ≤ 0.0001) and at 27 weeks (p value ≤ 0.0001); Figure 4). We furthermore observed a positive linear correlation between the two NGF receptors, at the two age stages examined (5 weeks r = 0.9986; 27 weeks r = 0.9946).
The quantitative measurements matched with our morphological observations, with NTRK1/NTRKA more abundantly expressed in the brain of N. furzeri compared to p75/NGFR, either at young and old stages. The sense probe for NTRK1/NTRKA is shown in Figure S1.
In the forebrain, NTRK1/NTRKA expressing neurons were observed in the caudal telencephalon, pretectal nucleus, anterior and lateral (Figure 5A,A1) thalamic nuclei of young animals, and in the ventral zone of the telencephalon (Figure 5B,B1) of old animals. More caudally, positive neurons were observed in the diffuse inferior lobe of hypothalamus at the two age stages analyzed. In the midbrain, numerous positive cells were observed in the periventricular gray zone of the OT and very few sparse cells in the more superficial layers of young and old animals (Figure 5C,D). Very faint signal probe was observed in the semicircular tori of the tegmentum and lateral nucleus of cerebellar valvular in the young animals. Caudally, in the hindbrain neurons expressing NTRK1/NTRKA were observed in the vagal lobe, along the caudal part of the rhomboencephalic ventricle and dispersed in the caudal reticular formation (Figure 5E) of young animals, whereas in the brain of old animals NTRK1/NTRKA mRNA expression was faintly observed along the ventricle and in the reticular formation (Figure 5F).
The expression of p75/NGFR mRNA was considerably less widespread compared to NTRK1/NTRKA at the two analyzed age stages.
p75/NGFR mRNA was faintly seen in the granular and molecular layers of the body of cerebellum in young animals. Both in young and old animals, intense staining was observed in neurons of the caudal reticular formation in the medulla oblongata, around the caudal part of ventricle/anterior margin of ependymal canal (Figure 6A,A1,B) and in the vagal lobe (Figure 6B,B1).

3.3. NTRK1/NTRKA and p75/NGFR Are Not Colocalized with ChaT

We then conducted a combined in situ hybridization and immunohistochemistry to evaluate whether NTRK1/NTRKA and p75/NGFR expressing neurons showed co-localization with ChaT neurons in the adult or their neuronal projections. Any neuronal co-staining was observed between NTRK1/NTRKA and ChaT nor p75/NGFR and ChaT in the adult brain of N. furzeri. Only few cholinergic fibers appear to contact some labeled NTRK1/NTRKA expressing neurons in the rostral reticular formation (Figure 7).

4. Discussion

In this study, we investigated the neuroanatomical organization of the cholinergic system and we questioned whether cholinergic neurons were also NTRK1/NTRKA and p75/NGFR expressing neurons in the brain of N. furzeri. Cholinergic neurons are distributed in the nervous system of all vertebrates and are involved in the control of motor functions as well as in complex cognitive functions and behaviors. Cholinergic systems are also associated to age-dependent neurodegeneration [58,59,60], also caused by an imbalance of neurotrophins and related receptors [61].

4.1. Organization of the Cholinergic System in N. furzeri

Cholinergic system organization, based on the immunodetection of choline acetyltransferase, the enzyme that catalyzes the synthesis of acetylcholine in cholinergic neurons, has been widely investigated in all vertebrates mammals [61,62,63,64,65,66,67,68,69]; birds [70,71]; reptiles [72,73,74]; amphibians [75,76] and fish [45,46,47,48,49,50,51,52,53,77,78,79,80,81]. The pattern observed in N. furzeri revealed wide neuronal projections distribution throughout the entire neuroaxis, and very few cholinergic neurons restricted to the ventral telencephalon, preoptic area and diffuse inferior lobe of hypothalamus. According to the homologies with mammals, we defined three relevant groups of cholinergic neurons in N. furzeri. (a) Ch-1: ChaT immunoreactive cells in the ventral telencephalon, considered the fish subpallium, are likely homologous to cholinergic septal neuron populations in tetrapods and represent a well-conserved cell group found in fishes, amphibians, reptiles, birds and mammals [81]; (b) Ch-2: the cholinergic cells identified in the preoptic area, also documented in other teleosts [47,48,50,53,81], correspond functionally to the mammalian basal forebrain cholinergic groups [59]; (c) Ch-3: the cholinergic cells observed in the rostral reticular nucleus, are equivalent to the pedunculopontine nucleus and dorsolateral tegmental group of mammals. In addition, we demonstrated evidence of cholinergic fibers in the olfactory bulbs, similar to zebrafish [80], but not documented in the forebrain of other fish species [81]. We observed a diffuse network of varicose ChaT-positive fibers innervating the mitral cell/glomerular layer. Finally, we found ChaT positive neurons in the diffuse inferior lobe of the hypothalamus but not in other hypothalamic regions. In many fish species, the hypothalamus is free of cholinergic cells and displays only positive neuronal projections. In zebrafish, for example, the ChaT immunopositive input to the hypothalamic orexin cluster was observed [48].

4.2. Age-Associated Regulation of Nerve Growth Factor Receptors and Comparison of Their Neuroanatomical Expression

We further investigated the age-related changes of the two nerve growth factor receptors, NTRK1/NTRKA and p75/NGFR, in the brain of the African turquoise killifish, and their co-localization in cholinergic neurons. We report that the genes encoding NTRK1/NTRKA and p75/NGFR are not duplicated in the studied model species. This makes the African turquoise killifish a powerful model for further translational studies. Available transcriptomic data on the NTRK1/NTRKA [82] document low expression levels in the brain of specimens of the long-lived strain, without age-dependent regulation, whereas p75/NGFR seems to be overexpressed in the brain of old animals. We did not observe any statistically significant age-dependent modulation neither for NTRK1/NTRKA nor p75/NGFR in the brain of N. furzeri. Our results demonstrate that there is no increase of NTRK1/NTRKA nor a decrease of p75/NGFR in the whole brain of old animals. In mammals, including humans, NTRK1/NTRKA mRNA is down-regulated in the course of aging and neurodegenerative processes [83,84,85,86]. This decreases the amount of NTRK1/NTRKA protein destined for anterograde transport to basal forebrain cholinergic neurons distal axon terminals [85]. Very interestingly, NTRK1/NTRKA protein levels are reduced in the cortex of Alzheimer’s disease patients, while many studies report no change in p75/NGFR levels [86]. Furthermore, several lines of evidence demonstrate that the levels of basal forebrain NTRK1/NTRKA are reduced with aging with a concomitant increase in the ratio of p75/NGFR to NTRK1/NTRKA expression within the basal forebrain nuclei, which may be a very powerful inducer of neuronal degeneration [87].
In the African turquoise killifish brain, NTRK1/NTRKA and p75/NGFR are expressed in the ventral telencephalon, considering the homologous of the mammalian subpallium, caudal brainstem, in the periventricular grey zone of the OT and in the diffuse inferior lobe of the hypothalamus. In the brain of old animals, we observed a decreased number of p75/NGFR expressing cells and an unaltered number of positive NTRK1/NTRKA expressing cells during aging. This pattern denotes a region-specific expression of the two nerve growth factors receptors encoding genes, when compared to the neuroanatomical distribution of the neurotrophin family ligands analyzed in the adult brain of N. furzeri [10,11,12,13] Indeed NGF, BDNF, NT-4 and NT-6 are expressed in all regions of the adult brain, although with different patterns of expression. This raises the need of further investigations to explore the physiological role of neurotrophins and their receptors in the fish brain. Of relevance, interest should be addressed first to NGF and NT-6, which are considered as the specific ligand of NTRK1/NTRKA in teleosts.
NTRK1/NTRKA and p75/NGFR have been so far studied only in the developing brain of zebrafish. The expression of NTRK1/NTRKA appears 24 h post fertilization in the two domains of the cranial nerve ganglia flanking the hindbrain, in the spinal cord and in the rostral hindbrain [19]. p75/NGFR was expressed in the same cell populations as in mammals: in the cells of the ventral basal forebrain, in the midbrain and hindbrain nuclei, in cranial ganglia, in the region of the locus coeruleus, and in dorsal root ganglia. It was also detected at lower levels in the retina [38].

4.3. Nerve Growth Factor Receptors Are Not Expressed in Cholinergic Neurons of the Adult Brain of N. furzeri

Differently from the mammalian evidences, we were not able to observe any neuronal co-staining of NTRK1/NTRKA/ChaT nor p75/NGFR/ChaT. We observed some faint co-localization between ChaT neuronal projections and ntrk1 expressing neurons, suggesting that cholinergic fibers contact NTRK1/NTRKA neurons. Neurotrophins and their receptors, along with the cholinergic system, represent an excellent example of conserved molecules throughout evolution, both at structural and physiological levels. However, it is likely that, due to the evolutionary history, killifish have evolved differentiated features of certain neuronal mechanisms. Notably, our results were mainly based on morphological observations, therefore we are designing in vivo experiments to better understand the physiological interactions between cholinergic system and neurotrophins in the brain of fish, as well as their roles during vertebrate aging.

5. Conclusions

Our results confirm that NGF receptors are evolutionary conserved in the African turquoise killifish, genes encoding NTRK1/NTRKA and p75/NGFR are not duplicate. Interestingly NTRK1/NTRKA is more abundantly expressed in the brain of young and old animals compared to p75/NGFR, but none of the two receptors is expressed in cholinergic neurons. This observation represents a novelty and crucial difference with reports from mammals, and more appropriate future studies are necessary to address this aspect.

Supplementary Materials

The following are available online at https://www.mdpi.com/2076-3425/10/6/394/s1, Figure S1: Sense and antisense probe showing absence of signal in sense probe.

Author Contributions

Conceptualization, P.d.G. and L.D.; Data curation, L.D.; Formal analysis, C.A.; Funding acquisition, P.d.G. and L.D.; Investigation, L.D.; Methodology, A.L. and A.P.; Project administration, P.d.G.; Resources, P.d.G.; Software, L.D.; Supervision, L.D.; Validation, P.d.G., C.L. and L.D.; Visualization, A.L.; Writing—original draft, C.A. and L.D.; Writing—review and editing, P.d.G., Carla Lucini and L.D. All authors have read and agreed to the published version of the manuscript.

Funding

This research was funded by Italian Association of Veterinary Morphologists. “The APC was funded by L.D.”.

Acknowledgments

Authors are grateful to Antonio Calamo for technical assistance.

Conflicts of Interest

The authors declare no conflict of interest.

References

  1. D’Angelo, L.; Lossi, L.; Merighi, A.; de Girolamo, P. Anatomical features for the adequate choice of experimental animal models in biomedicine: I. Fishes. Ann. Anat. 2016, 205, 75–84. [Google Scholar] [CrossRef]
  2. Fontana, B.D.; Mezzomo, N.J.; Kalueff, A.V.; Rosemberg, D.B. The developing utility of zebrafish models of neurological and neuropsychiatric disorders: A critical review. Exp. Neurol. 2018, 299, 157–171. [Google Scholar] [CrossRef]
  3. Kalueff, A.V.; Stewart, A.M.; Gerlai, R. Zebrafish as an emerging model for studying complex brain disorders. Trends Pharmacol. Sci. 2014, 35, 63–75. [Google Scholar] [CrossRef] [PubMed] [Green Version]
  4. Tozzini, E.T.; Baumgart, M.; Battistoni, G.; Cellerino, A. Adult neurogenesis in the short-lived teleost Nothobranchius furzeri: Localization of neurogenic niches, molecular characterization and effects of aging. Aging Cell 2012, 11, 241–251. [Google Scholar] [CrossRef] [PubMed] [Green Version]
  5. Edelmann, K.; Glashauser, L.; Sprungala, S.; Hesl, B.; Fritschle, M.; Ninkovic, J.; Godinho, L.; Chapouton, P. Increased radial glia quiescence, decreased reactivation upon injury and unaltered neuroblast behavior underlie decreased neurogenesis in the aging zebrafish telencephalon. J Comp. Neurol. 2013, 521, 3099–3115. [Google Scholar] [CrossRef]
  6. Cellerino, A.; Valenzano, D.R.; Reichard, M. From the bush to the bench: The annual Nothobranchius fishes as a new model system in biology. Biol. Rev. Camb. Philos. Soc. 2016, 91, 511–533. [Google Scholar] [CrossRef] [Green Version]
  7. Kim, Y.; Nam, H.G.; Valenzano, D.R. The short-lived African turquoise killifish: An emerging experimental model for ageing. Dis. Model. Mech. 2016, 9, 115–129. [Google Scholar] [CrossRef] [PubMed] [Green Version]
  8. Baumgart, M.; Groth, M.; Priebe, S.; Savino, A.; Testa, G.; Dix, A.; Ripa, R.; Spallotta, F.; Gaetano, C.; Ori, M.; et al. RNA-seq of the aging brain in the short-lived fish N. furzeri—Conserved pathways and novel genes associated with neurogenesis. Aging Cell 2014, 13, 965–974. [Google Scholar] [CrossRef]
  9. Terzibasi Tozzini, E.; Savino, A.; Ripa, R.; Battistoni, G.; Baumgart, M.; Cellerino, A. Regulation of microRNA expression in the neuronal stem cell niches during aging of the short-lived annual fish Nothobranchius furzeri. Front. Cell. Neurosci. 2014, 8, 51. [Google Scholar] [CrossRef] [Green Version]
  10. Leggieri, A.; Attanasio, C.; Palladino, A.; Cellerino, A.; Lucini, C.; Paolucci, M.; Terzibasi Tozzini, E.; de Girolamo, P.; D’Angelo, L. Identification and Expression of Neurotrophin-6 in the Brain of Nothobranchius furzeri: One More Piece in Neurotrophin Research. J. Clin. Med. 2019, 8, 595. [Google Scholar] [CrossRef] [Green Version]
  11. D’Angelo, L.; Avallone, L.; Cellerino, A.; de Girolamo, P.; Paolucci, M.; Varricchio, E.; Lucini, C. Neurotrophin-4 in the brain of adult Nothobranchius furzeri. Ann. Anat. 2016, 207, 47–54. [Google Scholar] [CrossRef] [PubMed]
  12. D’Angelo, L.; De Girolamo, P.; Lucini, C.; Terzibasi, E.T.; Baumgart, M.; Castaldo, L.; Cellerino, A. Brain-derived neurotrophic factor: mRNA expression and protein distribution in the brain of the teleost Nothobranchius furzeri. J. Comp. Neurol. 2014, 522, 1004–1030. [Google Scholar] [CrossRef] [PubMed]
  13. D’Angelo, L.; Castaldo, L.; Cellerino, A.; de Girolamo, P.; Lucini, C. Nerve growth factor in the adult brain of a teleostean model for aging research: Nothobranchius furzeri. Ann. Anat. 2014, 196, 183–191. [Google Scholar] [CrossRef]
  14. Chao, M.V.; Rajagopal, R.; Lee, F.S. Neurotrophin signalling in health and disease. Clin. Sci. 2006, 110, 167–173. [Google Scholar] [CrossRef] [PubMed]
  15. Underwood, C.K.; Coulson, E.J. The p75 neurotrophin receptor. Int. J. Biochem. Cell Biol. 2008, 40, 1664–1668. [Google Scholar] [CrossRef]
  16. Nykjaer, A.; Willnow, T.E.; Petersen, C.M. p75NTR--live or let die. Curr. Opin. Neurobiol. 2005, 15, 49–57. [Google Scholar] [CrossRef]
  17. Benito-Gutiérrez, E.; Garcia-Fernàndez, J.; Comella, J.X. Origin and evolution of the Trk family of neurotrophic receptors. Mol. Cell. Neurosci. 2006, 31, 179–192. [Google Scholar] [CrossRef]
  18. Martin, S.C.; Marazzi, G.; Sandell, J.H.; Heinrich, G. Five Trk receptors in the zebrafish. Dev. Biol. 1995, 169, 745–758. [Google Scholar] [CrossRef] [Green Version]
  19. D’Angelo, L.; de Girolamo, P.; Cellerino, A.; Tozzini, E.T.; Castaldo, L.; Lucini, C. Neurotrophin Trk receptors in the brain of a teleost fish, Nothobranchius furzeri. Microsc. Res. Tech. 2012, 75, 81–88. [Google Scholar] [CrossRef]
  20. Gatta, C.; Altamura, G.; Avallone, L.; Castaldo, L.; Corteggio, A.; D’Angelo, L.; de Girolamo, P.; Lucini, C. Neurotrophins and their Trk-receptors in the cerebellum of zebrafish. J. Morphol. 2016, 277, 725–736. [Google Scholar] [CrossRef]
  21. Ahuja, G.; Ivandic, I.; Saltürk, M.; Oka, Y.; Nadler, W.; Korsching, S.I. Zebrafish crypt neurons project to a single, identified mediodorsal glomerulus. Sci. Rep. 2013, 3, 2063. [Google Scholar] [CrossRef] [PubMed] [Green Version]
  22. Bettini, S.; Milani, L.; Lazzari, M.; Maurizii, M.G.; Franceschini, V. Crypt cell markers in the olfactory organ of Poecilia reticulata: Analysis and comparison with the fish model Danio rerio. Brain Struct. Funct. 2017, 222, 3063–3074. [Google Scholar] [CrossRef] [PubMed]
  23. Sepahi, A.; Kraus, A.; Casadei, E.; Johnston, C.A.; Galindo-Villegas, J.; Kelly, C.; García-Moreno, D.; Muñoz, P.; Mulero, V.; Huertas, M.; et al. Olfactory sensory neurons mediate ultrarapid antiviral immune responses in a TrkA-dependent manner. Proc. Natl. Acad. Sci. USA 2019, 116, 12428–12436. [Google Scholar] [CrossRef] [PubMed] [Green Version]
  24. Klinger, M.; Diekmann, H.; Heinz, D.; Hirsch, C.; Hannbeck von Hanwehr, S.; Petrausch, B.; Oertle, T.; Schwab, M.E.; Stuermer, C.A. Identification of two nogo/rtn4 genes and analysis of Nogo-A expression in Xenopus laevis. Mol. Cell. Neurosci. 2004, 25, 205–216. [Google Scholar] [CrossRef] [Green Version]
  25. Oertle, T.; Schwab, M.E. Nogo and its paRTNers. Trends Cell Biol. 2003, 13, 187–194. [Google Scholar] [CrossRef]
  26. Catchen, J.M.; Braasch, I.; Postlethwait, J.H. Conserved synteny and the zebrafish genome. Methods Cell Biol. 2011, 104, 259–285. [Google Scholar] [CrossRef]
  27. Huber, A.B.; Weinmann, O.; Brösamle, C.; Oertle, T.; Schwab, M.E. Patterns of Nogo mRNA and protein expression in the developing and adult rat and after CNS lesions. J. Neurosci. 2002, 22, 3553–3567. [Google Scholar] [CrossRef] [Green Version]
  28. O’Neill, P.; Whalley, K.; Ferretti, P. Nogo and Nogo-66 Receptor in Human and Chick: Implications for Development and Regeneration. Dev. Dyn. 2004, 231, 109–121. [Google Scholar] [CrossRef]
  29. Fournier, A.E.; GrandPre, T.; Strittmatter, S.M. Identification of a receptor mediating Nogo-66 inhibition of axonal regeneration. Nature 2001, 409, 341–346. [Google Scholar] [CrossRef]
  30. Josephson, A.; Widenfalk, J.; Widmer, H.W.; Olson, L.; Spenger, C. NOGO mRNA Expression in Adult and Fetal Human and Rat Nervous Tissue and in Weight Drop Injury. Exp. Neurol. 2001, 169, 319–328. [Google Scholar] [CrossRef]
  31. Segal, R.A. Selectivity in neurotrophin signaling: Theme and variations. Annu. Rev. Neurosci. 2003, 26, 299–330. [Google Scholar] [CrossRef] [PubMed]
  32. Yoon, S.O.; Casaccia-Bonnefil, P.; Carter, B.; Chao, M.V. Competitive signaling between TrkA and p75 nerve growth factor receptors determines cell survival. J. Neurosci. 1998, 18, 3273–3281. [Google Scholar] [CrossRef] [PubMed] [Green Version]
  33. Epa, W.R.; Markovska, K.; Barrett, G.L. The p75 Neurotrophin Receptor Enhances TrkA Signalling by Binding to Shc and Augmenting Its Phosphorylation. J. Neurochem. 2004, 89, 344–353. [Google Scholar] [CrossRef] [PubMed]
  34. Pepeu, G.; Grazia Giovannini, M. The fate of the brain cholinergic neurons in neurodegenerative diseases. Brain Res. 2017, 1670, 173–184. [Google Scholar] [CrossRef] [PubMed]
  35. Merlio, J.P.; Ernfors, P.; Jaber, M.; Persson, H. Molecular cloning of rat trkC and distribution of cells expressing messenger RNAs for members of the trk family in the rat central nervous system. Neuroscience 1992, 51, 513–532. [Google Scholar] [CrossRef]
  36. Yeo, T.T.; Chua-Couzens, J.; Butcher, L.L.; Bredesen, D.E.; Cooper, J.D.; Valletta, J.S.; Mobley, W.C.; Longo, F.M. Absence of p75NTR Causes Increased Basal Forebrain Cholinergic Neuron Size, Choline Acetyltransferase Activity, and Target Innervation. J. Neurosci. 1997, 17, 7594–7605. [Google Scholar] [CrossRef] [Green Version]
  37. Brösamle, C.; Halpern, M.E. Nogo-Nogo receptor signalling in PNS axon outgrowth and pathfinding. Mol. Cell. Neurosci. 2009, 40, 401–409. [Google Scholar] [CrossRef]
  38. Vilar, M.; Mira, H. Regulation of Neurogenesis by Neurotrophins during Adulthood: Expected and Unexpected Roles. Front. Neurosci. 2016, 10, 26. [Google Scholar] [CrossRef] [Green Version]
  39. Frade, J.M.; López-Sánchez, N. A Novel Hypothesis for Alzheimer Disease Based on Neuronal Tetraploidy Induced by p75 (NTR). Cell Cycle 2010, 9, 1934–1941. [Google Scholar] [CrossRef]
  40. Arancio, O.; Chao, M.V. Neurotrophins, Synaptic Plasticity and Dementia. Curr. Opin. Neurobiol. 2007, 17, 325–330. [Google Scholar] [CrossRef]
  41. Dawbarn, D.; Allen, S.J. Neurotrophins and Neurodegeneration. Neuropathol. Appl. Neurobiol. 2003, 29, 211–230. [Google Scholar] [CrossRef]
  42. Eckenstein, F.; Thoenen, H. Cholinergic neurons in the rat cerebral cortex demonstrated by immunohistochemical localization of choline acetyltransferase. Neurosci. Lett. 1983, 36, 211–215. [Google Scholar] [CrossRef]
  43. Picciotto, M.R.; Higley, M.J.; Mineur, Y.S. Acetylcholine as a neuromodulator: Cholinergic signaling shapes nervous system function and behavior. Neuron 2012, 76, 116–129. [Google Scholar] [CrossRef] [PubMed] [Green Version]
  44. López, J.M.; Perlado, J.; Morona, R.; Northcutt, R.G.; González, A. Neuroanatomical organization of the cholinergic system in the central nervous system of a basal actinopterygian fish, the senegal bichir Polypterus senegalus. J. Comp. Neurol. 2013, 521, 24–49. [Google Scholar] [CrossRef] [PubMed]
  45. Giraldez-Perez, R.M.; Gaytan, S.P.; Torres, B.; Pasaro, R. Co-localization of Nitric Oxide Synthase and Choline Acetyltransferase in the Brain of the Goldfish (Carassius Auratus). J. Chem. Neuroanat. 2009, 37, 1–17. [Google Scholar] [CrossRef] [PubMed]
  46. Mueller, T.; Vernier, P.; Wullimann, M.F. The adult central nervous cholinergic system of a neurogenetic model animal, the zebrafish Danio rerio. Brain Res. 2004, 1011, 156–169. [Google Scholar] [CrossRef]
  47. Kaslin, J.; Nystedt, J.M.; Ostergård, M.; Peitsaro, N.; Panula, P. The orexin/hypocretin system in zebrafish is connected to the aminergic and cholinergic systems. J. Neurosci. 2004, 24, 2678–2689. [Google Scholar] [CrossRef] [Green Version]
  48. Clemente, D.; Porteros, A.; Weruaga, E.; Alonso, J.R.; Arenzana, F.J.; Aijón, J.; Arévalo, R. Cholinergic elements in the zebrafish central nervous system: Histochemical and immunohistochemical analysis. J. Comp. Neurol. 2004, 474, 75–107. [Google Scholar] [CrossRef]
  49. Pérez, S.E.; Yáñez, J.; Marín, O.; Anadón, R.; González, A.; Rodríguez-Moldes, I. Distribution of choline acetyltransferase (ChaT) immunoreactivity in the brain of the adult trout and tract-tracing observations on the connections of the nuclei of the isthmus. J. Comp. Neurol. 2000, 428, 450–474. [Google Scholar] [CrossRef]
  50. Molist, P.; Rodríguez-Moldes, I.; Anadón, R. Organization of catecholaminergic systems in the hypothalamus of two elasmobranch species, Raja undulata and Scyliorhinus canicula. A histofluorescence and immunohistochemical study. Brain Behav. Evol. 1993, 41, 290–302. [Google Scholar] [CrossRef]
  51. Brantley, R.K.; Bass, A.H. Cholinergic neurons in the brain of a teleost fish (Porichthys notatus) located with a monoclonal antibody to choline acetyltransferase. J. Comp. Neurol. 1988, 275, 87–105. [Google Scholar] [CrossRef]
  52. Ekström, P. Distribution of choline acetyltransferase-immunoreactive neurons in the brain of a cyprinid teleost (Phoxinus phoxinus L.). J. Comp. Neurol. 1987, 256, 494–515. [Google Scholar] [CrossRef] [PubMed]
  53. Montesano, A.; Baumgart, M.; Avallone, L.; Castaldo, L.; Lucini, C.; Tozzini, E.T.; Cellerino, A.; D’Angelo, L.; de Girolamo, P. Age-related central regulation of orexin and NPY in the short-lived African killifish Nothobranchius furzeri. J. Comp. Neurol. 2019, 527, 1508–1526. [Google Scholar] [CrossRef]
  54. De Girolamo, P.; Lucini, C. Neuropeptide Localization in Nonmammalian Vertebrates. Methods Mol. Biol. 2011, 789, 37–56. [Google Scholar] [CrossRef]
  55. D’Angelo, L. Brain atlas of an emerging teleostean model: Nothobranchius furzeri. Anat. Rec. 2013, 296, 681–691. [Google Scholar] [CrossRef]
  56. Mesulam, M.M. Behavioral neuroanatomy of cholinergic innervation in the primate cerebral cortex. EXS 1989, 57, 1–11. [Google Scholar] [CrossRef]
  57. Panula, P.; Chen, Y.C.; Priyadarshini, M.; Kudo, H.; Semenova, S.; Sundvik, M.; Sallinen, V. The comparative neuroanatomy and neurochemistry of zebrafish CNS systems of relevance to human neuropsychiatric diseases. Neurobiol. Dis. 2010, 40, 46–57. [Google Scholar] [CrossRef] [PubMed]
  58. Ray, N.J.; Bradburn, S.; Murgatroyd, C.; Toseeb, U.; Mir, P.; Kountouriotis, G.K.; Teipel, S.J.; Grothe, M.J. In vivo cholinergic basal forebrain atrophy predicts cognitive decline in de novo Parkinson’s disease. Brain 2018, 141, 165–176. [Google Scholar] [CrossRef] [PubMed] [Green Version]
  59. Teipel, S.J.; Meindl, T.; Grinberg, L.; Grothe, M.; Cantero, J.L.; Reiser, M.F.; Möller, H.J.; Heinsen, H.; Hampel, H. The cholinergic system in mild cognitive impairment and Alzheimer’s disease: An in vivo MRI and DTI study. Hum. Brain Mapp. 2011, 32, 1349–1362. [Google Scholar] [CrossRef] [PubMed] [Green Version]
  60. Allard, S.; Jacobs, M.L.; Do Carmo, S.; Cuello, A.C. Compromise of cortical proNGF maturation causes selective retrograde atrophy in cholinergic nucleus basalis neurons. Neurobiol. Aging 2018, 67, 10–20. [Google Scholar] [CrossRef]
  61. Motts, S.D.; Slusarczyk, A.S.; Sowick, C.S.; Schofield, B.R. Distribution of Cholinergic Cells in Guinea Pig Brainstem. Neuroscience 2008, 154, 186–195. [Google Scholar] [CrossRef] [Green Version]
  62. Gravett, N.; Bhagwandin, A.; Fuxe, K.; Manger, P.R. Nuclear Organization and Morphology of Cholinergic, Putative Catecholaminergic and Serotonergic Neurons in the Brain of the Rock Hyrax, Procavia Capensis. J. Chem. Neuroanat. 2009, 38, 57–74. [Google Scholar] [CrossRef] [PubMed]
  63. Varga, C.; Härtig, W.; Grosche, J.; Keijser, J.; Luiten, P.G.M.; Seeger, J.; Brauer, K.; Harkany, T. Rabbit Forebrain Cholinergic System: Morphological Characterization of Nuclei and Distribution of Cholinergic Terminals in the Cerebral Cortex and Hippocampus. J. Comp. Neurol. 2003, 460, 597–611. [Google Scholar] [CrossRef] [PubMed]
  64. Manger, P.R.; Fahringer, H.M.; Pettigrew, J.D.; Siegel, J.M. The distribution and morphological characteristics of cholinergic cells in the brain of monotremes as revealed by ChaT immunohistochemistry. Brain Behav. Evol. 2002, 60, 275–297. [Google Scholar] [CrossRef] [PubMed]
  65. Ichikawa, T.; Ajiki, K.; Matsuura, J.; Misawa, H. Localization of two cholinergic markers, choline acetyltransferase and vesicular acetylcholine transporter in the central nervous system of the rat: In situ hybridization histochemistry and immunohistochemistry. J. Chem. Neuroanat. 1997, 13, 23–39. [Google Scholar] [CrossRef]
  66. St-Jacques, R.; Gorczyca, W.; Mohr, G.; Schipper, H.M. Mapping of the Basal Forebrain Cholinergic System of the Dog: A Choline Acetyltransferase Immunohistochemical Study. J. Comp. Neurol. 1996, 366, 717–725. [Google Scholar] [CrossRef]
  67. Tago, H.; McGeer, P.L.; McGeer, E.G.; Akiyama, H.; Hersh, L.B. Distribution of choline acetyltransferase immunopositive structures in the rat brainstem. Brain Res. 1989, 495, 271–297. [Google Scholar] [CrossRef]
  68. Mufson, E.J.; Cunningham, M.G. Observations on Choline Acetyltransferase Containing Structures in the CD-1 Mouse Brain. Neurosci. Lett. 1988, 84, 7–12. [Google Scholar] [CrossRef]
  69. Mesulam, M.M.; Mufson, E.J.; Levey, A.I.; Wainer, B.H. Atlas of cholinergic neurons in the forebrain and upper brainstem of the macaque based on monoclonal choline acetyltransferase immunohistochemistry and acetylcholinesterase histochemistry. Neuroscience 1984, 12, 669–686. [Google Scholar] [CrossRef]
  70. Medina, L.; Reiner, A. Distribution of choline acetyltransferase immunoreactivity in the pigeon brain. J. Comp. Neurol. 1994, 342, 497–537. [Google Scholar] [CrossRef]
  71. Sorenson, E.M.; Parkinson, D.; Dahl, J.L.; Chiappinelli, V.A. Immunohistochemical Localization of Choline Acetyltransferase in the Chicken Mesencephalon. J. Comp. Neurol. 1989, 281, 641–657. [Google Scholar] [CrossRef] [PubMed]
  72. Powers, A.S.; Reiner, A. The distribution of cholinergic neurons in the central nervous system of turtles. Brain Behav. Evol. 1993, 41, 326–345. [Google Scholar] [CrossRef] [PubMed]
  73. Brauth, S.E.; Kitt, C.A.; Price, D.L.; Wainer, B.H. Cholinergic neurons in the telencephalon of the reptile Caiman crocodilus. Neurosci. Lett. 1985, 58, 235–240. [Google Scholar] [CrossRef]
  74. Mufson, E.J.; Desan, P.H.; Mesulam, M.M.; Wainer, B.H.; Levey, A.I. Choline acetyltransferase-like immunoreactivity in the forebrain of the red-eared pond turtle (Pseudemys scripta elegans). Brain Res. 1984, 323, 103–108. [Google Scholar] [CrossRef]
  75. González, A.; López, J.M.; Sánchez-Camacho, C.; Marín, O. Localization of choline acetyltransferase (ChaT) immunoreactivity in the brain of a caecilian amphibian, Dermophis mexicanus (Amphibia: Gymnophiona). J. Comp. Neurol. 2002, 448, 249–267. [Google Scholar] [CrossRef] [PubMed]
  76. Marín, O.; Smeets, W.J.; González, A. Distribution of Choline Acetyltransferase Immunoreactivity in the Brain of Anuran (Rana Perezi, Xenopus Laevis) and Urodele (Pleurodeles Waltl) Amphibians. J. Comp. Neurol. 1997, 382, 499–534. [Google Scholar] [CrossRef]
  77. Maruska, K.P.; Butler, J.M.; Field, K.E.; Porter, D.T. Localization of Glutamatergic, GABAergic, and Cholinergic Neurons in the Brain of the African Cichlid Fish, Astatotilapia Burtoni. J. Comp. Neurol. 2017, 525, 610–638. [Google Scholar] [CrossRef]
  78. Giraldez-Perez, R.M.; Gaytan, S.P.; Pasaro, R. Cholinergic and Nitrergic Neuronal Networks in the Goldfish Telencephalon. Acta Neurobiol. Exp. 2013, 73, 338–353. [Google Scholar] [CrossRef]
  79. Rodríguez-Moldes, I.; Molist, P.; Adrio, F.; Pombal, M.A.; Yáñez, S.E.; Mandado, M.; Marín, O.; López, J.M.; González, A.; Anadón, R. Organization of cholinergic systems in the brain of different fish groups: A comparative analysis. Brain Res. Bull. 2002, 57, 331–334. [Google Scholar] [CrossRef]
  80. Edwards, J.G.; Greig, A.; Sakata, Y.; Elkin, D.; Michel, W.C. Cholinergic Innervation of the Zebrafish Olfactory Bulb. J. Comp. Neurol. 2007, 504, 631–645. [Google Scholar] [CrossRef]
  81. Casini, A.; Vaccaro, R.; Toni, M.; Cioni, C. Distribution of Choline Acetyltransferase (ChaT) Immunoreactivity in the Brain of the Teleost Cyprinus Carpio. Eur. J. Histochem. 2018, 62, 2932. [Google Scholar] [CrossRef] [PubMed]
  82. Petzold, A.; Reichwald, K.; Groth, M.; Taudien, S.; Hartmann, N.; Priebe, S.; Shagin, D.; Englert, C.; Platzer, M. The transcript catalogue of the short-lived fish Nothobranchius furzeri provides insights into age-dependent changes of mRNA levels. BMC Genom. 2013, 14, 185. [Google Scholar] [CrossRef] [PubMed] [Green Version]
  83. Scott-Solomon, E.; Kuruvilla, R. Mechanisms of Neurotrophin Trafficking via Trk Receptors Mol. Cell. Neurosci. 2018, 91, 25–33. [Google Scholar] [CrossRef] [PubMed]
  84. Mufson, E.J.; Ma, S.Y.; Dills, J.; Cochran, E.J.; Leurgans, S.; Wuu, J.; Bennett, D.A.; Jaffar, S.; Gilmor, M.L.; Levey, A.I.; et al. Loss of basal forebrain P75(NTR) immunoreactivity in subjects with mild cognitive impairment and Alzheimer’s disease. J. Comp. Neurol. 2002, 443, 136–153. [Google Scholar] [CrossRef] [PubMed]
  85. Ginsberg, S.D.; Che, S.; Wuu, J.; Counts, S.E.; Mufson, E.J. Down regulation of trk but not p75NTR gene expression in single cholinergic basal forebrain neurons mark the progression of Alzheimer’s disease. J. Neurochem. 2006, 97, 475–487. [Google Scholar] [CrossRef] [PubMed]
  86. Counts, S.E.; Nadeem, M.; Wuu, J.; Ginsberg, S.D.; Saragovi, H.U.; Mufson, E.J. Reduction of cortical TrkA but not p75(NTR) protein in early-stage Alzheimer’s disease. Ann. Neurol. 2004, 56, 520–531. [Google Scholar] [CrossRef] [PubMed]
  87. Josephy-Hernandez, S.; Jmaeff, S.; Pirvulescu, I.; Aboulkassim, T.; Saragovi, H.U. Neurotrophin receptor agonists and antagonists as therapeutic agents: An evolving paradigm. Neurobiol. Dis. 2017, 97, 139–155. [Google Scholar] [CrossRef] [PubMed]
Figure 1. Overview of the brain of adult N. furzeri. (A) Sagittal section of the whole brain showing diffuse neuronal projections and very few groups of cholinergic nuclei. (B). Schematic view of sagittal section A showing in violet the identified groups of cholinergic nuclei (Ch-1, Ch-2 and Ch-3). Scale bar = 2.5 µm.
Brainsci 10 00394 g001
Figure 2. Forebrain and midbrain of adult N. furzeri. (A). Transverse section of the forebrain with numerous immunopositive fibers over the telencephalon and in the varicose fibers of the anterior commissure. (A1). Higher magnification of the rectangle in A showing varicose fibers of the anterior commissure. (B). Sagittal section of forebrain showing a group consisting of few positive neurons in the preoptic area in the rostral diencephalon and numerous fibers projecting toward the telencephalon. (C). Transverse section of the pretectal region and in the most rostral part of optic tect, epithalamus, thalamus and rostral part of hypothalamus depicting numerous widespread immunopositive fibers (C1). Higher magnification of the rectangle in C showing positive fibers of OT and faintly labeled cells in the ventro-lateral part of habenular nucleus. (D). Transverse section of caudal diencephalon/anterior midbrain displaying immunoreactivity to ChaT in fibers, displaced along the dorsal margin of longitudinal tori and in the posterior commissure; wide distribution of positive fibers in the whole posterior thalamic area/anterior midbrain tegmentum and posterior commissure. (D1). Higher magnification of the rectangle in D showing immunoreactivity in fibers of the deep white zone and superficial white and gray zone of OT. (E). Sagittal sections showing strong immunoreactivity in fibers of the deep white zone (resembling glomeruli) and superficial white and gray zone of OT. (F). Sagittal sections showing strong immunoreactivity in fibers of OT and ascending fibers from the pretectal region. Abbreviations: anterior commissure (Cant); central zone of dorsal telencephalon (DC); diffuse inferior lobe of hypothalamus (DIL); habenular nucleus (Ha); glomerular nucleus (NG); optic nerve (ON); optic tect (OT); layers of OT: periventricular grey zone (PGZ); deep white zone (DWZ); central zone (CZ); superficial white and gray zone (SWGZ).anterior preoptic nucleus (PPa); longitudinal tori (TL); posterior zone of ventral telencephalon (Vp); valvular of cerebellum (Va); ventral telencephalon (Vv). Scale bars = A, C, D 2.5 µm; A1, B, D1, E, F = 50 µm; C1 = 100 µm.
Brainsci 10 00394 g002
Figure 3. Midbrain and hindbrain of adult N. furzeri. (A). Transverse section of midbrain showing strongly immunoreactive fibers in the lateral and medial forebrain bundle, central griseum, ansulate commissure, cruciate tecto-bulbar tract and the most cranial part of semicircular tori projecting towards the OT. (A1). Higher magnification of rectangle in A showing ascending fibers from the tegmentum to OT. (B). Transverse section of rostral hindbrain showing a bundle of immunoreactive fibers running over the body of cerebellum and a group of few positive neurons in the rostral reticular formation. (C). Sagittal section of cerebellum showing intense immunoreactive fibers running from the valvula to the body of the cerebellum. (D). Transverse section of the hindbrain displaying a group consisting of positive neurons in the rostral reticular formation together with densely immunopositive fibers and moderately positive fibers in the ventral rhombencephalic commissure, and the caudal part of the cruciate tecto-bulbar tract, and more laterally ChaT immunoreactivity in neuronal projections from the octavolateral area running over the inner ear. (E). Transverse section of medulla oblongata at the spinal cord junction. Intensely immunopositive fibers were observed in the most caudal part of medulla oblongata, at the margin with spinal cord displaying a dense mesh of positive fibers over the entire medulla oblongata, including caudal reticular formation. Any staining was observed in the caudal part of the vagal lobe, displaced dorsally. Abbreviations: lateral forebrain bundle (llf); medial forebrain bundle (llf); semicircular tori (TS); body of cerebellum (CCe); granular eminentia of cerebellum (EG); inferior reticular formation (RI); superior reticular formation (RS); anterior part of nerve of lateral line (nALL); octavolateral nucleus (nVIII); vagal lobe (LX). Scale bars = A, B, D, E = 2.5 µm; A1, C = 100 µm.
Brainsci 10 00394 g003
Figure 4. Age-dependent expression of NTRK1/NTRKA and p75/NGFR in the brain of N. furzeri. Either NTRK1/NTRKA and p75/NGFR display unchanged expression levels between young and old stages (NTRK1/NTRKA p value = 0.27; ngfr p value = 0.54). However, comparing the expression of the two receptors, ntrk1 is significantly more expressed than p75/NGFR, in both 5 (p value ≤ 0.0001) and 27 (p value ≤ 0.0001) weeks post hatching animals. *** p value ≤ 0.0001
Brainsci 10 00394 g004
Figure 5. NTRK1/NTRKA mRNA in the brain of young and old N. furzeri. (A). Transverse section of caudal telencephalon of young animals displaying intense labeling in neurons of the lateral thalamic nucleus. (A1). Higher magnification of the rectangle in A showing positive neurons of the lateral thalamic nucleus. (B). Transverse section of caudal telencephalon of old animals displaying intense labeling in neurons of the ventral zone of the telencephalon. (B1). Higher magnification of B showing positive neurons of the ventral zone of the telencephalon. (C,D) Numerous positive cells in the periventricular gray zone of the OT and very few cells in the more superficial layers of young (C) and old (D) animals. (E,F). Overview of the hindbrain of young and old animals showing ntrk1 expressing neurons in the vagal lobe, along the caudal part of the rhomboencephalic ventricle and in the caudal reticular formation of young animals, and faint labeling along the ventricle and in the reticular formation of old animals. Abbreviations: ventro-lateral thalamic nucleus (VL). Scale bars = A, B, F = 2.5 µm; B1, D, E = 50 µm; A1, C = 100 µm.
Brainsci 10 00394 g005
Figure 6. p75/NGFR mRNA in the brain of young and old N. furzeri. (A). Transverse section of medulla oblongata of young animals showing intense staining in neurons of the caudal reticular formation, around the caudal part of ventricle/anterior margin of ependymal canal. (A1) Higher magnification of rectangle in (A) depicting p75/NGFR expressing neurons located along the rhomboencephalic ventricle/rostral part of ependymal canal. (B) Transverse section of medulla oblongata of old animals showing labeling in neurons of the vagal lobe and along the ventricle. (B1) Higher magnification of rectangle in (B) depicting p75/NGFR expressing neurons in the vagal lobe. Scale bars = A, B = 2.5 µm; A1 = 50 µm; B1 = 100 µm.
Brainsci 10 00394 g006
Figure 7. Transverse section of rostral reticular formation of adult N. furzeri showing staining of NTRK1/NTRKA (red), ChaT (green) and merged. Any neuronal co-staining was observed in the merged figure, only few cholinergic fibers appeared to contact some labeled NTRK1/NTRKA neurons. Scale bar = 50 µm.
Brainsci 10 00394 g007

