The Influence of Sleep Quality, Vigilance, and Sleepiness on Driving-Related Cognitive Abilities: A Comparison between Young and Older Adults

 ,
,  ,
,  and
and 
Abstract
1. Introduction
2. Materials and Methods
2.1. Subjects
2.2. Measures
2.2.1. Sleep Quality and Sleepiness Levels Measures
- (a)
- Pittsburgh Sleep Quality Index (PSQI [74]) for assessing subjective sleep quality. The questionnaire investigates the sleep quality during the last month preceding the assessment. We used the Italian version of PSQI [75], with 19 items. The results are about partial scores in 7 sub-scales and a global score. The sub-scales measure subjective sleep quality (C1), sleep latency (C2), sleep duration (C3), habitual sleep efficiency (C4), sleep disturbances (C5), use of sleep medications (C6), daytime dysfunction (C7). Moreover, the questionnaire provides a measure of total sleep time (TST). A global score > 5 indicates a subjectively perceived scarce quality of sleep.
- (b)
- Karolinska Sleepiness Scale (KSS [76]) is a self-report measure to assess subjective levels of state-like sleepiness. The KSS is a 9-point scale (1 = extremely alert, 3 = alert, 5 = neither alert nor sleepy, 7 = sleepy—but no difficulty remaining awake, and 9 = extremely sleepy—fighting sleep). Scores on the KSS increase with longer periods of wakefulness, and it strongly correlates with the time of the day.
- (c)
- Epworth Sleepiness Scale (ESS [77]) is a self-report measure to assess subjective levels of trait-like sleepiness. The test asks to identify the probability (0 = No chance of dozing, 1 = Slight chance of dozing, 2 = Moderate chance of dozing, 3 = High chance of dozing) of falling asleep in several daily situations. Scores > 10 indicate the presence of EDS.
- (d)
- Psychomotor Vigilance Task (PVT [78]) is a behavioral measure to assess sustained attention and objective levels of sleepiness. We used a 10 min version of PC-PVT software [78] for personal computers (PCs), installed on a laptop with a Windows operating system. The main dependent variables of PVT are median PVT scores, mean of 10% of the fastest reaction times (10% fastest RTs) and mean of 10% of the slowest reaction times (10% slowest RTs). The secondary variables of PVT are the lapses (RTs > 500 ms), the false starts, and the total of invalid responses.
2.2.2. Driving-Related Cognitive Abilities
- (a)
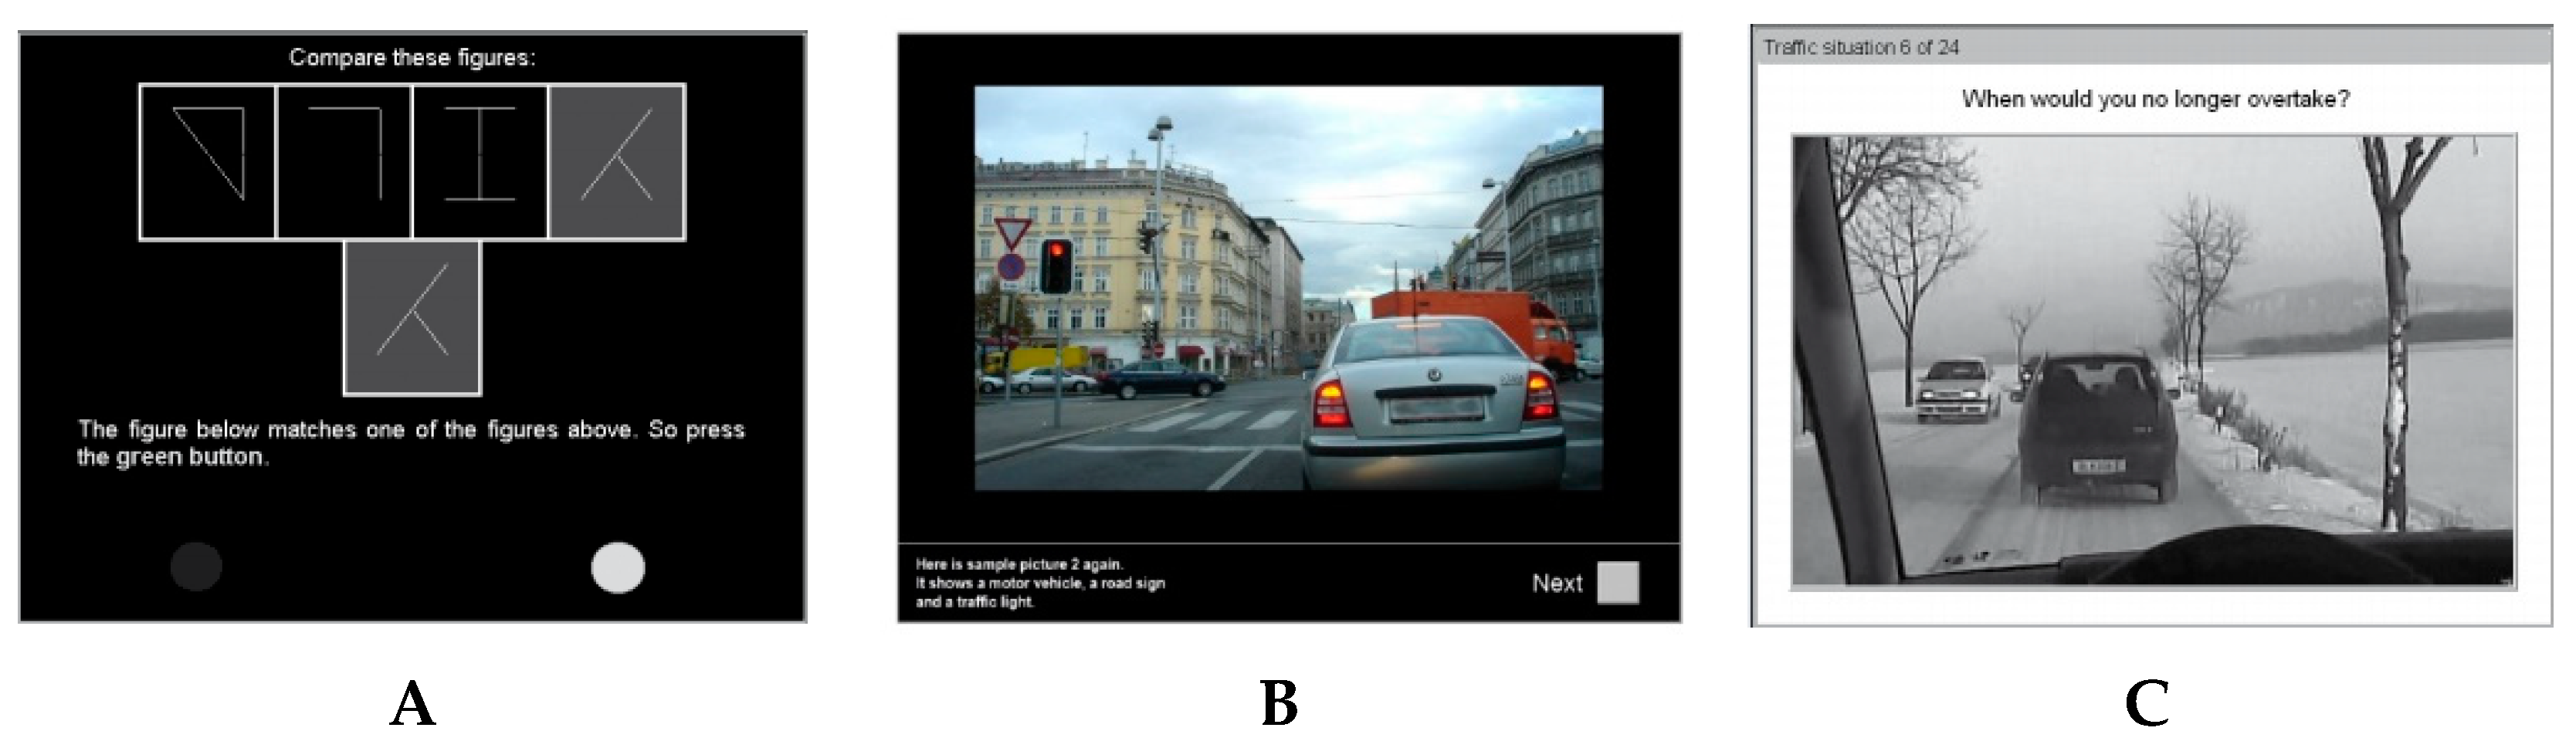
- Cognitrone (COG, Test-Set DRIVESTA). It is a selective attention assessment test that requires to compare a geometric figure with four other figures and to indicate, by pressing a button, whether among the latter there is an identical figure to the reference one (pressing the green button) or if it is not present (pressing the red button). The main dependent variable of the test is mean time of “correct rejections” (COG mean time correct rejections). This variable measures selective attention in the form of the energy required to maintain a particular level of accuracy. Since the S11 (COG/S11) version of the test was used, with flexible working time and a total of 60 items [79], the other variable of interest in the present study is the “working time” (COG total work time).
- (b)
- Adaptive Tachistoscopic Traffic Perception Test (ATAVT, Test-Set DRIVESTA) evaluates the ability to obtain an overview, the skills about visual orientation, and the perceptual speed [80,81]. In other words, “obtaining an overview” is a measure of the accuracy and speed of visual observational ability and skill in gaining an overview, and of visual orientation ability. This test provides the clearest expression of perceptual capacity and speed of perception. The test’s session has a total duration of about 10 min and requires you to report, through the appropriate console, some traffic elements in a picture (pedestrians, cars, two-wheeled vehicles, road signs, and traffic lights), which is shown for a very short time frame of 1 s. The complexity level of each item is adjusted according to an adaptive gradient, keeping in mind the performance levels shown by the subject in the previous answers. In the present study, it was used the ATAVT S1 version for use in countries in which traffic drives on the right, with the steering wheel positioned on the left. The main dependent variable is “obtaining an overview”, i.e., the overall score for the task about the performance (ATAVT performance), while the secondary variable is the “working time” (ATAVT total work time) [82].
- (c)
- Vienna Risk-Taking Test Traffic (WRB-TV, Test-Set PERSROAD). The test assesses the subjectively accepted risk levels by the subject. The test displays 24 videos, representing a specific traffic situation. Each video is shown the first time, in which the subject must only observe the situation and a second time, in which the subject must report (by pressing a green button) when he believes that carrying out a specific action has become too risky in the context of the shown situation. The subjectively accepted risk level is given by the lapse between pressing the button and the real danger. The dependent variable “readiness to take risks in traffic situations” (WRB-TV) is the mean time of the answers given in seconds [83].

2.2.3. Assessing Measures of Psychiatric Disorders and Cognitive Deterioration
- (a)
- Beck Depression Inventory-II (BDI-II [84]). It is a self-report questionnaire consisting of 21 multiple-choice questions. The items can be divided into two sub-scales, one referring to the emotional components of depression, the other to the somatic components. Each answer provides scores from 0 to 3, which positively correlate with the severity of depressive symptoms. Total scores >13 are indicative of the presence of a depressive disorder.
- (b)
- State-Trait Anxiety Inventory (STAI-Y, 1–2; [85]). It is a self-report anxiety assessment questionnaire, consisting of 40 items: 20 for the STAI-Y 1 version and 20 for the STAI-Y 2 version. The two versions evaluate state-like and trait-like anxiety. The subject is asked to indicate, choosing on a 4-point Likert scale (from nothing to very much), how much each item reflects his psycho-physical state at the time of administration. Scores ≥ 40 indicate the presence of significant anxiety levels [85].
- (c)
- Mini-Mental State Examination (MMSE [86]). It is one of the most widely used tests for the rapid screening of intellectual efficiency disorders and the presence of cognitive impairment. The MMSE is made up of 30 items, referring to seven different cognitive domains: orientation in time and space, recording of words, attention, and calculation, the reenactment of words, language, and constructive praxis. The total score (between 0 and 30) is weighted for age and schooling. Scores ≤ 24 indicate the presence of cognitive impairment.
2.3. Procedure
2.4. Data Analysis
3. Results
3.1. Age and Gender Effects
3.2. Sleep and Drowsiness Measures as Predictors of Driving-Related Abilities
4. Discussion
5. Limitations to the Study
6. Conclusions and Future Perspectives
Supplementary Materials
Author Contributions
Funding
Conflicts of Interest
References
- World Health Organization. Global Status Report on Road Safety; World Health Organization: Geneva, Switzerland, 2015. [Google Scholar]
- Maycock, G. Sleepiness and driving: The experience of UK car drivers. Accid. Anal. Prev. 1997, 29, 453–462. [Google Scholar] [CrossRef]
- Philip, P.; Vervialle, F.; Le Breton, P.; Taillard, J.; Horne, J.A. Fatigue, alcohol, and serious road crashes in France: Factorial study of national data. BMJ 2001, 322, 829–830. [Google Scholar] [CrossRef] [PubMed]
- Radun, I.; Summala, H. Sleep-related fatal vehicle accidents: Characteristics of decisions made by multidisciplinary investigation teams. Sleep 2004, 27, 224–227. [Google Scholar] [CrossRef] [PubMed]
- Verwey, W.B.; Zaidel, D.M. Preventing drowsiness accidents by an alertness maintenance device. Accid. Anal. Prev. 1999, 31, 199–211. [Google Scholar] [CrossRef]
- Moradi, A.; Nazari, S.S.H.; Rahmani, K. Sleepiness and the risk of road traffic accidents: A systematic review and meta-analysis of previous studies. Transp. Res. Part. F Traffic. Psychol. Behav. 2018, 65, 620–629. [Google Scholar] [CrossRef]
- Garbarino, S.; Durando, P.; Guglielmi, O.; Dini, G.; Bersi, F.; Fornarino, S.; Toletone, A.; Chiorri, C.; Magnavita, N. Sleep apnea, sleep debt and daytime sleepiness are independently associated with road accidents. A cross-sectional study on truck drivers. PLoS ONE 2016, 11, e0166262. [Google Scholar] [CrossRef]
- Garbarino, S.; Lino, N.; Beelke, M.; Carli, F.D.; Ferrillo, F. The contributing role of sleepiness in highway vehicle accidents. Sleep 2001, 24, 201–206. [Google Scholar] [CrossRef]
- Dernocoeur, K. Asleep at the wheel. Emerg. Med. Serv. 2000, 29, 32. [Google Scholar] [CrossRef]
- Mahowald, M.W.; Bornemann, M.A. Drowsiness and driving–a dangerous duo. Minn Med. 2006, 89, 32–34. [Google Scholar]
- Lara, T.; Madrid, J.A.; Correa, Á. The vigilance decrement in executive function is attenuated when individual chronotypes perform at their optimal time of day. PLoS ONE 2014, 9, e88820. [Google Scholar] [CrossRef]
- Doran, S.M.; Van Dongen, H.P.A.; Dinges, D.F. Sustained attention performance during sleep deprivation: Evidence of state instability. Arch. Ital. Biol. 2001, 139, 253–267. [Google Scholar] [CrossRef] [PubMed]
- Beaumont, M.; Batejat, D.; Pierard, C.; Coste, O.; Doireau, P.; Van Beers, P.; Chauffard, F.; Chassard, F.; Chassard, D.; Enslen, M.; et al. Slow release caffeine and prolonged (64-h) continuous wakefulness: Effects on vigilance and cognitive performance. J. Sleep Res. 2001, 10, 265–276. [Google Scholar] [CrossRef] [PubMed]
- Pilcher, J.J.; Huffcutt, A.I. Effects of sleep deprivation on performance: A meta-analysis. Sleep 1996, 19, 318–326. [Google Scholar] [CrossRef] [PubMed]
- Smith, M.E.; McEvoy, L.K.; Gevins, A. The impact of moderate sleep loss on neurophysiologic signals during working-memory task performance. Sleep 2002, 25, 56–66. [Google Scholar] [CrossRef]
- Hockey, G.R.J.; Wastell, D.G.; Sauer, J. Effects of sleep deprivation and user interface on complex performance: A multilevel analysis of compensatory control. Hum. Factors 1998, 40, 233–253. [Google Scholar] [CrossRef]
- Borbély, A.A. A two process model of sleep regulation. Hum. Neurobiol. 1982, 1, 195–204. [Google Scholar]
- Borbély, A.A.; Daan, S.; Wirz-Justice, A.; Deboer, T. The two-process model of sleep regulation: A reappraisal. J. Sleep Res. 2016, 25, 131–143. [Google Scholar] [CrossRef]
- Mander, B.A.; Winer, J.R.; Walker, M.P. Sleep and human aging. Neuron 2017, 94, 19–36. [Google Scholar] [CrossRef]
- Floyd, J.A.; Medler, S.M.; Ager, J.W.; Janisse, J.J. Age-related Changes in Initiation and Maintenance of Sleep: A Meta-Analysis. Res. Nurs. Health 2000, 23, 106–117. [Google Scholar] [CrossRef]
- Scarpelli, S.; D’Atri, A.; Bartolacci, C.; Mangiaruga, A.; Gorgoni, M.; De Gennaro, L. Oscillatory EEG activity during REM sleep in elderly people predicts subsequent dream recall after awakenings. Front. Neurosci 2019, 10, 985. [Google Scholar] [CrossRef]
- Scarpelli, S.; Bartolacci, C.; D’Atri, A.; Gorgoni, M.; De Gennaro, L. Mental Sleep Activity and Disturbing Dreams in the Lifespan. Int. J. Environ. Res. Public Health 2019, 16, 3658. [Google Scholar] [CrossRef] [PubMed]
- Carrier, J.; Land, S.; Buysse, D.J.; Kupfer, D.J.; Monk, T.H. The effects of age and gender on sleep EEG power spectral density in the middle years of life (ages 20–60 years old). Psychophysiology 2001, 38, 232–242. [Google Scholar] [CrossRef] [PubMed]
- Ehlers, C.L.; Kupfer, D.J. Effects of age on delta and REM sleep parameters. Electroencephalogr. Clin. Neurophysiol. 1989, 72, 118–125. [Google Scholar] [CrossRef]
- Feinberg, I.; Campbell, I.G. Kinetics of non-rapid eye movement delta production across sleep and waking in young and elderly normal subjects: Theoretical implications. Sleep 2003, 26, 192–200. [Google Scholar] [CrossRef]
- Landolt, H.P.; Dijk, D.J.; Achermann, P.; Borbély, A.A. Effect of age on the sleep EEG: Slow-wave activity and spindle frequency activity in young and middle-aged men. Brain Res. 1996, 738, 205–212. [Google Scholar] [CrossRef]
- Mourtazaev, M.S.; Kemp, B.; Zwinderman, A.H.; Kamphuisen, H.A.C. Age and gender affect different characteristics of slow waves in the sleep EEG. Sleep 1995, 18, 557–564. [Google Scholar] [CrossRef]
- Crowley, K.; Trinder, J.; Colrain, I.M. An examination of evoked K-complex amplitude and frequency of occurrence in the elderly. J. Sleep Res. 2002, 11, 129–140. [Google Scholar] [CrossRef]
- Crowley, K.; Trinder, J.; Kim, Y.; Carrington, M.; Colrain, I.M. The effects of normal aging on sleep spindle and K-complex production. Clin. Neurophysiol. 2002, 113, 1615–1622. [Google Scholar] [CrossRef]
- Kubicki, S.; Scheuler, W.; Jobert, M.; Pastelak-Price, C. The effect of age on sleep spindle and K complex density. EEG-EMG Zeitschrift fur Elektroenzephalographie, Elektromyographie und verwandte. Gebiete 1989, 20, 59–63. [Google Scholar]
- Crowley, K.E.; Colrain, I.M. A review of the evidence for P2 being an independent component process: Age, sleep and modality. Clin. Neurophysiol. 2004, 115, 732–744. [Google Scholar] [CrossRef]
- De Gennaro, L.; Gorgoni, M.; Reda, F.; Lauri, G.; Truglia, I.; Cordone, S.; Scarpelli, S.; Mangiaruga, A.; D’Atri, A.; Lacidogna, G.; et al. The fall of sleep K-complex in Alzheimer disease. Sci. Rep. 2017, 7, 1–9. [Google Scholar] [CrossRef] [PubMed]
- Reda, F.; Gorgoni, M.; Lauri, G.; Truglia, I.; Cordone, S.; Scarpelli, S.; Mangiaruga, A.; D’Atri, A.; Ferrara, M.; Lacidogna, G.; et al. In search of sleep biomarkers of Alzheimer’s disease: K-complexes do not discriminate between patients with mild cognitive impairment and healthy controls. Brain Sci. 2017, 7, 51. [Google Scholar] [CrossRef] [PubMed]
- Mander, B.A.; Rao, V.; Lu, B.; Saletin, J.M.; Ancoli-Israel, S.; Jagust, W.J.; Walker, M.P. Impaired prefrontal sleep spindle regulation of hippocampal- dependent learning in older adults. Cereb Cortex 2014, 24, 3301–3309. [Google Scholar] [CrossRef] [PubMed]
- Martin, N.; Lafortune, M.; Godbout, J.; Barakat, M.; Robillard, R.; Poirier, G.; Bastien, C.; Carrier, J. Topography of age-related changes in sleep spindles. Neurobiol. Aging 2013, 34, 468–476. [Google Scholar] [CrossRef] [PubMed]
- Gorgoni, M.; Lauri, G.; Truglia, I.; Cordone, S.; Sarasso, S.; Scarpelli, S.; Mangiaruga, A.; D’Atri, A.; Tempesta, D.; Ferrara, M.; et al. Parietal fast sleep spindle density decrease in Alzheimer’s disease and amnesic mild cognitive impairment. Neural Plast. 2016. [Google Scholar] [CrossRef]
- Larsen, L.H.; Moe, K.E.; Vitiello, M.V.; Prinz, P.N. Age trends in the sleep EEG of healthy older men and women. J. Sleep Res. 1995, 4, 160–172. [Google Scholar] [CrossRef]
- Redline, S.; Kirchner, H.L.; Quan, S.F.; Gottlieb, D.J.; Kapur, V.; Newman, A. The effects of age, sex, ethnicity, and sleep-disordered breathing on sleep architecture. Arch. Intern. Med. 2004, 164, 406–418. [Google Scholar] [CrossRef] [PubMed]
- Ohayon, M.M.; Carskadon, M.A.; Guilleminault, C.; Vitiello, M.V. Meta-analysis of quantitative sleep parameters from childhood to old age in healthy individuals: Developing normative sleep values across the human lifespan. Sleep 2004, 27, 1255–1273. [Google Scholar] [CrossRef]
- Reynolds, C.F., III; Kupfer, D.J.; Hoch, C.C.; Stack, J.A.; Houck, P.R.; Berman, S.R. Sleep deprivation in healthy elderly men and women: Effects on mood and on sleep during recovery. Sleep 1986, 9, 492–501. [Google Scholar] [CrossRef]
- Vitiello, M.V.; Larsen, L.H.; Moe, K.E. Age-related sleep change: Gender and estrogen effects on the subjective–objective sleep quality relationships of healthy, noncomplaining older men and women. J. Psychosom. Res. 2004, 56, 503–510. [Google Scholar] [CrossRef]
- Carskadon, M.A.; Van den Hoed, J.; Dement, W.C. Sleep and daytime sleepiness in the elderly. J. Geriatr. Psychiatry 1980, 13, 135–151. [Google Scholar] [PubMed]
- Carskadon, M.A.; Dement, W.C. The multiple sleep latency test: What does it measure? Sleep 1982, 5, S67–S72. [Google Scholar] [CrossRef] [PubMed]
- Jaussent, I.; Bouyer, J.; Ancelin, M.L.; Akbaraly, T.; Peres, K.; Ritchie, K.; Besset, A.; Dauvilliers, Y. Insomnia and daytime sleepiness are risk factors for depressive symptoms in the elderly. Sleep 2011, 34, 1103–1110. [Google Scholar] [CrossRef] [PubMed]
- Jaussent, I.; Morin, C.M.; Ivers, H.; Dauvilliers, Y. Incidence, worsening and risk factors of daytime sleepiness in a population-based 5-year longitudinal study. Sci Rep. 2017, 7, 1372. [Google Scholar] [CrossRef]
- Ohayon, M.M. Determining the level of sleepiness in the American population and its correlates. J. Psychiatr. Res. 2012, 46, 422–427. [Google Scholar] [CrossRef]
- Joo, S.; Baik, I.; Yi, H.; Jung, K.; Kim, J.; Shin, C. Prevalence of excessive daytime sleepiness and associated factors in the adult population of Korea. Sleep Med. 2009, 10, 182–188. [Google Scholar] [CrossRef]
- Tsuno, N.; Jaussent, I.; Dauvilliers, Y.; Touchon, J.; Ritchie, K.; Besset, A. Determinants of excessive daytime sleepiness in a French community-dwelling elderly population. J. Sleep Res. 2007, 16, 364–371. [Google Scholar] [CrossRef]
- Klink, M.; Quan, S.F. Prevalence of reported sleep disturbances in a general adult population and their relationship to obstructive airways diseases. Chest 1987, 91, 540–546. [Google Scholar] [CrossRef]
- Pallesen, S.; Nordhus, I.H.; Omvik, S.; Sivertsen, B.; Tell, G.S.; Bjorvatn, B. Prevalence and risk factors of subjective sleepiness in the general adult population. Sleep 2007, 30, 619–624. [Google Scholar] [CrossRef]
- Ancoli-Israel, S.; Cooke, J.R. Prevalence and comorbidity of insomnia and effect on functioning in elderly populations. J. Am. Geriatr. Soc. 2005, 53, S264–S271. [Google Scholar] [CrossRef]
- Hara, C.; Rocha, F.L.; Lima-Costa, M.F.F. Prevalence of excessive daytime sleepiness and associated factors in a Brazilian community: The Bambuí study. Sleep Med. 2004, 5, 31–36. [Google Scholar] [CrossRef] [PubMed]
- Hayley, A.C.; Williams, L.J.; Kennedy, G.A.; Berk, M.; Brennan, S.L.; Pasco, J.A. Prevalence of excessive daytime sleepiness in a sample of the Australian adult population. Sleep Med. 2014, 15, 348–354. [Google Scholar] [CrossRef] [PubMed]
- Young, T.B. Epidemiology of daytime sleepiness: Definitions, symptomatology, and prevalence. J. Clin. Psychiatry 2004, 65, 12–16. [Google Scholar] [PubMed]
- Foley, D.J.; Vitiello, M.V.; Bliwise, D.L.; Ancoli-Israel, S.; Monjan, A.A.; Walsh, J.K. Frequent napping is associated with excessive daytime sleepiness, depression, pain, and nocturia in older adults: Findings from the National Sleep Foundation ‘2003 Sleep in America’Poll. Am. J. Geriatr Psychiatry 2007, 15, 344–350. [Google Scholar] [CrossRef] [PubMed]
- Whitney, C.W.; Enright, P.L.; Newman, A.B.; Bonekat, W.; Foley, D.; Quan, S.F. Correlates of daytime sleepiness in 4578 elderly persons: The Cardiovascular Health Study. Sleep 1998, 21, 27–36. [Google Scholar] [CrossRef] [PubMed]
- Fulda, S.; Popp, R. Measurement of daytime sleepiness in the elderly. Somnologie-Schlafforschung und Schlafmedizin 2011, 15, 154. [Google Scholar] [CrossRef]
- Reynolds, C.F., III; Jennings, J.R.; Hoch, C.C.; Monk, T.H.; Berman, S.R.; Hall, F.T.; Matzzie, J.V.; Buysse, D.J.; Kupfer, D.J. Daytime sleepiness in the healthy “old old”: A comparison with young adults. J. Am. Geriatr. Soc. 1991, 39, 957–962. [Google Scholar] [CrossRef]
- Adam, M.; Rétey, J.V.; Khatami, R.; Landolt, H.P. Age-related changes in the time course of vigilant attention during 40 hours without sleep in men. Sleep 2006, 29, 55–57. [Google Scholar] [CrossRef]
- Duffy, J.F.; Willson, H.J.; Wang, W.; Czeisler, C.A. Healthy older adults better tolerate sleep deprivation than young adults. J. Am. Geriatr. Soc. 2009, 57, 1245–1251. [Google Scholar] [CrossRef]
- Philip, P.; Taillard, J.; Sagaspe, P.; Valtat, C.; Sanchez-Ortuno, M.; Moore, N.; Charles, A.; Bioulac, B. Age, performance and sleep deprivation. J. Sleep Res. 2004, 13, 105–110. [Google Scholar] [CrossRef]
- Blatter, K.; Graw, P.; Münch, M.; Knoblauch, V.; Wirz-Justice, A.; Cajochen, C. Gender and age differences in psychomotor vigilance performance under differential sleep pressure conditions. Behav. Brain Res. 2006, 168, 312–317. [Google Scholar] [CrossRef] [PubMed]
- Lowden, A.; Anund, A.; Kecklund, G.; Peters, B.; Åkerstedt, T. Wakefulness in young and elderly subjects driving at night in a car simulator. Accid. Anal. Prev. 2009, 41, 1001–1007. [Google Scholar] [CrossRef]
- Kecklund, G.; Akerstedt, T. Sleepiness in long distance truck driving: An ambulatory EEG study of night driving. Ergonomics 1993, 36, 1007–1017. [Google Scholar] [CrossRef] [PubMed]
- Torsvall, L.; Akerstedt, T. Sleepiness on the job: Continuously measured EEG changes in train drivers. Electroencephalogr. Clin. Neurophysiol. 1987, 66, 502–511. [Google Scholar] [CrossRef]
- Papadelis, C.; Chen, Z.; Kourtidou-Papadeli, C.; Bamidis, P.D.; Chouvarda, I.; Bekiaris, E.; Maglaveras, N. Monitoring sleepiness with on-board electrophysiological recordings for preventing sleep-deprived traffic accidents. Clin. Neurophysiol. 2007, 118, 1906–1922. [Google Scholar] [CrossRef] [PubMed]
- Merat, N.; Anttila, V.; Luoma, J. Comparing the driving performance of average and older drivers: The effect of surrogate in-vehicle information systems. Transp. Res. Part F Traffic. Psychol. Behav. 2005, 8, 147–166. [Google Scholar] [CrossRef]
- Son, J.; Lee, Y.; Kim, M.H. Impact of traffic environment and cognitive workload on older drivers’ behavior in simulated driving. Int. J. Precis. Eng. Manuf. 2011, 12, 135–141. [Google Scholar] [CrossRef]
- Schwarze, A.; Ehrenpfordt, I.; Eggert, F. Workload of younger and elderly drivers in different infrastructural situations. Transp. Res. Part F Traffic. Psychol. Behav. 2014, 26, 102–115. [Google Scholar] [CrossRef]
- Dijk, D.J.; Groeger, J.A.; Stanley, N.; Deacon, S. Age-related reduction in daytime sleep propensity and nocturnal slow wave sleep. Sleep 2010, 33, 211–223. [Google Scholar] [CrossRef]
- Klerman, E.B.; Dijk, D.J. Age-related reduction in the maximal capacity for sleep–implications for insomnia. Curr. Biol. 2008, 18, 1118–1123. [Google Scholar] [CrossRef]
- World Health Organization. World Report on Ageing and Health 2015; World Health Organization Press: Geneva, Switzerland, 2015. [Google Scholar]
- US Department of Health and Human Services; US Department of Agriculture. 2015–2020 Dietary Guidelines for Americans, 8th ed.; US Dept of Health and Human Services: Washington, DC, USA, 2015.
- Buysse, D.J.; Reynolds, C.F.; Monk, T.H.; Berman, S.R.; Kupfer, D.J. The Pittsburgh Sleep Quality Index: A new instrument for psychiatric practice and research. Psychiatry Res. 1989, 28, 193–213. [Google Scholar] [CrossRef]
- Curcio, G.; Tempesta, D.; Scarlata, S.; Marzano, C.; Moroni, F.; Rossini, P.M.; Ferrara, M.; De Gennaro, L. Validity of the Italian version of the Pittsburgh sleep quality index (PSQI). Neurol. Sci. 2013, 34, 511–519. [Google Scholar] [CrossRef]
- Åkerstedt, T.; Gillberg, M. Subjective and objective sleepiness in the active individual. Int. J. Neurosci. 1990, 52, 29–37. [Google Scholar] [CrossRef] [PubMed]
- Johns, M.W. A new method for measuring daytime sleepiness: The Epworth sleepiness scale. Sleep 1991, 14, 540–545. [Google Scholar] [CrossRef]
- Khitrov, M.Y.; Laxminarayan, S.; Thorsley, D.; Ramakrishnan, S.; Rajaraman, S.; Wesensten, N.J.; Reifman, J. PC-PVT: A platform for psychomotor vigilance task testing, analysis, and prediction. Behav. Res. Methods 2014, 46, 140–147. [Google Scholar] [CrossRef] [PubMed]
- Reulecke, W. Konzentration als trivalente Performanzvariable-theoretische Prämissen, Rastermodell und empirisches Umsetzungsbeispiel. In Konzentration und Leistung (S 63–73); Janssen, J., Hahn, E., Eds.; Hogrefe: Göttingen, Germany, 1991. [Google Scholar]
- French, J.W.; Ekstrom, R.B.; Price, L.A. Manual and Kit of Reference Tests for Cognitive Factors; Educational Testing Service: Princeton, NJ, USA, 1963. [Google Scholar]
- Carroll, J.B. Human Cognitive Abilities. A Survey of Factor-Analytic Studies; Cambridge University Press: Cambridge, UK, 1993. [Google Scholar]
- Rasch, G. Probabilistic Models for Some Intelligence and Attainment Tests; University of Chicago Press: Chicago, IL, USA, 1980. [Google Scholar]
- Hergovich, A.; Arendasy, M.E.; Sommer, M.; Bognar, B. The Vienna risk-taking test-traffic: A new measure of road traffic risk-taking. J. Individ. Differ. 2007, 28, 198–204. [Google Scholar] [CrossRef]
- Beck, A.T.; Steer, R.A.; Brown, G.K. Beck depression inventory-II. San Antonio 1996, 78, 490–498. [Google Scholar]
- Spielberger, C.D.; Gorsuch, R.L.; Lushene, R.; Vagg, P.R.; Jacobs, G.A. Manual for the State-Trait Anxiety Scale; Consulting Psychologists Press: Palo Alto, CA, USA, 1983. [Google Scholar]
- Folstein, M.F.; Robins, L.N.; Helzer, J.E. The mini-mental state examination. Arch. Gen. Psychiatry 1983, 40, 812. [Google Scholar] [CrossRef]
- Benjamini, Y.; Hochberg, Y. Controlling the false discovery rate: A practical and powerful approach to multiple testing. J. R. Stat. Soc. Ser. B 1995, 57, 289–300. [Google Scholar] [CrossRef]
- Benjamini, Y.; Yekutieli, D. The control of the false discovery rate in multiple testing under dependency. Ann. Stat. 2001, 29, 1165–1188. [Google Scholar]
- Thomann, J.; Baumann, C.R.; Landolt, H.P.; Werth, E. Psychomotor vigilance task demonstrates impaired vigilance in disorders with excessive daytime sleepiness. J. Clin. Sleep Med. 2014, 10, 1019–1024. [Google Scholar] [CrossRef] [PubMed]
- Lim, J.; Dinges, D. Sleep deprivation and vigilant attention. Ann. N. Y. Acad. Sci. 2008, 1129, 305. [Google Scholar] [CrossRef] [PubMed]
- Hershner, S.D.; Chervin, R.D. Causes and consequences of sleepiness among college students. Nat. Sci. Sleep 2014, 6, 73. [Google Scholar] [CrossRef] [PubMed]
- Zitting, K.M.; Münch, M.Y.; Cain, S.W.; Wang, W.; Wong, A.; Ronda, J.M.; Aeschbach, D.; Czeisler, C.A.; Duffy, J.F. Young adults are more vulnerable to chronic sleep deficiency and recurrent circadian disruption than older adults. Sci. Rep. 2018, 8, 11052. [Google Scholar] [CrossRef]
- Nguyen-Michel, V.H.; Lévy, P.P.; Pallanca, O.; Kinugawa, K.; Banica-Wolters, R.; Sebban, C.; Mariani, J.; Fournier, E.; Arnulf, I. Underperception of naps in older adults referred for a sleep assessment: An insomnia trait and a cognitive problem? J. Am. Geriatr Soc. 2015, 2001–2007. [Google Scholar] [CrossRef]
- Harrison, Y.; Horne, J.A.; Rothwell, A. Prefrontal neuropsychological effects of sleep deprivation in young adults–a model for healthy aging? Sleep 2000, 23, 1067–1073. [Google Scholar] [CrossRef]
- Webb, W.B. A further analysis of age and sleep deprivation effects. Psychophysiology 1985, 22, 156–161. [Google Scholar] [CrossRef]
- Webb, W.B.; Levy, C.M. Age, sleep deprivation, and performance. Psychophysiology 1982, 19, 272–276. [Google Scholar] [CrossRef]
- Kuo, T.A.; Lin, C.J.; Liu, B.S. Intelligence system for evaluation the multi-dimension abilities of occupational bus driver. In Proceedings of the 2016 International Conference on Advanced Materials for Science and Engineering (ICAMSE), Tainan, Taiwan, 12–13 November 2016; pp. 177–180. [Google Scholar]
- Winocur, G.; Hasher, L. Circadian rythms and memory in Aged Humans and Animals. In Neuropsychology of Memory, 3rd ed.; Squire, L.R., Schacter, D.L., Eds.; Guilford Publications: New York, NY, USA, 2003; pp. 273–285. [Google Scholar]
- Winocur, G.; Hasher, L. Age and time-of-day effects on learning and memory in a non-matching-to-sample test. Neurobiol. Aging. 2004, 25, 1107–1115. [Google Scholar] [CrossRef]
- Biss, R.K.; Hasher, L. Happy as a lark: Morning-type younger and older adults are higher in positive affect. Emotion 2012, 12, 437. [Google Scholar] [CrossRef]
- Wyatt, J.K.; Dijk, D.J.; Ronda, J.M.; Jewett, M.E.; Powell, J.W.; Dinges, D.F.; Czeisler, C.A. Interaction of circadian-and sleep/wake homeostatic-processes modulate psychomotor vigilance test (PVT) performance. Sleep Res. 1997, 26, 759. [Google Scholar]
- Vujanić, M.; Antić, B.; Pešić, D.; Savićević, M. Testing the psychophysical characteristics of professional drivers–Can we identify unsafe drivers? Transp. Res. Part F Traffic. Psychol. Behav. 2016, 42, 104–116. [Google Scholar] [CrossRef]
- Bachoo, S.; Bhagwanjee, A.; Govender, K. The influence of anger, impulsivity, sensation seeking and driver attitudes on risky driving behavior among post-graduate university students in Durban, South Africa. Accid. Anal. Prev. 2013, 55, 67–76. [Google Scholar] [CrossRef] [PubMed]
- Chan, D.C.N.; Wu, A.M.S.; Hung, E.P.W. Invulnerability and the intention to drink and drive: An application of the theory of planned behavior. Accid. Anal. Prev. 2010, 42, 1549–1555. [Google Scholar] [CrossRef] [PubMed]
- Kwon, M.S.; Vorobyev, V.; Moe, D.; Parkkola, R.; Hämäläinen, H. Brain structural correlates of risk-taking behavior and effects of peer influence in adolescents. PLoS ONE 2014, 9, 11. [Google Scholar] [CrossRef]
- Risser, R.; Chaloupka, C.; Grundler, W.; Sommer, M.; Häusler, J.; Kaufmann, C. Using non-linear methods to investigate the criterion validity of traffic-psychological test batteries. Accid. Anal. Prev. 2008, 40, 149–157. [Google Scholar] [CrossRef]


| Variables | Groups | F | p | ηp2 |
|---|---|---|---|---|
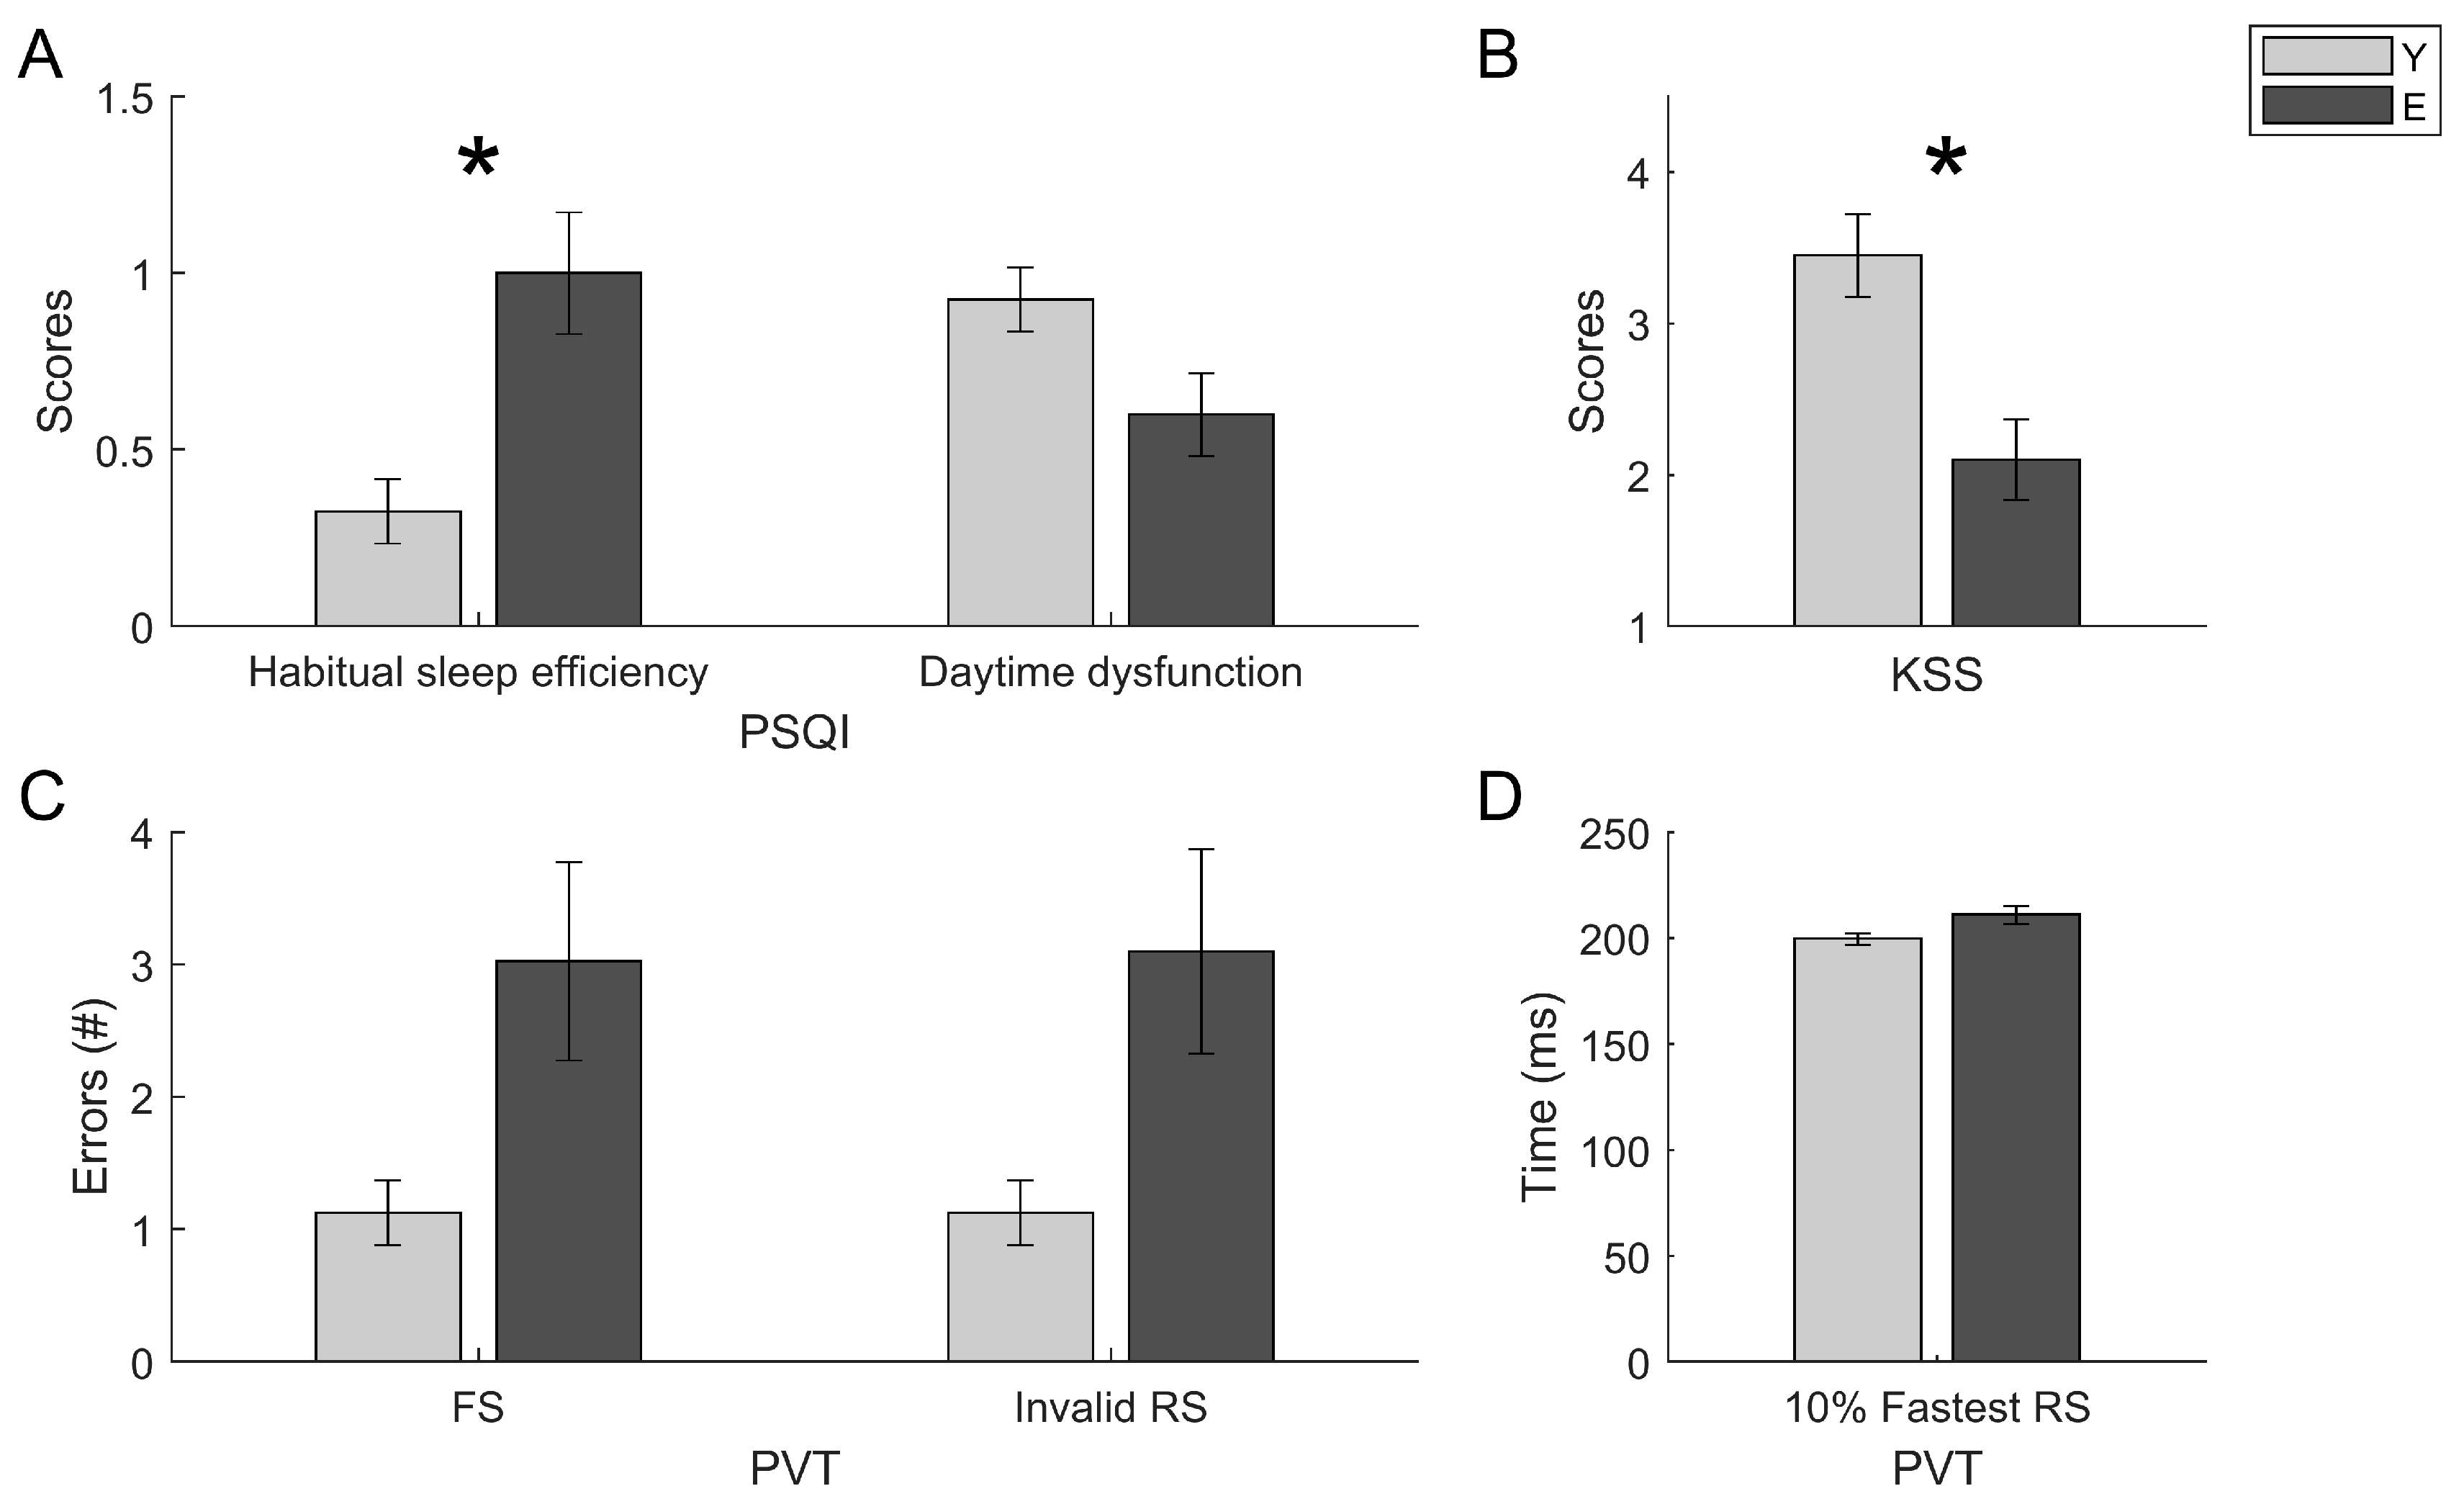
| C4 PSQI | Age | 12.144 | p < 0.001 | 0.141 |
| Gender | 0.051 | 0.822 | 0.001 | |
| Age × Gender | 0.652 | 0.412 | 0.009 | |
| C7 PSQI | Age | 4.319 | 0.041 | 0.055 |
| Gender | 1.639 | 0.206 | 0.022 | |
| Age × Gender | 0.101 | 0.752 | 0.001 | |
| KSS | Age | 10.493 | 0.001 | 0.121 |
| Gender | 0.659 | 0.419 | 0.009 | |
| Age × Gender | 3.025 | 0.086 | 0.038 | |
| False Starts PVT | Age | 5.566 | 0.021 | 0.070 |
| Gender | 0.125 | 0.724 | 0.002 | |
| Age × Gender | 0.182 | 0.67 | 0.002 | |
| Invalid Responses PVT | Age | 5.751 | 0.019 | 0.072 |
| Gender | 0.053 | 0.817 | 0.001 | |
| Age × Gender | 0.275 | 0.601 | 0.004 | |
| 10% Fastest RTs PVT | Age | 5.728 | 0.019 | 0.069 |
| Gender | 0.71 | 0.402 | 0.009 | |
| Age × Gender | 0.623 | 0.432 | 0.008 |
| Variables | Groups | F | p | ηp2 |
|---|---|---|---|---|
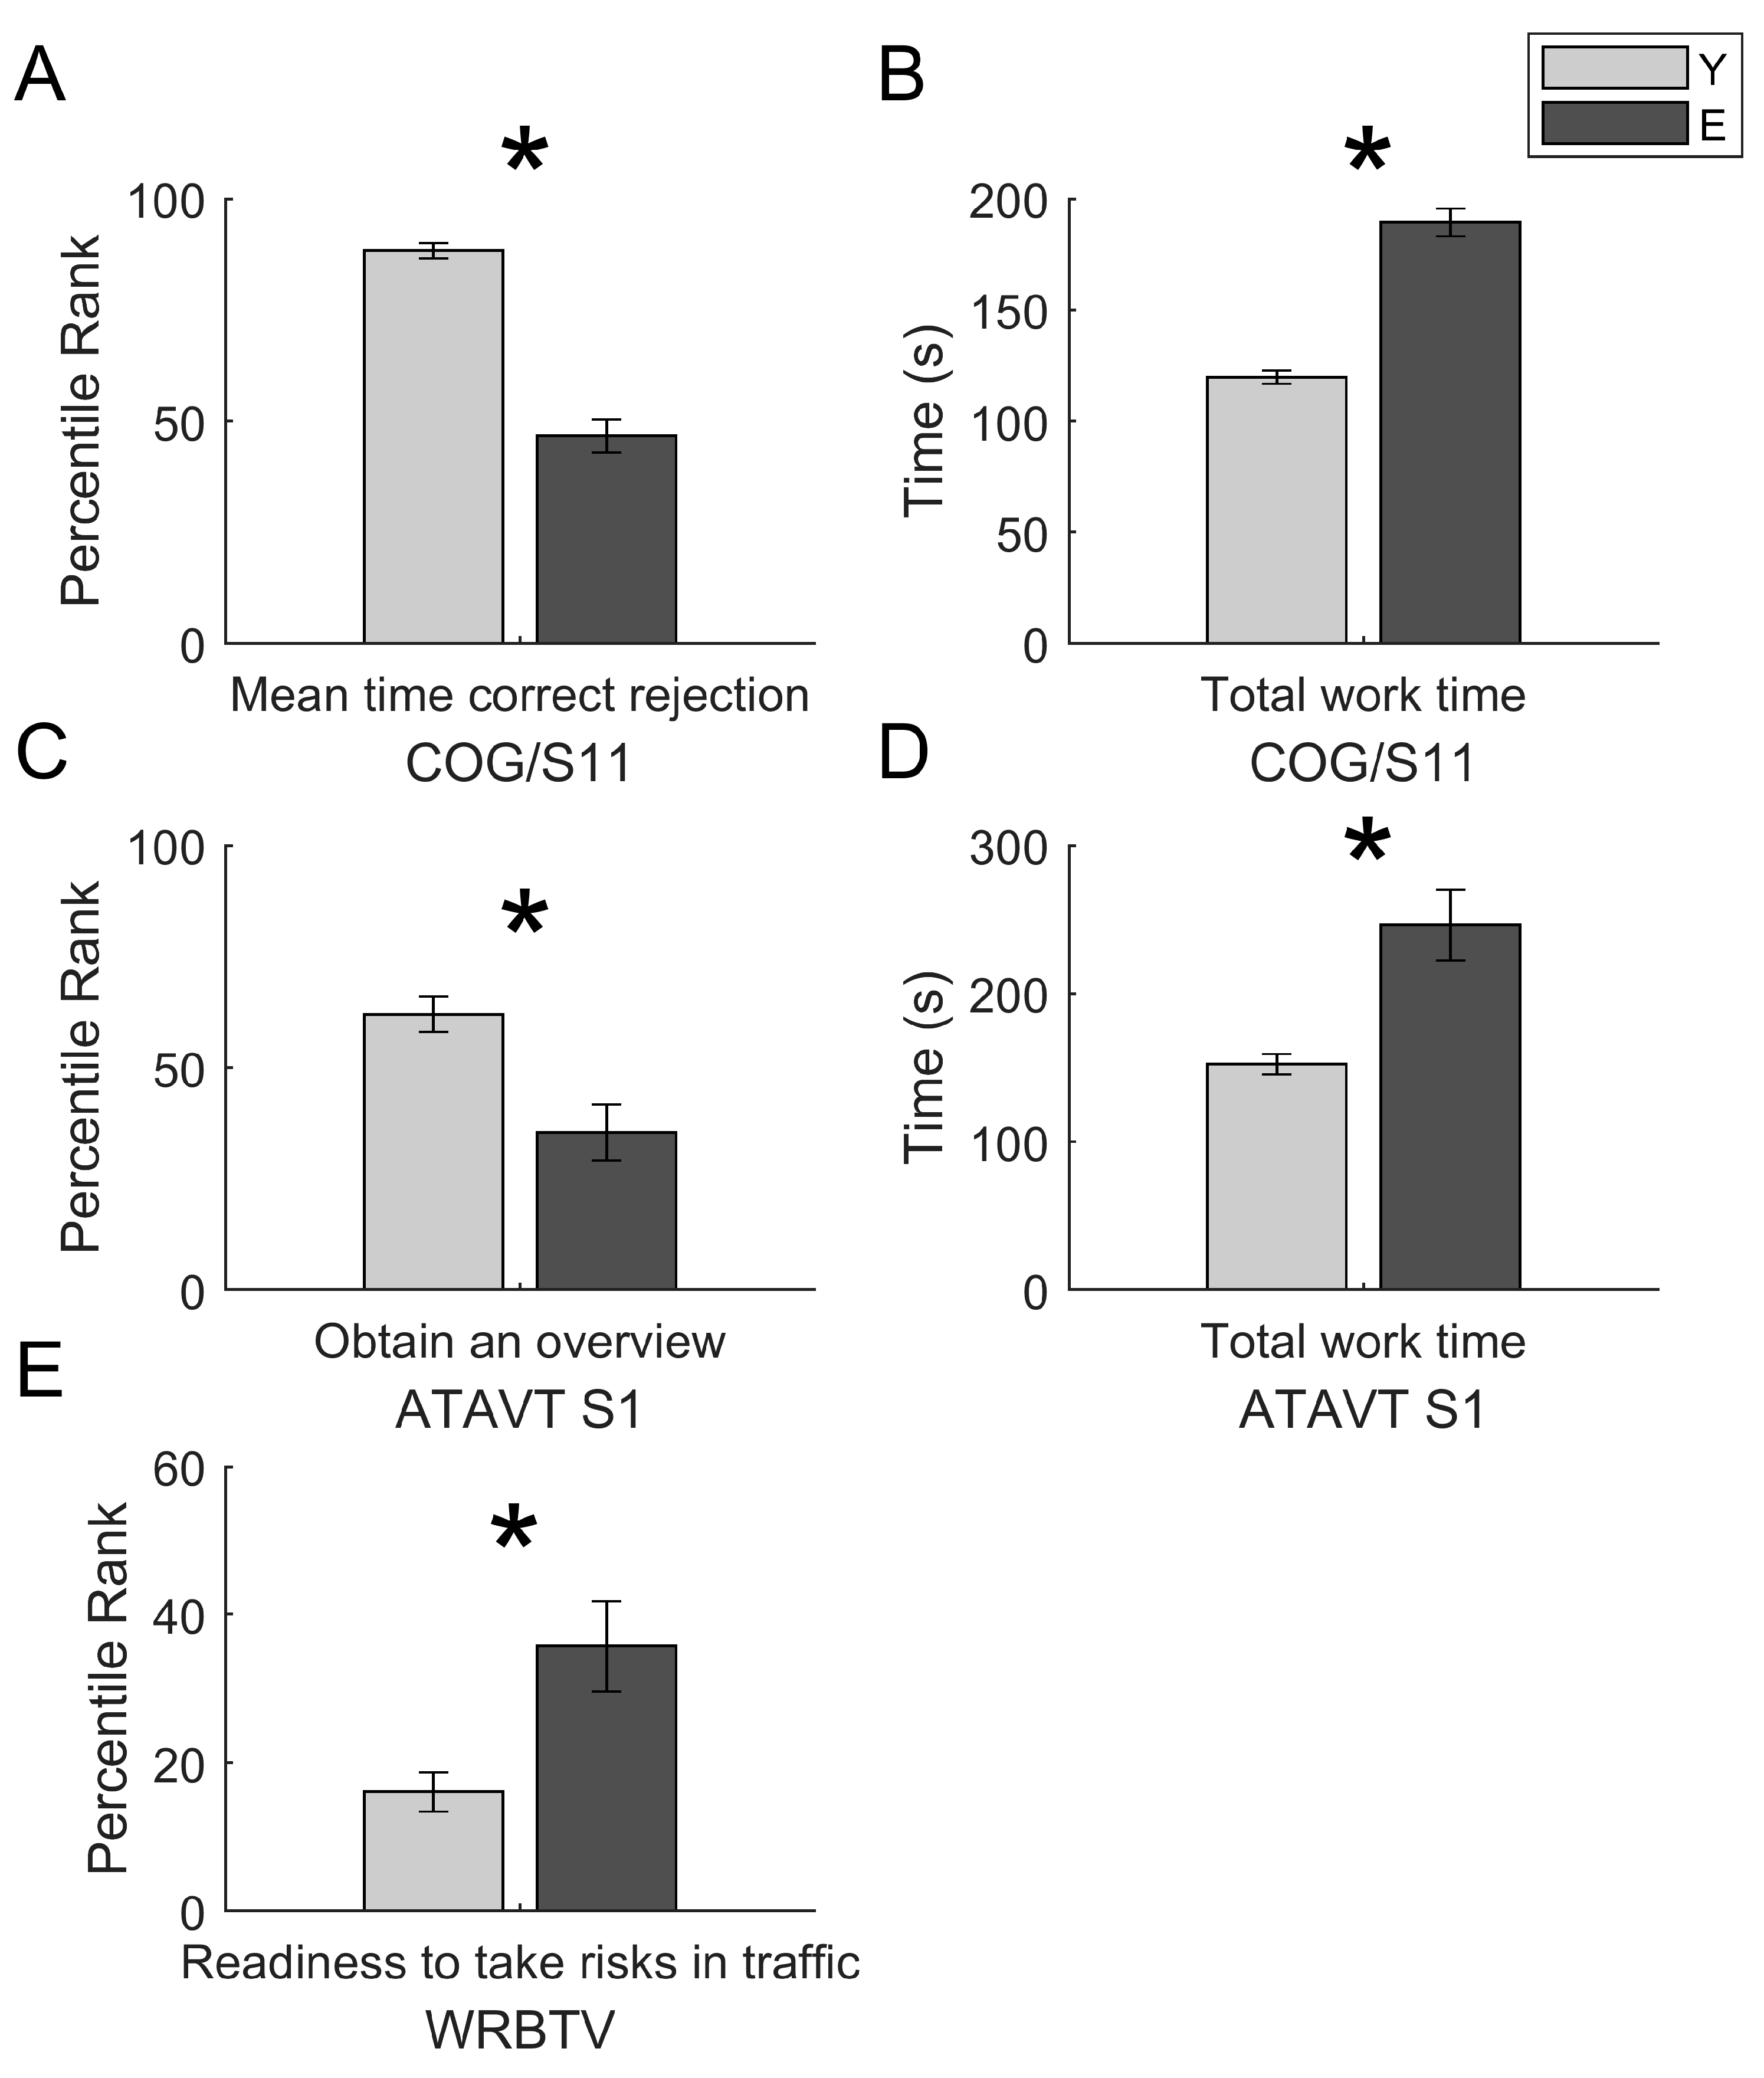
| COG mean time correct rejection | Age | 100.947 | p< 0.001 | 0.570 |
| Gender | 0.003 | 0.956 | 0.00004 | |
| Age × Gender | 0.628 | 0.431 | 0.008 | |
| COG total working time | Age | 98.076 | p< 0.001 | 0.563 |
| Gender | 0.596 | 0.442 | 0.008 | |
| Age × Gender | 0.164 | 0.686 | 0.002 | |
| ATAVT performance | Age | 13.207 | p< 0.001 | 0.191 |
| Gender | 2.010 | 0.162 | 0.035 | |
| Age × Gender | 2.143 | 0.149 | 0.037 | |
| ATAVT total working time | Age | 22.961 | p< 0.001 | 0.291 |
| Gender | 0.001 | 0.991 | 0.000002 | |
| Age × Gender | 0.325 | 0.571 | 0.006 | |
| WRBTV | Age | 15.204 | p< 0.001 | 0.167 |
| Gender | 0.001 | 0.982 | 0.000007 | |
| Age × Gender | 0.106 | 0.746 | 0.001 |
| Dependent Variables | Predictors | Beta | Coefficients of Partial Correlation | t | p-Level |
|---|---|---|---|---|---|
| COG mean time correct rejections R = 0.777; adjusted R2 = 0.559; 13.534; p < 0.001 | Age | −0.757 | −0.714 | −8.599 | p < 0.001 |
| TST | 0.113 | 0.171 | 1.465 | 0.147 | |
| PSQI | −0.098 | −0.136 | −1.156 | 0.251 | |
| KSS | −0.029 | −0.040 | −0.337 | 0.737 | |
| ESS | −0.047 | −0.069 | −0.586 | 0.560 | |
| Median PVT | 0.038 | 0.019 | 0.158 | 0.875 | |
| 10% slowest RTs PVT | −0.078 | −0.065 | −0.546 | 0.586 | |
| 10% fastest RTs PVT | 0.010 | 0.007 | 0.057 | 0.954 | |
| COG total working time R = 0.777; adjusted R2 = 0.559; 13.497; p < 0.001 | Age | 0.768 | 0.719 | 8.719 | p < 0.001 |
| TST | −0.108 | −0.163 | −1.391 | 0.169 | |
| PSQI | 0.060 | 0.084 | 0.711 | 0.479 | |
| KSS | 0.036 | 0.051 | 0.429 | 0.669 | |
| ESS | 0.024 | 0.035 | 0.299 | 0.766 | |
| Median PVT | 0.003 | 0.001 | 0.011 | 0.991 | |
| 10% slowest RTs PVT | 0.089 | 0.074 | 0.622 | 0.536 | |
| 10% fastest RTs PVT | −0.043 | −0.028 | −0.233 | 0.816 | |
| ATAVT performance R = 0.059; adjusted R2 = 0.245; 3.399; p = 0.003 | Age | −0.543 | −0.513 | −4.272 | p < 0.001 |
| TST | 0.173 | 0.197 | 1.432 | 0.158 | |
| PSQI | −0.010 | −0.011 | −0.078 | 0.938 | |
| KSS | −0.106 | −0.114 | −0.817 | 0.418 | |
| ESS | −0.015 | −0.017 | −0.123 | 0.902 | |
| Median PVT | −0.359 | −0.171 | −1.238 | 0.221 | |
| 10% slowest RTs PVT | 0.024 | 0.018 | 0.127 | 0.900 | |
| 10% fastest RTs PVT | 0.044 | 0.029 | 0.205 | 0.838 | |
| ATAVT total working time R = 0.640; adjusted R2 = 0.317; 4.419; p < 0.001 | Age | 0.602 | 0.571 | 4.971 | p < 0.001 |
| TST | 0.054 | 0.066 | 0.471 | 0.640 | |
| PSQI | −0.138 | −0.165 | −1.191 | 0.239 | |
| KSS | −0.070 | −0.079 | −0.568 | 0.572 | |
| ESS | −0.083 | −0.100 | −0.715 | 0.478 | |
| Median PVT | 0.193 | 0.098 | 0.700 | 0.487 | |
| 10% slowest RTs PVT | 0.033 | 0.026 | 0.184 | 0.854 | |
| 10% fastest RTs PVT | −0.349 | −0.233 | −1.713 | 0.093 | |
| WRB-TV R = 0.487; adjusted R2 = 0.151; 2.757; p = 0.010 | Age | 0.384 | 0.350 | 3.145 | 0.002 |
| TST | −0.024 | −0.027 | −0.227 | 0.821 | |
| PSQI | 0.061 | 0.061 | 0.516 | 0.607 | |
| KSS | −0.032 | −0.033 | −0.274 | 0.785 | |
| ESS | −0.160 | −0.168 | −1.434 | 0.156 | |
| Median PVT | 0.118 | 0.041 | 0.350 | 0.727 | |
| 10% slowest RTs PVT | −0.320 | −0.189 | −1.621 | 0.109 | |
| 10% fastest RTs PVT | 0.067 | 0.031 | 0.265 | 0.792 |
| Dependent Variables | Predictors | Beta | Coefficients of Partial Correlation | t | p-Level |
|---|---|---|---|---|---|
| COG mean time correct rejections R = 0.438; adjusted R2 = 0.113; 2.437; p = 0.027 | TST | 0.004 | 0.004 | 0.033 | 0.973 |
| PSQI | −0.254 | −0.248 | −2.170 | 0.033 | |
| KSS | 0.231 | 0.236 | 2.057 | 0.043 | |
| ESS | −0.006 | −0.006 | −0.049 | 0.961 | |
| Median PVT | 0.707 | 0.246 | 2.158 | 0.034 | |
| 10% slowest RTs PVT | −0.390 | −0.229 | −2.000 | 0.049 | |
| 10% fastest RTs PVT | −0.501 | −0.234 | −2.042 | 0.045 | |
| COG total working time R = 0.423; adjusted R2 = 0.099; 2.236; p = 0.041 | TST | 0.004 | 0.004 | 0.034 | 0.973 |
| PSQI | 0.219 | 0.214 | 1.855 | 0.068 | |
| KSS | −0.227 | −0.230 | −2.005 | 0.049 | |
| ESS | −0.018 | −0.019 | −0.158 | 0.875 | |
| Median PVT | −0.675 | −0.234 | −2.046 | 0.044 | |
| 10% slowest RTs PVT | 0.406 | 0.236 | 2.063 | 0.043 | |
| 10% fastest RTs PVT | 0.477 | 0.221 | 1.926 | 0.058 |
© 2020 by the authors. Licensee MDPI, Basel, Switzerland. This article is an open access article distributed under the terms and conditions of the Creative Commons Attribution (CC BY) license (http://creativecommons.org/licenses/by/4.0/).
Share and Cite
Bartolacci, C.; Scarpelli, S.; D’Atri, A.; Gorgoni, M.; Annarumma, L.; Cloos, C.; Giannini, A.M.; De Gennaro, L. The Influence of Sleep Quality, Vigilance, and Sleepiness on Driving-Related Cognitive Abilities: A Comparison between Young and Older Adults. Brain Sci. 2020, 10, 327. https://doi.org/10.3390/brainsci10060327
Bartolacci C, Scarpelli S, D’Atri A, Gorgoni M, Annarumma L, Cloos C, Giannini AM, De Gennaro L. The Influence of Sleep Quality, Vigilance, and Sleepiness on Driving-Related Cognitive Abilities: A Comparison between Young and Older Adults. Brain Sciences. 2020; 10(6):327. https://doi.org/10.3390/brainsci10060327
Chicago/Turabian StyleBartolacci, Chiara, Serena Scarpelli, Aurora D’Atri, Maurizio Gorgoni, Ludovica Annarumma, Chiara Cloos, Anna Maria Giannini, and Luigi De Gennaro. 2020. "The Influence of Sleep Quality, Vigilance, and Sleepiness on Driving-Related Cognitive Abilities: A Comparison between Young and Older Adults" Brain Sciences 10, no. 6: 327. https://doi.org/10.3390/brainsci10060327
APA StyleBartolacci, C., Scarpelli, S., D’Atri, A., Gorgoni, M., Annarumma, L., Cloos, C., Giannini, A. M., & De Gennaro, L. (2020). The Influence of Sleep Quality, Vigilance, and Sleepiness on Driving-Related Cognitive Abilities: A Comparison between Young and Older Adults. Brain Sciences, 10(6), 327. https://doi.org/10.3390/brainsci10060327