Relation of Intracerebral Hemorrhage Descriptors with Clinical Factors

 ,
,
Abstract
1. Introduction
2. Materials and Methods
3. Results
3.1. Study Group Characteristics
3.2. Association of ICH Shape with Its Growth and Comorbidities
3.3. Correlation between ICH Shape and Test Results upon Admission
4. Discussion
5. Conclusions
Author Contributions
Funding
Conflicts of Interest
References
- Sacco, S.; Marini, C.; Toni, D.; Olivieri, L.; Carolei, A. Incidence and 10-Year Survival of Intracerebral Hemorrhage in a Population-Based Registry. Stroke 2009, 40, 394–399. [Google Scholar] [CrossRef]
- Counsell, C.; Boonyakarnkul, S.; Dennis, M.; Sandercock, P.; Bamford, J.; Burn, J.; Warlow, C. Primary Intracerebral Haemorrhage in the Oxfordshire Community Stroke Project. Cerebrovasc. Dis. 1995, 5, 26–34. [Google Scholar] [CrossRef]
- Broderick, J.; Connolly, S.; Feldmann, E.; Hanley, D.; Kase, C.; Krieger, D.; Mayberg, M.; Morgenstern, L.; Ogilvy, C.S.; Vespa, P.; et al. REPRINT: Guidelines for the Management of Spontaneous Intracerebral Hemorrhage in Adults: 2007 Update: A Guideline From the American Heart Association/American Stroke Association Stroke Council, High Blood Pressure Research Council, and the Quality of Care and Outcomes in Research Interdisciplinary Working Group: The American Academy of Neurology affirms the value of this guideline as an educational tool for neurologists. Circulation 2007, 116, e391–e413. [Google Scholar]
- Broderick, J.P.; Brott, T.; Tomsick, T.; Miller, R.; Huster, G. Intracerebral hemorrhage more than twice as common as subarachnoid hemorrhage. J. Neurosurg. 1993, 78, 188–191. [Google Scholar] [CrossRef] [PubMed]
- Sahni, R.; Weinberger, J. Management of intracerebral hemorrhage. Vasc. Health Risk Manag. 2007, 3, 701–709. [Google Scholar] [PubMed]
- Hayes, S.B.; Benveniste, R.J.; Morcos, J.J.; Aziz-Sultan, M.A.; Elhammady, M.S. Retrospective comparison of craniotomy and decompressive craniectomy for surgical evacuation of nontraumatic, supratentorial intracerebral hemorrhage. Neurosurg. Focus 2013, 34, E3. [Google Scholar] [CrossRef] [PubMed]
- Rådholm, K.; Arima, H.; Lindley, R.I.; Wang, J.; Tzourio, C.; Robinson, T.; Heeley, E.; Anderson, C.S.; Chalmers, J. INTERACT2 Investigators Older age is a strong predictor for poor outcome in intracerebral haemorrhage: The INTERACT2 study. Age Ageing 2015, 44, 422–427. [Google Scholar] [CrossRef] [PubMed]
- Ariesen, M.J.; Claus, S.P.; Rinkel, G.J.E.; Algra, A. Risk Factors for Intracerebral Hemorrhage in the General Population: A Systematic Review. Stroke 2003, 34, 2060–2065. [Google Scholar] [CrossRef] [PubMed]
- Lord, A.S.; Langefeld, C.D.; Sekar, P.; Moomaw, C.J.; Badjatia, N.; Vashkevich, A.; Rosand, J.; Osborne, J.; Woo, D.; Elkind, M.S.V. Infection After Intracerebral Hemorrhage. Stroke 2014, 45, 3535–3542. [Google Scholar] [CrossRef]
- Kliś, K.M.; Krzyżewski, R.M.; Kwinta, B.M.; Stachura, K.; Gąsowski, J. Computer-assisted analysis of intracerebral haemorrhage shape and density. World Neurosurg. 2018, 120, e863–e869. [Google Scholar] [CrossRef]
- Barras, C.D.; Tress, B.M.; Christensen, S.; MacGregor, L.; Collins, M.; Desmond, P.M.; Skolnick, B.E.; Mayer, S.A.; Broderick, J.P.; Diringer, M.N.; et al. Density and Shape as CT Predictors of Intracerebral Hemorrhage Growth. Stroke 2009, 40, 1325–1331. [Google Scholar] [CrossRef]
- Rincon, F.; Lyden, P.; Mayer, S.A. Relationship Between Temperature, Hematoma Growth, and Functional Outcome After Intracerebral Hemorrhage. Neurocrit. Care 2013, 18, 45–53. [Google Scholar] [CrossRef] [PubMed]
- Kelly, M.L.; Sulmasy, D.P.; Weil, R.J. Spontaneous intracerebral hemorrhage and the challenge of surgical decision making: A review. Neurosurg. Focus 2013, 34, E1. [Google Scholar] [CrossRef] [PubMed]
- Rangayyan, R.M.; Nguyen, T.M. Fractal Analysis of Contours of Breast Masses in Mammograms. J. Digit. Imaging 2007, 20, 223–237. [Google Scholar] [CrossRef] [PubMed]
- Nguyen, T.M.; Rangayyan, R.M. Shape Analysis of Breast Masses in Mammograms via the Fractal Dimension. In Proceedings of the 2005 IEEE Engineering in Medicine and Biology 27th Annual Conference, Shanghai, China, 17–18 January 2006; Volume 3, pp. 3210–3213. [Google Scholar]
- Nie, K.; Chen, J.-H.; Yu, H.J.; Chu, Y.; Nalcioglu, O.; Su, M.-Y. Quantitative Analysis of Lesion Morphology and Texture Features for Diagnostic Prediction in Breast MRI. Acad. Radiol. 2008, 15, 1513–1525. [Google Scholar] [CrossRef] [PubMed]
- Delcourt, C.; Zhang, S.; Arima, H.; Sato, S.; Al-Shahi Salman, R.; Wang, X.; Davies, L.; Stapf, C.; Robinson, T.; Lavados, P.M.; et al. Significance of Hematoma Shape and Density in Intracerebral Hemorrhage: The Intensive Blood Pressure Reduction in Acute Intracerebral Hemorrhage Trial Study. Stroke 2016, 47, 1227–1232. [Google Scholar] [CrossRef] [PubMed]
- Mracsko, E.; Veltkamp, R. Neuroinflammation after intracerebral hemorrhage. Front. Cell. Neurosci. 2014, 8, 388. [Google Scholar] [CrossRef]
- Askenase, M.H.; Sansing, L.H. Stages of the Inflammatory Response in Pathology and Tissue Repair after Intracerebral Hemorrhage. Semin. Neurol. 2016, 36, 288–297. [Google Scholar] [CrossRef]
- Wu, X.; Lu, X.; Lu, X.; Yu, J.; Sun, Y.; Du, Z.; Wu, X.; Mao, Y.; Zhou, L.; Wu, S.; et al. Prevalence of severe hypokalaemia in patients with traumatic brain injury. Injury 2015, 46, 35–41. [Google Scholar] [CrossRef]
- Camacho, E.; LoPresti, M.A.; Bruce, S.; Lin, D.; Abraham, M.; Appelboom, G.; Taylor, B.; McDowell, M.; DuBois, B.; Sathe, M.; et al. The role of age in intracerebral hemorrhages. J. Clin. Neurosci. 2015, 22, 1867–1870. [Google Scholar] [CrossRef]
- Wang, C.-W.; Liu, Y.-J.; Lee, Y.-H.; Hueng, D.-Y.; Fan, H.-C.; Yang, F.-C.; Hsueh, C.-J.; Kao, H.-W.; Juan, C.-J.; Hsu, H.-H. Hematoma Shape, Hematoma Size, Glasgow Coma Scale Score and ICH Score: Which Predicts the 30-Day Mortality Better for Intracerebral Hematoma? PLoS ONE 2014, 9, e102326. [Google Scholar] [CrossRef] [PubMed]


| Age > 65 years (n = 23) | Age < 65 years (n = 25) | p-Value | |
| Compactness ± SD | 0.70 ± 0.19 | 0.56 ± 0.20 | < 0.011 |
| Fourier Factor ± SD | 0.89 ± 0.11 | 0.86 ± 0.21 | 0.451 |
| Fractal Dimension ± SD | 0.46 ± 0.22 | 0.32 ± 0.20 | 0.031 |
| Circle Factor ± SD | 0.51 ± 0.25 | 0.35 ± 0.17 | < 0.011 |
| Female gender (n = 16) | Male gender (n = 32) | p-Value | |
| Compactness ± SD | 0.63 ± 0.16 | 0.63 ± 0.23 | 0.991 |
| Fourier Factor ± SD | 0.86 ± 0.12 | 0.88 ± 0.19 | 0.741 |
| Fractal Dimension ± SD | 0.41 ± 0.18 | 0.38 ± 0.24 | 0.671 |
| Circle Factor ± SD | 0.41 ± 0.23 | 0.43 ± 0.23 | 0.761 |
| Hypertension (n = 18) | No hypertension (n = 30) | p-Value | |
| Compactness ± SD | 0.61 ± 0.26 | 0.64 ± 0.16 | 0.581 |
| Fourier Factor ± SD | 0.86 ± 0.25 | 0.88 ± 0.10 | 0.651 |
| Fractal Dimension ± SD | 0.39 ± 0.24 | 0.39 ± 0.21 | 0.971 |
| Circle Factor ± SD | 0.42 ± 0.26 | 0.43 ± 0.21 | 0.961 |
| Diabetes mellitus (n = 7) | No diabetes mellitus (n = 41) | p-Value | |
| Compactness ± SD | 0.57 ± 0.35 | 0.64 ± 0.17 | 0.431 |
| Fourier Factor ± SD | 0.76 ± 0.34 | 0.89 ± 0.11 | 0.051 |
| Fractal Dimension ± SD | 0.42 ± 0.32 | 0.38 ± 0.20 | 0.631 |
| Circle Factor ± SD | 0.40 ± 0.34 | 0.43 ± 0.21 | 0.721 |
| Hypercholesterolemia (n = 4) | No hypercholesterolemia (n = 44) | p-Value | |
| Compactness ± SD | 0.42 ± 0.13 | 0.65 ± 0.2 | 0.031 |
| Fourier Factor ± SD | 0.83 ± 0.14 | 0.88 ± 0.17 | 0.561 |
| Fractal Dimension ± SD | 0.25 ± 0.20 | 0.40 ± 0.22 | 0.201 |
| Circle Factor ± SD | 0.18 ± 0.11 | 0.45 ± 0.22 | 0.021 |
| History of ischemic stroke (n = 3) | No history of ischemic stroke (n = 45) | p-Value | |
| Compactness ± SD | 0.56 ± 0.18 | 0.63 ± 0.21 | 0.531 |
| Fractal Dimension ± SD | 0.89 ± 0.04 | 0.87 ± 0.17 | 0.891 |
| Circle Factor ± SD | 0.36 ± 0.15 | 0.39 ± 0.22 | 0.841 |
| Compactness ± SD | 0.31 ± 0.16 | 0.43 ± 0.23 | 0.351 |
| Risk factor | ICH Growth (n = 14) | No ICH Growth (n = 34) | p-Value |
|---|---|---|---|
| Age [years] ± SD | 66.71 ± 15.47 | 62.39 ± 16.61 | 0.411 |
| Female gender [%] | 21.43 (3) | 38.24 (13) | 0.261 |
| Comorbidities | |||
| Hypertension [%] | 50 (7) | 32.35 (11) | 0.251 |
| Diabetes mellitus [%] | 14.29 (2) | 14.71 (5) | 0.971 |
| Alcoholism [%] | 0 (0) | 2.94 (1) | 0.521 |
| Ischemic heart disease [%] | 7.14 (1) | 11.76 (4) | 0.631 |
| History of heart attack [%] | 0 (0) | 5.88 (2) | 0.351 |
| History of ischemic stroke [%] | 0 (0) | 8.82 (3) | 0.251 |
| Atrial fibrillation [%] | 14.29 (2) | 11.76 (4) | 0.811 |
| Lungs diseases [%] | 0 (0) | 2.94 (1) | 0.521 |
| Hyperthyroidism [%] | 7.14 (1) | 2.94 (1) | 0.511 |
| Hypothyroidism [%] | 14.29 (2) | 5.88 (2) | 0.341 |
| Hypercholesterolemia [%] | 0 (0) | 11.76 (4) | 0.181 |
| Current medications | |||
| Acetylsalicylic acid [%] | 14.29 (2) | 11.76 (4) | 0.811 |
| Β—blockers [%] | 14.29 (2) | 14.71 (5) | 0.971 |
| Angiotensin-converting-enzyme inhibitors [%] | 7.14 (1) | 8.82 (3) | 0.851 |
| Calcium channel blockers [%] | 0 (0) | 8.82 (3) | 0.251 |
| Diuretics [%] | 14.29 (2) | 29.41 (10) | 0.271 |
| Steroids [%] | 0 (0) | 5.88 (2) | 0.351 |
| Antidiabetic therapy [%] | 7.14 (1) | 0 (0) | 0.121 |
| Insulin [%] | 0 (0) | 2.94 (1) | 0.521 |
| Anticoagulants [%] | 28.57 (4) | 20.59 (7) | 0.551 |
| Statins [%] | 0 (0) | 11.76 (4) | 0.181 |
| Hematoma measurements | |||
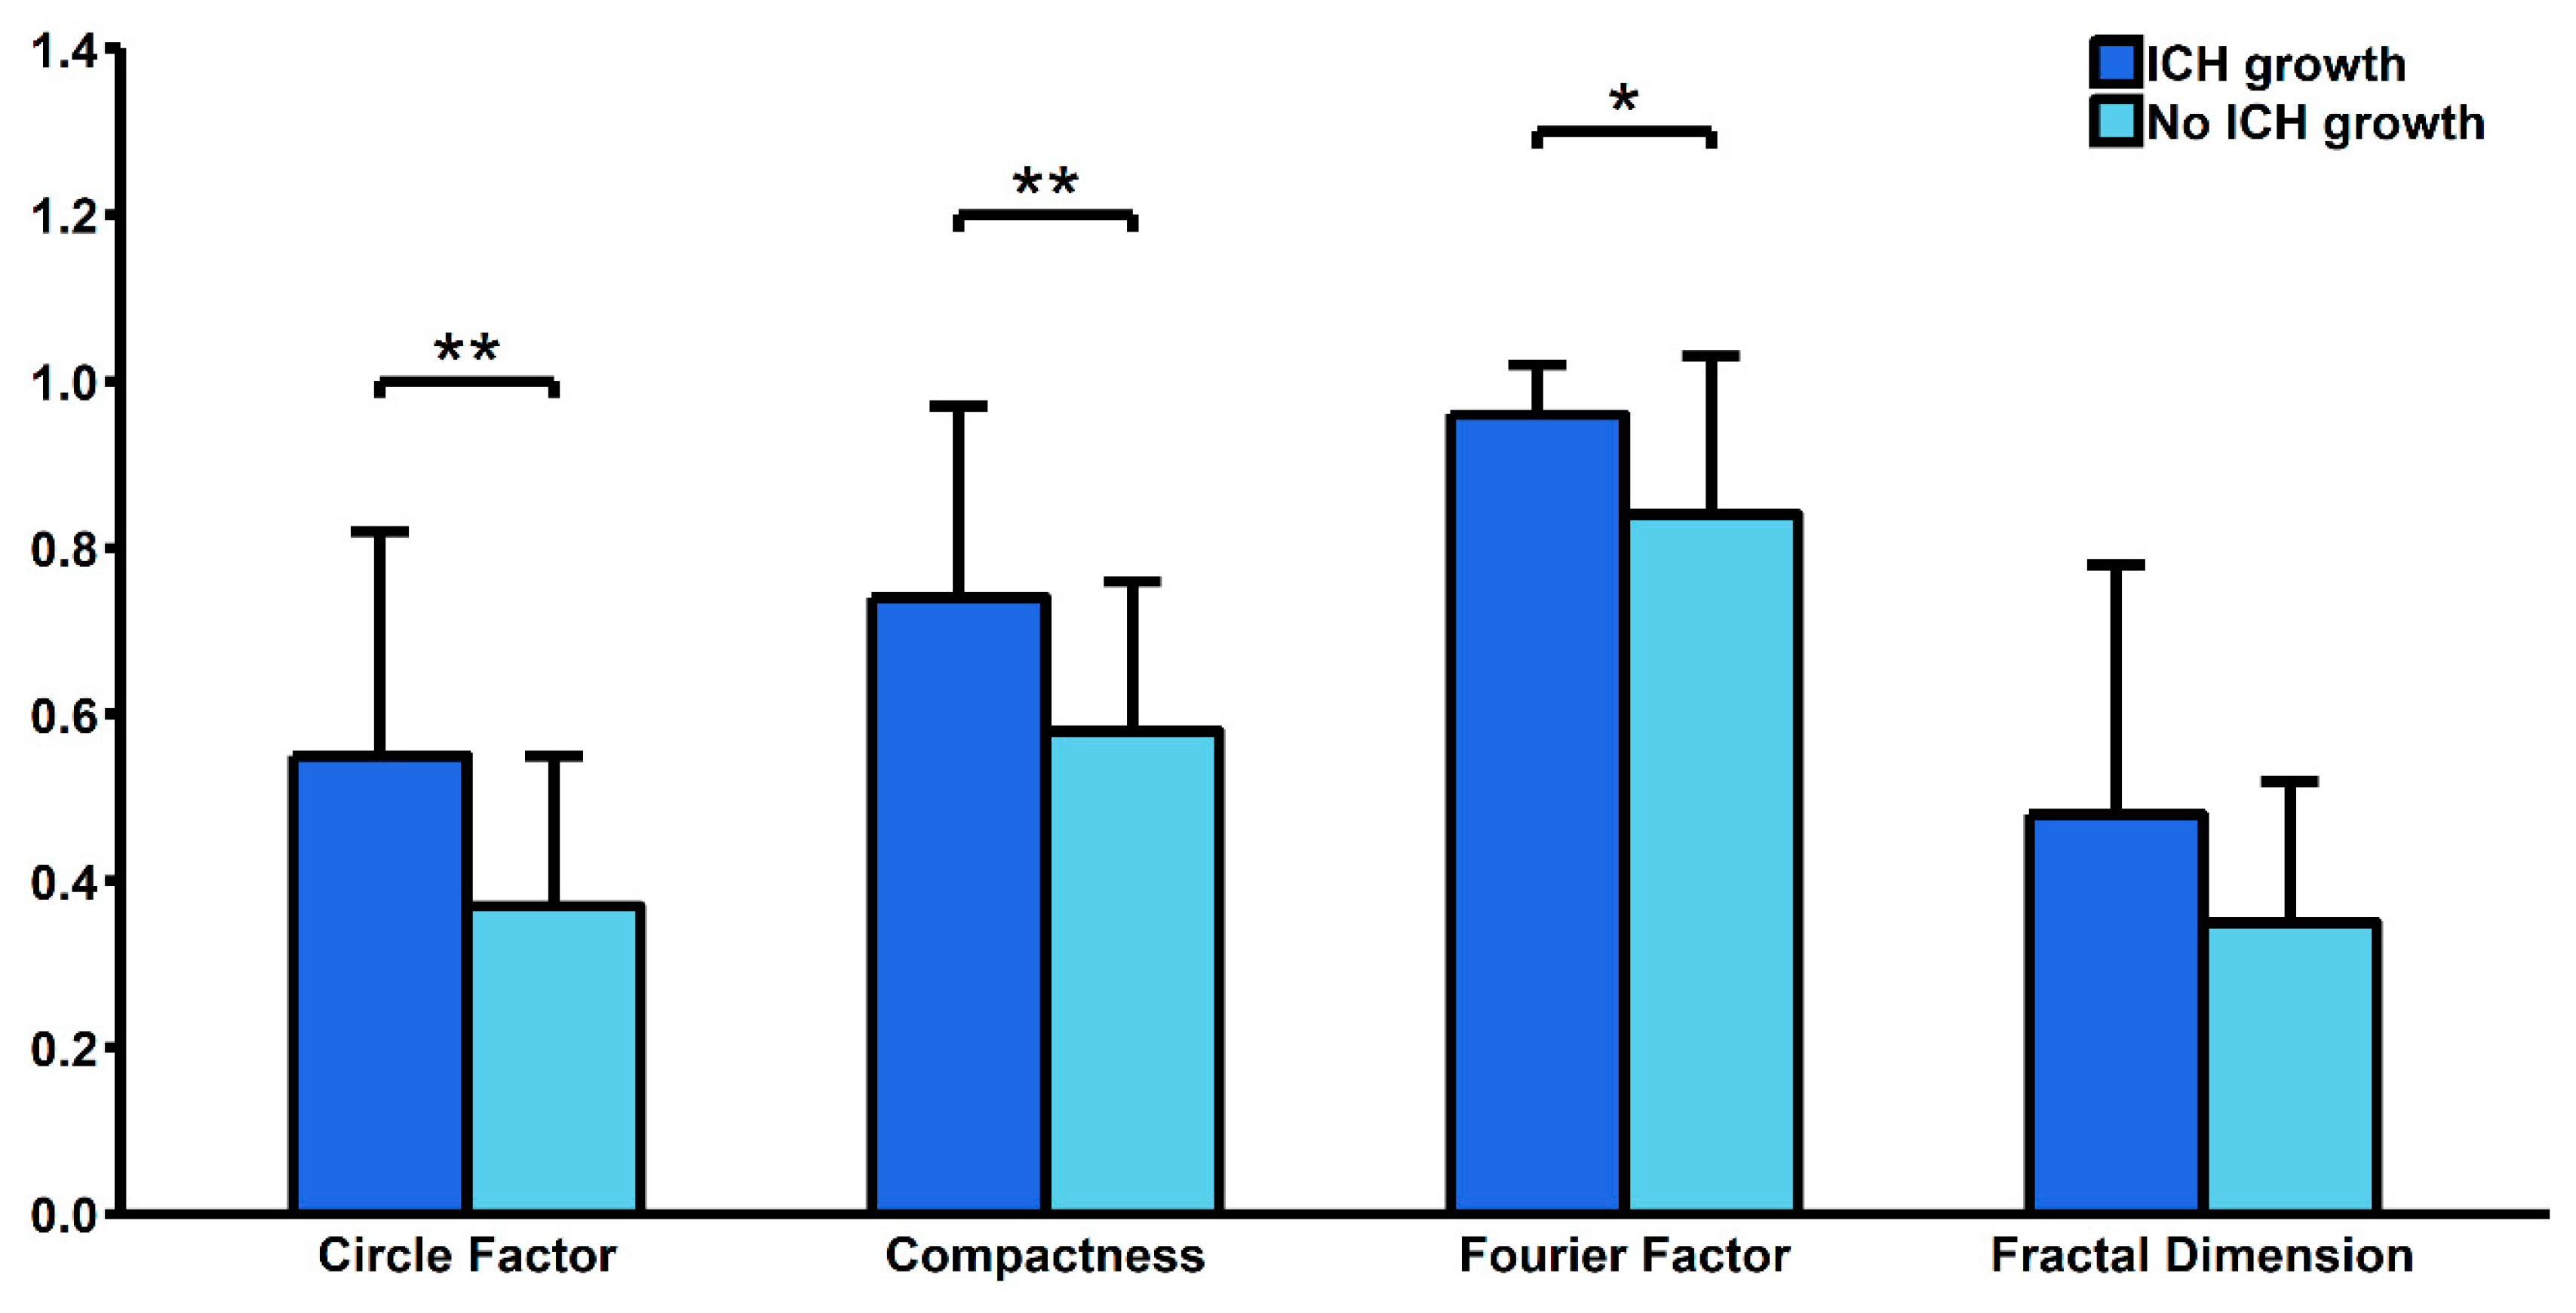
| Compactness ± SD | 0.74 ± 0.23 | 0.58 ± 0.18 | <0.01 |
| Fourier Factor ± SD | 0.96 ± 0.06 | 0.84 ± 0.19 | 0.03 |
| Fractal Dimension ± SD | 0.48 ± 0.3 | 0.35 ± 0.17 | 0.07 |
| Circle Factor ± SD | 0.55 ± 0.27 | 0.37 ± 0.18 | <0.011 |
| Volume - ABC/2 [mm3] ± SD | 32086.46 ± 31745.84 | 56904.27 ± 40666.45 | 0.191 |
| Precise volume [mm3] ± SD | 34942 ± 7635.34 | 62833.16 ± 37010.62 | 0.351 |
| Blood tests results upon admission | |||
| White Blood Cells count [103/μL] ± SD | 9.92 ± 4.8 | 14.61 ± 20.39 | 0.481 |
| Red Blood Cells count [103/μL] ± SD | 4.23 ± 1.07 | 4.25 ± 0.72 | 0.951 |
| Platelet count [103/μL] ± SD | 179.4 ± 67.4 | 189.11 ± 103.54 | 0.781 |
| Haemoglobin [g/dl] ± SD | 13.16 ± 3.28 | 12.67 ± 2.16 | 0.601 |
| Mean Corpuscular Volume [μm3] ± SD | 89.33 ± 4.86 | 88.8 ± 5.63 | 0.791 |
| Mean Corpuscular Haemoglobin [pg] ± SD | 31.15 ± 2.04 | 29.88 ± 2.05 | 0.101 |
| Mean Corpuscular Haemoglobin Concentration [g/dL] ± SD | 34.89 ± 1.39 | 33.62 ± 0.95 | <0.011 |
| International Normalized Ratio ± SD | 12.56 ± 35.64 | 1.76 ± 2.12 | 0.141 |
| Prothrombin Time [s] ± SD | 17.4 ± 8.95 | 14.88 ± 6.55 | 0.361 |
| Activated Partial Thromboplastin Time [s] ± SD | 36.13 ± 10.84 | 32.57 ± 9.63 | 0.351 |
| Sodium [mmol/L] ± SD | 138.4 ± 4.62 | 141.07 ± 6.63 | 0.251 |
| Potassium [mmol/L] ± SD | 3.84 ± 0.48 | 3.97 ± 0.63 | 0.551 |
| Glucose [mmol/L] ± SD | 9.97 ± 5.31 | 6.99 ± 2.04 | 0.041 |
| Creatinine [μmol/L] ± SD | 71.58 ± 17.94 | 93.63 ± 72.69 | 0.311 |
| Urea [mmol/L] ± SD | 4.95 ± 1.96 | 8.04 ± 6.18 | 0.121 |
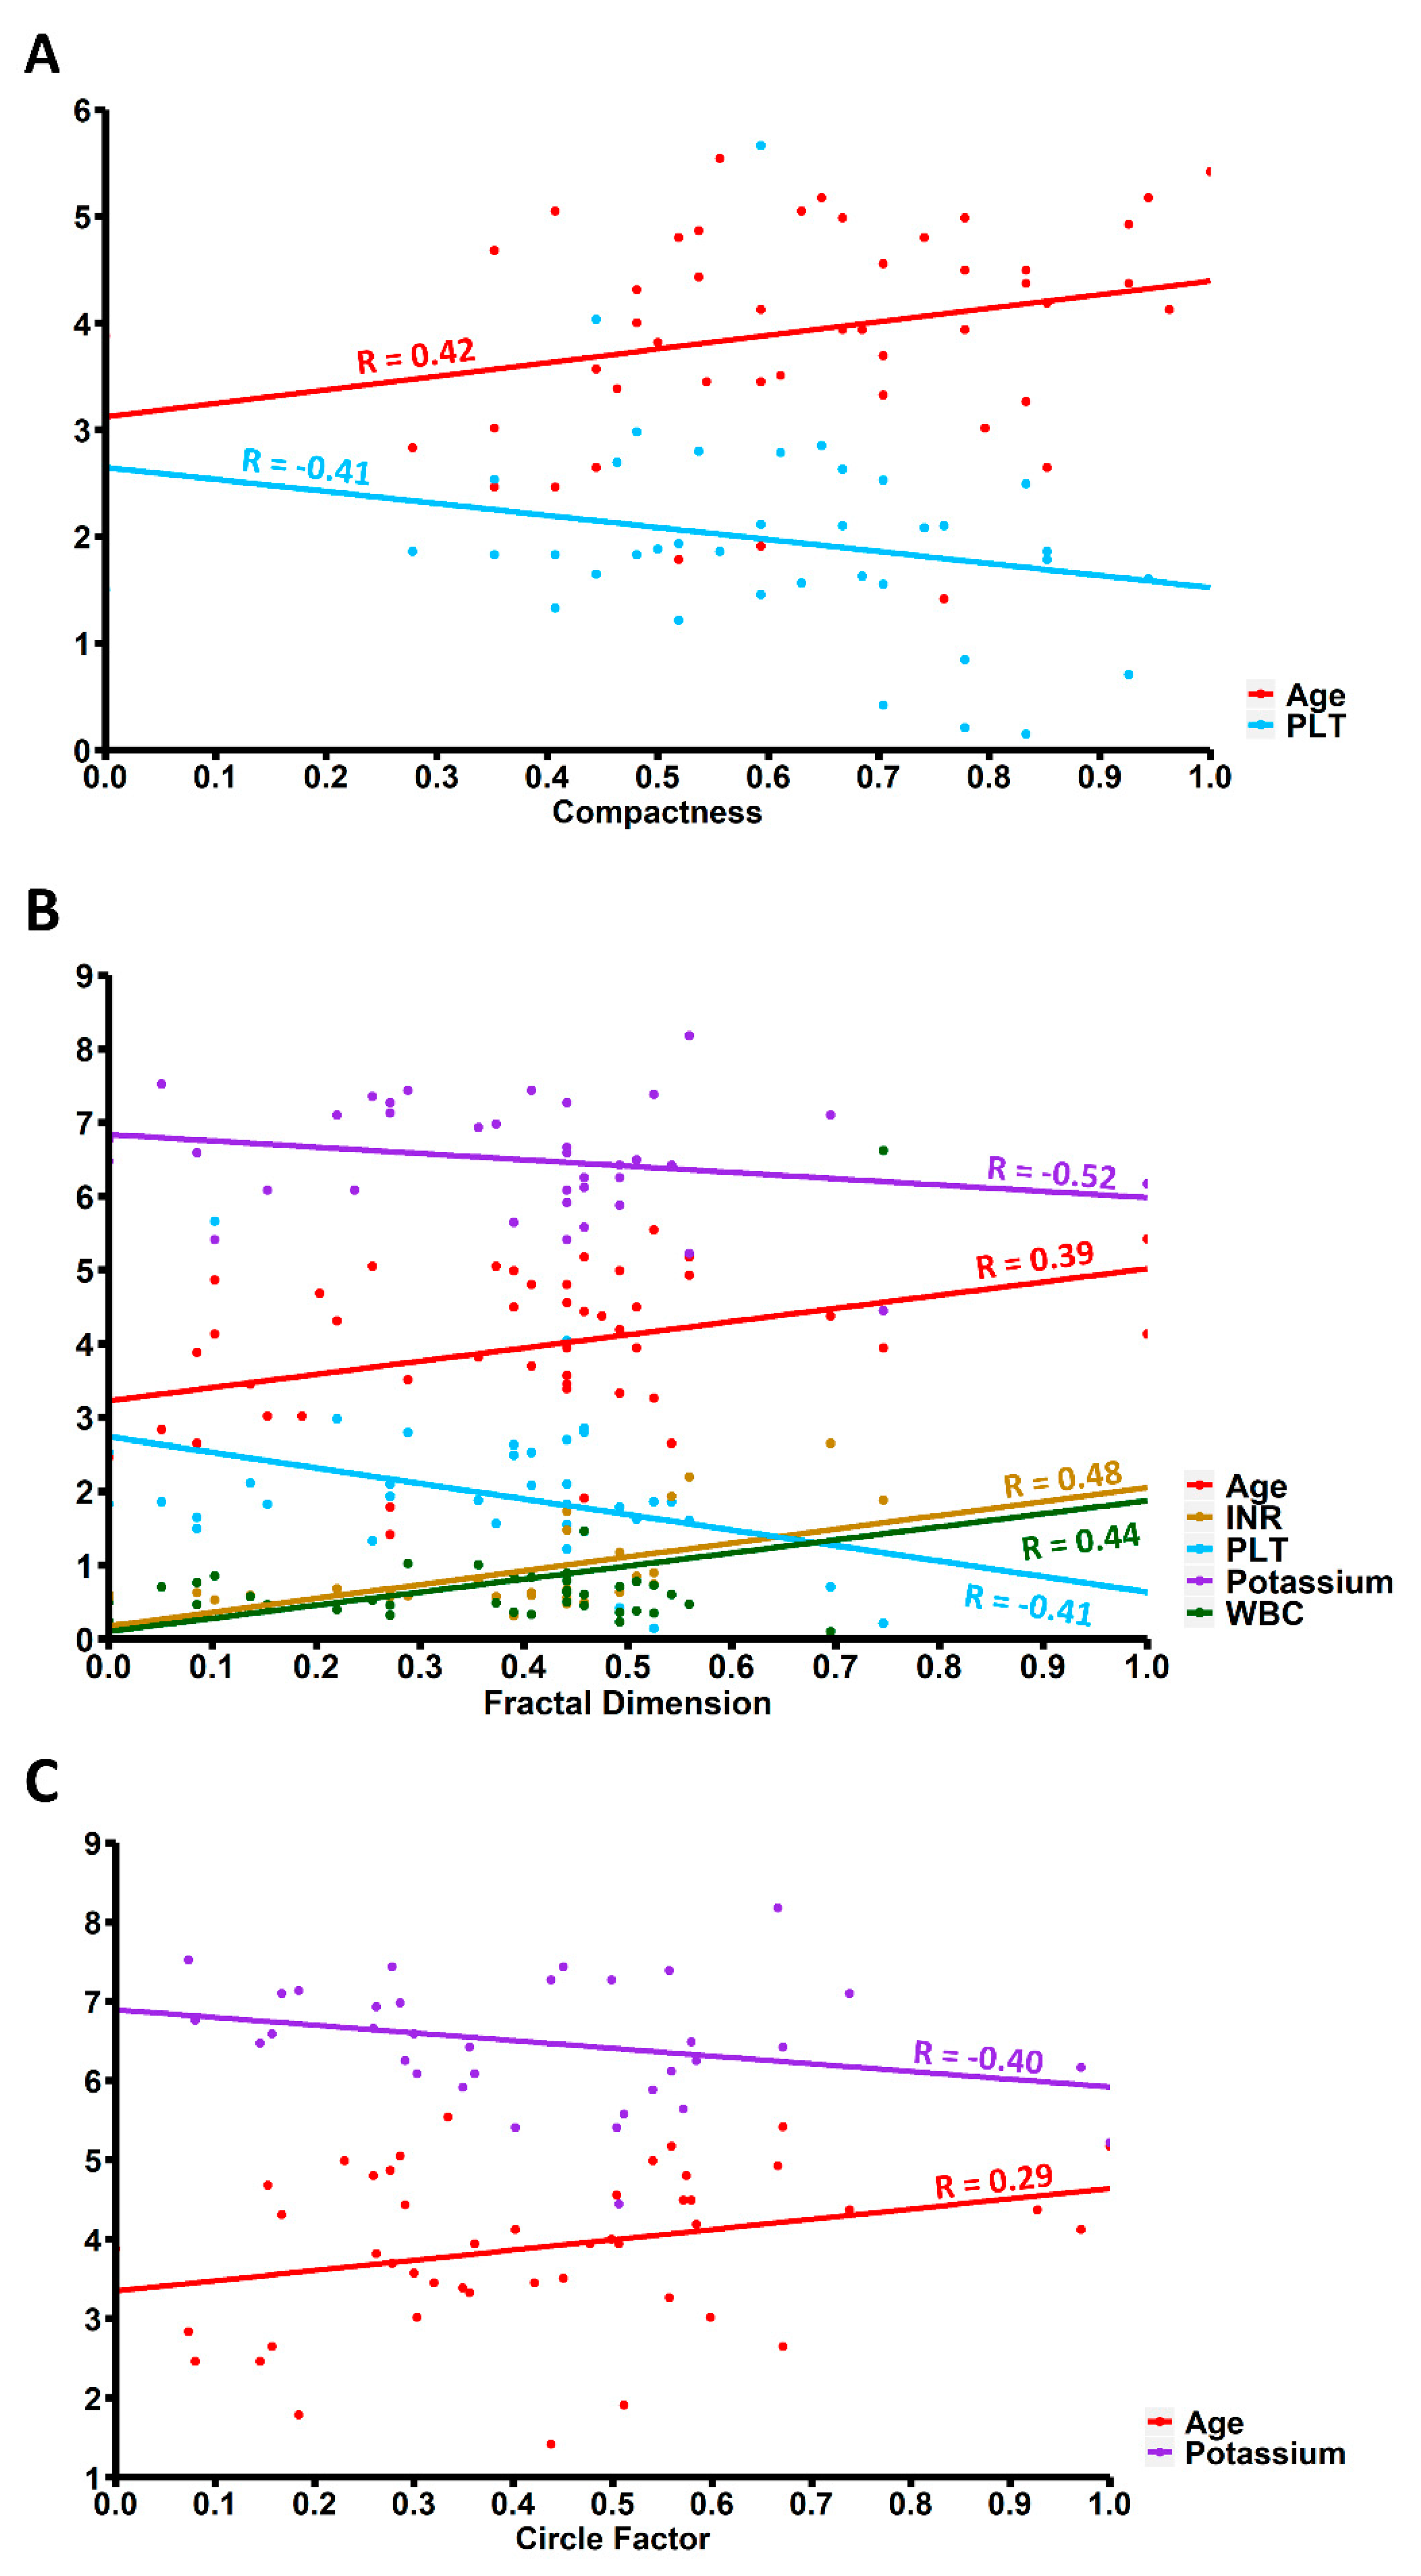
| Compactness | Fourier Factor | Fractal Dimension | Circle Factor | |
|---|---|---|---|---|
| White Blood Cells count [103/μL] | 0.17 | −0.16 | 0.44 | 0.15 |
| p-value1 | 0.40 | 0.41 | 0.02 | 0.46 |
| Red Blood Cells count [103/μL] | 0.02 | 0.21 | −0.05 | 0.01 |
| p-value1 | 0.94 | 0.29 | 0.82 | 0.97 |
| Haemoglobin [g/dL] | 0.02 | 0.23 | −0.10 | 0.01 |
| p-value1 | 0.93 | 0.26 | 0.63 | 0.99 |
| Platelet count [103/μL] | −0.41 | −0.01 | −0.38 | −0.30 |
| p-value1 | 0.03 | 0.96 | 0.049 | 0.13 |
| International Normalized Ratio | 0.29 | 0.14 | 0.48 | 0.22 |
| p-value1 | 0.09 | 0.44 | < 0.01 | 0.20 |
| Activated Partial Thromboplastin Time [s] | −0.11 | −0.19 | −0.10 | 0.07 |
| p-value1 | 0.58 | 0.34 | 0.61 | 0.73 |
| Sodium [mmol/L] | 0.15 | −0.02 | 0.26 | 0.11 |
| p-value1 | 0.46 | 0.91 | 0.20 | 0.59 |
| Potassium [mmol/L] | −0.29 | 0.04 | -0.52 | −0.40 |
| p-value1 | 0.14 | 0.83 | 0.01 | 0.04 |
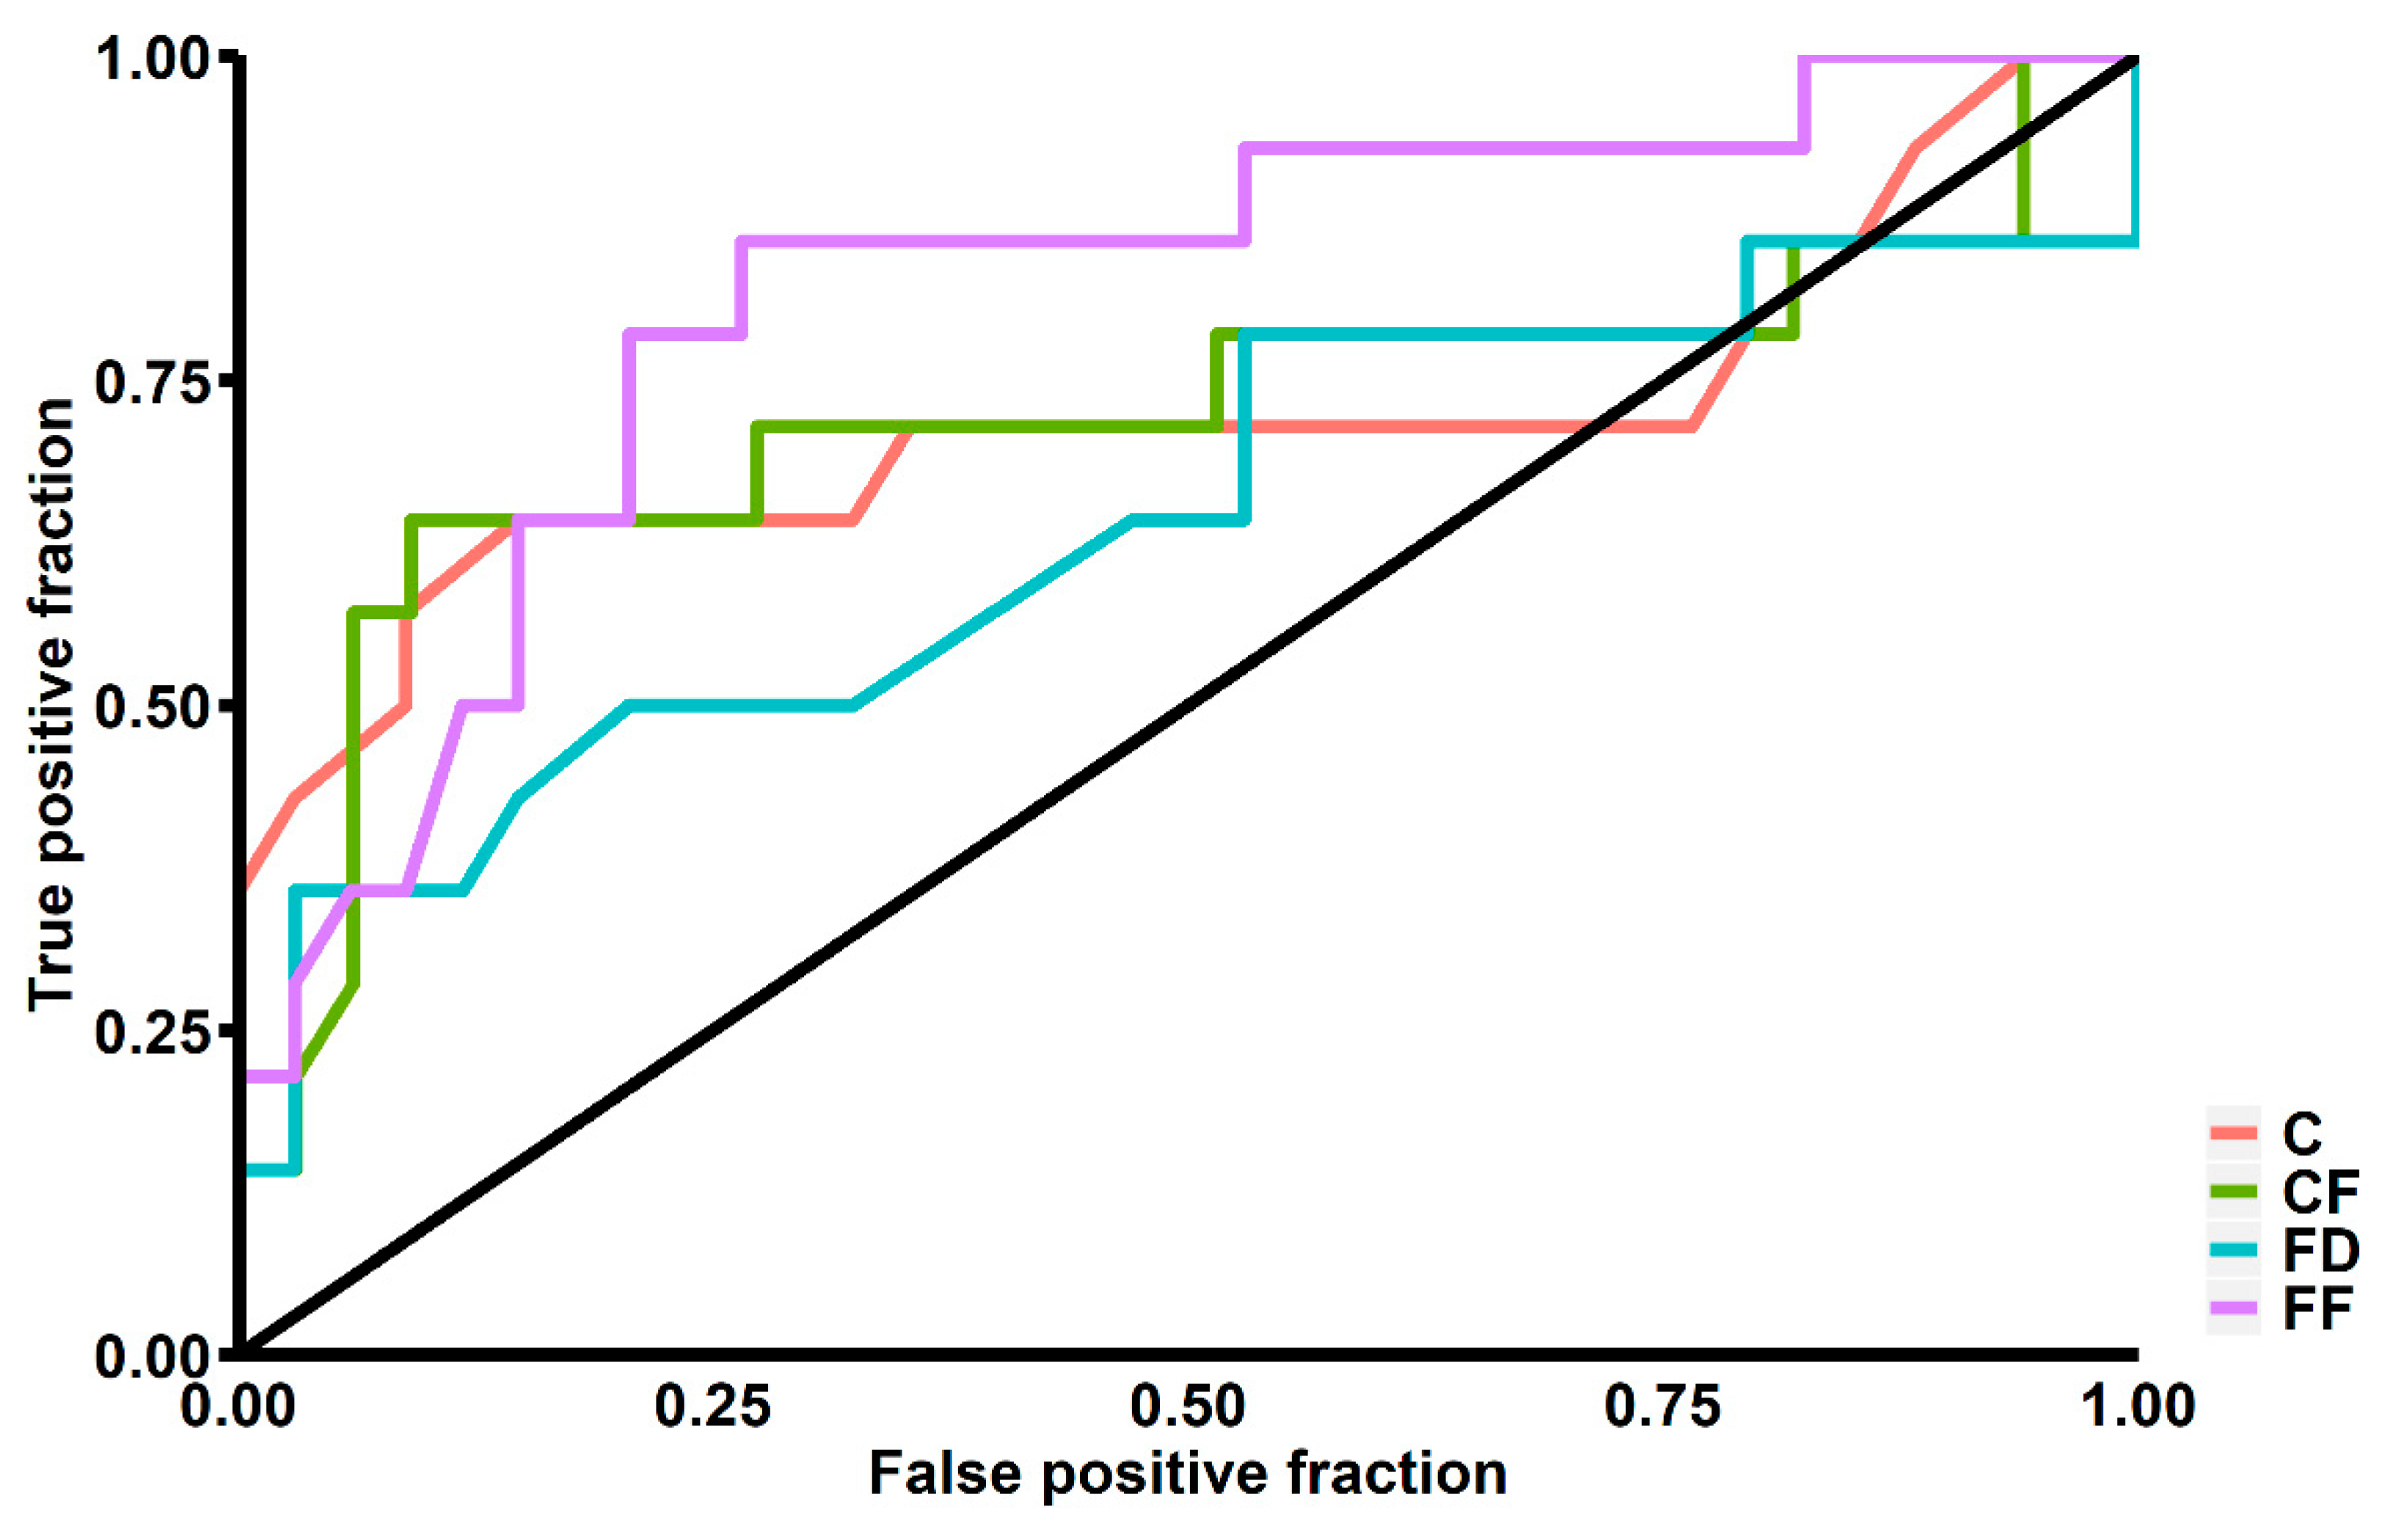
| R | p-Value | |
|---|---|---|
| Hematoma volume [mm3] | 0.28 | 0.47 |
| Age | −0.21 | 0.59 |
| Compactness | −0.18 | 0.24 |
| Fourier Factor | 0.02 | 0.91 |
| Fractal Dimension | −0.37 | 0.01 |
| Circle Factor | −0.19 | 0.20 |
© 2020 by the authors. Licensee MDPI, Basel, Switzerland. This article is an open access article distributed under the terms and conditions of the Creative Commons Attribution (CC BY) license (http://creativecommons.org/licenses/by/4.0/).
Share and Cite
Kliś, K.M.; Krzyżewski, R.M.; Kwinta, B.M.; Stachura, K.; Popiela, T.J.; Gąsowski, J.; Długopolski, J. Relation of Intracerebral Hemorrhage Descriptors with Clinical Factors. Brain Sci. 2020, 10, 252. https://doi.org/10.3390/brainsci10040252
Kliś KM, Krzyżewski RM, Kwinta BM, Stachura K, Popiela TJ, Gąsowski J, Długopolski J. Relation of Intracerebral Hemorrhage Descriptors with Clinical Factors. Brain Sciences. 2020; 10(4):252. https://doi.org/10.3390/brainsci10040252
Chicago/Turabian StyleKliś, Kornelia M., Roger M. Krzyżewski, Borys M. Kwinta, Krzysztof Stachura, Tadeusz J. Popiela, Jerzy Gąsowski, and Jacek Długopolski. 2020. "Relation of Intracerebral Hemorrhage Descriptors with Clinical Factors" Brain Sciences 10, no. 4: 252. https://doi.org/10.3390/brainsci10040252
APA StyleKliś, K. M., Krzyżewski, R. M., Kwinta, B. M., Stachura, K., Popiela, T. J., Gąsowski, J., & Długopolski, J. (2020). Relation of Intracerebral Hemorrhage Descriptors with Clinical Factors. Brain Sciences, 10(4), 252. https://doi.org/10.3390/brainsci10040252