Time Window of Perturbation-Induced Response Triggered by Ankle Motion and Body Sway above the Ankle


Abstract
1. Introduction
2. Materials and Methods
2.1. Participants
2.2. Measurements
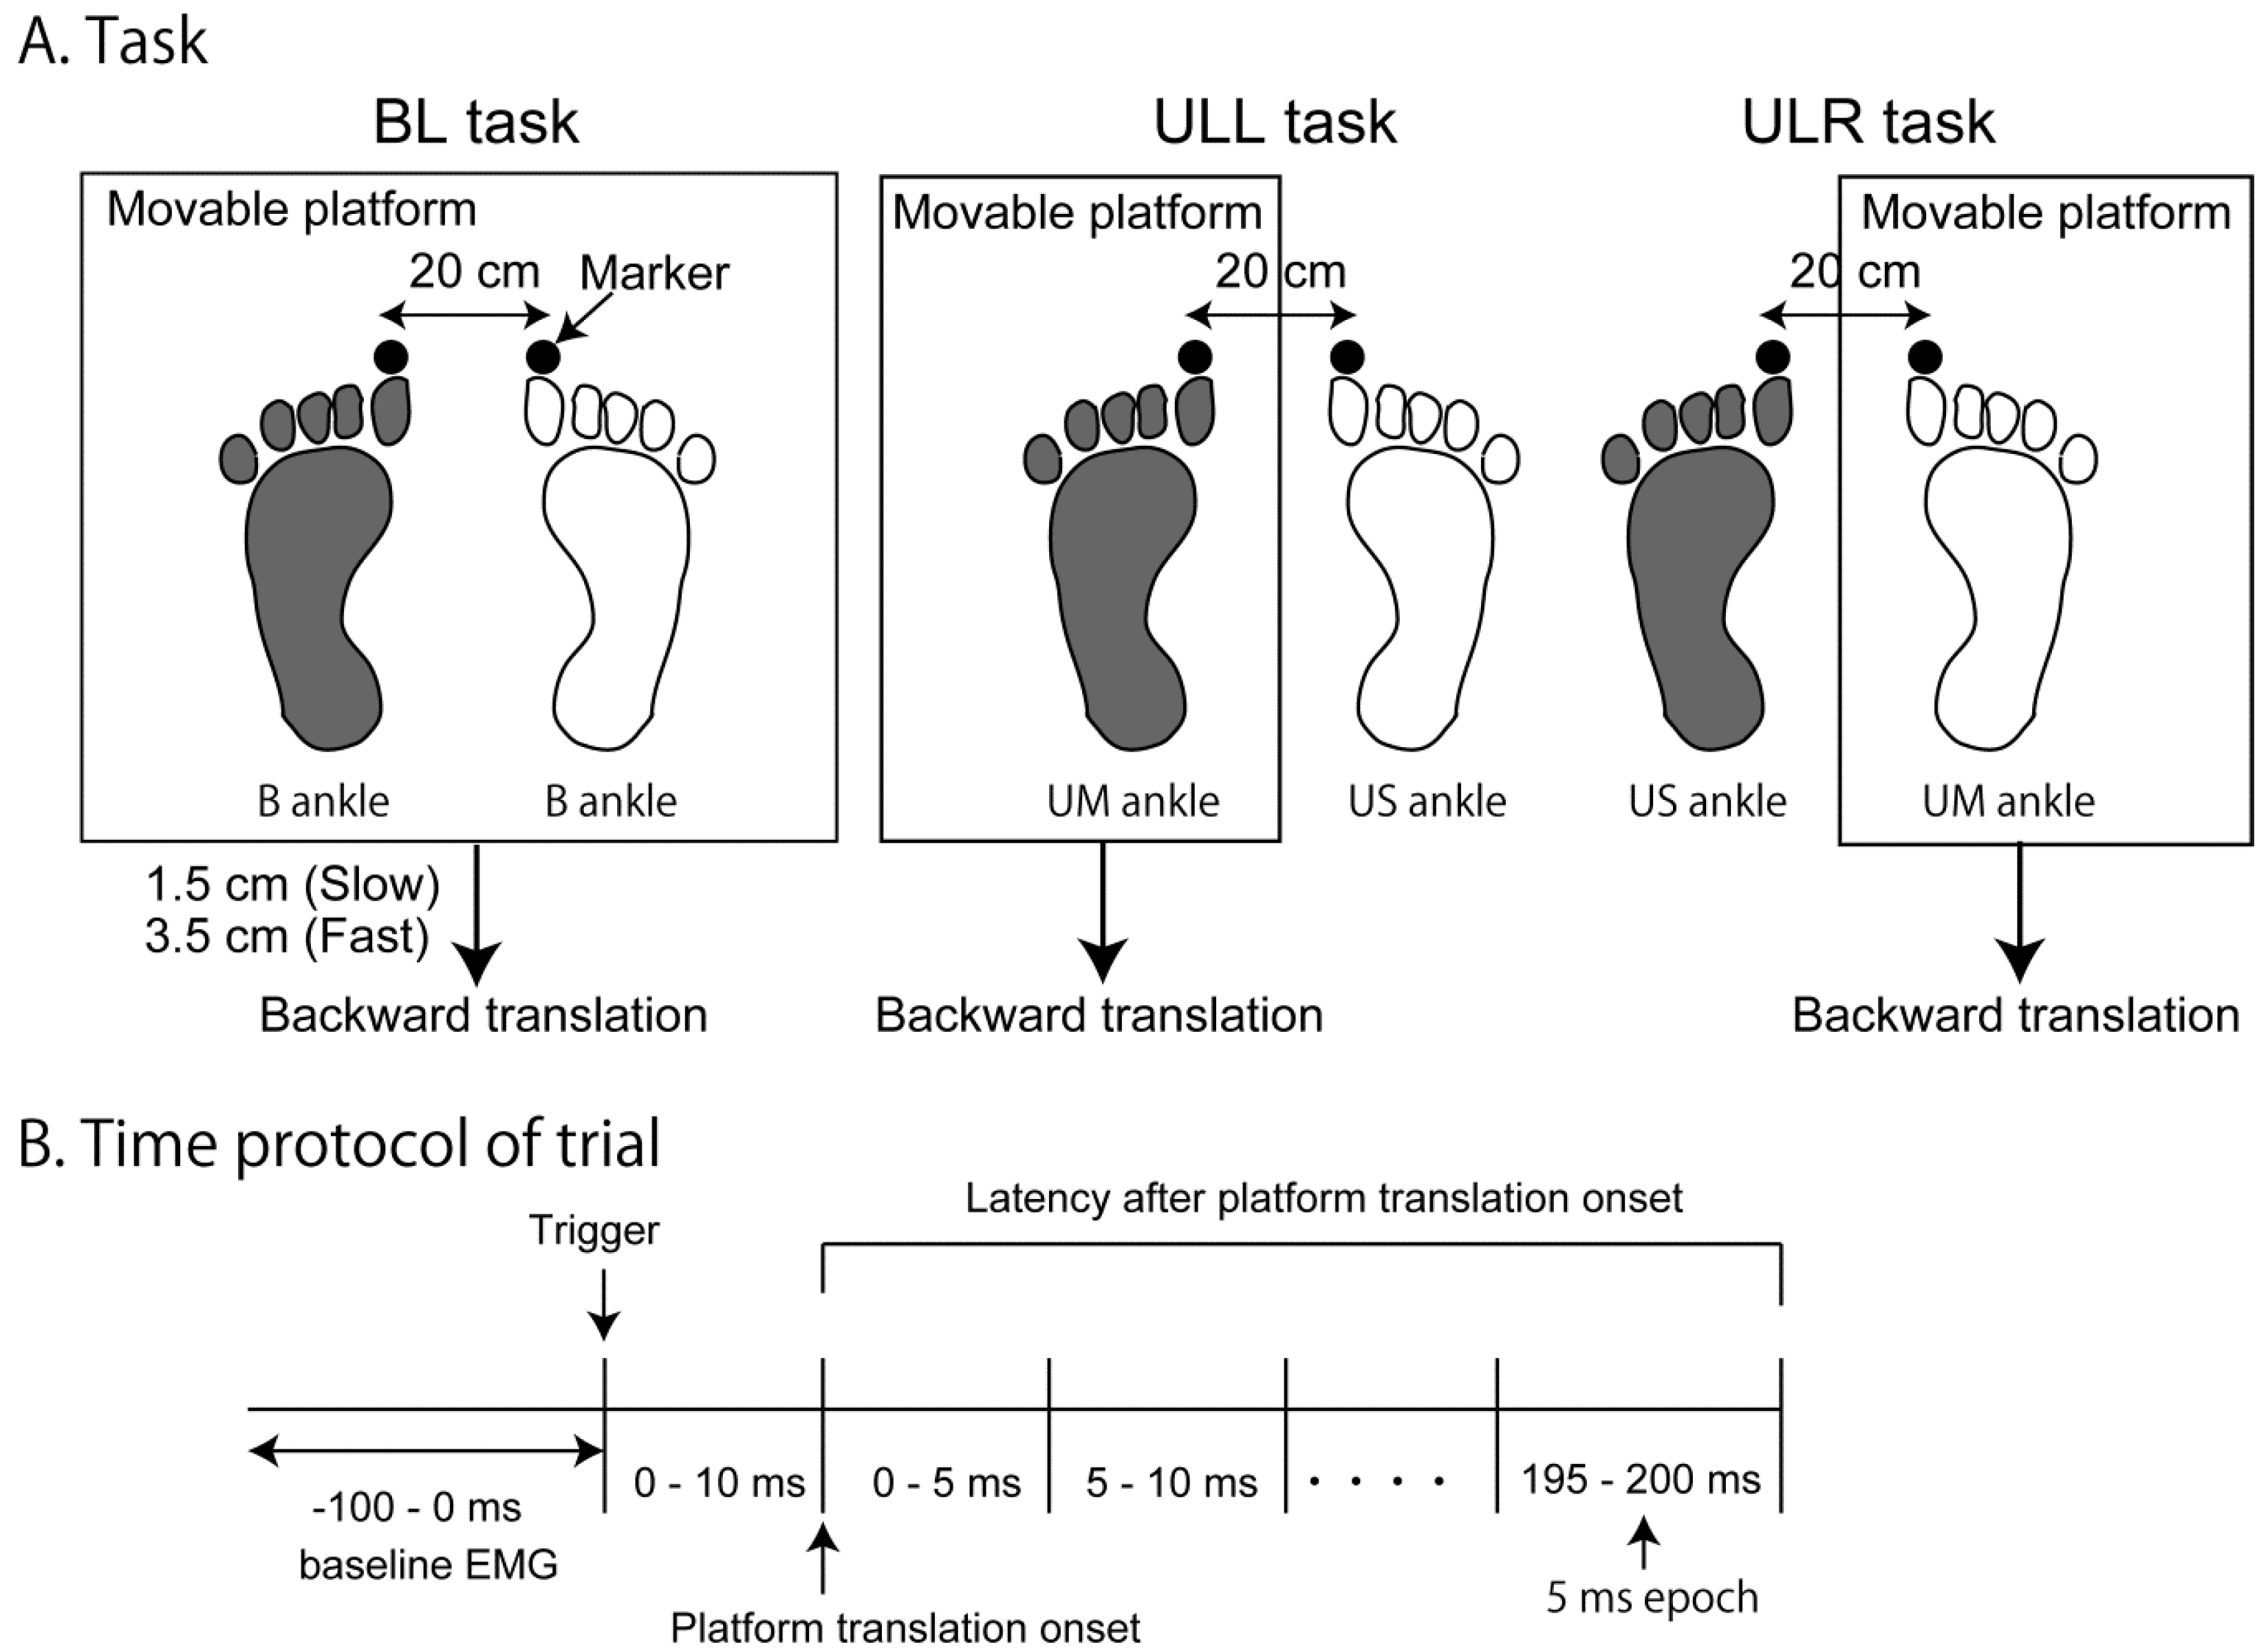
2.3. Procedure
2.4. Data Analysis
3. Results
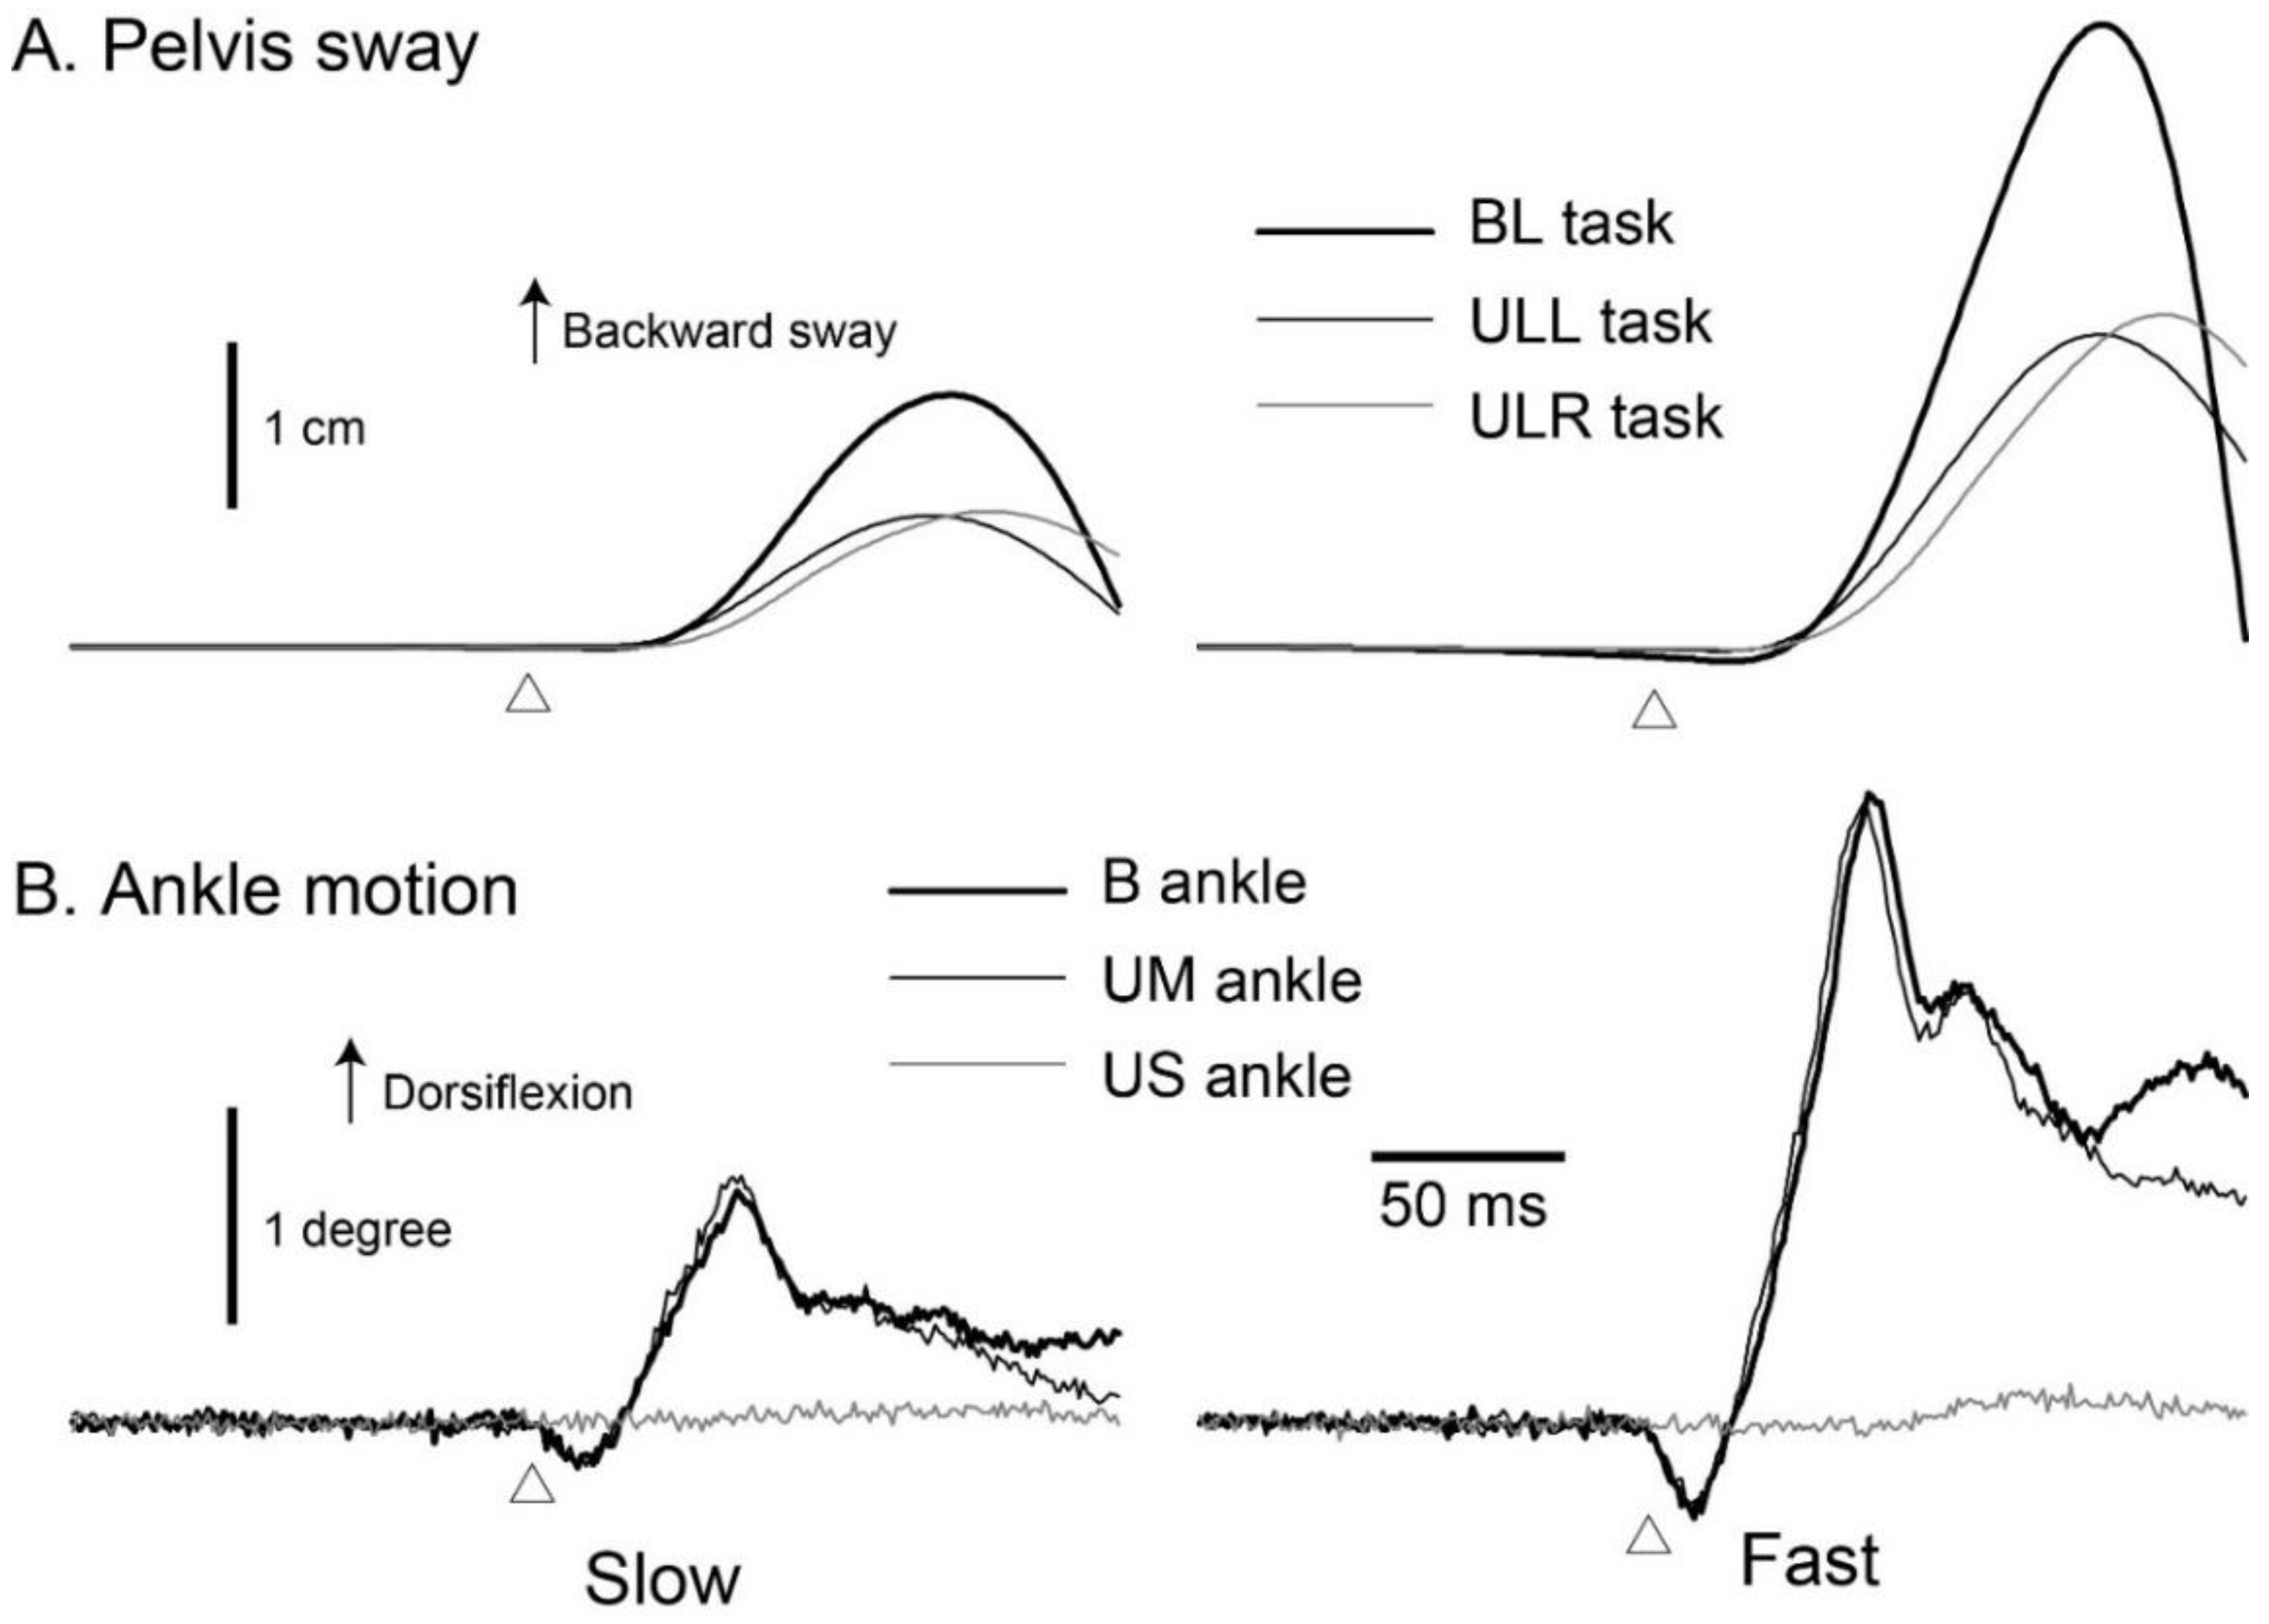
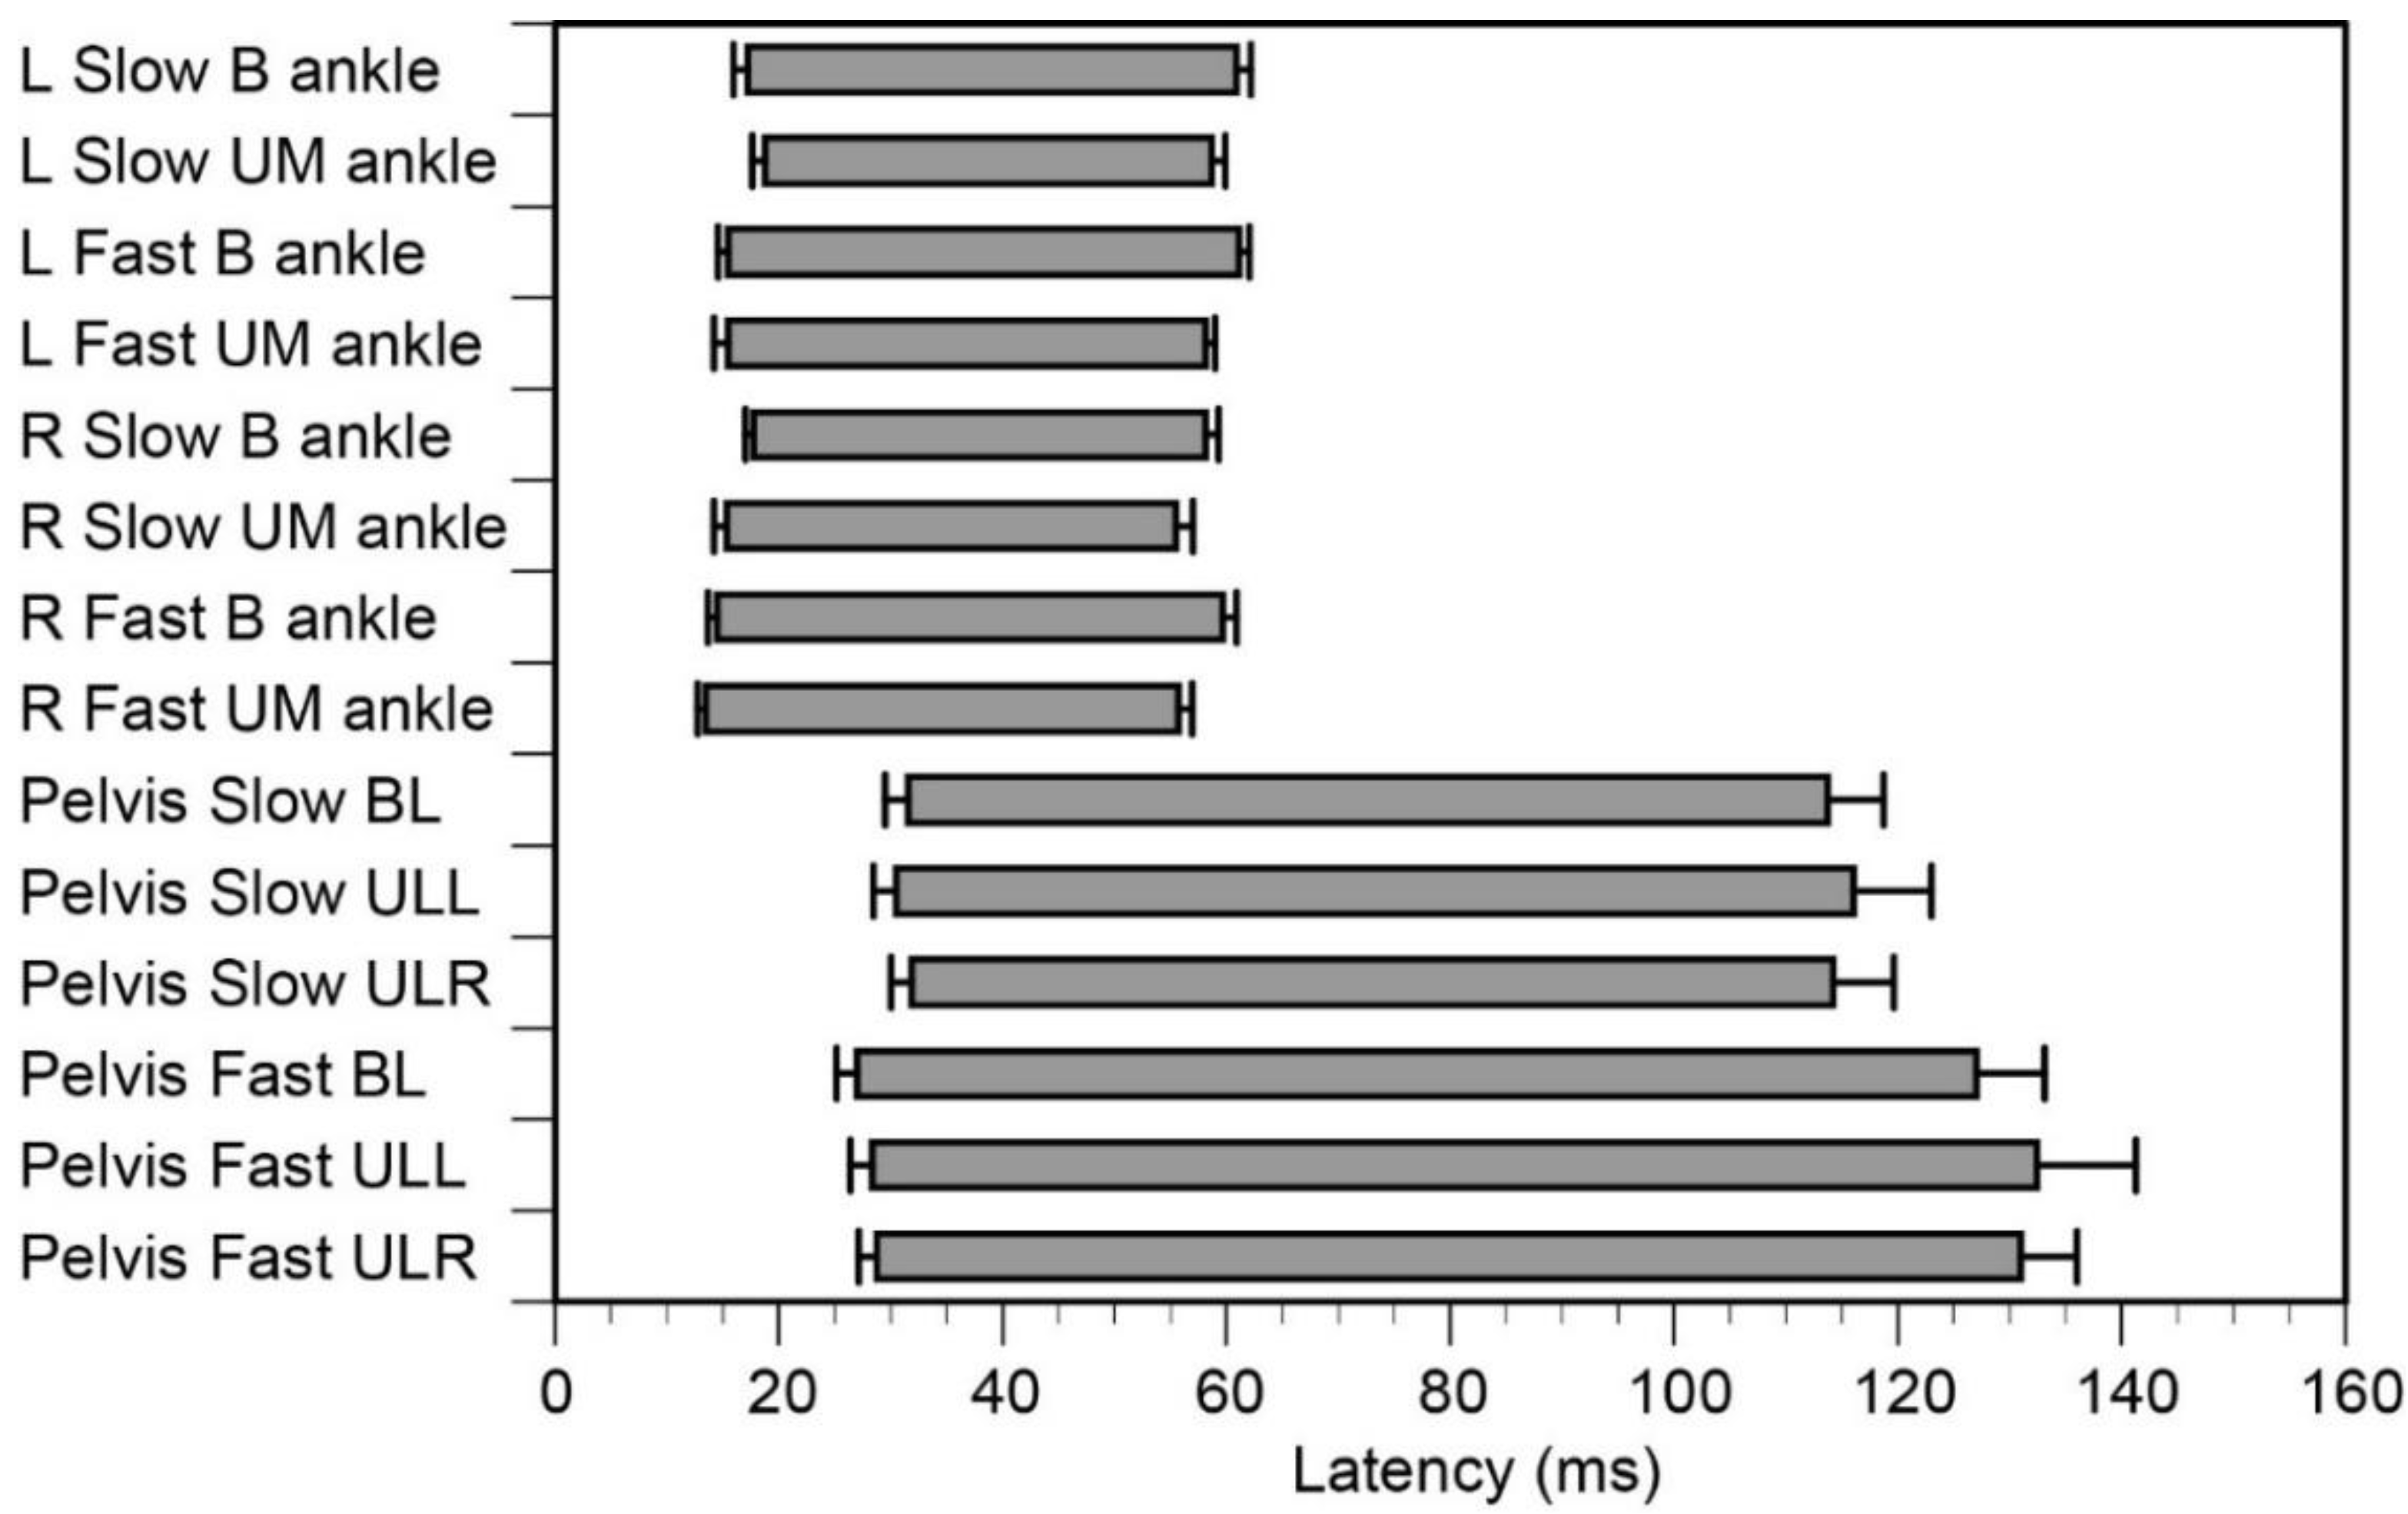
3.1. Pelvis Sway
3.2. Ankle Motion
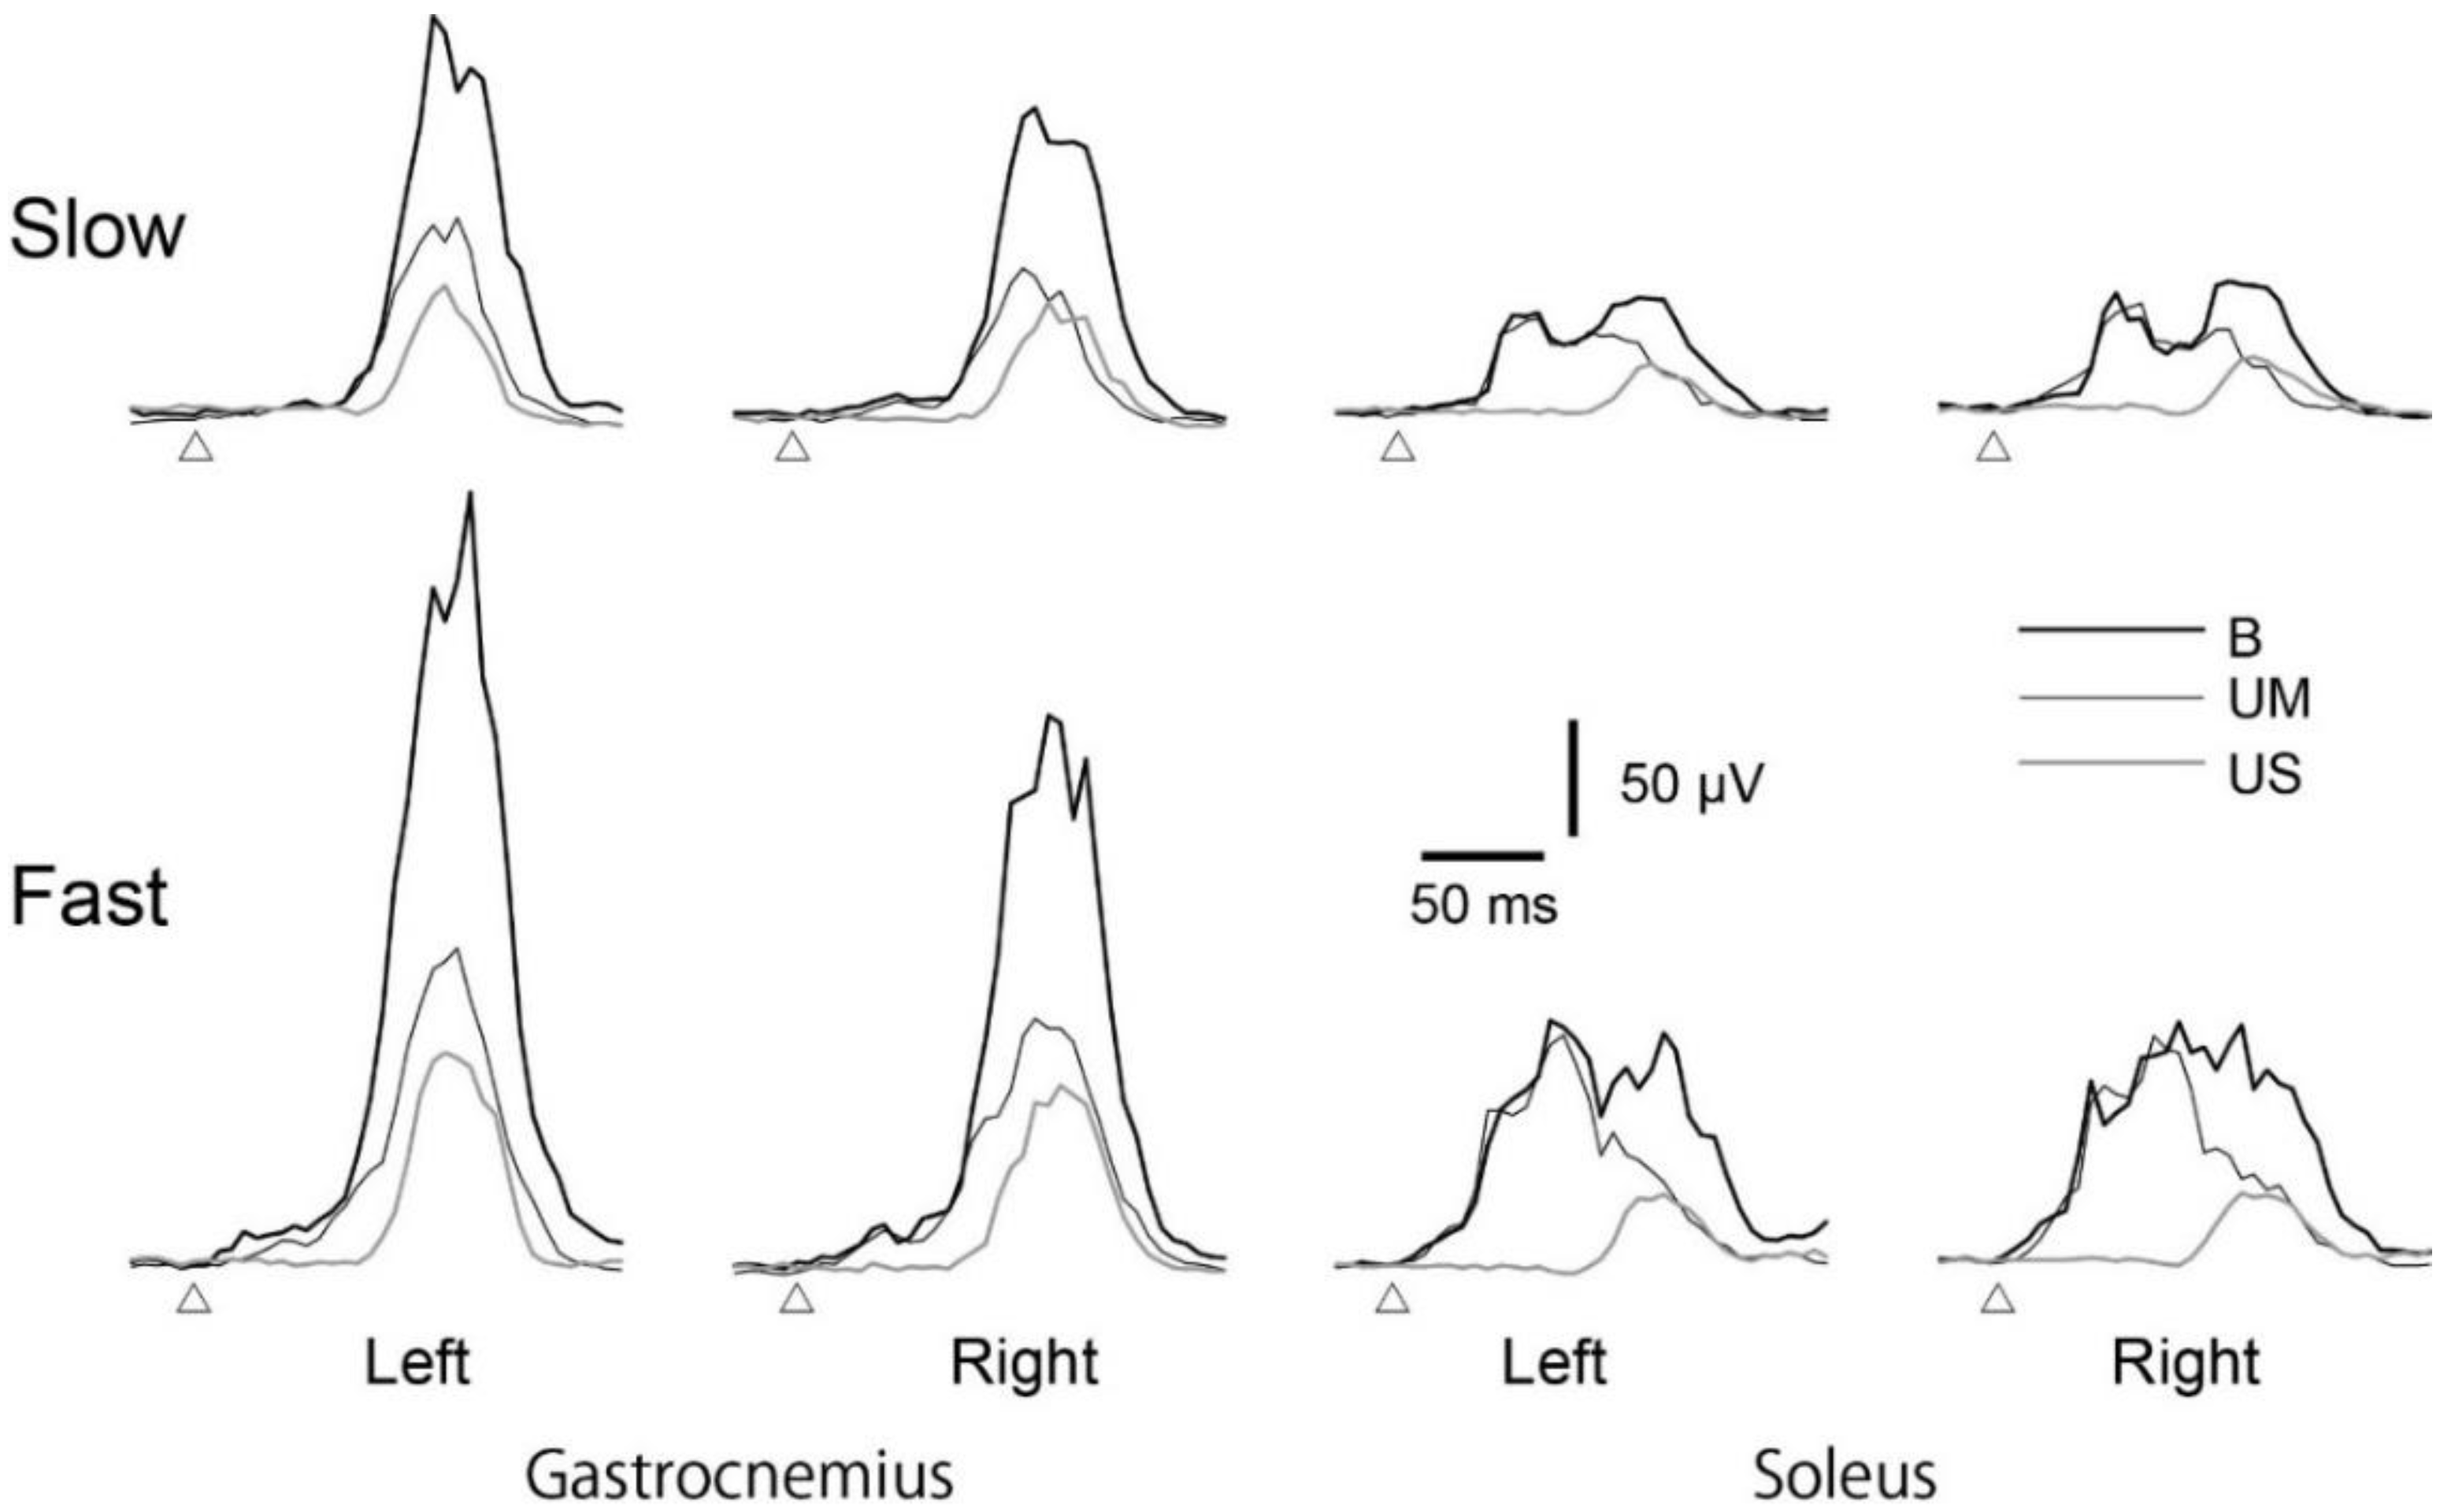
3.3. Average EMG Traces
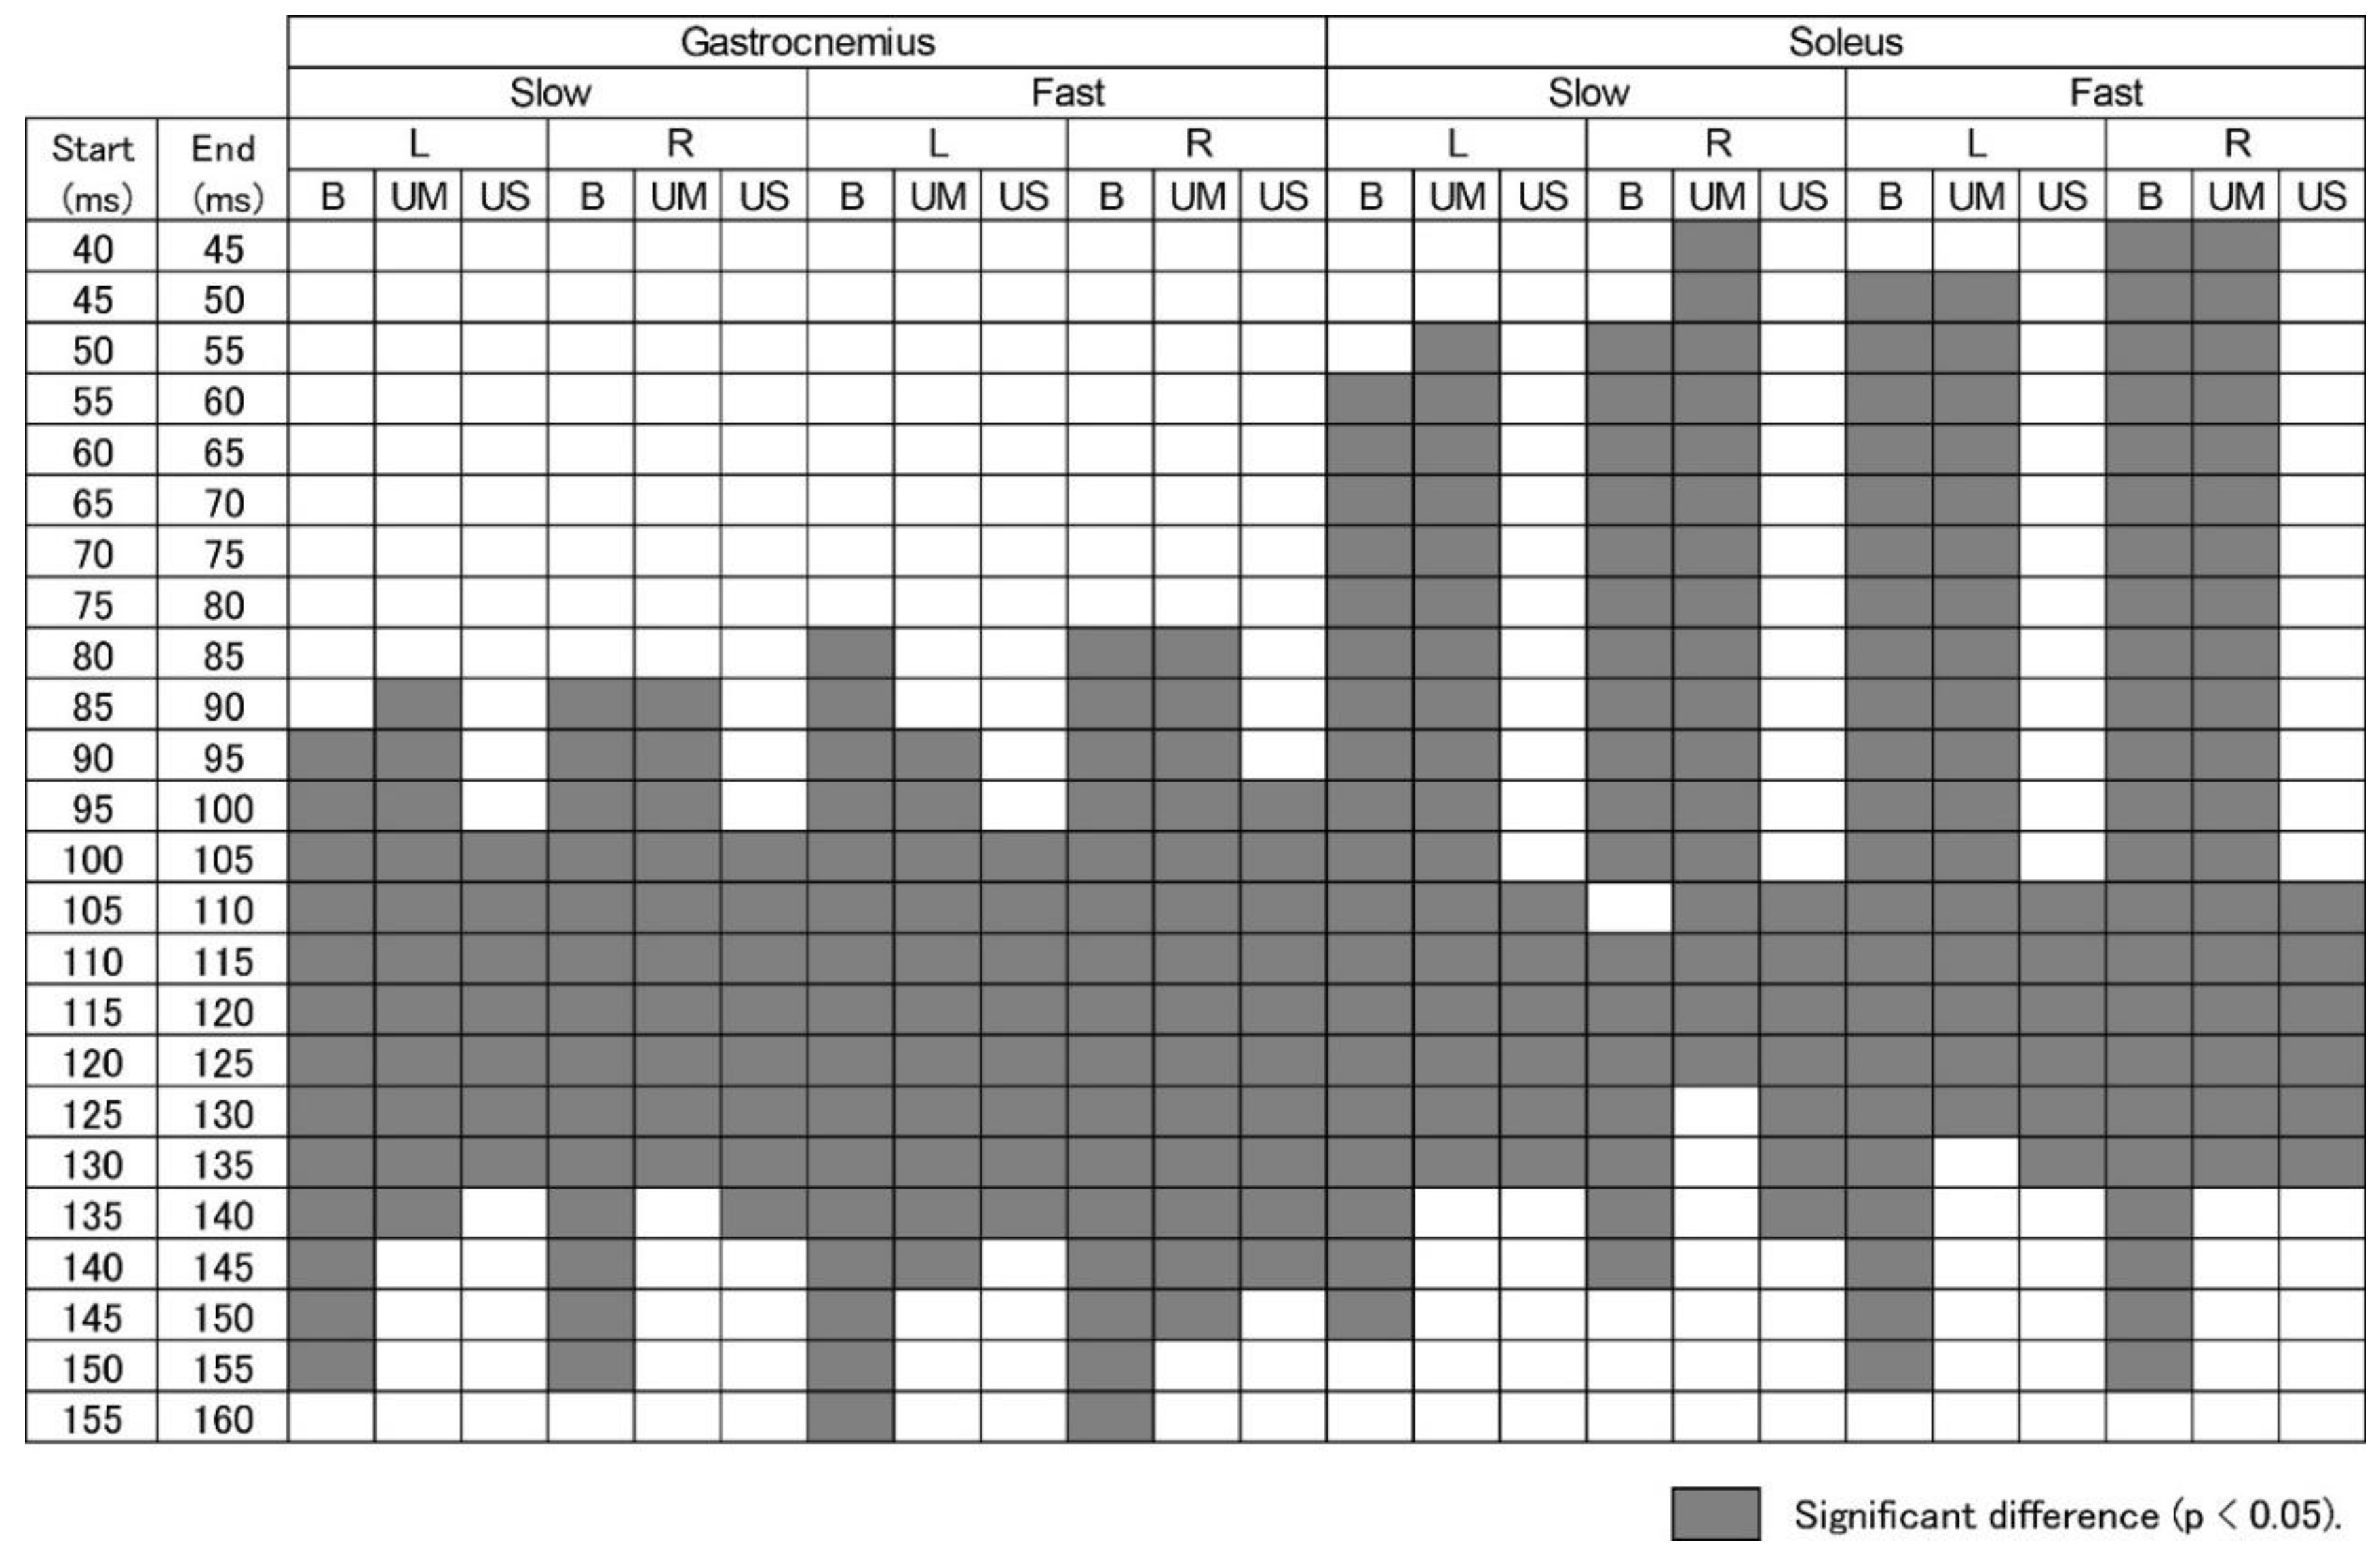
3.4. Time Epochs of EMG Response
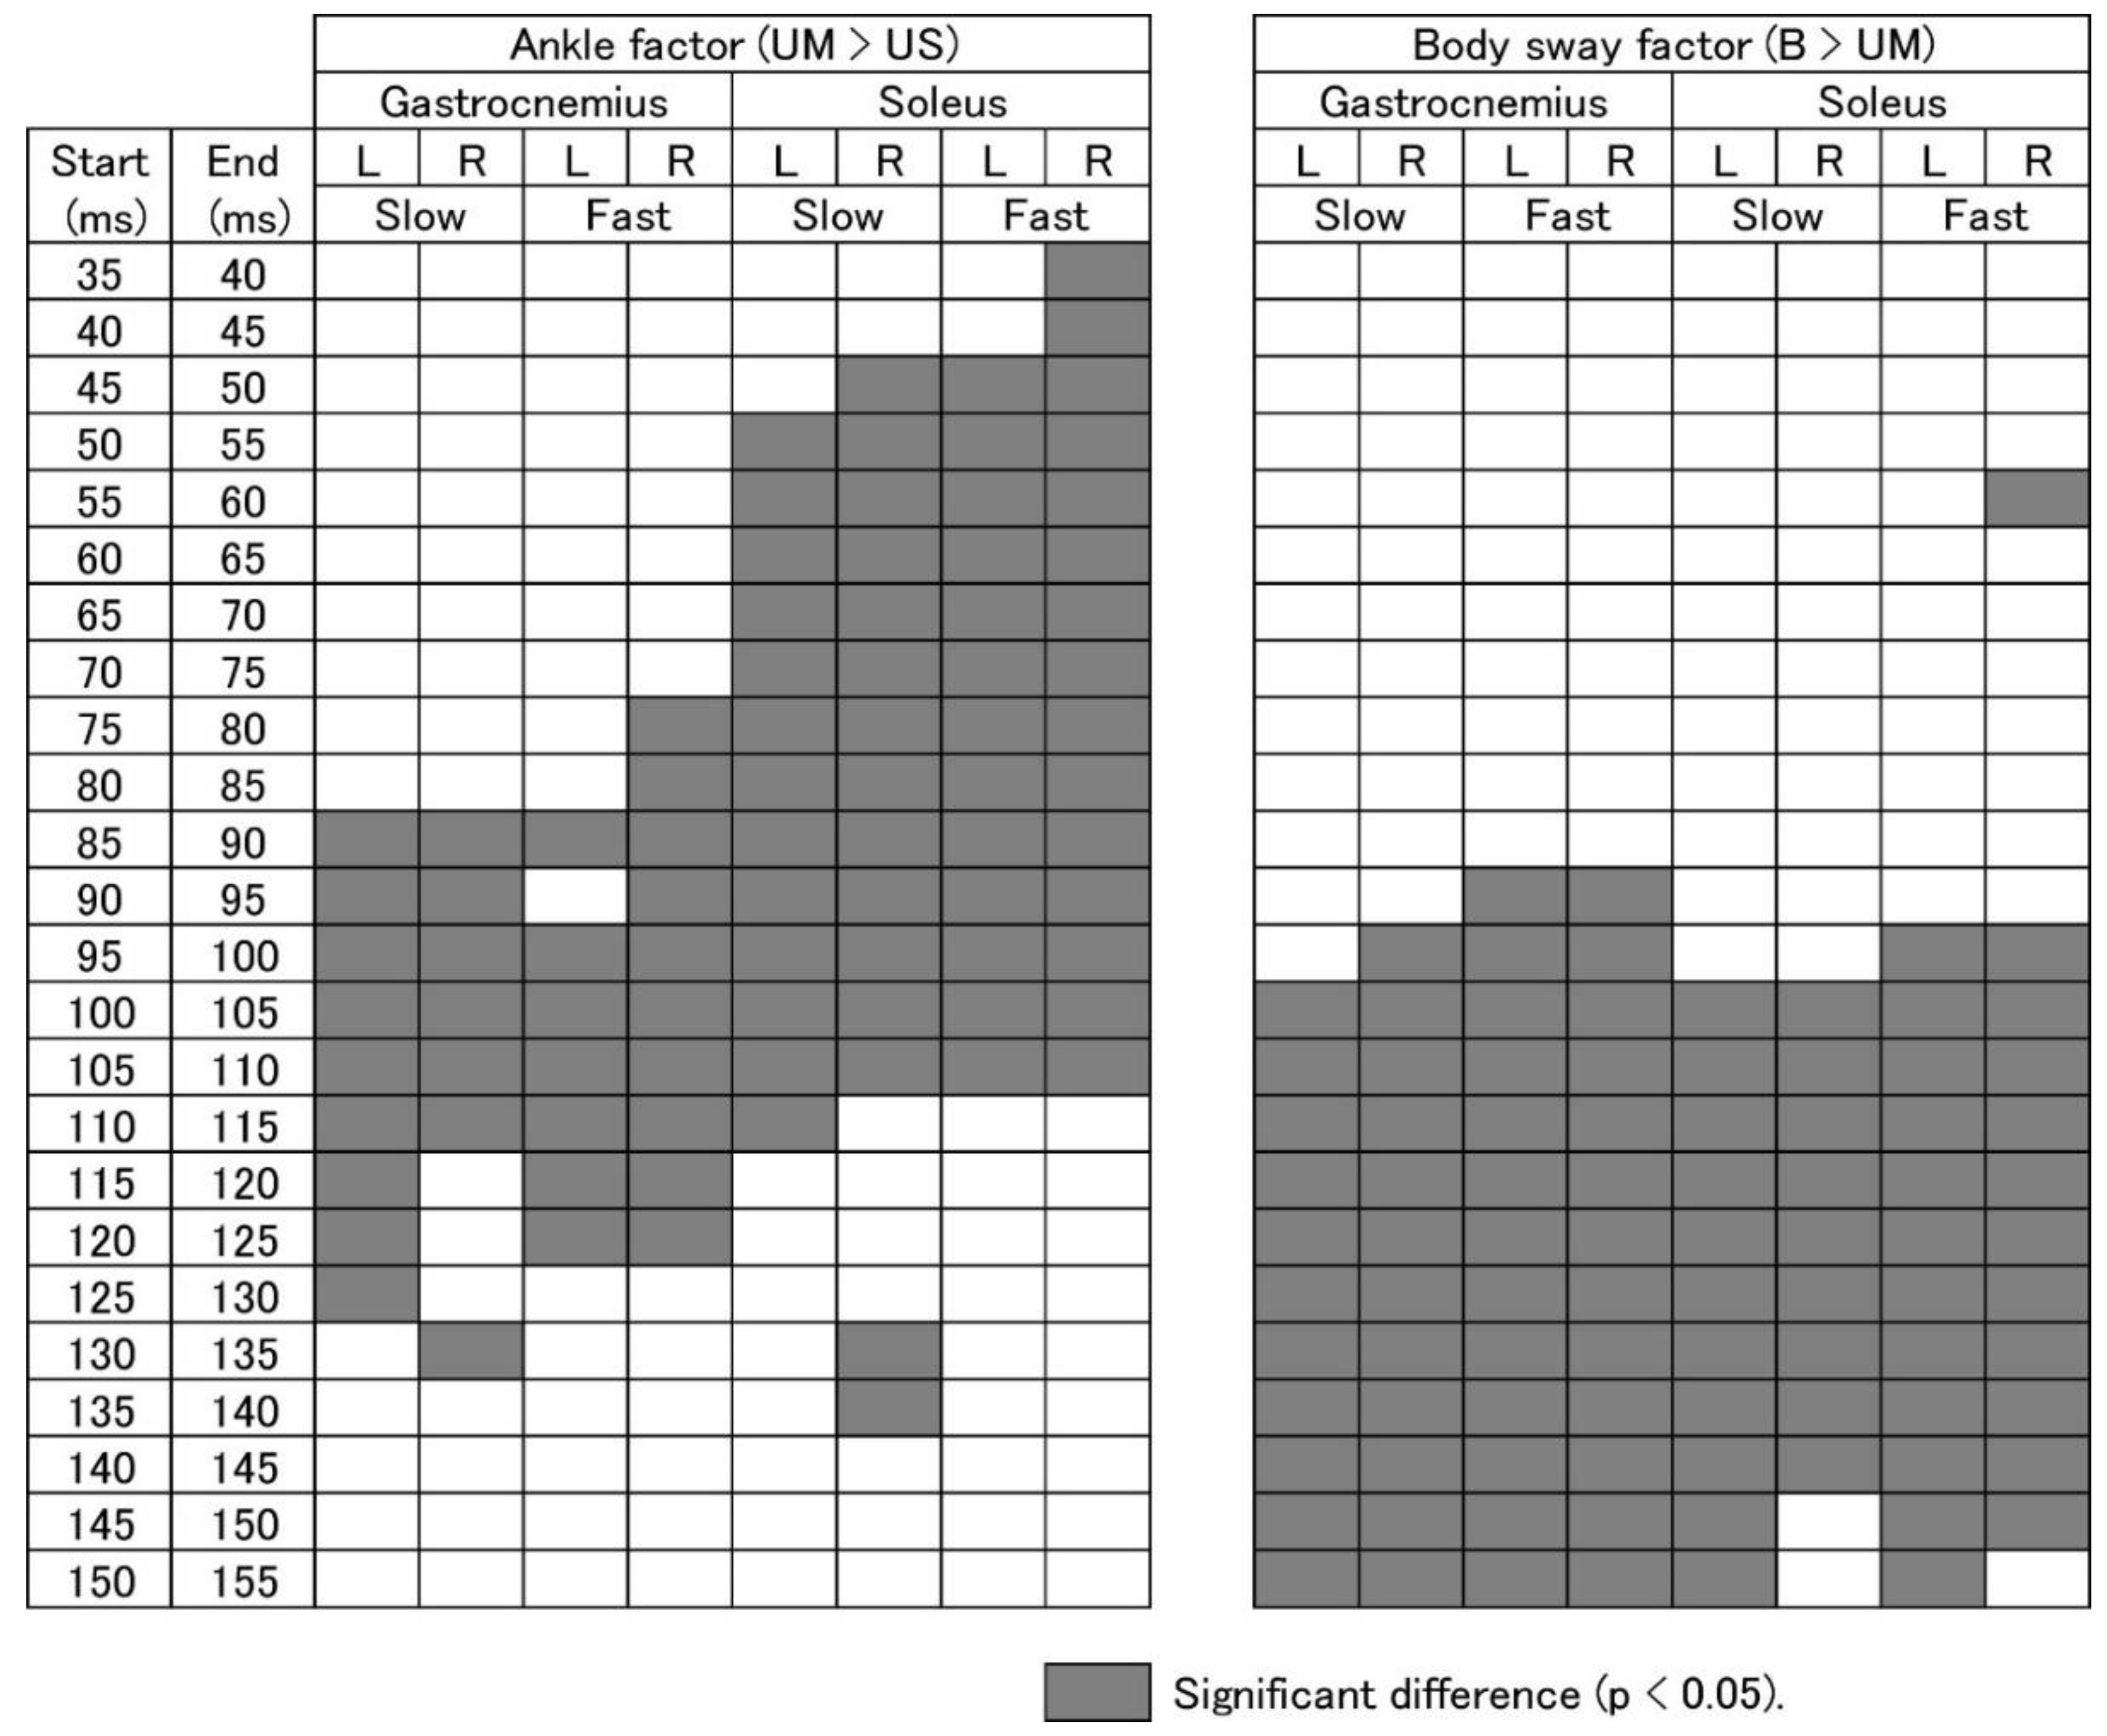
3.5. EMG Response Triggered by Ankle Motion
3.6. EMG Response Triggered by Body Sway
4. Discussion
4.1. Methodological Consideration
4.2. Crossed Afferent Inhibition
4.3. Response Preparation
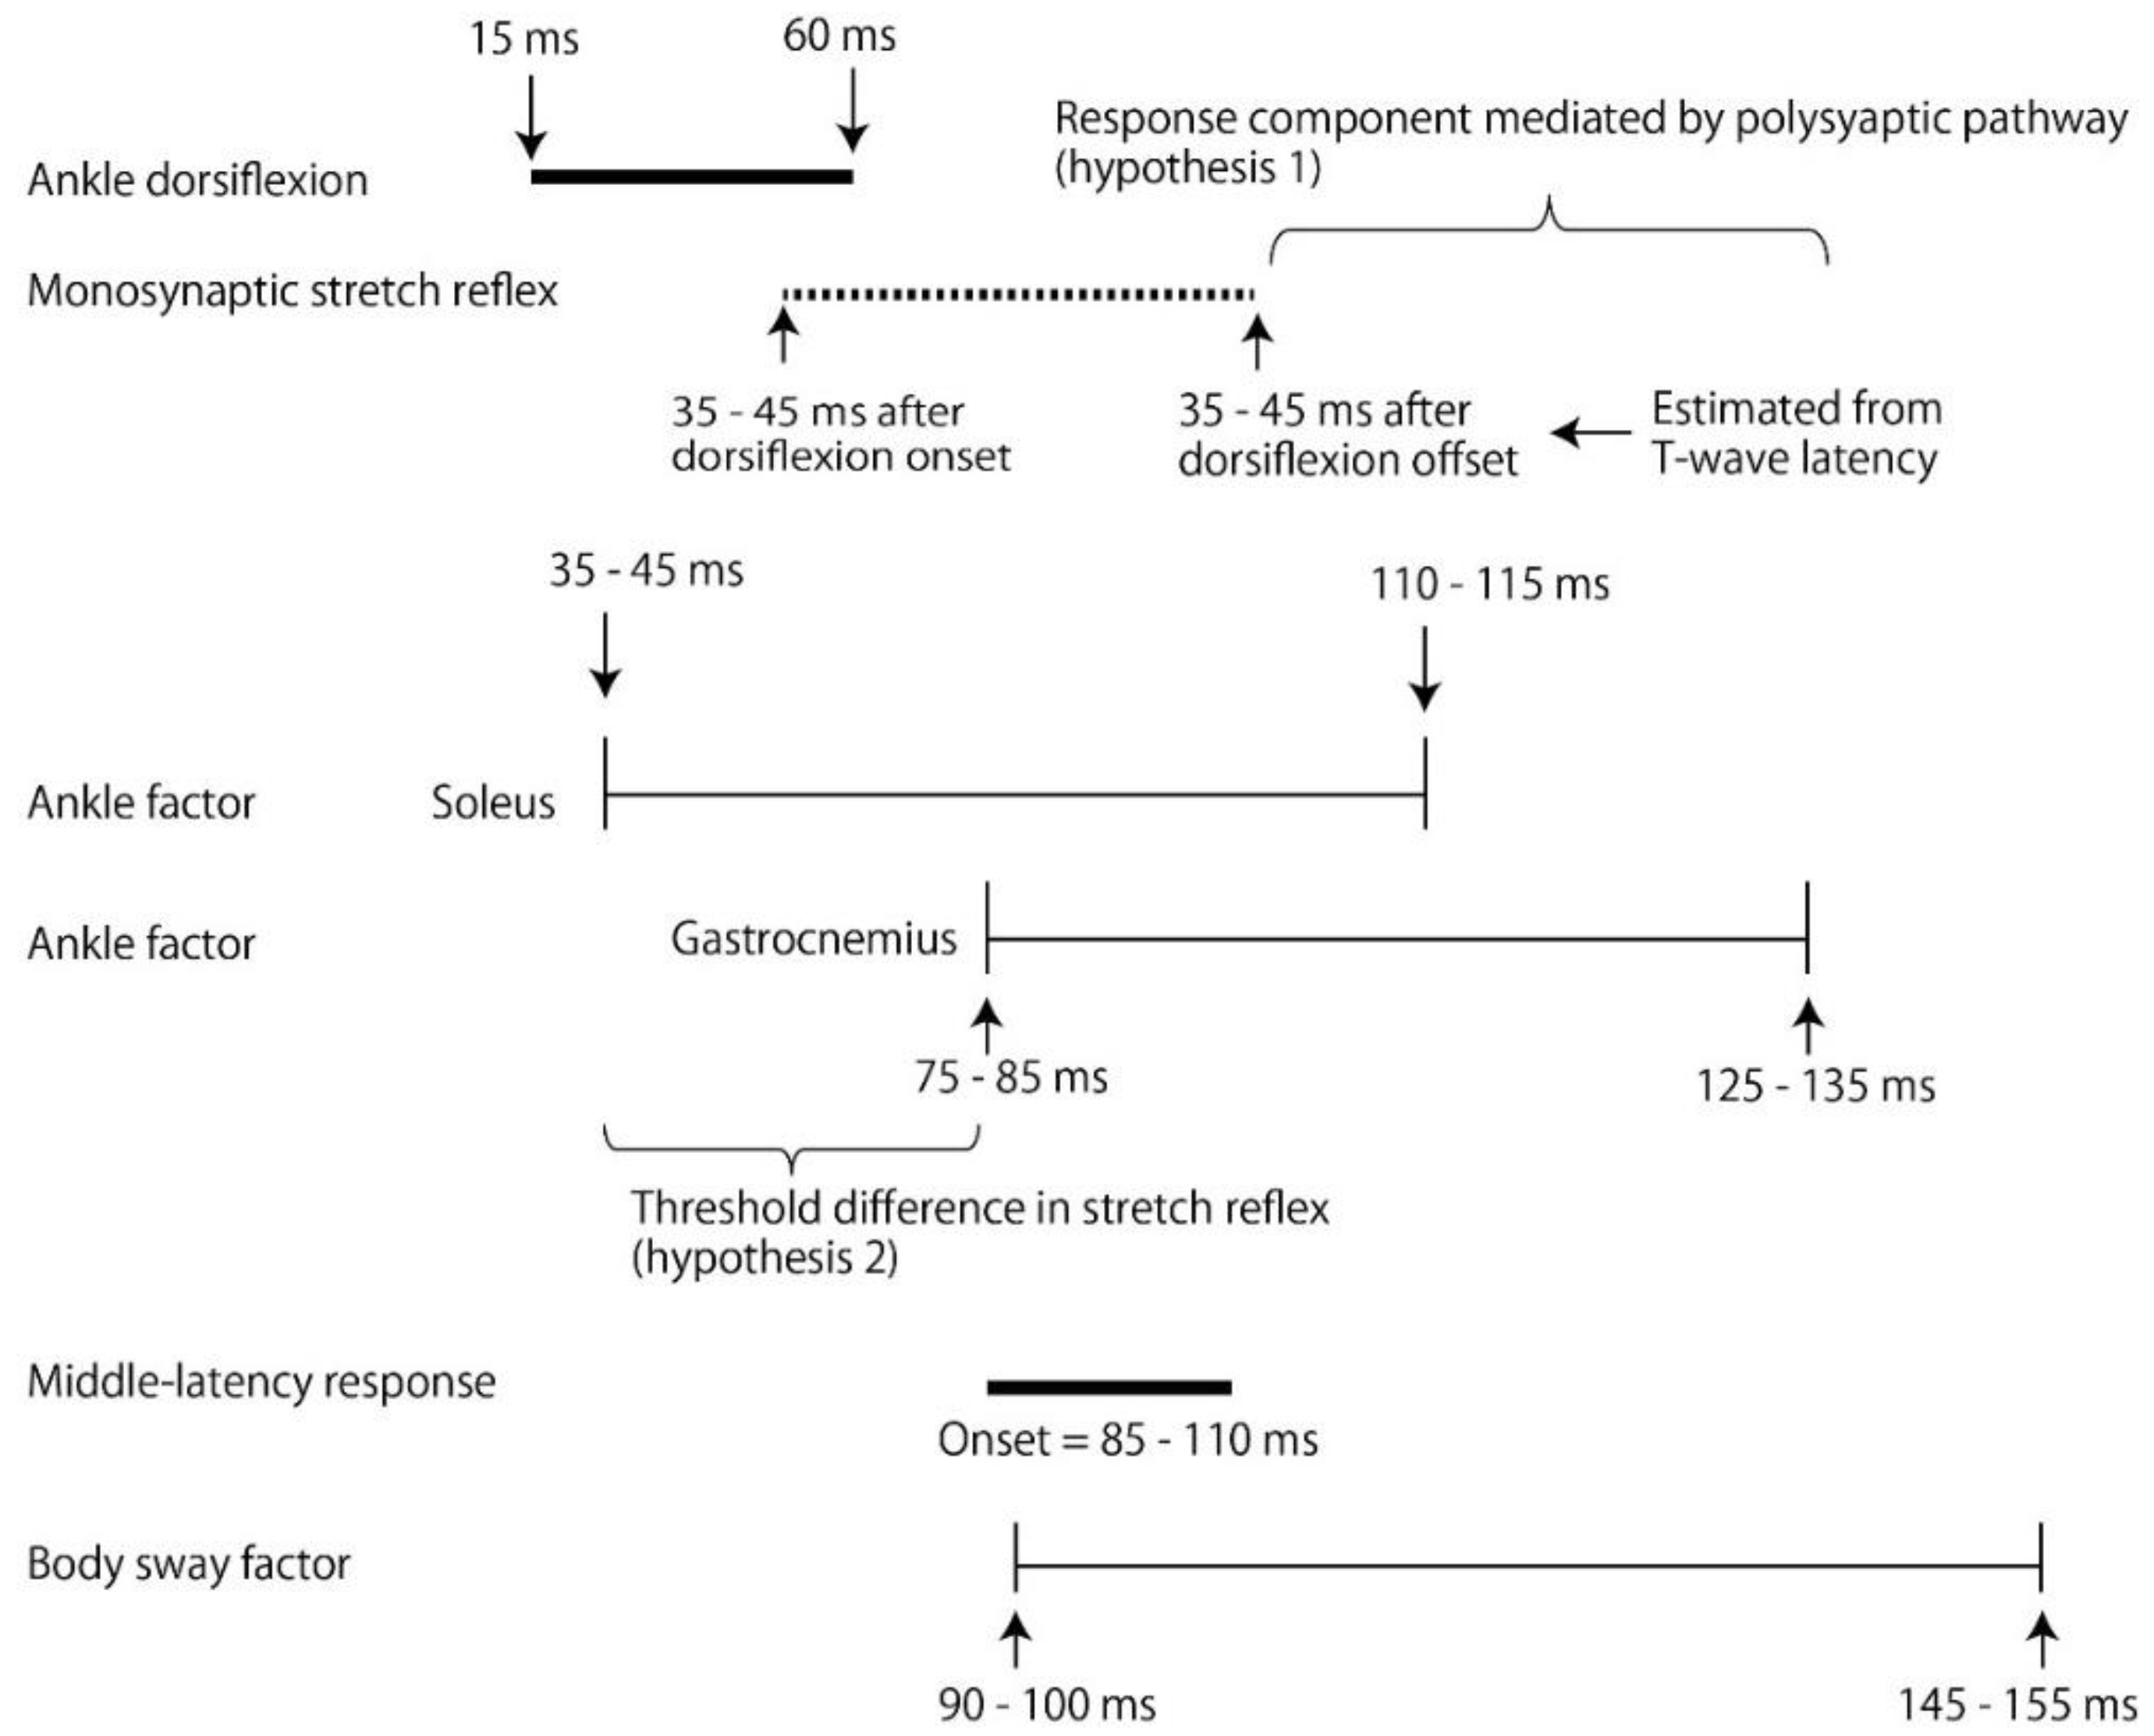
4.4. Response Triggered by Ankle Motion
4.5. Contribution of Polysynaptic Pathway
4.6. Response without Ankle Motion
4.7. Response to Body Sway above Ankle
4.8. Middle-Latency Response
5. Conclusions
Author Contributions
Funding
Conflicts of Interest
References
- Allum, J.H.J.; Honegger, F. Interactions between vestibular and proprioceptive inputs triggering and modulating human balance-correcting responses differ across muscles. Exp. Brain Res. 1998, 121, 478–494. [Google Scholar] [CrossRef] [PubMed]
- Bloem, B.R.; Allum, J.H.J.; Carpenter, M.G.; Honegger, F. Is lower leg proprioception essential for triggering human automatic postural responses? Exp. Brain Res. 2000, 130, 375–391. [Google Scholar] [CrossRef] [PubMed]
- Bloem, B.; Allum, J.H.J.; Carpenter, M.; Verschuuren, J.J.G.M.; Honegger, F. Triggering of balance corrections and compensatory strategies in a patient with total leg proprioceptive loss. Exp. Brain Res. 2002, 142, 91–107. [Google Scholar] [CrossRef] [PubMed]
- Chen, C.L.; Lou, S.Z.; Wu, H.W.; Wu, S.K.; Yeung, K.T.; Su, F.C. Effects of the type and direction of support surface perturbation on postural responses. J. Neuroeng. Rehabil. 2014, 11, 50. [Google Scholar] [CrossRef]
- Keshner, E.A.; Woollacott, M.H.; Debu, B. Neck, trunk and limb muscle responses during postural perturbations in humans. Exp. Brain Res. 1988, 71, 455–466. [Google Scholar] [CrossRef]
- Dietz, V.; Horstmann, G.A.; Berger, W. Interlimb coordination of leg-muscle activation during perturbation of stance in humans. J. Neurophysiol. 1989, 62, 680–693. [Google Scholar] [CrossRef]
- Dietz, V.; Schmidtbleicher, D.; Noth, J. Neuronal mechanisms of human locomotion. J. Neurophysiol. 1979, 42, 1212–1222. [Google Scholar] [CrossRef]
- Taube, W.; Schubert, M.; Gruber, M.; Beck, S.; Faist, M.; Gollhofer, A. Direct corticospinal pathways contribute to neuromuscular control of perturbed stance. J. Appl. Physiol. 2006, 101, 420–429. [Google Scholar] [CrossRef]
- Schieppati, M.; Nardone, A. Medium latency stretch reflexes of foot and leg muscles analyzed by cooling the lower limb in standing humans. J. Physiol. 1997, 503, 691–698. [Google Scholar] [CrossRef]
- Nardone, A.; Corra, T.; Schieppati, M. Different activations of the soleus and gastrocnemii muscles in response to various types of stance perturbation in man. Exp. Brain Res. 1990, 80, 323–332. [Google Scholar] [CrossRef]
- Frijns, C.J.M.; Laman, D.M.; Van, D.; Van, M.A.J.; Duijn, H. Normal values of patellar and ankle tendon reflex latencies. Clin. Neurol. Neurosurg. 1997, 99, 31–36. [Google Scholar] [CrossRef]
- Kandel, E.R.; Schwartz, J.H.; Jessell, T.M. Principles of Neural Science; McGraw-Hill, Health Professions Division: New York, NY, USA, 2000. [Google Scholar]
- Cronin, N.J.; Avela, J.; Finni, T.; Peltonen, J. Differences in contractile behaviour between the soleus and medial gastrocnemius muscles during human walking. J. Exp. Biol. 2013, 216, 909–914. [Google Scholar] [CrossRef] [PubMed]
- Burke, R.E. Motor unit types of cat triceps surae muscle. J. Physiol. 1967, 193, 141–160. [Google Scholar] [CrossRef] [PubMed]
- Héroux, M.E.; Dakin, C.J.; Luu, B.L.; Inglis, J.T.; Blouin, J.S. Absence of lateral gastrocnemius activity and differential motor unit behavior in soleus and medial gastrocnemius during standing balance. J. Appl. Physiol. 2013, 116, 140–148. [Google Scholar] [CrossRef] [PubMed]
- Dakin, C.J.; Heroux, M.E.; Luu, B.L.; Inglis, J.T.; Blouin, J.S. Vestibular contribution to balance control in the medial gastrocnemius and soleus. Am. J. Physiol. Heart Circ. Physiol. 2015, 115, 1289–1297. [Google Scholar] [CrossRef]
- Elias, L.A.; Watanabe, R.N.; Kohn, A.F. Spinal mechanisms may provide a combination of intermittent and continuous control of human posture: Predictions from a biologically based neuromusculoskeletal model. PLoS Comput. Biol. 2014, 10, e1003944. [Google Scholar] [CrossRef]
- Tucker, K.J.; Türker, K.S. Muscle spindle feedback differs between the soleus and gastrocnemius in humans. Somatosens. Mot. Res. 2004, 21, 189–197. [Google Scholar] [CrossRef]
- Banks, R.W. An allometric analysis of the number of muscle spindles in mammalian skeletal muscles. J. Anat. 2006, 208, 753–768. [Google Scholar] [CrossRef]
- Elias, L.J.; Bryden, M.P.; Bulman-Fleming, M.B. Footedness is a better predictor than is handedness of emotional lateralization. Neuropsychologia 1998, 36, 37–43. [Google Scholar] [CrossRef]
- Zverev, Y.P. Spatial parameters of walking gait and footedness. Ann. Hum. Biol. 2006, 33, 161–176. [Google Scholar] [CrossRef]
- Kunimura, H.; Matsuoka, M.; Hamada, N.; Hiraoka, K. Effort to perceive the position of one visual horizontal line relative to another appearing close causes an earlier postural response to backward perturbation. NeuroReport 2019, 30, 151–156. [Google Scholar] [CrossRef] [PubMed]
- Mancini, M.; Zampieri, C.; Carlson-Kuhta, P.; Chiari, L.; Horak, F.B. Anticipatory postural adjustments prior to step initiation are hypometric in untreated Parkinson’s disease: An accelerometer-based approach. Eur. J. Neurol. 2009, 16, 1028–1034. [Google Scholar] [CrossRef] [PubMed]
- Zijlstra, W. Assessment of spatio-temporal parameters during unconstrained walking. Eur. J. Appl. Physiol. 2004, 92, 39–44. [Google Scholar] [CrossRef] [PubMed]
- Nashner, L.M. Fixed patterns of rapid postural responses among leg muscles during stance. Exp. Brain Res. 1977, 30, 13–24. [Google Scholar] [CrossRef] [PubMed]
- Diener, H.C.; Horak, F.B.; Nashner, L.M. Influence of stimulus parameters on human postural responses. J. Neurophysiol. 1988, 59, 1888–1905. [Google Scholar] [CrossRef] [PubMed]
- Horak, F.B.; Nashner, L.M. Central programming of postural movements: Adaptation to altered support-surface configurations. J. Neurophysiol. 1986, 55, 1369–1381. [Google Scholar] [CrossRef]
- Morey-Klapsing, G.; Arampatzis, A.; Brüggemann, G.P. Choosing EMG parameters: Comparison of different onset determination algorithms and EMG integrals in a joint stability study. Clin. Biomech. 2004, 19, 196–201. [Google Scholar] [CrossRef]
- Stubbs, P.W.; Mrachacz-Kersting, N. Short latency crossed inhibitory responses in the human soleus muscle. J. Neurophysiol. 2009, 102, 3596–3605. [Google Scholar] [CrossRef]
- Stubbs, P.W.; Nielsen, J.F.; Sinkjær, T.; Mrachacz-Kersting, N. Crossed spinal soleus muscle communication demonstrated by H-reflex conditioning. Muscle Nerve. 2011, 43, 845–850. [Google Scholar] [CrossRef]
- Jacobs, J.V.; Horak, F.B. Cortical control of postural responses. J. Neural. Transm. 2007, 114, 1339–1348. [Google Scholar] [CrossRef]
- Jacobs, J.V.; Fujiwara, K.; Tomita, H.; Furune, N.; Kunita, K.; Horak, F.B. Changes in the activity of the cerebral cortex relate to postural response modification when warned of a perturbation. Clin. Neurophysiol. 2008, 119, 1431–1442. [Google Scholar] [CrossRef] [PubMed]
- Horak, F.B.; Diener, H.C.; Nashner, L.M. Influence of central set on human postural responses. J. Neurophysiol. 1989, 62, 841–853. [Google Scholar] [CrossRef] [PubMed]
- Honeycutt, C.F.; Nichols, T.R. Disruption of cutaneous feedback alters magnitude but not direction of muscle responses to postural perturbations in the decerebrate cat. Exp. Brain Res. 2010, 203, 765–771. [Google Scholar] [CrossRef] [PubMed]
- Grey, M.J.; Ladouceur, M.; Andersen, J.B.; Nielsen, J.B.; Sinkjær, T. Group II muscle afferents probably contribute to the medium latency soleus stretch reflex during walking in humans. J. Physiol. 2001, 534, 925–933. [Google Scholar] [CrossRef] [PubMed]


| df | F | p-Value | |
|---|---|---|---|
| Task | 2 | 93.379 | <0.001 |
| Velocity | 1 | 83.75 | <0.001 |
| Interaction | 2 | 42.941 | <0.001 |
| df | F | p-Value | ||
|---|---|---|---|---|
| Left | Ankle | 1 | 26.571 | <0.001 |
| Velocity | 1 | 128.252 | <0.001 | |
| Interaction | 1 | 8.593 | 0.011 | |
| Right | Ankle | 1 | 0.13 | 0.723 |
| Velocity | 1 | 84.054 | <0.001 | |
| Interaction | 1 | 0.025 | 0.878 |
| Slow | Fast | |||||
|---|---|---|---|---|---|---|
| df | F | p-Value | F | p-Value | ||
| Gastrocnemius | ||||||
| Left | Ankle | 2 | 33.583 | <0.001 | 37.818 | <0.001 |
| Delay | 40 | 25.836 | <0.001 | 24.366 | <0.001 | |
| Interaction | 80 | 13.764 | <0.001 | 12.051 | <0.001 | |
| Right | Ankle | 2 | 34.881 | <0.001 | 47.301 | <0.001 |
| Delay | 40 | 23.561 | <0.001 | 34.565 | <0.001 | |
| Interaction | 80 | 12.289 | <0.001 | 15.077 | <0.001 | |
| Soleus | ||||||
| Left | Ankle | 2 | 76.22 | <0.001 | 59.532 | <0.001 |
| Delay | 40 | 14.948 | <0.001 | 15.427 | <0.001 | |
| Interaction | 80 | 9.616 | <0.001 | 12.891 | <0.001 | |
| Right | Ankle | 2 | 34.671 | <0.001 | 84.443 | <0.001 |
| Delay | 40 | 24.188 | <0.001 | 20.797 | <0.001 | |
| Interaction | 80 | 10.676 | <0.001 | 13.53 | <0.001 | |
© 2020 by the authors. Licensee MDPI, Basel, Switzerland. This article is an open access article distributed under the terms and conditions of the Creative Commons Attribution (CC BY) license (http://creativecommons.org/licenses/by/4.0/).
Share and Cite
Hiraoka, K.; Kuramitsu, T.; Nii, N.; Osumi, M.; Tanaka, N. Time Window of Perturbation-Induced Response Triggered by Ankle Motion and Body Sway above the Ankle. Brain Sci. 2020, 10, 230. https://doi.org/10.3390/brainsci10040230
Hiraoka K, Kuramitsu T, Nii N, Osumi M, Tanaka N. Time Window of Perturbation-Induced Response Triggered by Ankle Motion and Body Sway above the Ankle. Brain Sciences. 2020; 10(4):230. https://doi.org/10.3390/brainsci10040230
Chicago/Turabian StyleHiraoka, Koichi, Toru Kuramitsu, Naoki Nii, Miyuki Osumi, and Nana Tanaka. 2020. "Time Window of Perturbation-Induced Response Triggered by Ankle Motion and Body Sway above the Ankle" Brain Sciences 10, no. 4: 230. https://doi.org/10.3390/brainsci10040230
APA StyleHiraoka, K., Kuramitsu, T., Nii, N., Osumi, M., & Tanaka, N. (2020). Time Window of Perturbation-Induced Response Triggered by Ankle Motion and Body Sway above the Ankle. Brain Sciences, 10(4), 230. https://doi.org/10.3390/brainsci10040230