1. Introduction
The residential buildings sector is known to be a main consumer of the thermal energy in the temperature range below 100 °C for various heating/cooling purposes. This temperature range refers to the generation of the ultra-low grade heat and fits the typical scope of thermal applications for the comfortable human living, for example space heating/cooling and domestic hot water preparation.
Consequently, every energy product used in a household is responsible for the greenhouse gas emissions. The biggest proportion in all energy products is destined solely for space heating/cooling and hot water preparation [
1]. The European legislation clearly imposes the diminishment of thermal energy demand by buildings. A set of measures encouraging the use of renewable energies and promoting the energy efficiency was mandated by the European Council and the European Parliament in the Directives 2009/25/EC [
2], 2010/31/EU [
3], and 2012/27/EU [
4]. The passive house [
5] and N-ZEB concept [
6,
7] are actively studied for the diminishment of the greenhouse gas emissions. According to Becchio et al. [
8], the cost relevant solution for a domestic thermal system in N-ZEB can be achieved by increasing the proportion of the on-site energy production. Lund et al. [
9] showed that the integration of the thermal storage to the smart grid, being coordinated with N-ZEB, is the most cost effective solution for creating the flexibility and reusing the waste heat. Sameti et al. [
10] identified that energy storage renders economically and ecologically favorable the district energy grid in comparison with the conventional energy system, autonomous energy supply scheme or net-zero without storage.
In addition to the existent energy-to-heat conversion technologies with renewables in the temperature range of 0 to 100 °C (e.g., compression heat pump, geothermal techniques), the combined solar thermochemical solid/gas energy storage process is a very prominent technology for the delivery of clean thermal energy. The core principle of this technology relies on the reversible sorption phenomenon of gas on a porous solid under given operating conditions (the gas temperature and partial pressure) [
11]. The capture of gas molecules by the porous solid is an exothermic process, which is thus responsible for the heat release and is referred to the “thermal energy discharge”. This operation is used in heating applications forthwith. The intensity of the heat release decreases as soon as the solid becomes saturated by the sorbate species under some operating conditions. Once the solid/gas equilibrium has been reached, the solid has to be regenerated to the initial state. The solid regeneration is an endothermic reaction that can be triggered by supplying the thermal energy from an external source. Consequently, the provision of the solar thermal energy for solid regeneration (the so-called “thermal charge” operation) renders the sorption process to be ecologically clean technology.
The principle advantages of the thermochemical way of energy storage over sensible and latent ones are the high energy storage density and the absence of thermal losses [
12]. However, the beginner level of the technological maturity results in the high seasonal storage capacity cost of 0.6 to 1.4 €/kWh for the building sector [
13,
14], where the biggest rate of capital investments goes to the solid material [
15,
16]. Nevertheless, there is a steady technological advancement in the design of large or pilot scale solid sorption seasonal systems over laboratory prototypes, comparing the period from 2009 [
17] to 2017 [
18].
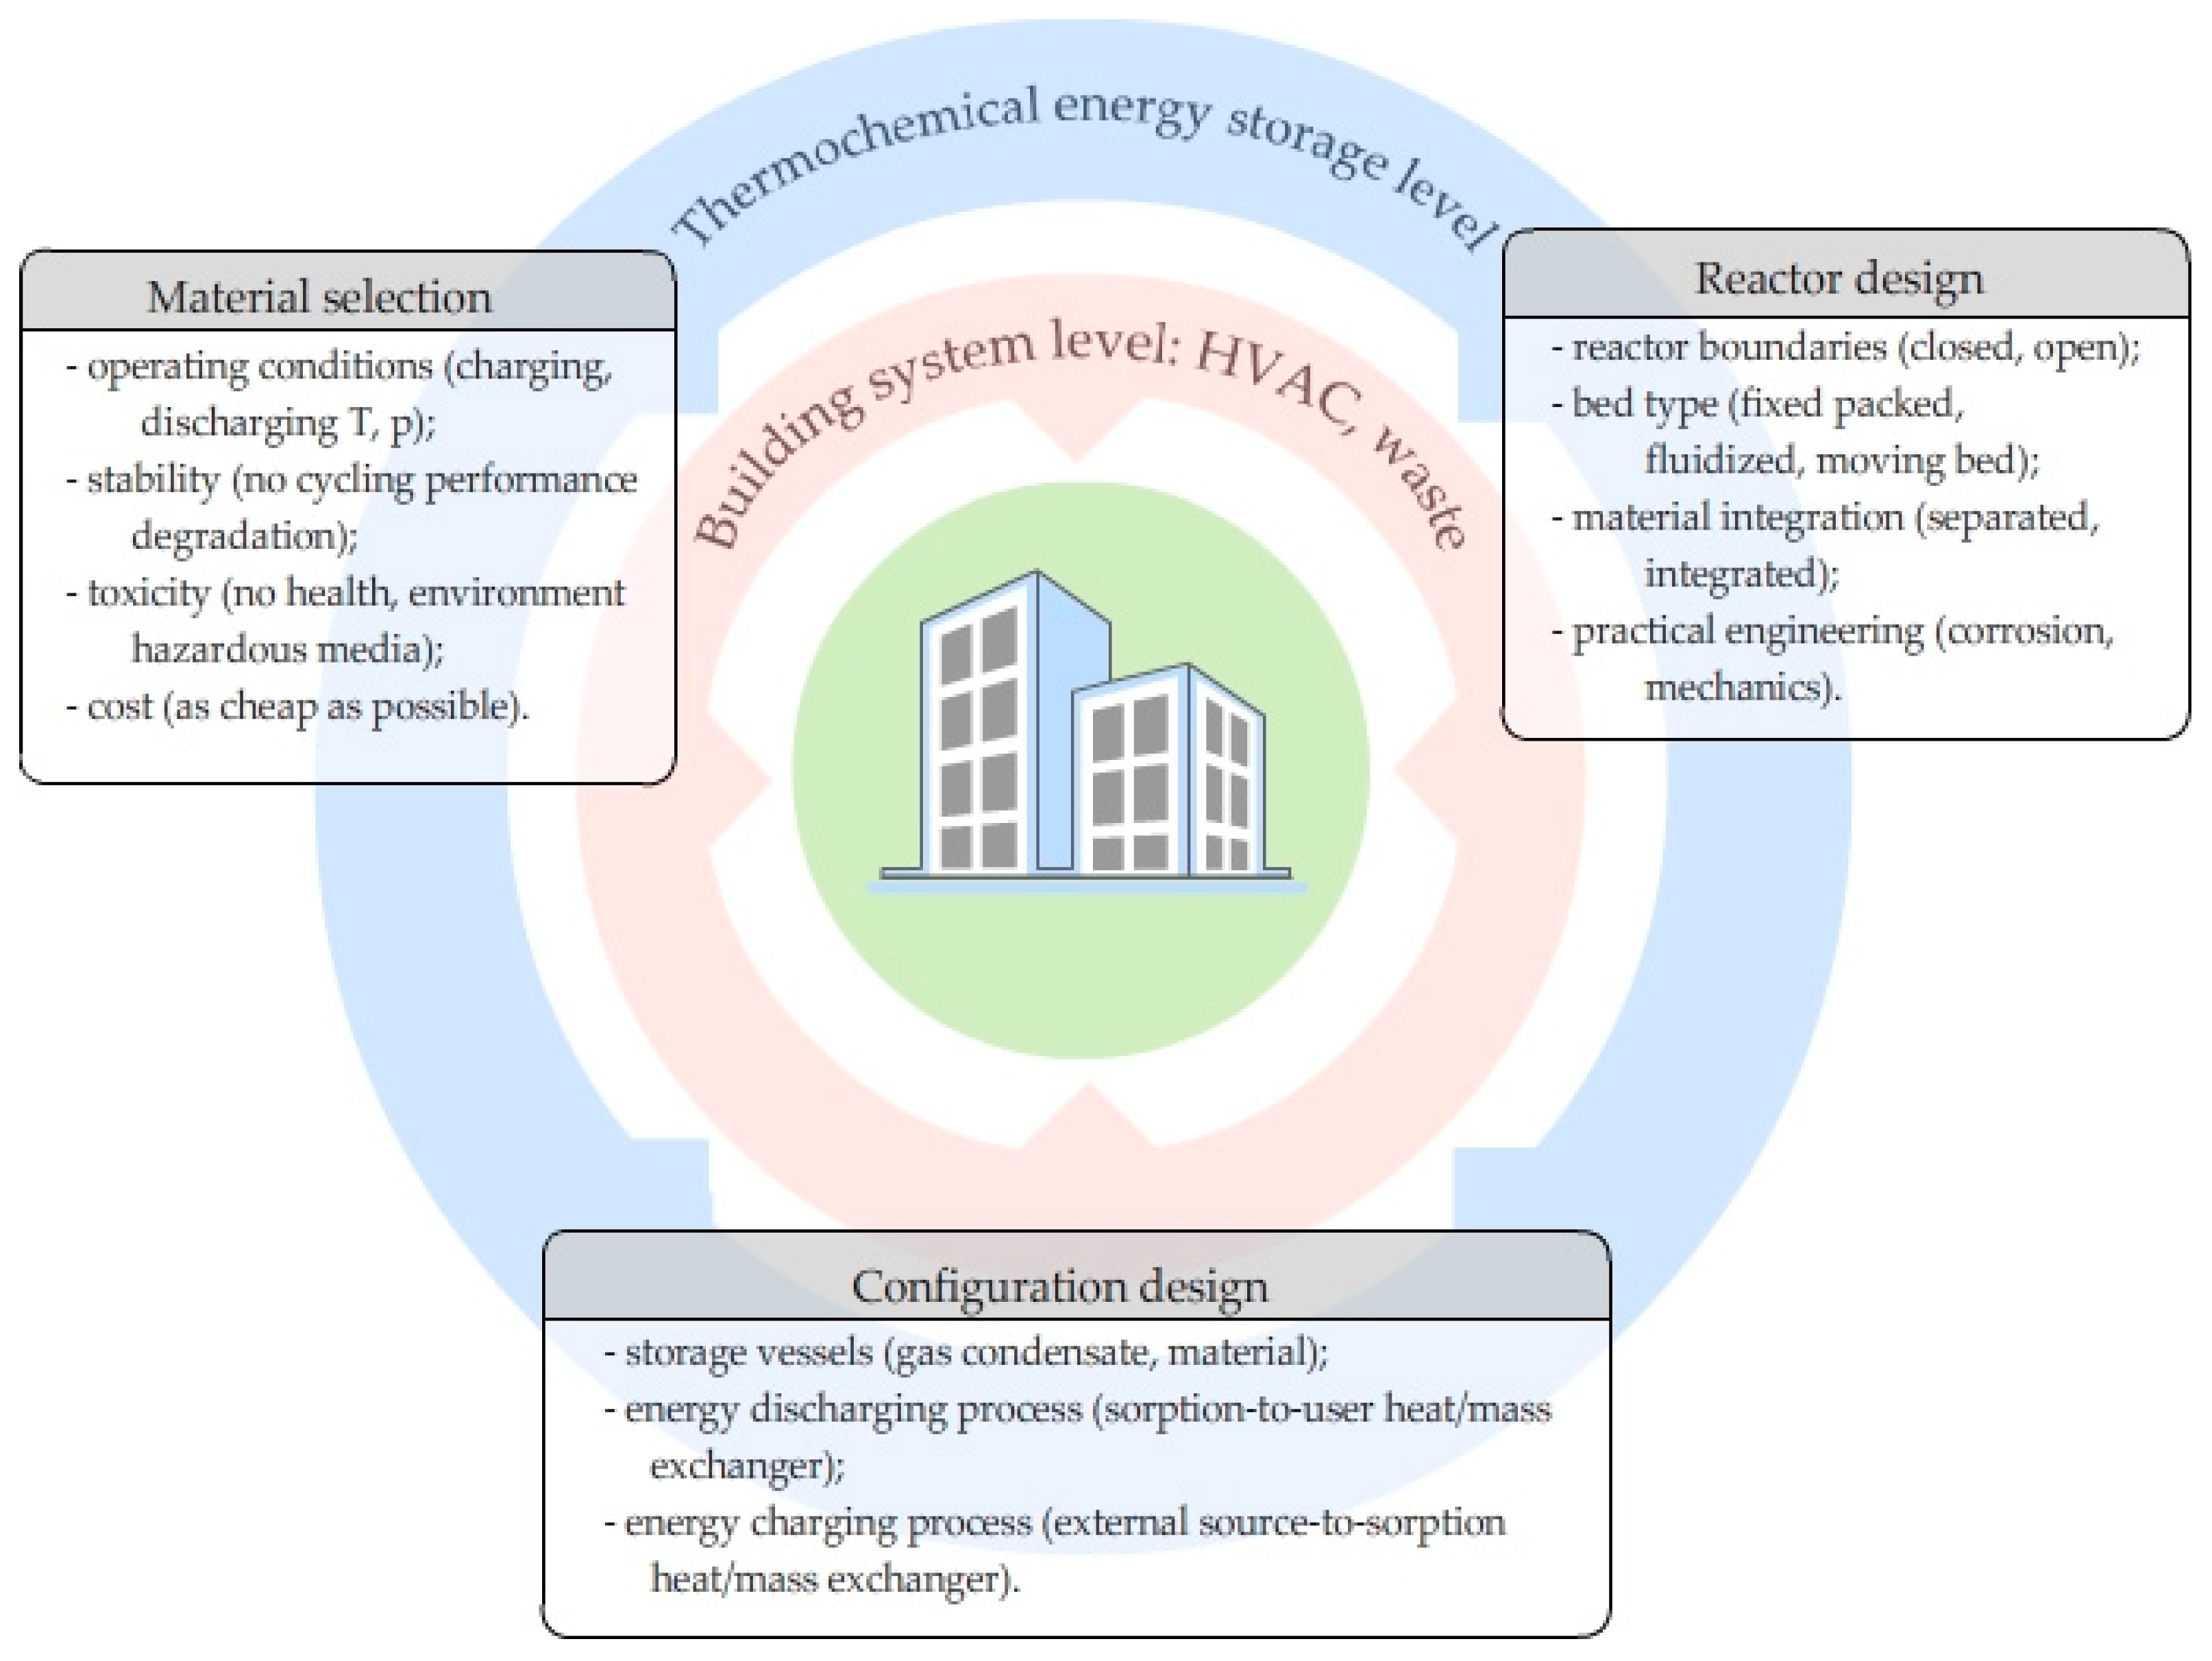
The implementation of the thermochemical energy storage technology requires the selection of the candidate solid/gas working pair, the choice of the heat and mass provision configuration, the design of reactor and auxiliary equipment (e.g., storage vessels, heat exchangers). The general design concept is shown in
Figure 1. The materials screening procedures were developed by many researchers. Richter et al. [
19] proposed a seven step cation/anion selection algorithm based on the availability of materials in the geosphere. N’Tsoukpoe et al. [
20] used the mineral classification approach to select potential hydrates for the thermochemical energy storage with dehydration temperature above 100 °C. Solé et al. [
21] presented necessary characterization criteria for solid/gas working pairs to be selected for a solar thermochemical energy storage. Courbon et al. [
22] developed a computationally efficient algorithm for the selection of solid/gas reversible reactions particularly accented on the use in domestic heating applications. The cited works commonly discuss the idea that a candidate material must provide an intrinsic energy storage density as high as possible between targeted charging and discharging operating conditions, possess an excellent morphological and cycling stability, and be ecologically friendly and cheap. The salt hydrates possess the highest energy storage density (e.g., 630 kWh/m
3 for SrBr
2·(1↔6)H
2O [
23]) and they are numerous that makes the reason to develop a special selection procedure.
However, the practical use of pure salt hydrates is difficult because of the poor cycling stability, aggressivity (corrosivity) and deliquescence problems. The family of selective water sorbents (SWS), including silica gel (SG), carbonaceous matrices, and molecular sieves such as zeolites, Silico-alumino-phosphate (SAPO), Alumino-phosphate (AIPO), Metal organic framework (MOF), is not so numerous. Although these sorbents have quite different structural properties, the same screening criteria could be applied for both families of solid sorbents, including various composite materials [
24]. The later materials are synthesized by incorporating the salt inside the porous matrix, and this approach mostly resolves the deliquescence phenomenon and improves the cycling stability of a pure salt hydrate.
The reactor designer’s work generally consists in maximizing the heat and mass transfer phenomenon in a solid/gas thermodynamic system, in order to achieve the ultimate reactor compactness and energy storage density. The assessment of thermochemical reactor prototypes and components can be found in [
11,
25]. Scapino et al. [
14] showed that although the energy storage density does not differ too much between open and closed sorption fixed-bed reactors, the storage capacity costs (€/kWh) are lower for open sorption technology. However, this technology is only reserved for use with moist air. The storage capacity cost is the main factor for the development of open sorption reactors for seasonal energy storage.
The design of the system configuration depends on the way how the storage is planned to be integrated to the building. The assessment of the domestic systems configurations proposed for the space heating with an open sorption moving bed reactor was investigated in [
26]. Hennaut et al. [
27] developed the simulation tool for the closed sorption SrBr
2/H
2O solar thermochemical seasonal combisystem that included two water storage tanks.
Michel et al. [
28] demonstrated a 400 kg large scale thermochemical system for thermal storage of solar energy. The system was operated under atmospheric conditions, SrBr
2/H
2O as the working pair, with the overall storage capacity of 105 kWh. The energy density reached by the reactor module was 203 kWh/m
3. However, the authors faced the decrease of material performances over time. This is a known issue of this salt hydrate [
29], that was resolved in the recently developed composite materials [
23,
30]. Mette et al. [
31] developed the combined thermochemical energy storage with moving bed reactor (open sorption process) using zeolite 4A/H
2O. This system included a separate material storage vessel, where the back-up gas burner and the solar thermal collectors were connected to the hot water storage tank. Gaeini et al. [
32] developed the solar thermochemical heat storage combisystem for the domestic hot water production. The household scale prototype (170 kg of zeolite 13XBF packed in four segments) was able to heat the water up to 75 °C at the maximum rate of 3.6 kW for 10 h. The energy density of each segment, working under atmospheric conditions, was reported to be as high as 61 kWh/m
3. A semi-continuous solid feeding pilot scale system was developed within SOTHERCO project for seasonal thermal energy storage using thermochemical process [
33]. The system demonstrated 200 Wh/kg of the usable energy storage capacity of 9% hydrated SG/CaCl
2 (43 wt.%) composite with a solid feed rate of 220 kg/h.
The present work shows the experimental results on a pilot scale combined solar thermochemical energy storage used for the domestic water heating applications. The system prototype was used to compare performance characteristics of fixed packed and moving bed reactors, when connected to a 49 L water storage tank. Although the aim of the presented installation is the preparation of hot water above 50 °C, the present investigation is devoted to the determination of global energy performance under limited set of tank charging conditions, being similar to low-temperature heating applications at ~30 °C.
The work is organized in the following order. First, the configuration concept and the working principle of the system are introduced. Second, the experimental pilot prototype is presented, followed by the description of the selected material. Finally, the experimental procedure and the obtained results are described and discussed.
2. Thermochemical Energy Storage Design
2.1. Configuration Concept and Working Principle
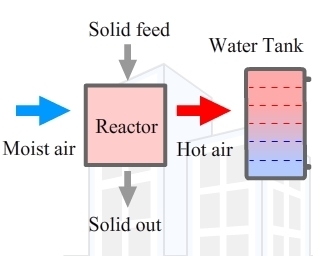
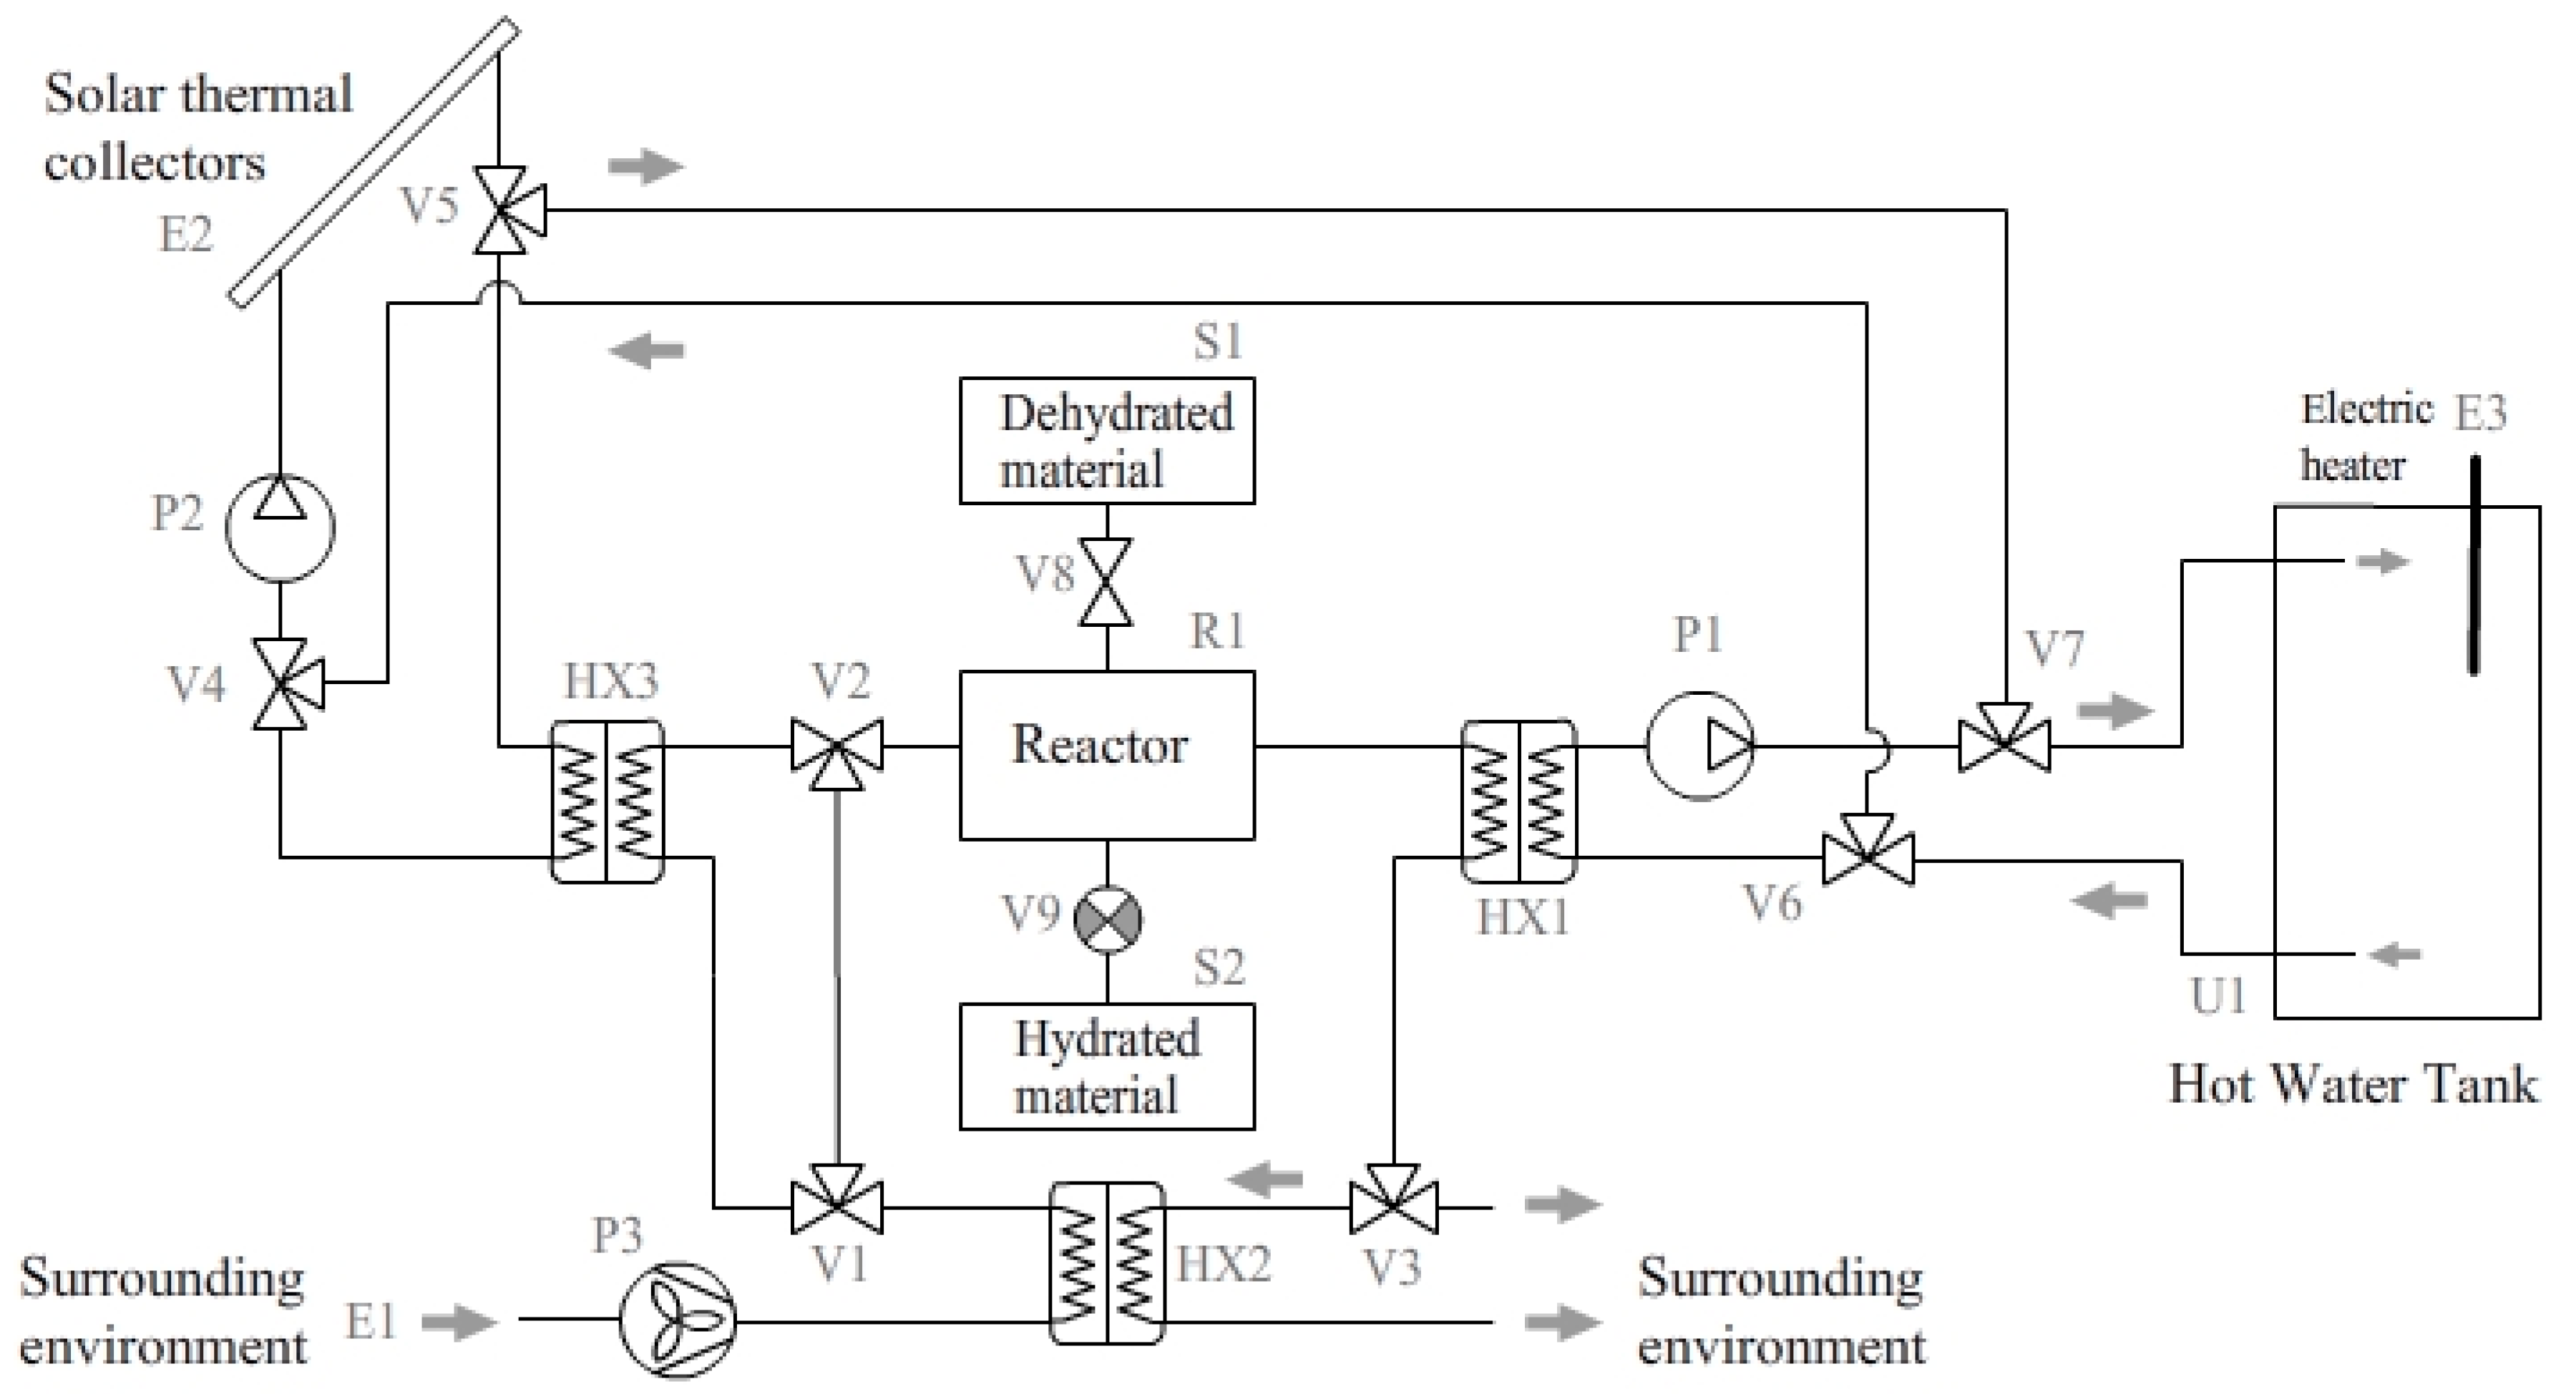
The configuration concept is based on an open sorption process of water vapor on a composite material in a vertical moving bed reactor. The concept is shown in
Figure 2 The full details about the used material and the designed reactor are described in the following sections. The idea of the moving bed reactor is to generate a constant thermal power, which is not possible with the fixed packed bed configuration. Moreover, the use of a single bed, instead of multiple beds, aims at improving the overall system compactness. All the solid material is processed by a reactor R1 and stored separately in storage vessels S1 and S2. However, the main challenge consists to design the solid feed/extractor mechanism (elements V8 and V9 in
Figure 2).
During the thermal discharge, the ambient cool moist air E1 is supplied to the cold side of the heat exchanger HX2 by the fan P3, where it can be preheated from the hot side of HX2 before entering to the reactor R1. The heat exchanger HX3 is by-passed with valves V1 and V2, and the valve V3 is open in the direction of HX2 (see
Figure 2). The hot and dried air at the reactor outlet is introduced to the air-to-water heat exchanger HX1 for the immediate charge of the water tank U1. Finally, the cooled and dried air is rejected from HX2 to the atmosphere. The water pump P1 is normally activated and the water pump P2 is deactivated.
There is no evaporator module in this configuration, that makes the system to be more compact. Such a decision is exclusively reserved to the use of a highly hygroscopic composite material. However, this designer’s step sets the operational constraints, especially for the outdoor temperature below 5 °C and the air moisture content lower than 5.0 kg/kg. In such conditions, the charge of the water tank U1 can be ensured by its direct heating with the solar collectors E2 by turning the valves V4, V5, V6, and V7, and activating the pump P2. Moreover, a back-up electric heater E3 can be installed in the water tank too.
The thermal charge operation uses the solar energy E2. The type of solar thermal collectors determines the dehydration temperature that can be supplied to the reactor. Skrylnyk et al. [
34] showed that the dehydration temperature above 100 °C is achievable with evacuated tube or concentrated solar collectors, which improves the reactor energy storage density by more than 50% in comparison with the dehydration between 50 and 80 °C with glazed solar thermal collectors.
During the thermal charge, the outdoor air E1 is blown through the cold side of the air-to-air heat exchanger HX2, after what it receives the necessary heat from the solar thermal collectors E2 through the water-to-air heat exchanger HX3. The valves V1 and V2 stay open in the direction of HX3 and R1 units. Afterwards, the hot air is distributed to the reactor module R1. At the same time, the hot water tank U1 can be also charged from the air-to-water heat exchanger HX1, thus reusing a part of heat rejected from the reactor R1.
2.2. Experimental Prototype Design
The experimental prototype developed for this study slightly differs from the concept in
Figure 2 as the solar collectors E2 and the heat exchanger HX3 were replaced by an electric heater. The prototype was implemented using the commercially available modular equipment for the ductwork, custom made heat exchangers, and custom design parts (see
Figure 3). The ductwork was realized with stainless steel air ducts of a nominal diameter of 200 mm and was jacketed by fiber glass insulation of 5 cm in thickness. The air-to-air heat exchanger HX2 is the cross flow custom assembled unit, whose nominal effectiveness was measured as high as 0.95 for the air volume flow rate of 150 m
3/h. The circulation of air across the aeraulic circuit was realized with a centrifugal in-line commercial fan from SIG Air Handling International (commercial office at Zaventem, Belgium), series BCS-EC200. The air-to-water heat exchanger HX1 has a custom design and is composed of a network of horizontal finned tubes mounted in a wooden insulated box. The water storage tank is a vacuum insulated vertical cylinder of 49 L of capacity, containing the stratification device. The water is pumped by the hydraulic rotary vane pump from GOTEC SA (Sion, Switzerland), series TS60. The hydraulic connections were made from insulated polyamide tubing with internal diameter of 10 mm.
The reactor module was conceived as a vertical moving bed with controlled solid flow rate. The schematics of the reactor module is shown in
Figure 3. The reactor consists of two 72.5 L symmetric stainless steel hollow compartments with tightly fixed metallic sieve on each. The compartments are stacked in such a way they form the 3 L free room between both metallic sieves, which is used for a micro-granular solid material to be flown through the vertical plane. The cross section area for the air flow through the metallic sieves and the solid in between is 0.31 m
2. The feeding of reactor by the solid material is realized by the 10l upper plexiglass hopper as shown in
Figure 3. The control over material flow through the reactor is realized with a mechanically driven rotary valve anchored to the bottom part of the reactor. The speed of the valve rotation is adjusted by the stepper motor (denoted as “M” in
Figure 3).
The distribution of the air temperature at the inlet and outlet of the reactor is measured by two grids of K-type thermocouples, which are mounted inside the reactor enclosure at the proximity of the metallic sieve on the distance of 3 mm from both sides. The temperature measuring grids at the reactor inlet and outlet are shown in
Figure 3 (elements 4 and 5). Moreover, the inlet and outlet air ducts are equipped with additional K-type thermocouples to measure the average inlet and outlet air temperature. The air humidity at the inlet and outlet reactor boundaries is measured by the humidity sensors from VAISALA Corporation (Helsinki, Finland), series HMP5 connected to the analog transmitters Indigo™ 201. The air flow rate is measured by the vane wheel flow sensor from Höntzch, series FA, which is mounted on the reactor inlet airduct. The flow rate of the hot water is measured by the turbine type flow meter FT2 from NATEC Sensors GmbH (Garching, Germany) mounted on the water tank inlet. Furthermore, the air-to-air (HX2) and air-to-water (HX1) heat exchangers are also equipped with one K-type thermocouples at each inlet and outlet. The data acquisition system is assembled from the modular National Instruments™ CompactDAQ C-series hardware. The characteristics of the measurement equipment are presented in
Table 1.
2.3. Material
The material used for this study was the salt-in-silica composite material with confined salt of calcium chloride (CaCl
2), synthesized by multi-steps incipient wetness impregnation method. This material was recently developed at the Research Institute for Energy (University of Mons, Belgium) aiming at the improvement of the intrinsic energy storage density and the cycling stability in connection with the building heating applications [
35]. The developed synthesis protocol allowed the salt content of 43 wt.% to be reached inside the silica gel (Davisil®, grade 62, from Grace). The CaCl
2 salt was provided by Solvay in form of the anhydrous 94% purity Caso® granules. The full details about the developed composite material, the synthesis protocol and the characterization methods are available in [
35,
36].
The water mass uptake was measured by using IGASorp apparatus (from Hidden Isochema) for dynamic vapor sorption isotherm measurements. The characteristic curve representing the equilibrium mass uptakes versus the Polanyi adsorption potential
was constructed from the experimental data. By basing on these data, a simple model to predict the equilibrium water mass uptake, which depends on the temperature and pressure conditions, was designed. The characteristic curve of sorption of water vapor on the composite (denoted as SG/CaCl
2) is shown in
Figure 4. Other physical and thermal properties of the used material are presented in
Table 2.
2.4. Experimental Procedure
The reactor can work in two modes: (i) as a fixed packed bed and (ii) as a moving bed. The rotary valve (see
Figure 3) is permanently disabled in the mode (i) and all the solid material in the reactor is hydrated progressively from the initial state
to the maximum allowed state
. For the experiments in the mode (ii), the rotary valve is actioned automatically by the stepper motor every
seconds, making the hydrated material fraction to be evacuated from the reactor, while the new anhydrous fraction refills the reactor from the upper hopper (see
Figure 3). Therefore, there is a hydration gradient
along the vertical axis
z inside the reactor in the mode (ii), with the boundary conditions at the reactor inlet
and at the reactor outlet
, where the overall hydration time is
and
is total number of valve turns. Moreover, the air-to-air heat exchanger HX2 can be by-passed by the valve V3 (see
Figure 2), so that the reactor R1 can be run with or without heat recovery from the air-to-air heat exchanger.
The operations used for the experimental protocol in the mode (i) and (ii) were identical, with the only difference that the rotary valve remained permanently disabled in the mode (i). Primary to experiments, the material was dehydrated in the laboratory oven at 150 °C for 24 h. Before loading the material to the upper hopper, the centrifugal fan P3 and the hydraulic pump P1 were running at least 20 min in order to check the measurement equipment and to reach the isothermal conditions. The valve V3 was positioned in such a way that the air-to-air heat exchanger HX2 was by-passed. Once the isothermal conditions were reached, the fan P3 was briefly off, and the material was loaded to the reactor through the upper hopper. The experiment started immediately once the centrifugal fan was again on and all the measured data were logged by the data acquisition system to the computer. For the experiments with reactor running in the moving bed mode, the rotary valve was manually turning 3 to 5 tours to let the material to be better packed in the reactor, afterwards the rotary valve worked in the automatic mode every seconds.
All the experiments started with the heat exchanger HX2 set in the by-pass mode. The heat recovery by the air-to-air heat exchanger HX2 was activated if the air temperature rejected at the hot side was higher than the air temperature at the reactor inlet. The activation of the heat recovery was done by turning the valve V3 in the direction of the heat exchanger HX2.
The decision to stop the experiment was taken with regards to the temperature difference threshold at the cold side of the air-to-water heat exchanger (<1 °C) and the air humidity threshold (~30% of R.H. at 20 °C) at the outlet of the reactor.
The performance parameters of the prototype in mode (i) and (ii) were evaluated using the following equations. The thermal power produced by the reactor R1, the heat recovered by the air-to-air heat exchanger HX2 and the heating rate of the water tank U1 are determined as follows:
where
represents the variation of the fluid temperature difference recorded at the
component’s boundaries;
refers to the fluid that circulates through the reactor R1, the air-to-air heat exchanger HX2 or the water tank in the respective order. The heating rate of the water tank was determined from the thermal power on the cold side of the air-to-water heat exchanger HX1. The hydration thermal power
is identical to
in the stationary regime and was determined from the air humidity measurements:
With
is the variation of the air absolute humidity at the reactor boundaries. The amount of thermal energy generated by the reactor and charged to the water tank:
The dynamic effectiveness of the air-to-air or air-to-water heat exchanger was evaluated as given below:
where
determines the minimum product of the
fluid mass flow rate and the associated heat capacity
, and
is the maximum possible temperature difference on the concerned heat exchanger.
The energy storage density of the material can be referred to the energy prognosis either by the reactor, or by the water storage tank. It was calculated with the following formula:
where
represents the packing density of anhydrous material and
is the total anhydrous mass processed by the reactor during the experimental time
. For the fixed packed bed
represents only the anhydrous bed mass
, while for the moving bed test it represents the quantity of anhydrous material spent on the time frame
.
Considering the energy prognoses by both reactor and the water storage tank, the discharging efficiency was also introduced as the installation performance indicator:
It has to be noted, that the listed above performance indicators (1–6) depend on the heat losses along the ducts and pipework, the heat capacities of the used materials and the ratio between products.
The water mass uptake for the fixed packed bed was determined at each experimental time step
by the following formula:
With
is the sorption rate in kg/s determined from the air humidity measurements as
. The water mass uptake for the moving bed was estimated by solving the equation of the boundary problem:
With is the estimated averaged solid velocity and is the anhydrous bed mass. For simplicity reasons, this mass was taken as a constant.
3. Results and Discussion
Two types of hydration experiments were performed on the installation prototype: the reactor was running as the fixed packed bed (test 1) or as the moving bed (test 2). All the hydration experiments were done under laboratory atmospheric conditions, using the ambient moist air. The heat released during the hydration reaction was used to heat up the water tank. In all experimental cases, the material was dehydrated in the laboratory oven at 150 °C and so its initial water uptake was less than 0.01 kg/kg. This resulted in an initially high adsorption potential and led thus to a high initial step in the thermal power at the reactor boundaries at
min, which will be analyzed later. Furthermore, the relative air humidity under ambient conditions was measured from 41% to 52% at 20 °C, which cannot always exist under winter climate conditions. The initial and experimental conditions for the modes (i) and (ii) are listed in
Table 3.
It has to be noted, that only two experimental datasets are presented and analyzed here. These results provide the necessary and sufficient information about the prototype functioning under tested conditions, and clearly demonstrate the performances and flaws. Other tests were also carried out, but the obtained results were equivalent because of the little variation of the atmospheric conditions.
As follows from
Table 3, the experimental conditions were quite similar between both tests. The average ambient temperature, as well as the air absolute humidity, were 1.6 °C, and respectively 1.6
kg/kg higher for test 2 than for test 1. Nevertheless, the experimental results can be compared. The time instant, when the heat recovery by the exchanger HX2 (see
Figure 2) was switched on, was also identical for both experiments (see
Table 3).
The main performance indicators for the fixed and moving bed experiments are presented in
Table 4. The uncertainties in
Table 4 were calculated with the uncertainty propagation method [
37]. The total hydration energy
was calculated by integrating equation (2) over time. To simplify the calculation, the reaction heat
was taken constant as given in
Table 2. The energy densities
and
were found from equation (5), considering the total anhydrous material mass
from
Table 3 and the packing density of the anhydrous composite from
Table 2. Additionally, the energy storage capacity (Wh/kg) of material can be found in form of the ratios
and
using equation (3) and data from
Table 3.
Although, the total hydration time spent in the moving bed operating mode was 168 min, the results are shown only for the first 75 min, when 5.5 kg of solid mass was processed. This allows the fixed and moving beds characteristics to be compared within the same time interval.
The analysis of the data from
Table 4 shows that the amount of the thermal energy
produced by the reactor and
charged to the water tank almost did not depend on the prototype operating mode. Moreover, it is important to note that the value
perfectly matches
, that proves the correctness of the measuring principle and validates the use of formulas (1–3). If the thermal losses are high or the reactor is not enough hermetic, the discrepancies in the measurements between
and
are considerable, and therefore the performance characteristics cannot be properly established. Also, it can be found from
Table 4 that the values of the discharging efficiency
, maximum and average thermal power tend to approximately the same magnitude. This proves that the experiments had an inconsiderable sensitivity in face of the given ambient conditions.
However, both energy storage densities and capacities of material considerably differ between both operating modes depending on the energy prognosis (see values
and
, as well as ratios
and
in
Table 4). This fact is related to the operating mode and can be explained by the difference in the material mass used in the experiments (see
Table 3). Indeed, the material mass used in the fixed bed test was 2.2 ± 0.1 kg, while the material mass spent for the moving bed test during 75 min was 5.5 ± 0.1 kg. At the same time, the amount of the produced thermal energy was identical for the both tests (see
Table 4).
In principle, the prototype performance can be directly judged by the discharging efficiency
, because this indicator aggregates the constructive imperfections, such as heat exchangers effectiveness, inhomogeneities of the sorption phenomenon inside the reactor, thermal losses in the ducts, pipework, etc. The real discharging efficiency of the thermochemical energy storage process can be roughly estimated as high as 0.80–0.85. This is a reasonable lower limit being technically achievable for such a process. The discharging efficiency is better for the fixed bed test, than for the moving bed, because the average heating rate of the water tank
was about 24 W higher for the first case (see
Table 4). This fact can be explained by the denser material packing in the fixed bed, which in contrast to the moving bed configuration, resulted in the more homogeneous water vapor sorption throughout the bed. The detailed analysis of the experimental curves is presented in the following subheadings.
3.1. Reactor Hygrothermal Behavior
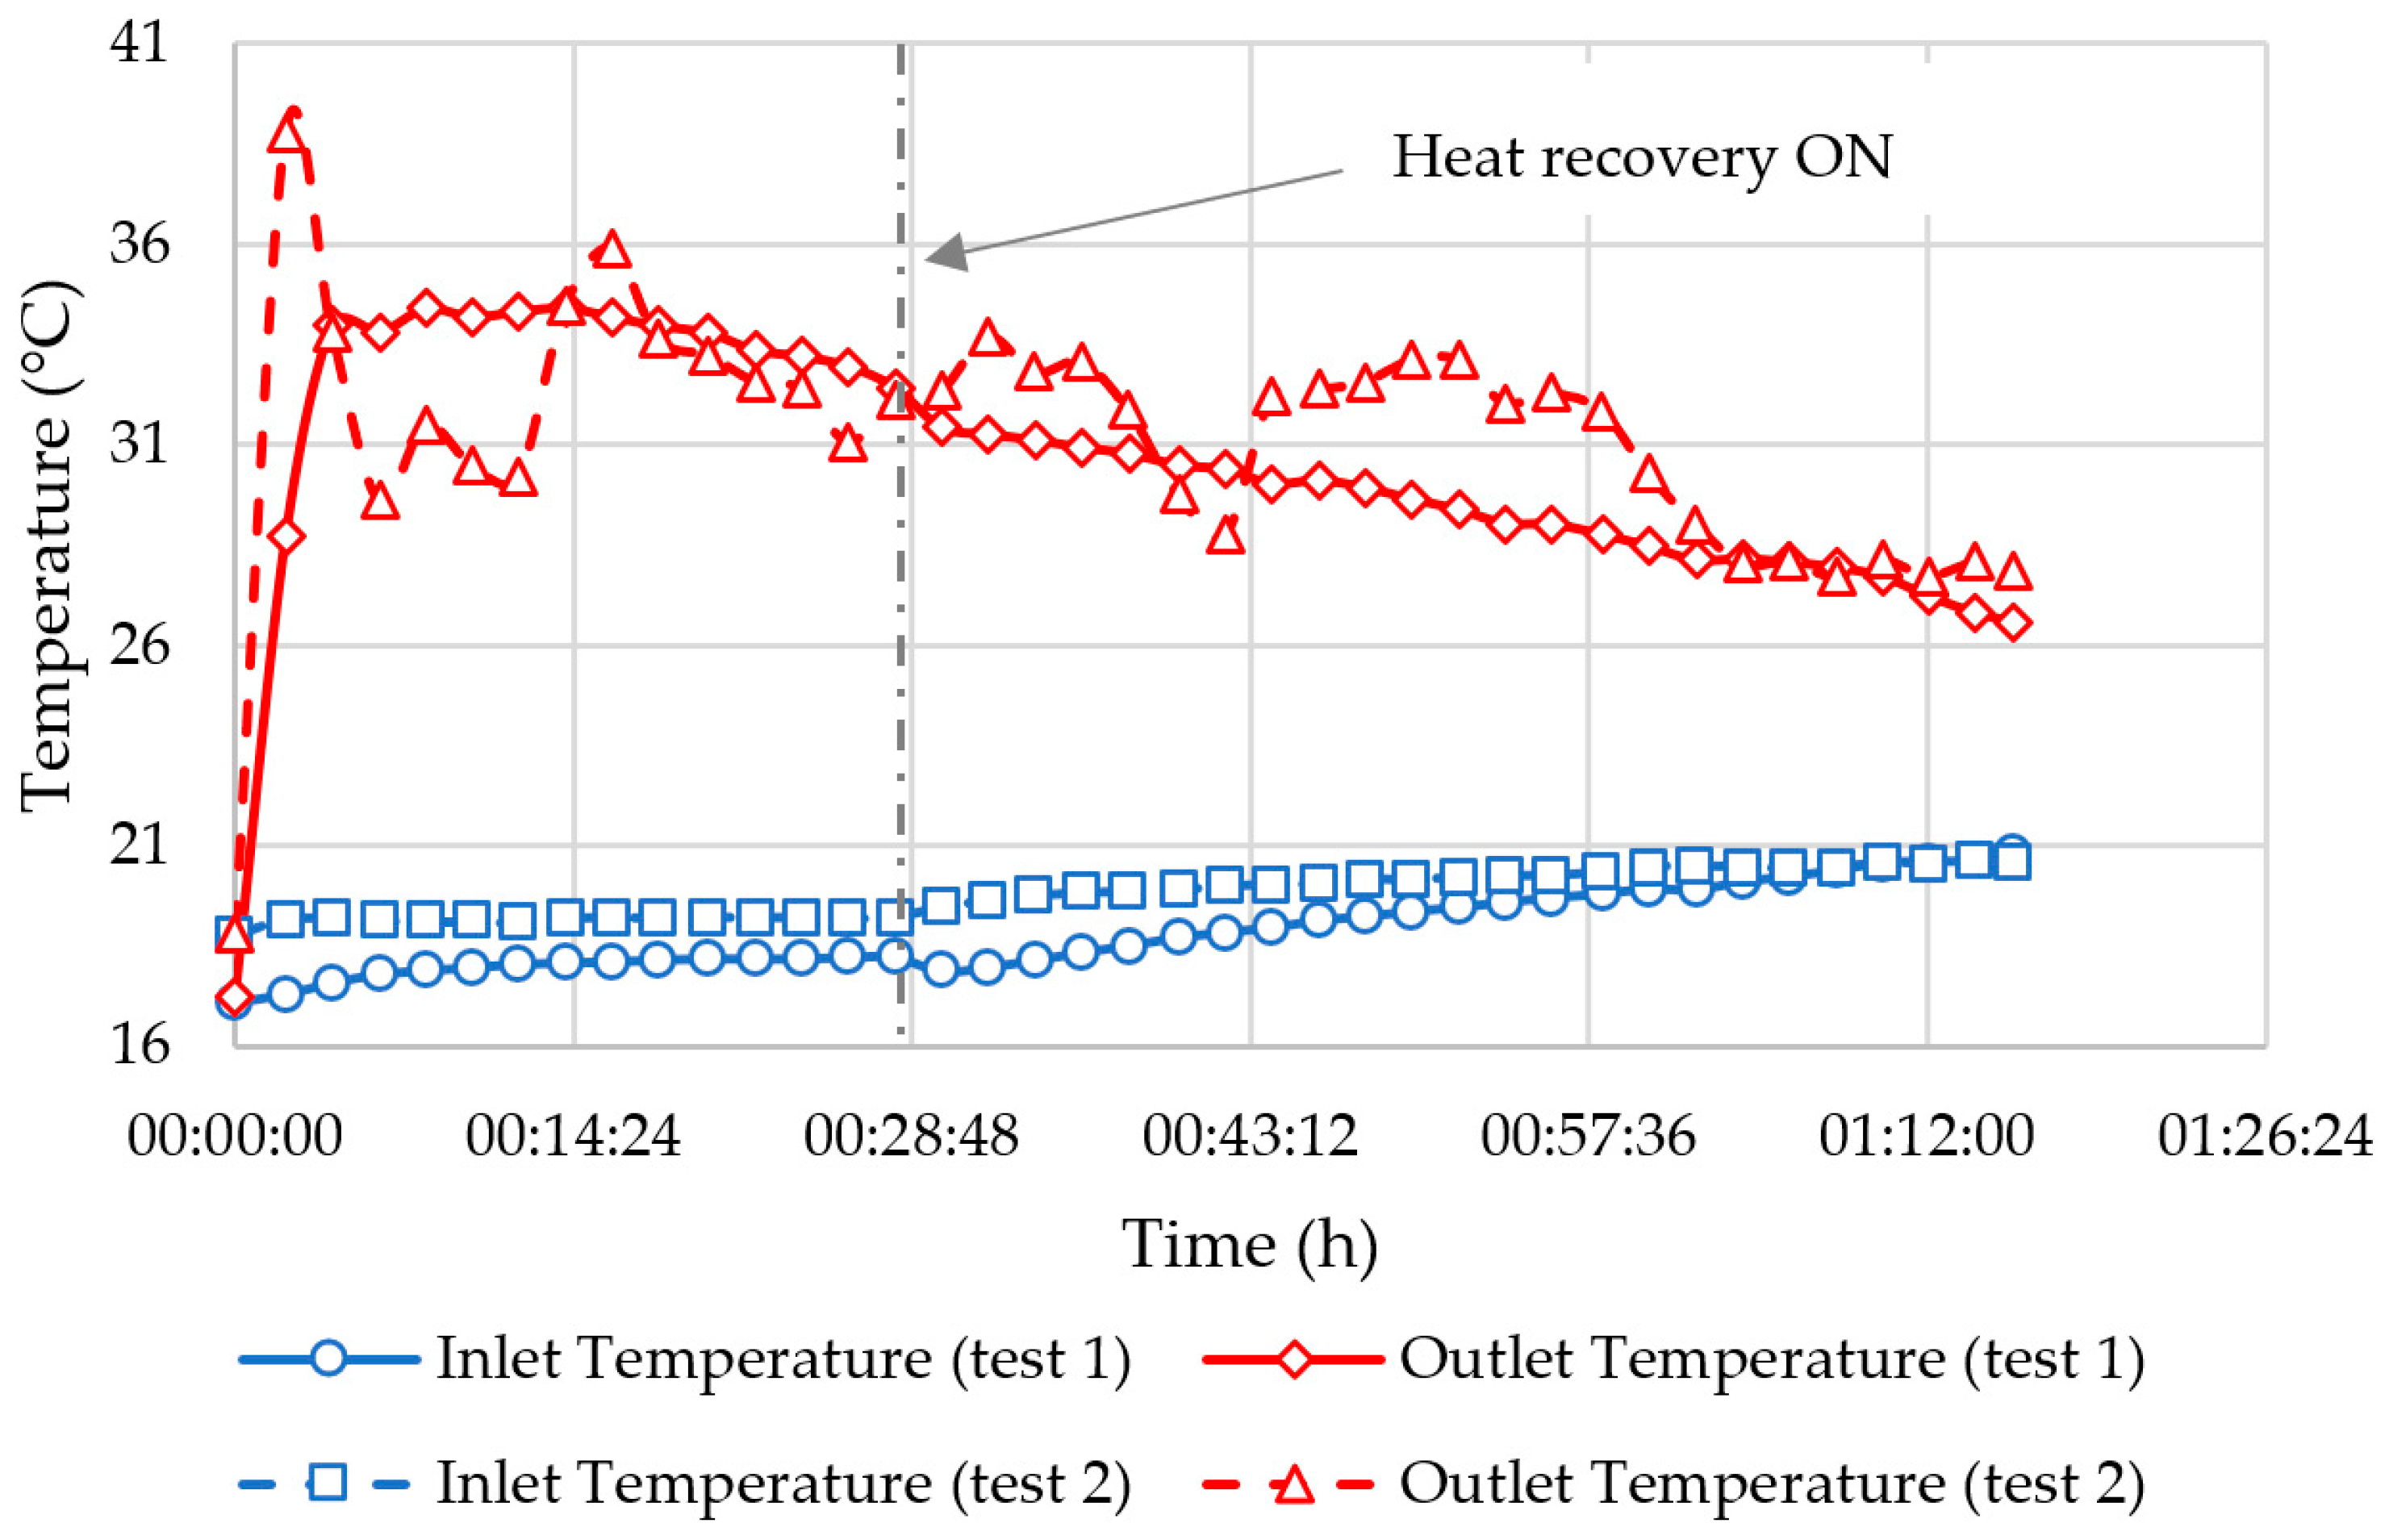
The comparison of the hygrothermal behavior of the reactor between the fixed packed and the moving bed modes is shown in
Figure 5,
Figure 6,
Figure 7 and
Figure 8. The curves with “⚪” and “◇” markers refer to the fixed bed (test 1). These curves represent the typical behavior of an open sorption packed bed reactor and thus can be used as a reference to compare with the moving bed operating mode.
Since the shape of the curves in test 1 is quite smooth, it was concluded that the material was densely packed in the reactor which resulted in a homogeneous sorption throughout the bed (see
Figure 5,
Figure 6,
Figure 7 and
Figure 8). At the initial time instant
min the material had the lowest hydration state, less than 0.01 kg/kg (see
Table 3, test 1) that corresponded to the initial Polanyi adsorption potential
kJ/mol (see
Figure 4). Before the hydration reaction was initiated, the adsorption potential
in the reactor inlet conditions was equal to
kJ/mol. The difference
thus determined the maximum possible loading lift of the material with water, which was close to 0.81 kg/kg (see
Figure 4). The difference of adsorption potentials, being high, produced the temperature lift of 16.6 °C between the inlet and outlet air temperature in the reactor within 4 min (see
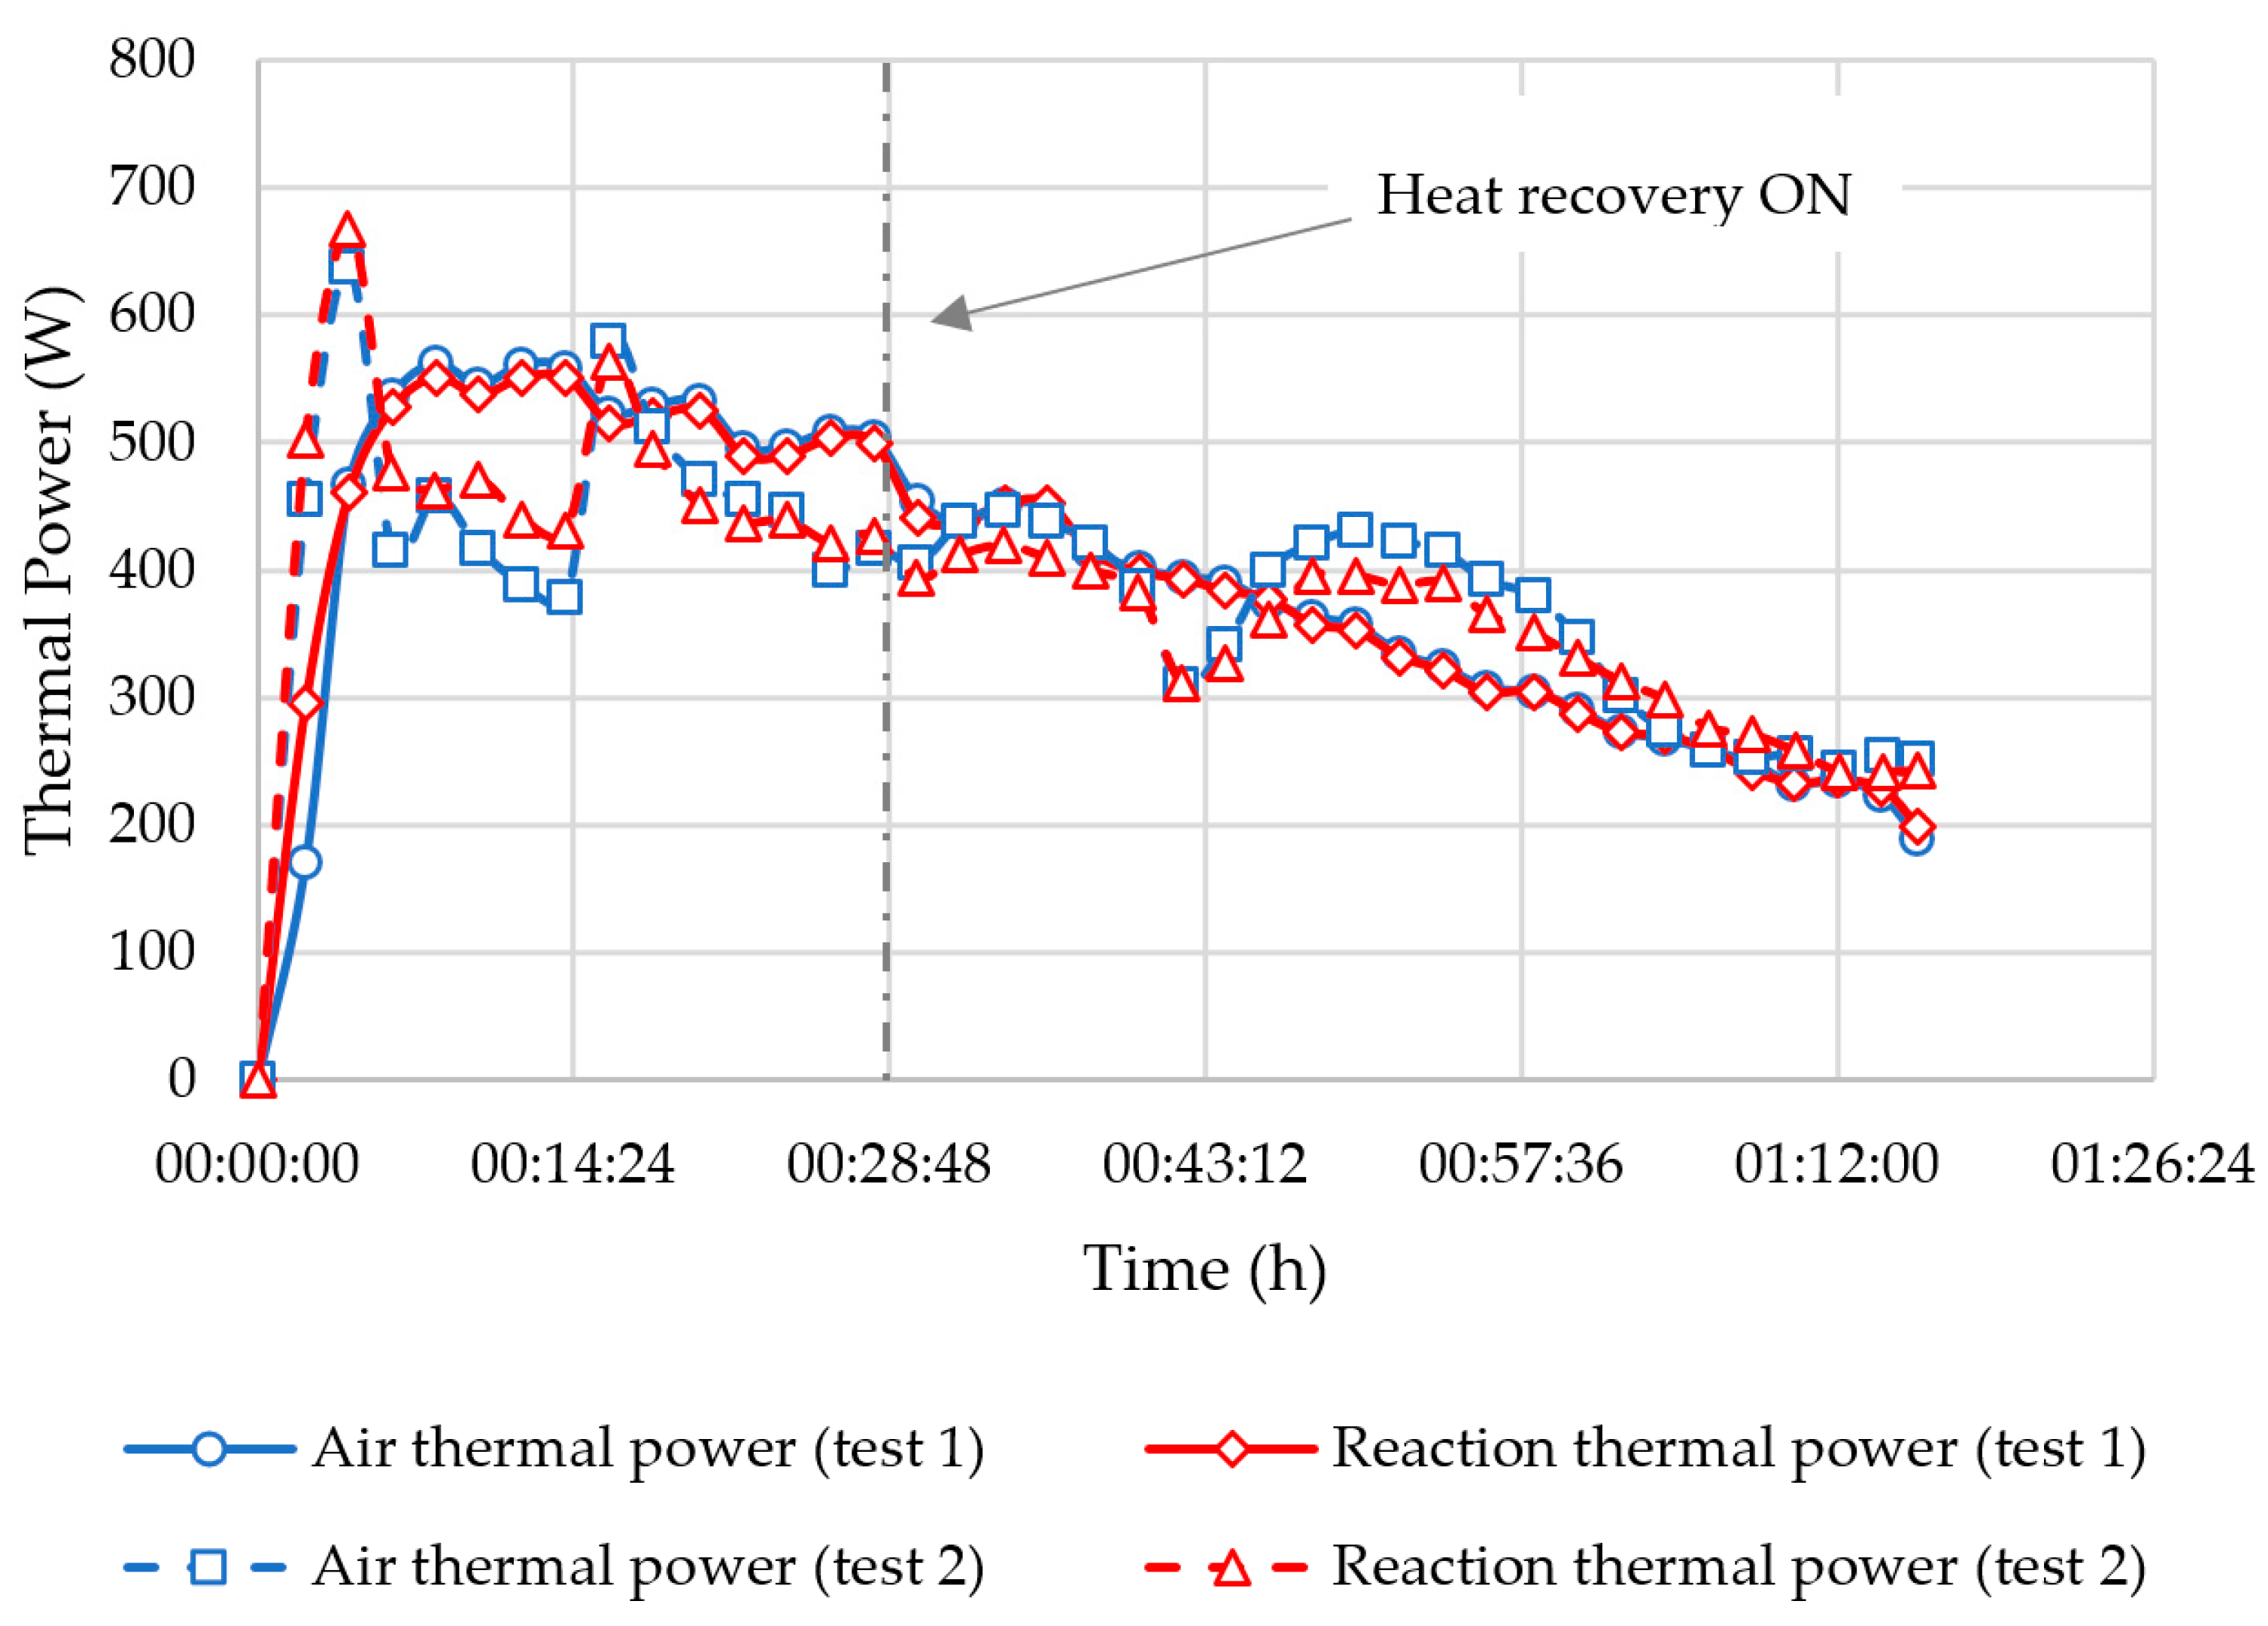
Figure 5, test 1), corresponding to 461 ± 37 W of the thermal power (see
Figure 8, test 1). At the same time, the outlet water vapor pressure sharply dropped down to 2 mbar (see
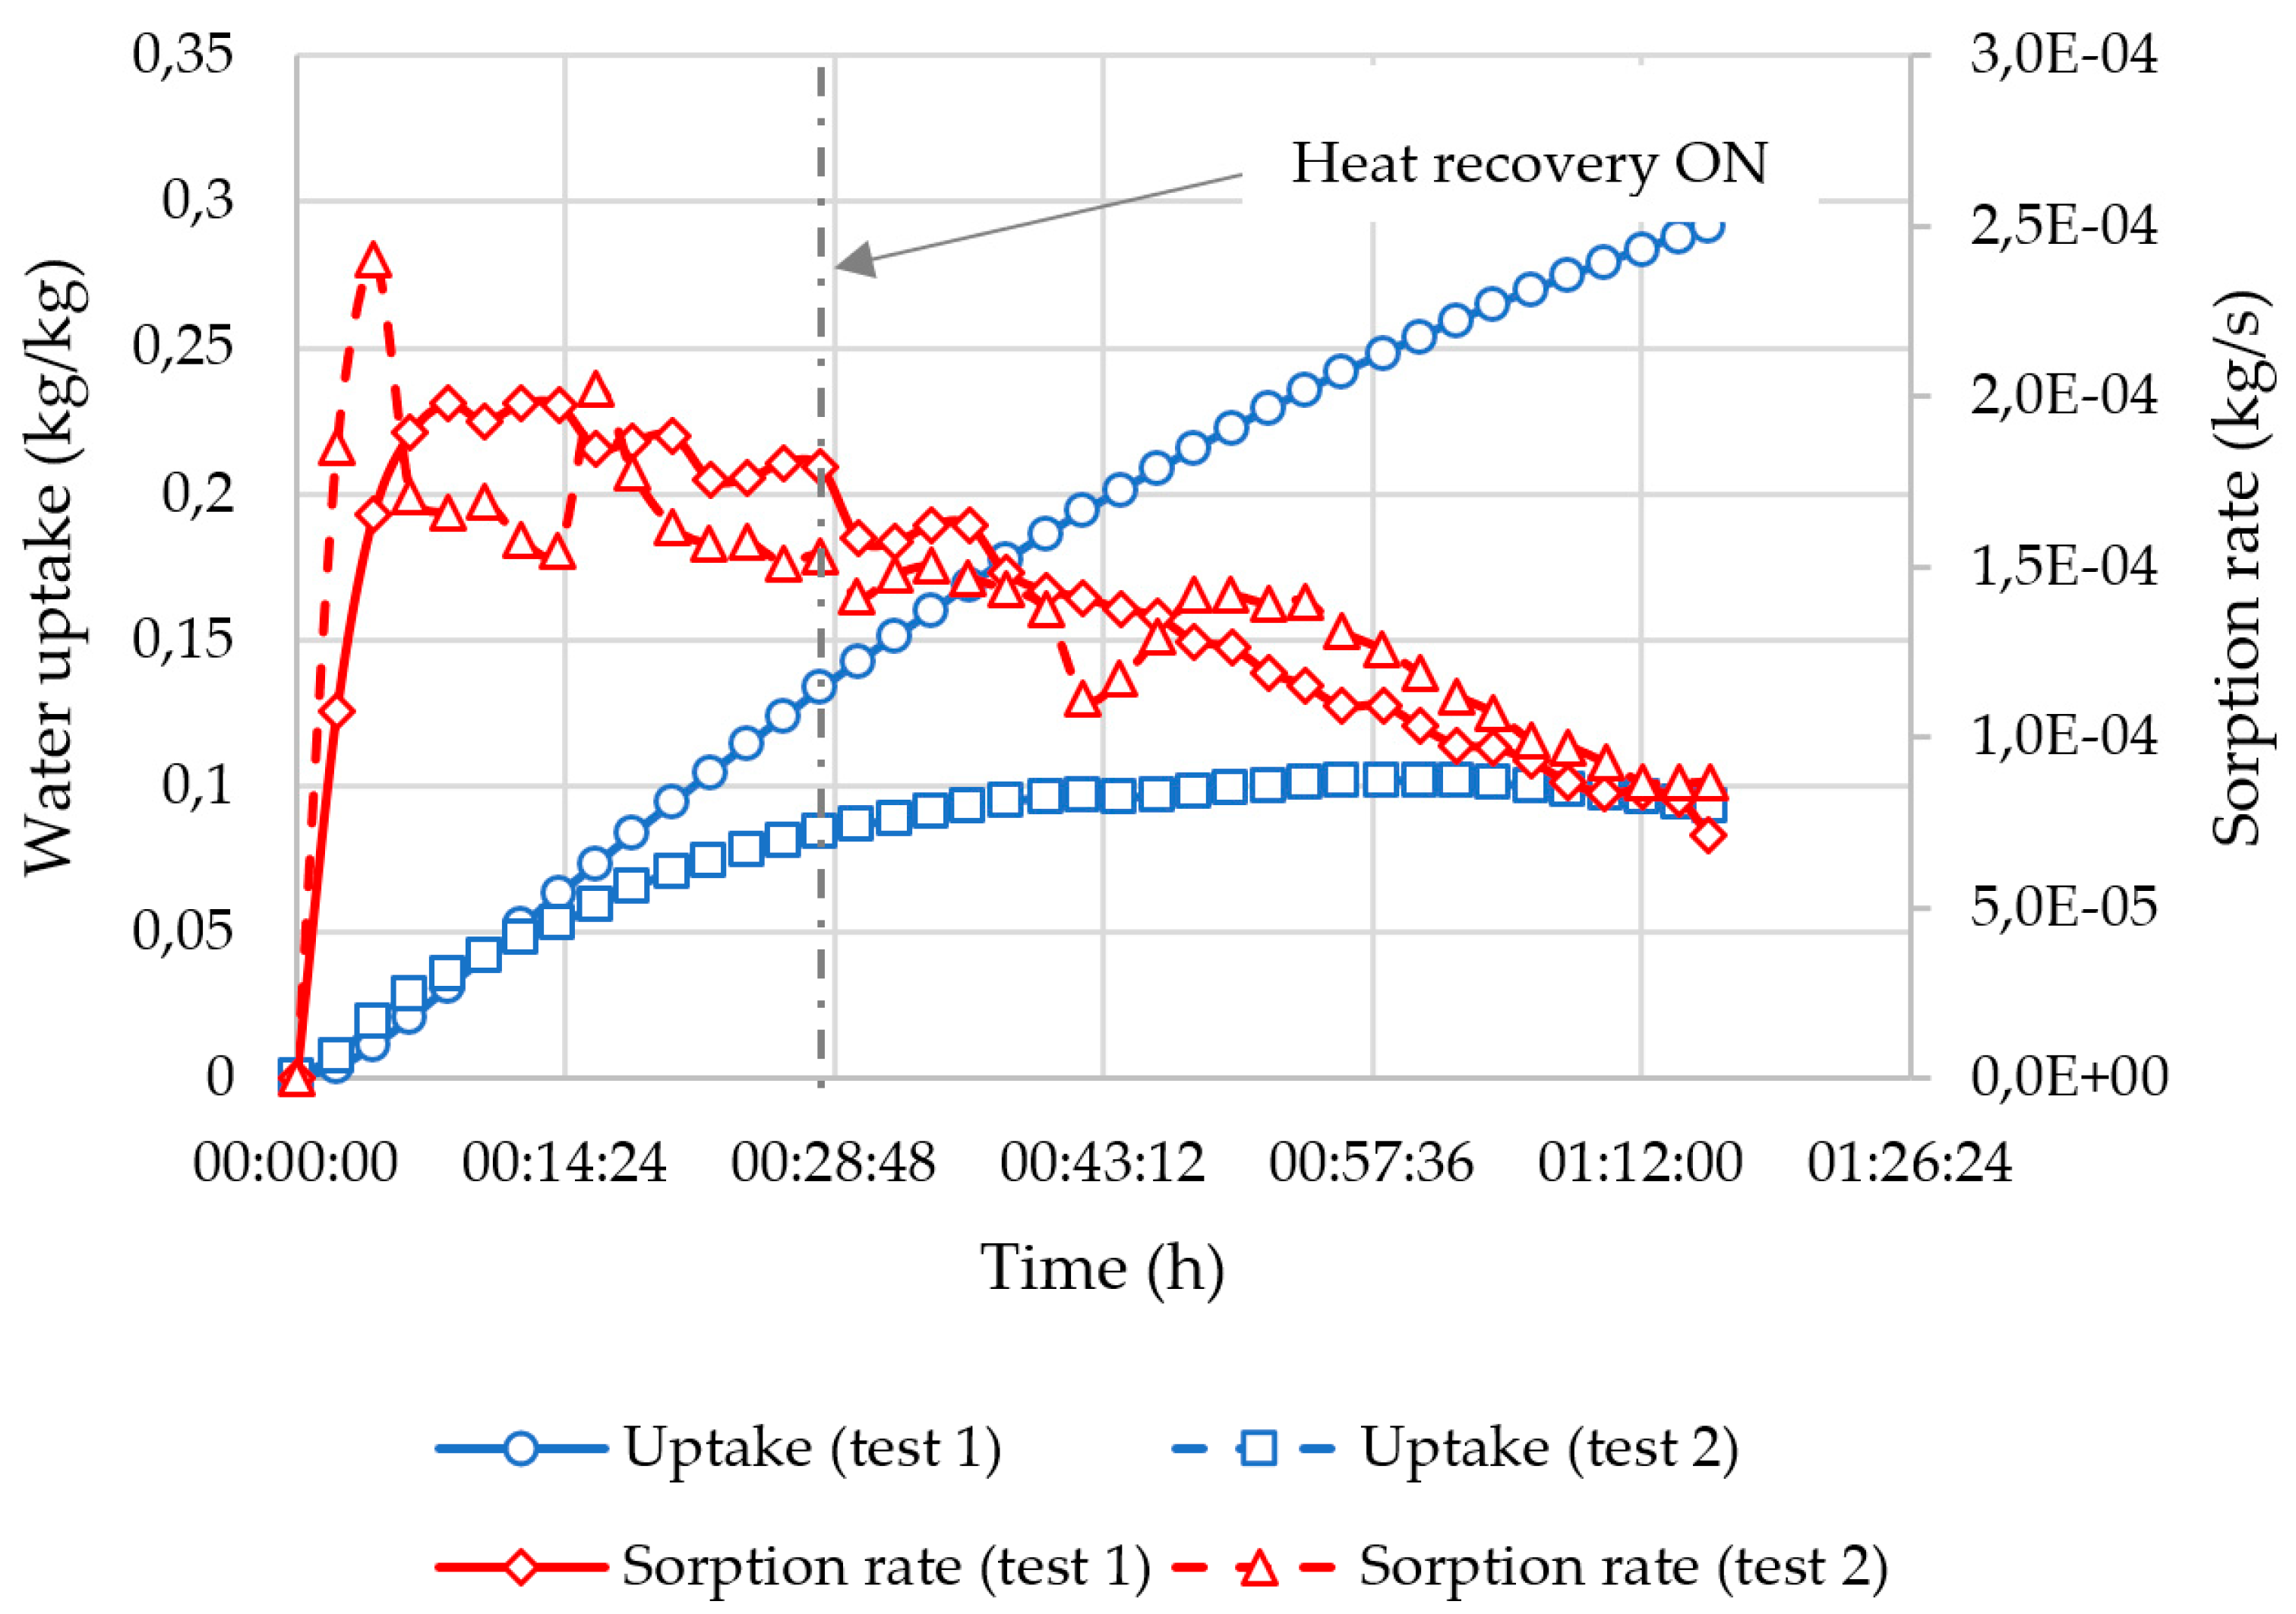
Figure 6, test 1). The maximum of the thermal power of 551 W, as well as the minimum of the water vapor pressure of 1 mbar in the outlet conditions, were reached in 10 min. By this time, the material was loaded with water up to 0.04 kg/kg (see
Figure 7, test 1). The distinct decrease on 50 W of the thermal power appeared after 14 min of work (see
Figure 8, test 1), before the heat recovery was activated. The thermal power continued to decrease after the activation of the heat recovery (see
Figure 8, test 1).
The main driving factor behind the decrease in the thermal power in the fixed packed bed is the extinction of the sorption phenomenon related to the saturation of the material by water (see
Figure 7, test 1). The dynamic adsorption potential
related to the air conditions on the reactor inlet and outlet with
, and to the solid temperature
, also varied during the experiment and modified the sorption capacity. Due to the solid heating, the adsorption potential changed to
kJ/mol at 4 min, which caused the dynamic shift of the virtual equilibrium from 0.81 kg/kg to 0.25 kg/kg (see
Figure 4). As soon as the solid was cooled down, the adsorption potential sprang back to 3.7 kJ/mol that corresponded to 0.44 kg/kg as the virtual equilibrium water uptake. As follows from
Figure 5 and
Figure 6, the heat dissipated by the in-line fan and the activation of the heat recovery brought also the slight swing in the operating conditions (the inlet air temperature and water vapor pressure). The adsorption potential, due to the heat dissipated by the fan, was
kJ/mol, while after the activation of the heat recovery, it was
KJ/mol. The value of
is fully equivalent to
, but the potential
is lower than
. The difference between the potentials
was clearly produced by the reaction advancement (see
Figure 5,
Figure 6 and
Figure 7, test 1), but not by the activation of the heat recovery. Therefore, the contributions from the heat dissipated by the fan or from the heat recovery to the sorption performance of the fixed packed bed are negligible. Moreover, there are no non-linearities in the water mass uptake curve (see
Figure 7, test 1), which could be linked to the effects described above.
The moving bed concept was designed with an idea of keeping the thermal power constant, that might resolve the problem of the gradual decrease of the heat production over time. The experimental results of the reactor running in the moving bed mode are the curves with “☐” and “△” markers in
Figure 5,
Figure 6,
Figure 7 and
Figure 8. The shape of these curves is irregular that proves that the material was not densely packed in the bed. The appearance of discontinuities in the material packing was due to the non-homogeneous flow of the granular medium through the bed, which resulted in the sharp decrease of the outlet temperature (see
Figure 5, test 2) and the drop of the thermal power (see
Figure 8, test 2). The discontinuities of the material flow can be clearly observed at different time, when the sharp raise of the outlet vapor pressure coincides with the drop of the sorption rate (see
Figure 6 and
Figure 7, test 2).
The adsorption potential in the reactor inlet conditions was lower than for test 1, namely
kJ/mol, before the hydration reaction started. Since the initial dehydration state of the material used for tests 1 and 2 was the same (see
Table 3), the initial
was also the same. With account of
and using the data in
Figure 4, the maximum loading lift for test 2 can be predicted as high as 0.9 kg/kg, that is 11% greater than for test 1. This explains the steep temperature jump observed at
min in
Figure 5 (see test 2). But once the solid was heated up, the dynamic adsorption potential increased to
kJ/mol, causing the drop of the virtual equilibrium to 0.37 kg/kg. The additional heat from the fan and the activation of the heat recovery had likewise a negligible effect on the sorption process: the both adsorption potentials changed only to 4.3 kJ/mol.
Therefore, the main drawback of the moving bed reactor came from the non-homogeneous granular flow that did not allow the thermal power to be stable. This drawback can be potentially eliminated by optimizing the thickness of bed and the particles size in face of the reasonable pressure drop through the bed. Nevertheless, the value of ~421 W of the thermal power produced in the moving bed test can be considered as a constant on the time span from 20 min to 56 min (see
Figure 8, test 2), and because the outlet air temperature, the vapor pressure and the sorption rate encountered little variations (see
Figure 5,
Figure 6 and
Figure 7, test 2). The point at 42 min is the outlier. This time span also matches the end of the transient hydration process of the moving bed, when the material hydration state reached the stable level of ~0.1 kg/kg (see
Figure 8, uptake curve for test 2).
The water mass uptake for the moving bed was verified with the moisture analyzer HE73 from Mettler Toledo after 33 min and 1 h 15 min. The measured values were 0.13 kg/kg and 0.09 kg/kg that generally confirmed the correctness of the uptake estimation with equation (8) as shown in
Figure 7. As follows from
Figure 7, the hydration state of the material leaving the reactor is significantly lower compared to the fixed bed test because of the discontinuities and the non-homogeneous sorption through the moving bed (see
Figure 7). Also, the solid residence time in the reactor was not enough to reach an adequate hydration level. As a consequence, the energy density of material in the moving bed energy storage system is 2.5 times lower than for the equivalent fixed bed installation (see data in
Table 4). The solid feed rate was set to 1.2
kg/s, which represented the ~30 min hydration cycle of the material mass per one bed. The estimated averaged solid velocity
was ~0.28
m/s. The duration of the hydration cycle was selected in such a way that the material overhydration could be avoided. The overhydration of the tested material leads to the formation of a highly viscous granular mix, which cannot be moved through the bed and the rotary valve. Therefore, the design of the moving bed reactor must be improved.
Finally, the curves of the thermal power match the reaction thermal power for the both tests (see
Figure 8). This fact also proves the correctness of the application of the equations (1) and (2), used to calculate the energy densities in
Table 4, as well as the water mass uptake in
Figure 7.
3.2. Water Tank Energy Charging
The water tank charging process is depicted in
Figure 9 and
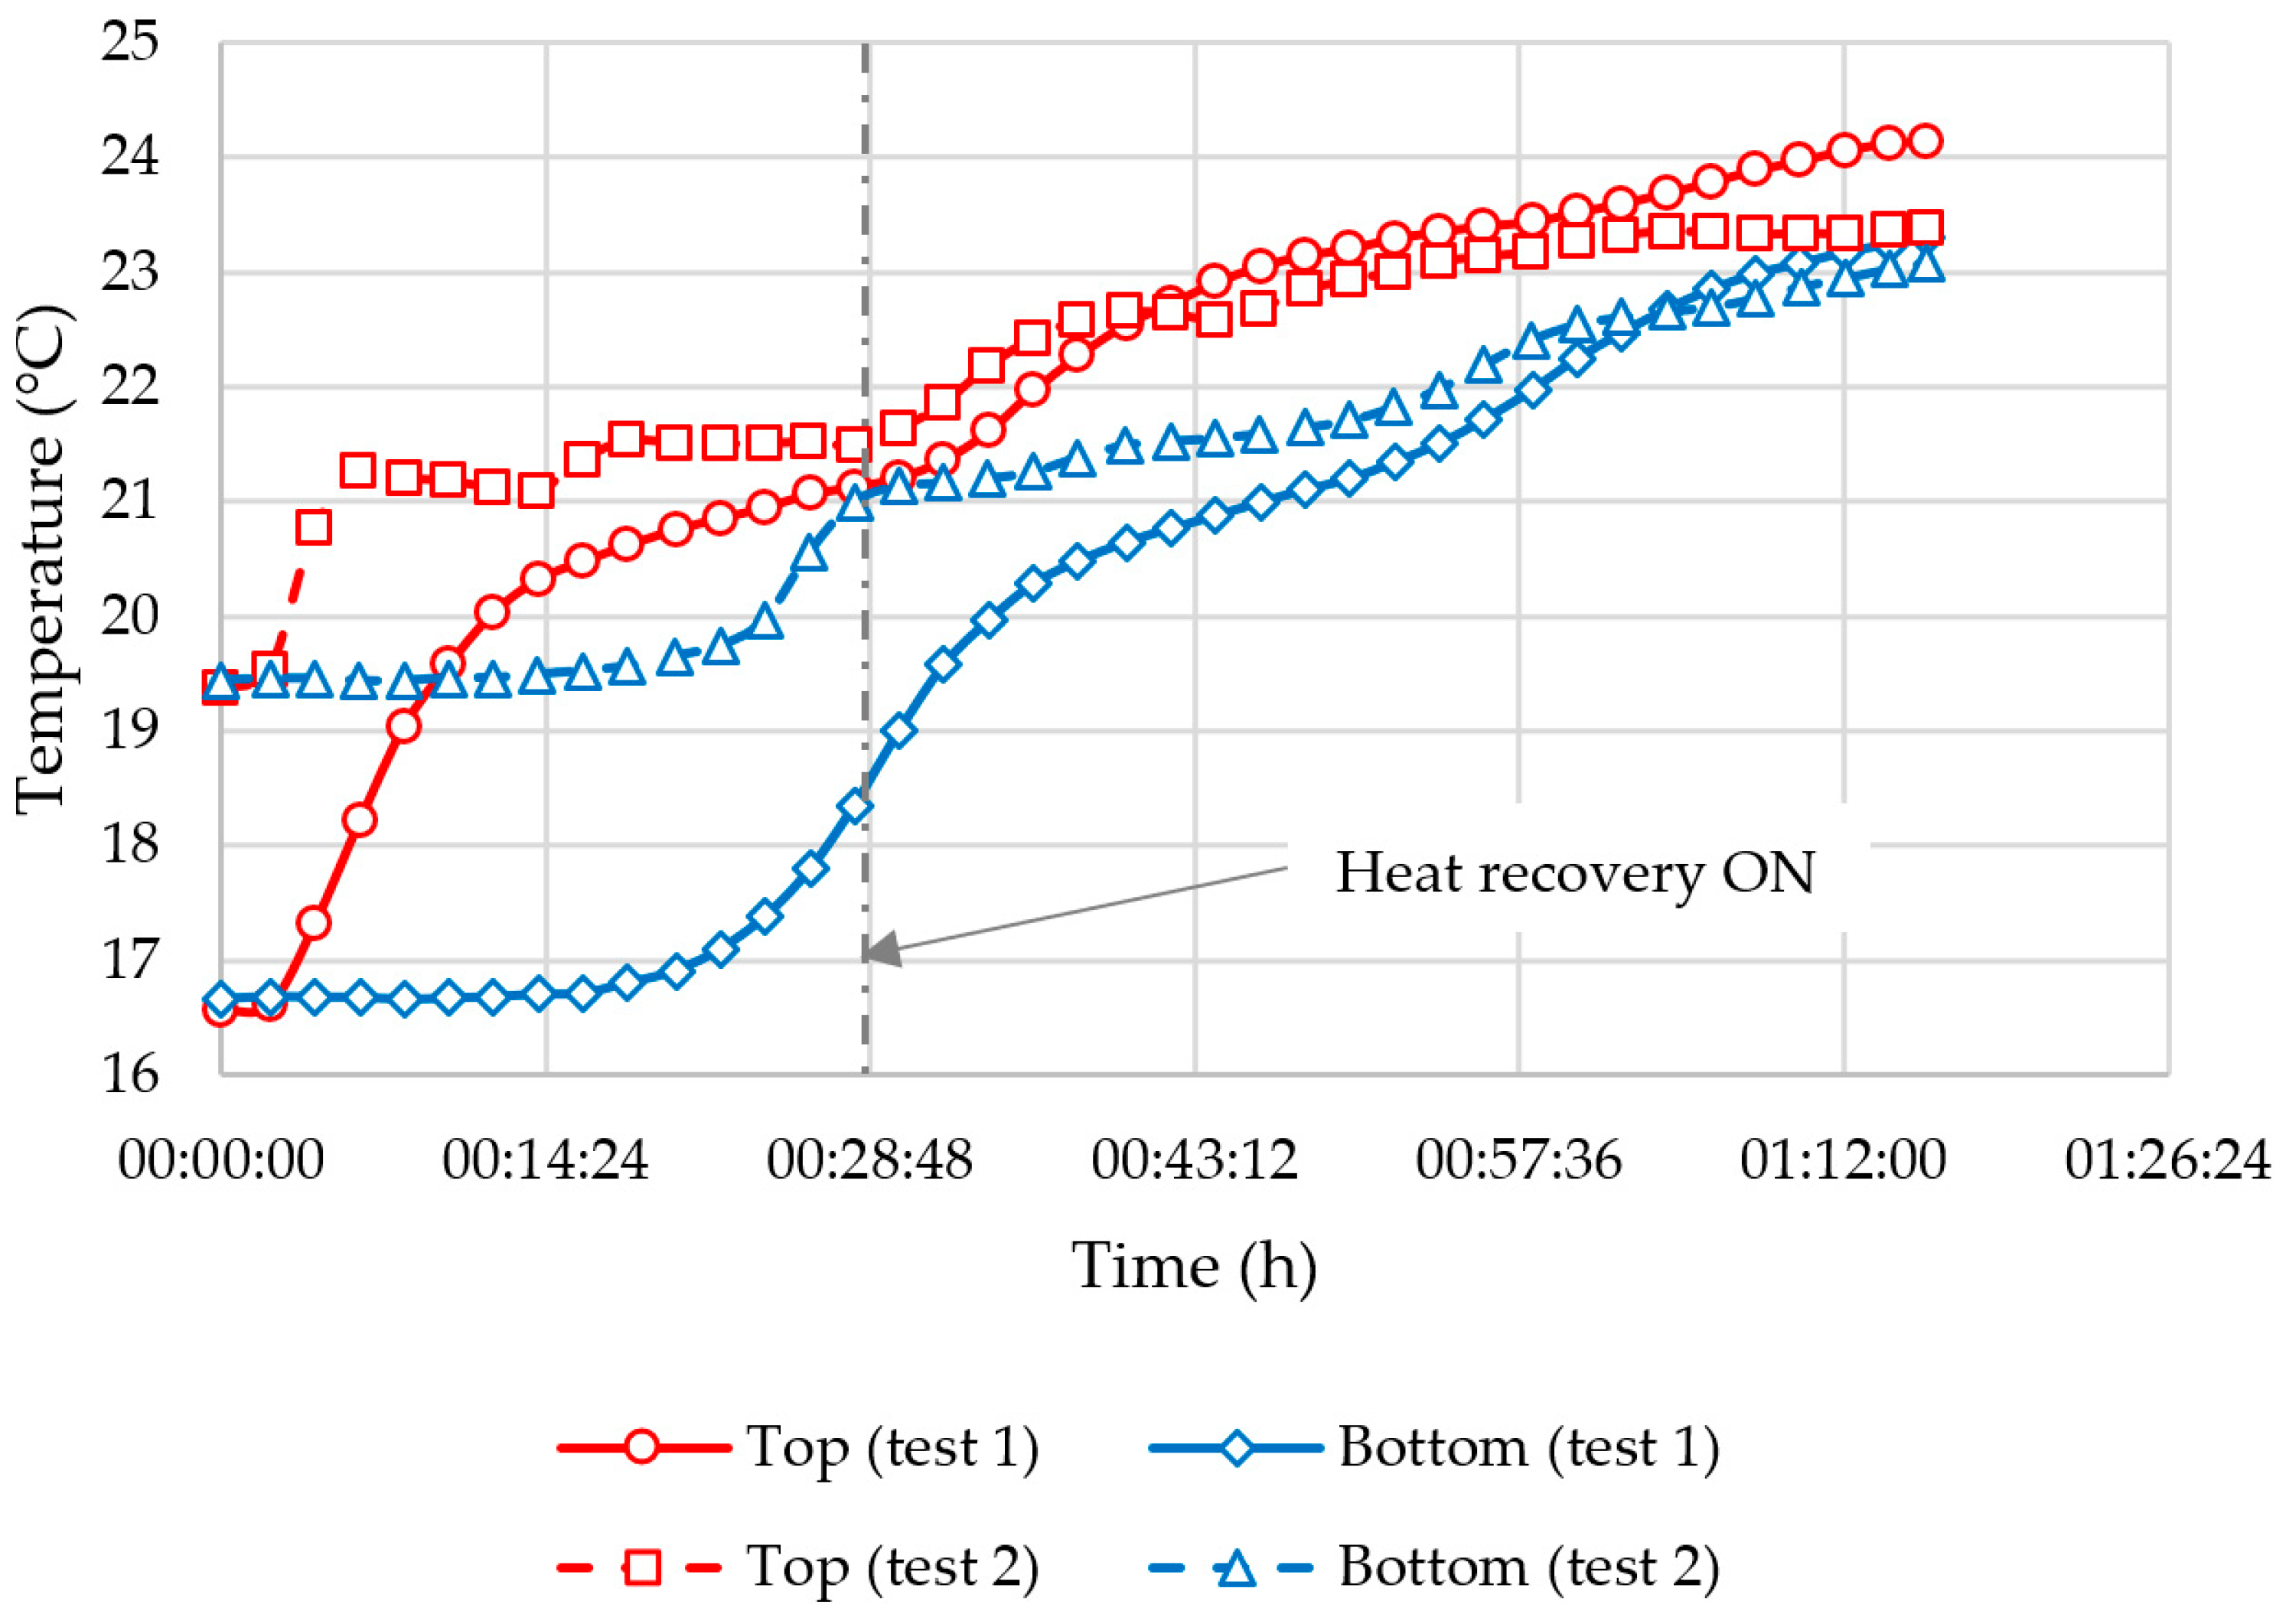
Figure 10. One can see that tests 1 and 2 are very correlated in terms of temperature levels and the energy charged to the water storage tank. The drop of charging performance for both tests occurred when the temperature at the bottom of the tank was going to rise, even before the heat recovery was switched on (see
Figure 9, curves with “◇” and “△” markers).
The increase of the water temperature measured at the bottom part of the tank represents the loss of the stratification inside the water storage tank. Although, the charging process started at different initial temperatures as it is shown in
Figure 9, the reasonable moment to activate the heat recovery was related to the loss of the stratification in the water storage tank.
The energy charging process mostly depended on the stratification state of the water storage tank. The maximum of the thermal power, being transmitted from the reactor to the tank, corresponded to the maximum temperature difference between the top and the bottom parts of the water storage (see
Figure 9 and
Figure 10).
Concerning the fixed packed bed, the decrease in the thermal power in
Figure 10 was due simultaneously to the attenuation of the sorption reaction (see
Figure 8) and to the loss of the stratification in the tank (see
Figure 9). The activation of the heat recovery had the positive effect on the global performance, that will be shown in the next subheading.
On the account of the moving bed test, the loss of the stratification was the main reason of the decrease of the thermal power. It can be seen in
Figure 10 (test 2), that the charging thermal power started to decrease even before the activation of the heat recovery. But it remained constantly stable around the ~320 W level from 30 min to 55 min (see
Figure 10, test 2), without considering the outliers at 44 min. However, starting from 57 min, the charge of the water storage was not very effective for the both tests because of the significant uniformization of the tank temperature and because the hydration reaction was in the terminal state.
3.3. Auxiliary Components Dynamics
The prototype global performance can be also analyzed in terms of the effectiveness of auxiliary components, such as air-to-water and air-to-air heat exchangers. The dynamic effectiveness of these heat exchangers was calculated from the measured data using the equation (4). The plots of the dynamic effectiveness
and
are shown in
Figure 11. As follows from
Figure 11, there was no much difference in the dynamic effectiveness between the both tests. The effectiveness of the air-to-air heat exchanger
during the heat recovery operation reached 0.95 (see
Figure 11, the curves with “⚪” and “☐” markers). This value fully corresponds to the nominal heat exchanger effectiveness at 150 m
3/h of the air flow rate.
The effectiveness of the air-to-water heat exchanger
is directly correlated with the water storage stratification state. It is clear, that the greater is the temperature difference between the inlet and outlet of this heat exchanger (see
Figure 9), the higher is the effectiveness
(see
Figure 11, the curves with “△” and “◇” markers). The maximum air-to-water heat exchanger effectiveness was 0.96 for the fixed bed (test 1), while for the moving bed (test 2) it was 0.9, before the temperature in the bottom part of the water tank was going to increase.
The positive effect of the heat recovery on the effectiveness
can be shortly observed in
Figure 11 (“△” and “◇” curves) as a small plateau between 28 min and 30 min. For the fixed packed bed, the value of
continued to diminish gradually from 0.88 to 0.48 that occurred within the same time as the sorption phenomenon was extinct and the overall temperature of the water tank tended to uniformization. On the contrary, the effectiveness
for the moving bed test was kept almost constant at the level of 0.78 during 24 min (see
Figure 11), that clearly demonstrates the strong side of the moving bed reactor.
3.4. Perspectives
Regarding the goals and the obtained results, future research will be oriented towards achieving full charge of the hot water storage tank above 40 °C. Some technical solutions are being under development, including the multi-material charge strategy, multi-stage energy storage, and variable flow rate charge operation. It is assumed that each hypothetical material should fit a restricted range of operating conditions according to the shape of its characteristic curve. This would guarantee the highest loading lift and thus the best energy storage density of used materials under variable ambient conditions. The multi-stage storage architecture and the ability to work with variable flow rate in the air-to-water heat exchanger will allow the heat exchanger’s effectiveness to be enhanced. These solutions open larger possibilities for the adaptation of the thermochemical energy storage to ambient conditions.


