Contamination Improvement of Touch Panel and Color Filter Production Processes of Lean Six Sigma


Abstract
:Featured Application
Abstract
1. Introduction
2. Research Design
3. Research Methodology
3.1. D (Define) Phase
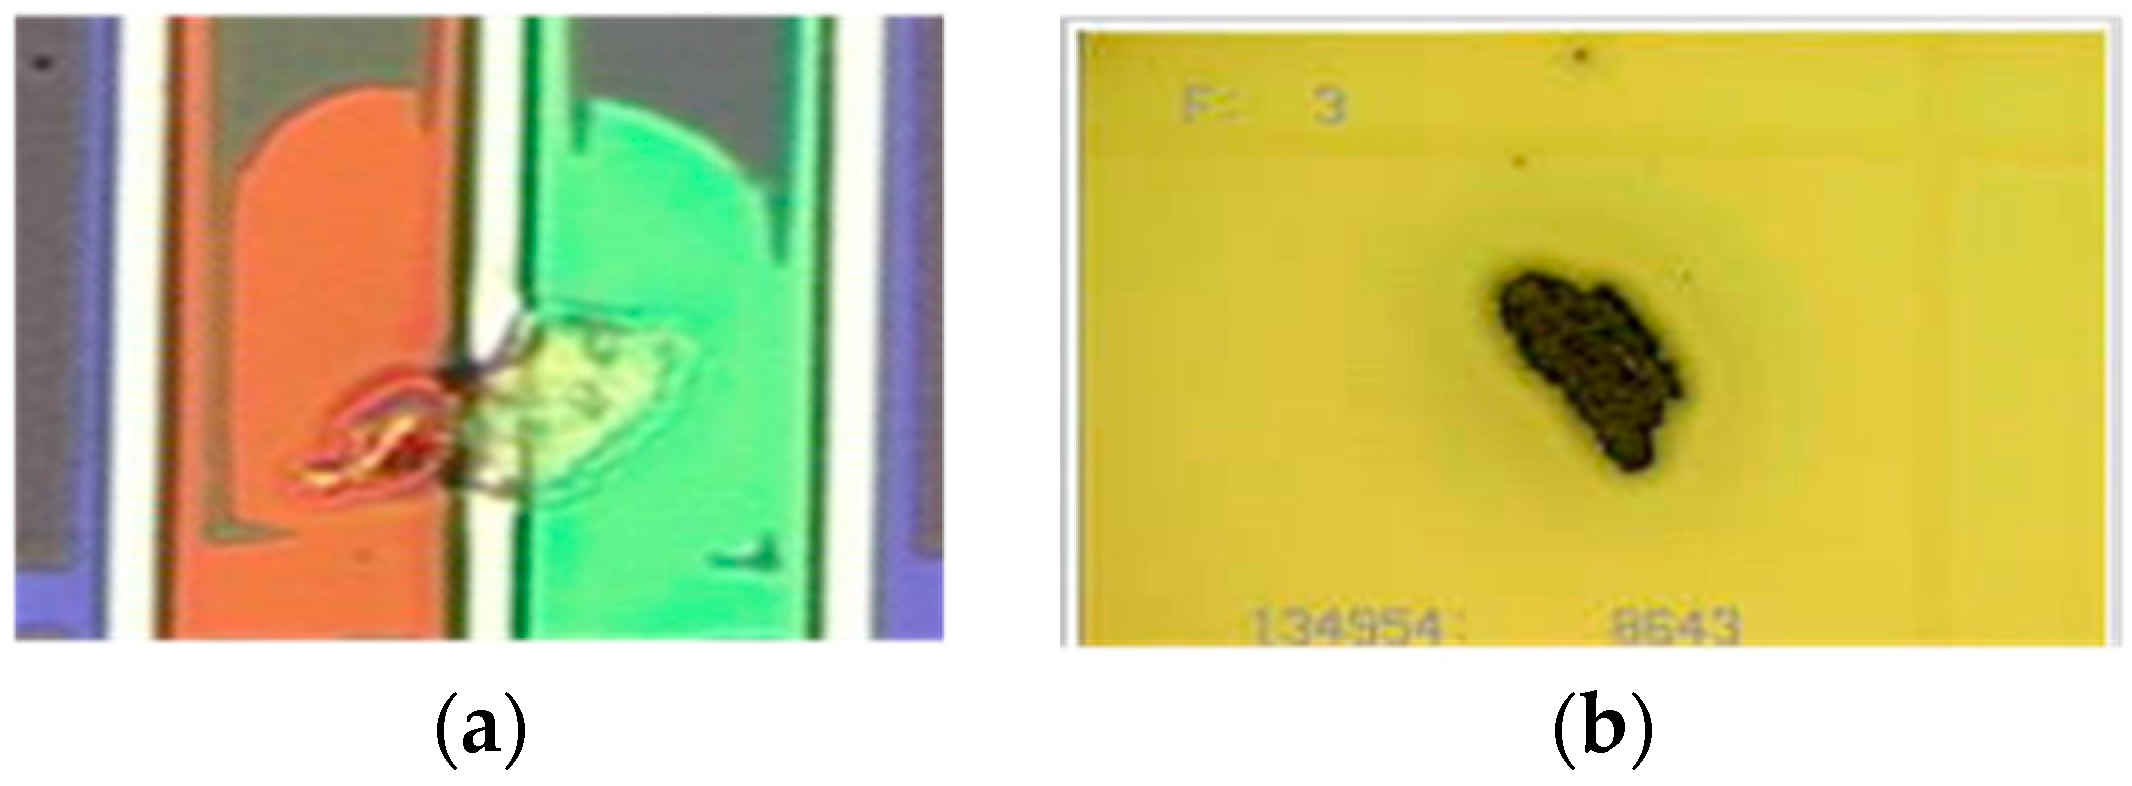
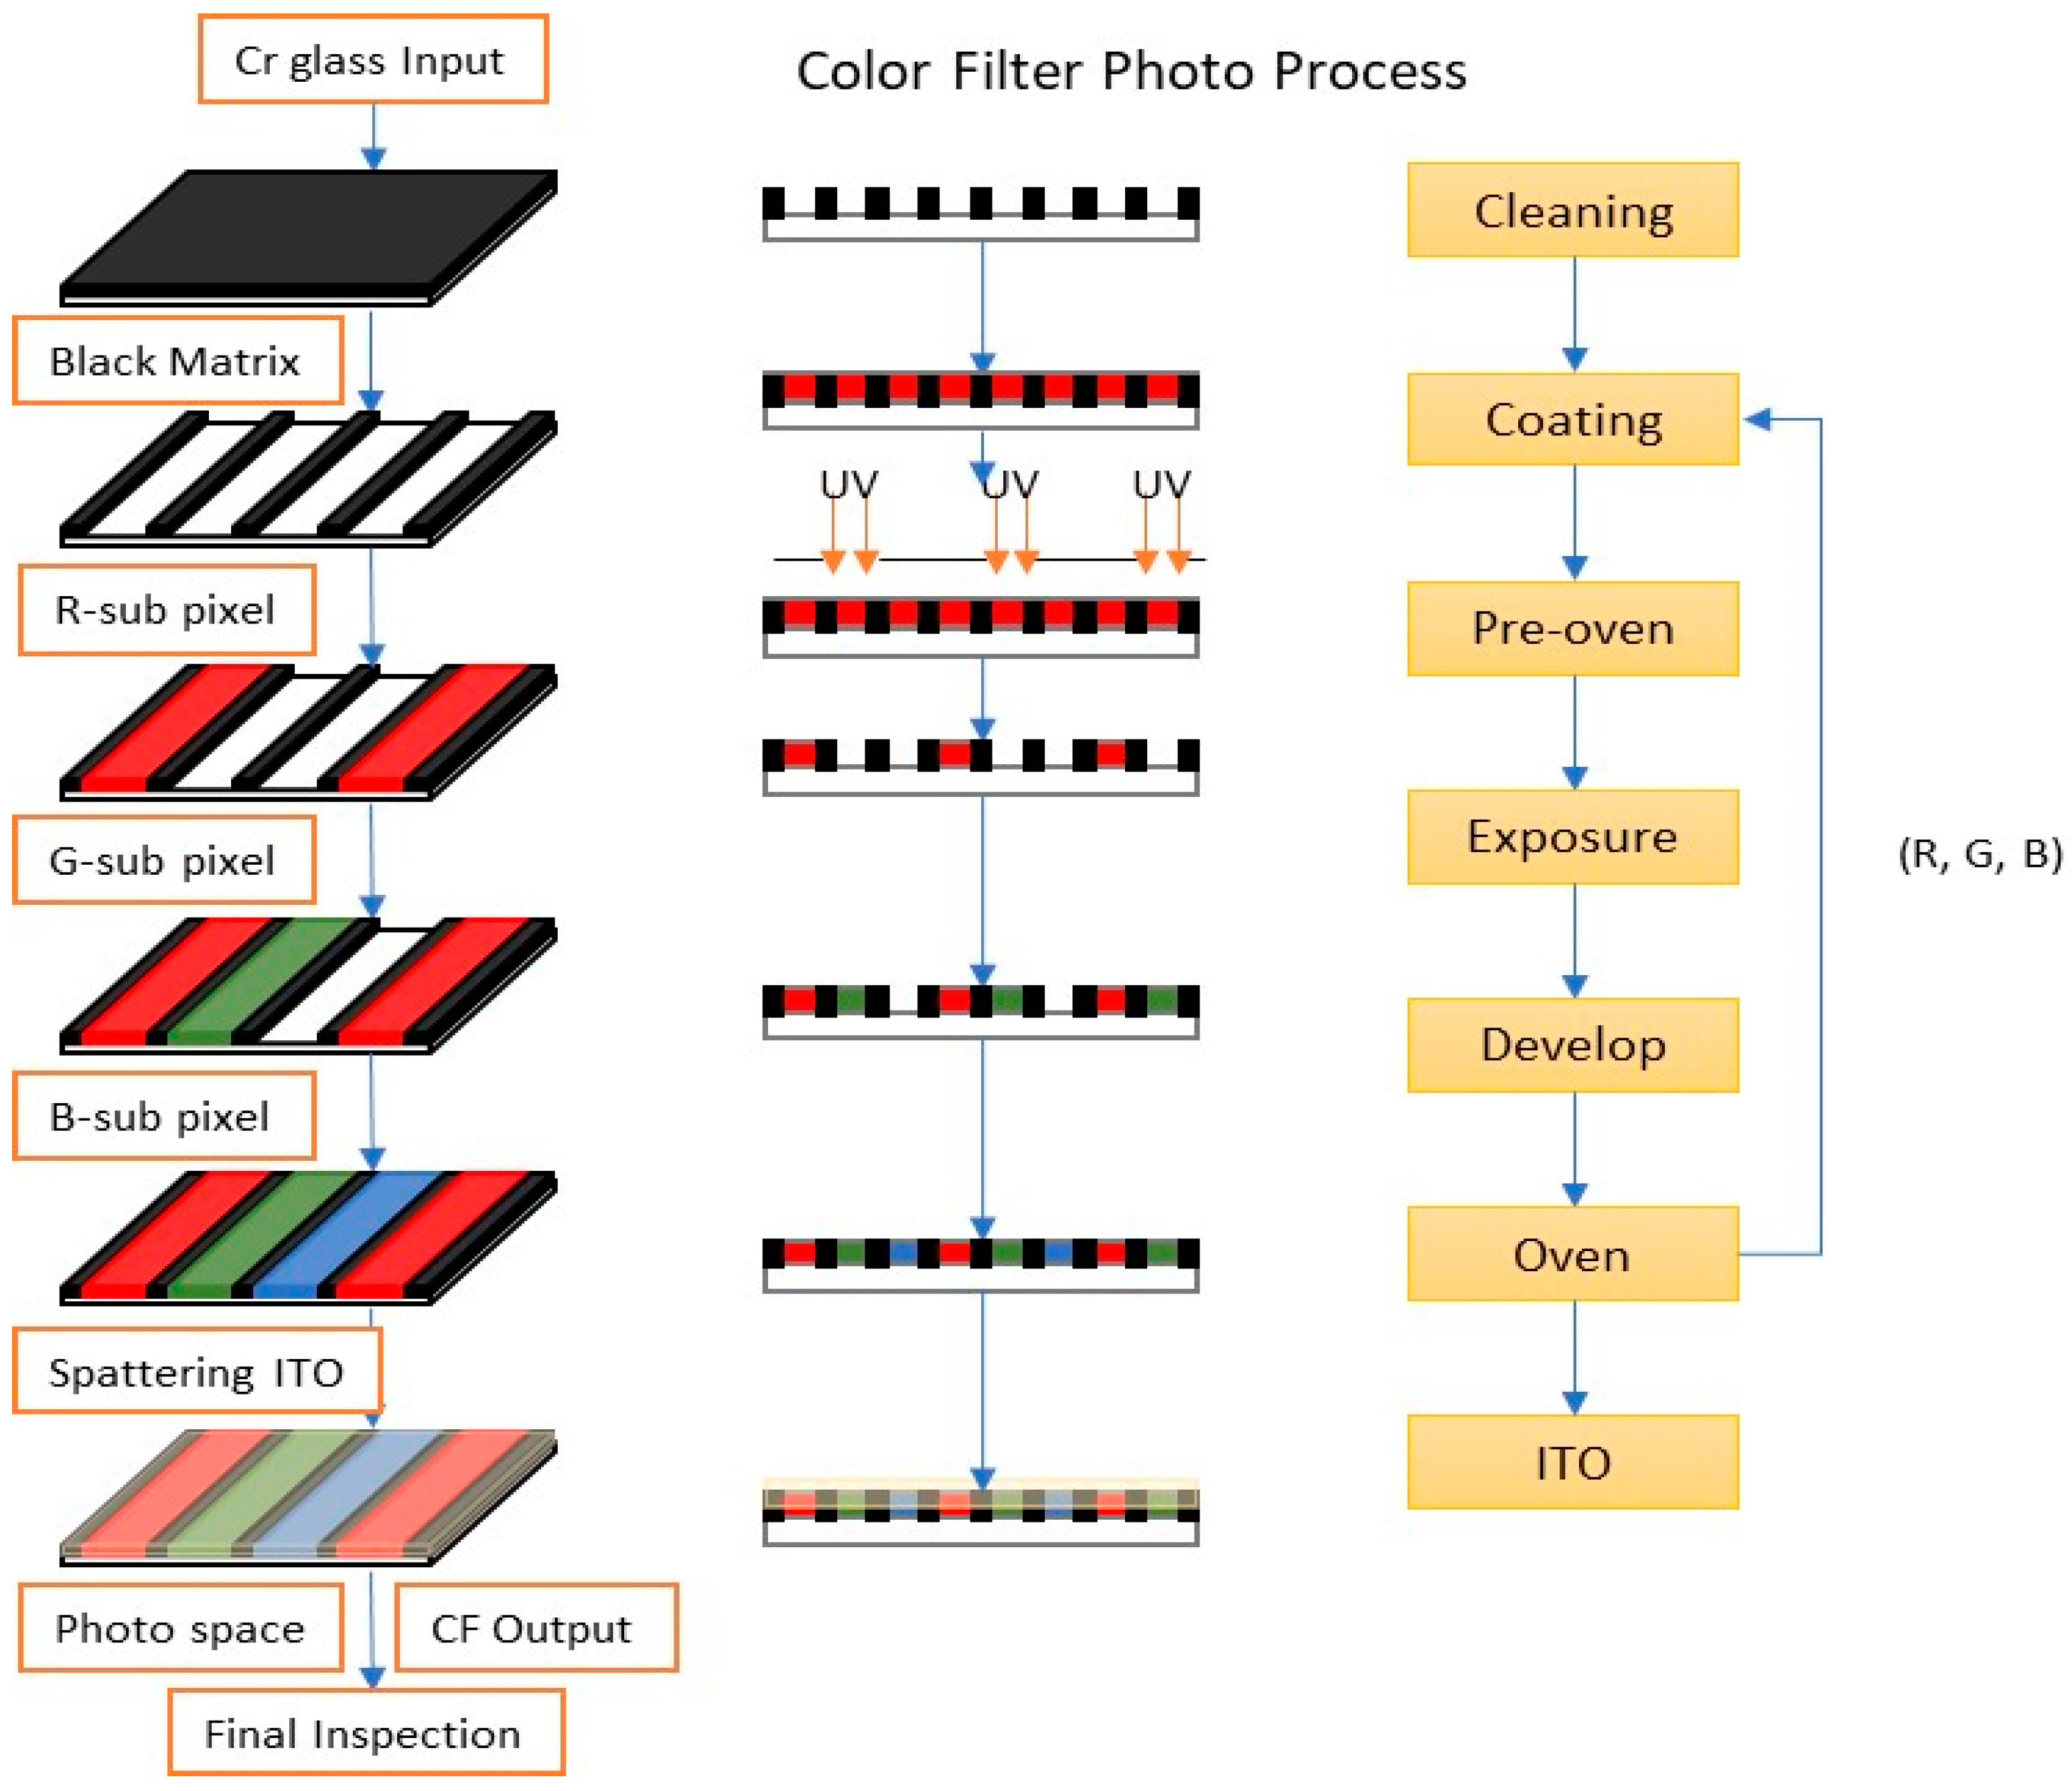
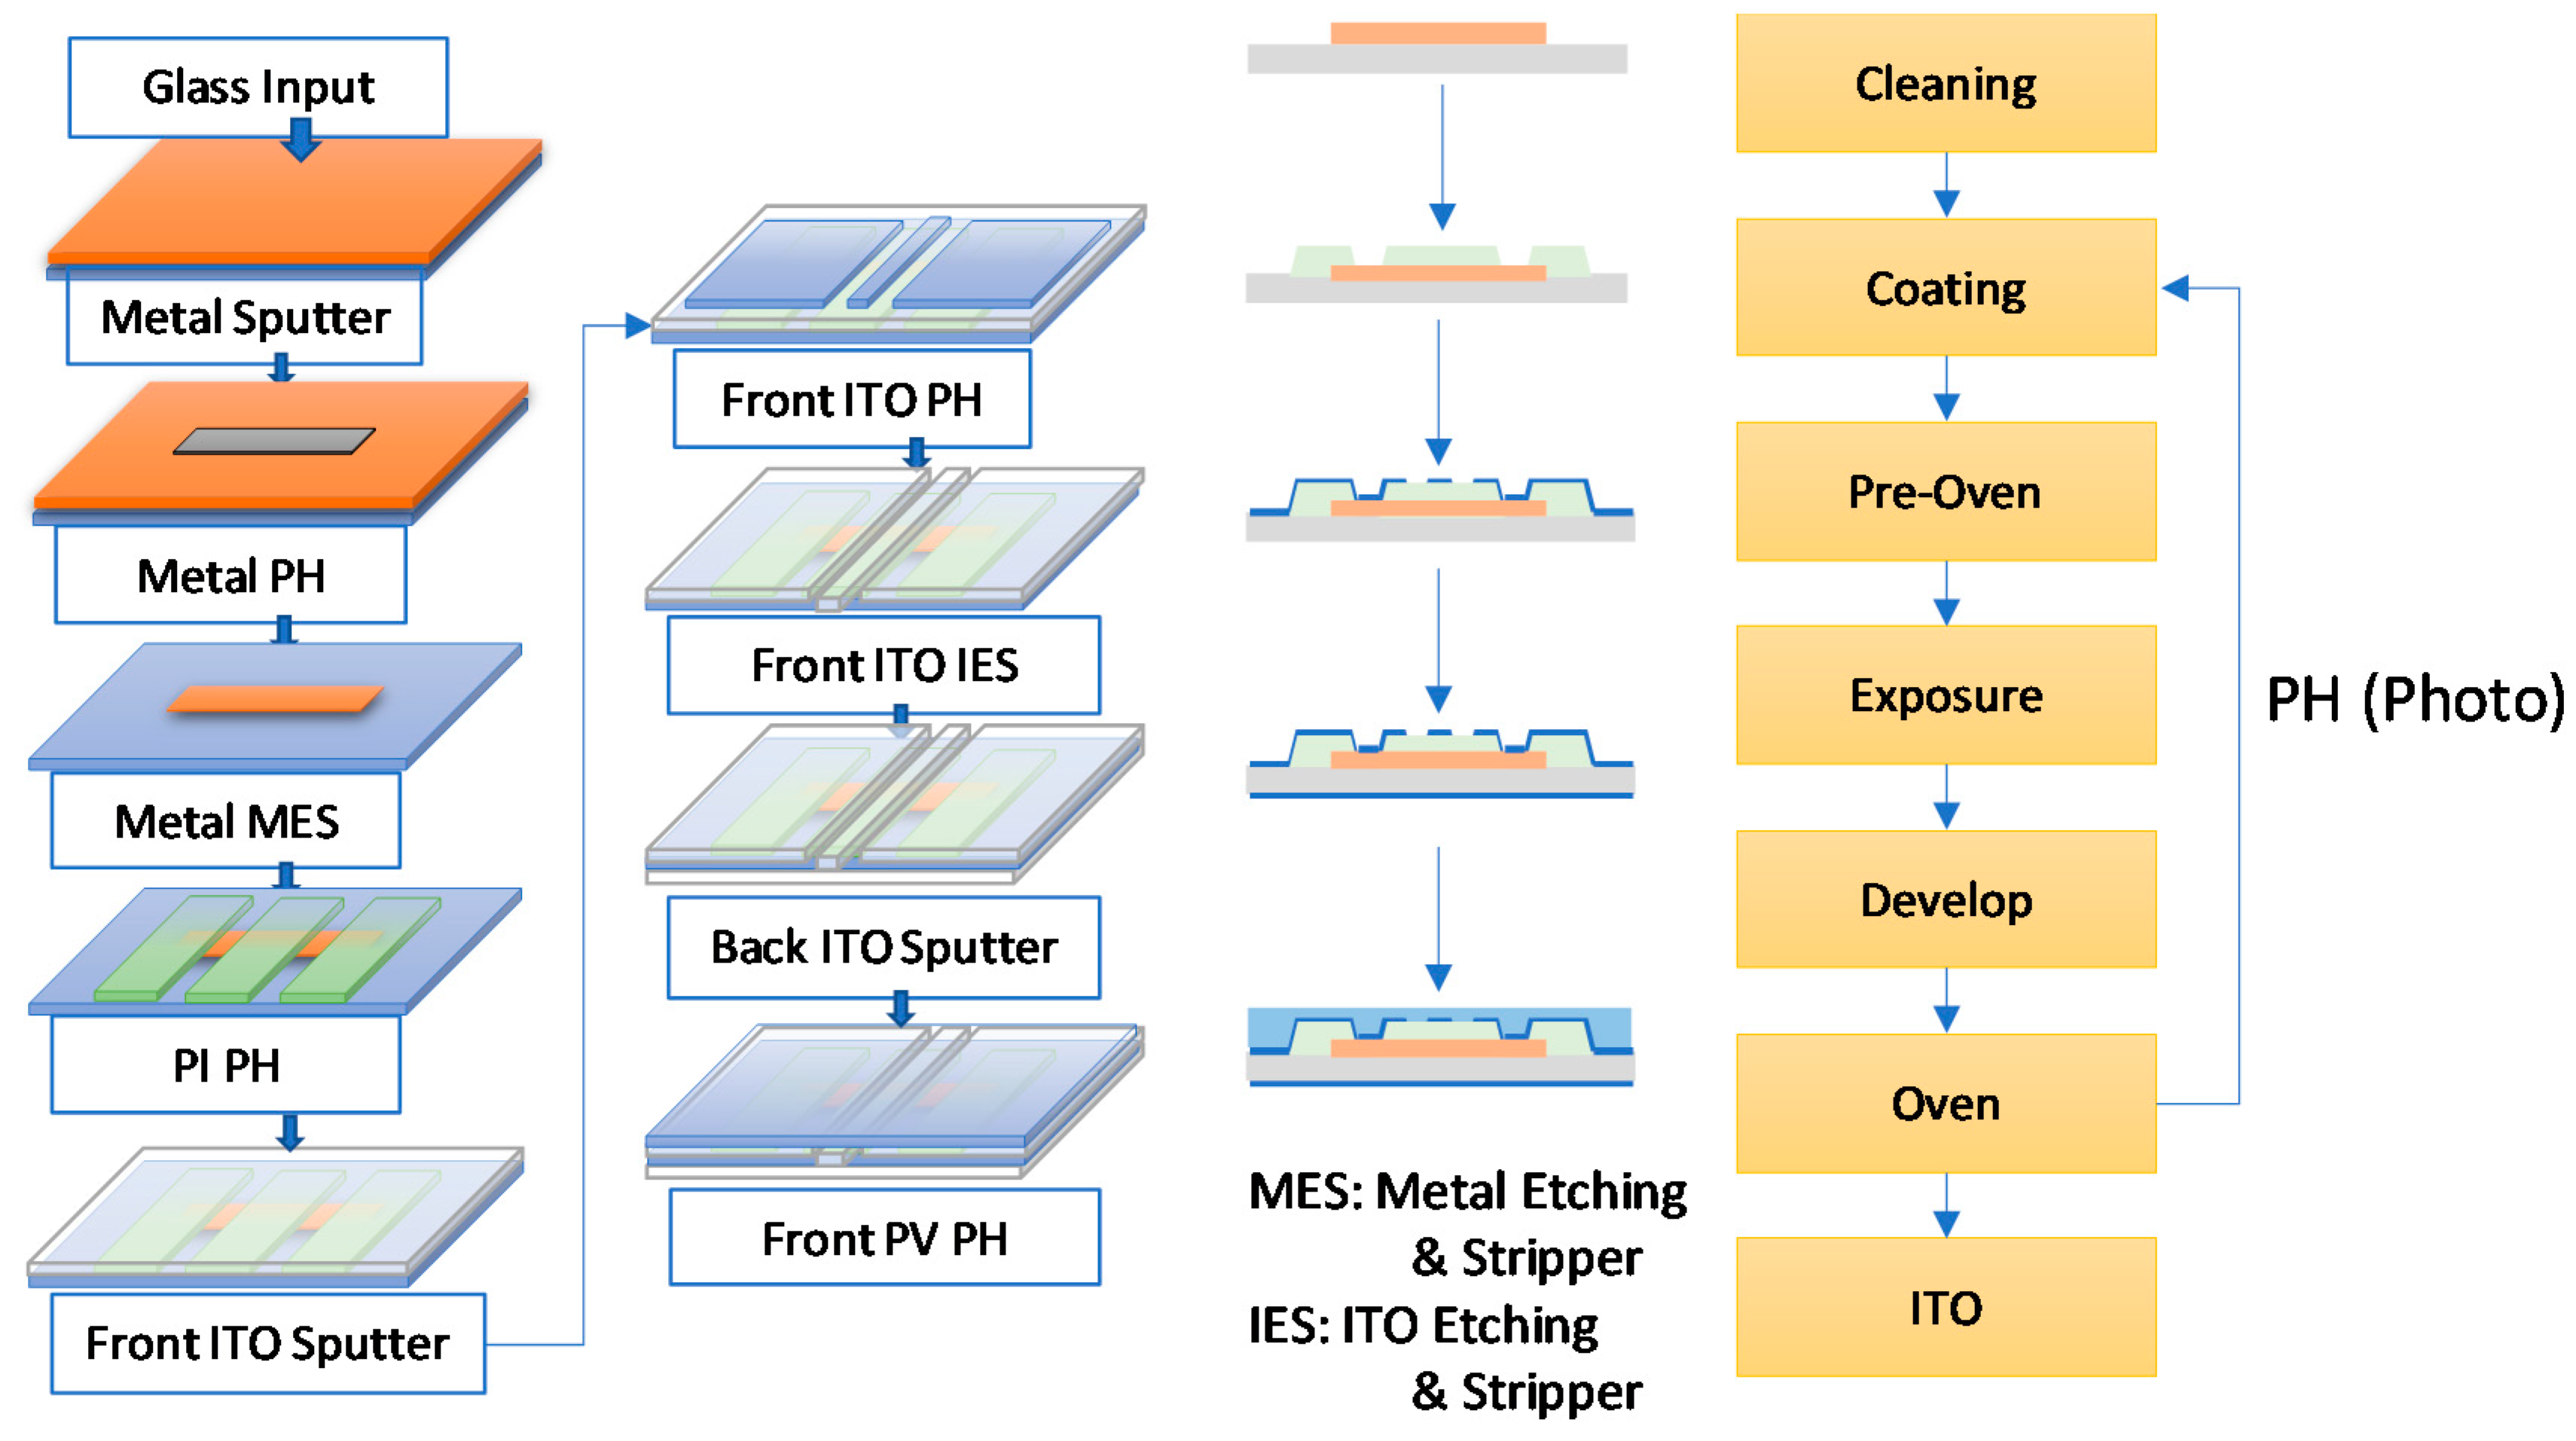
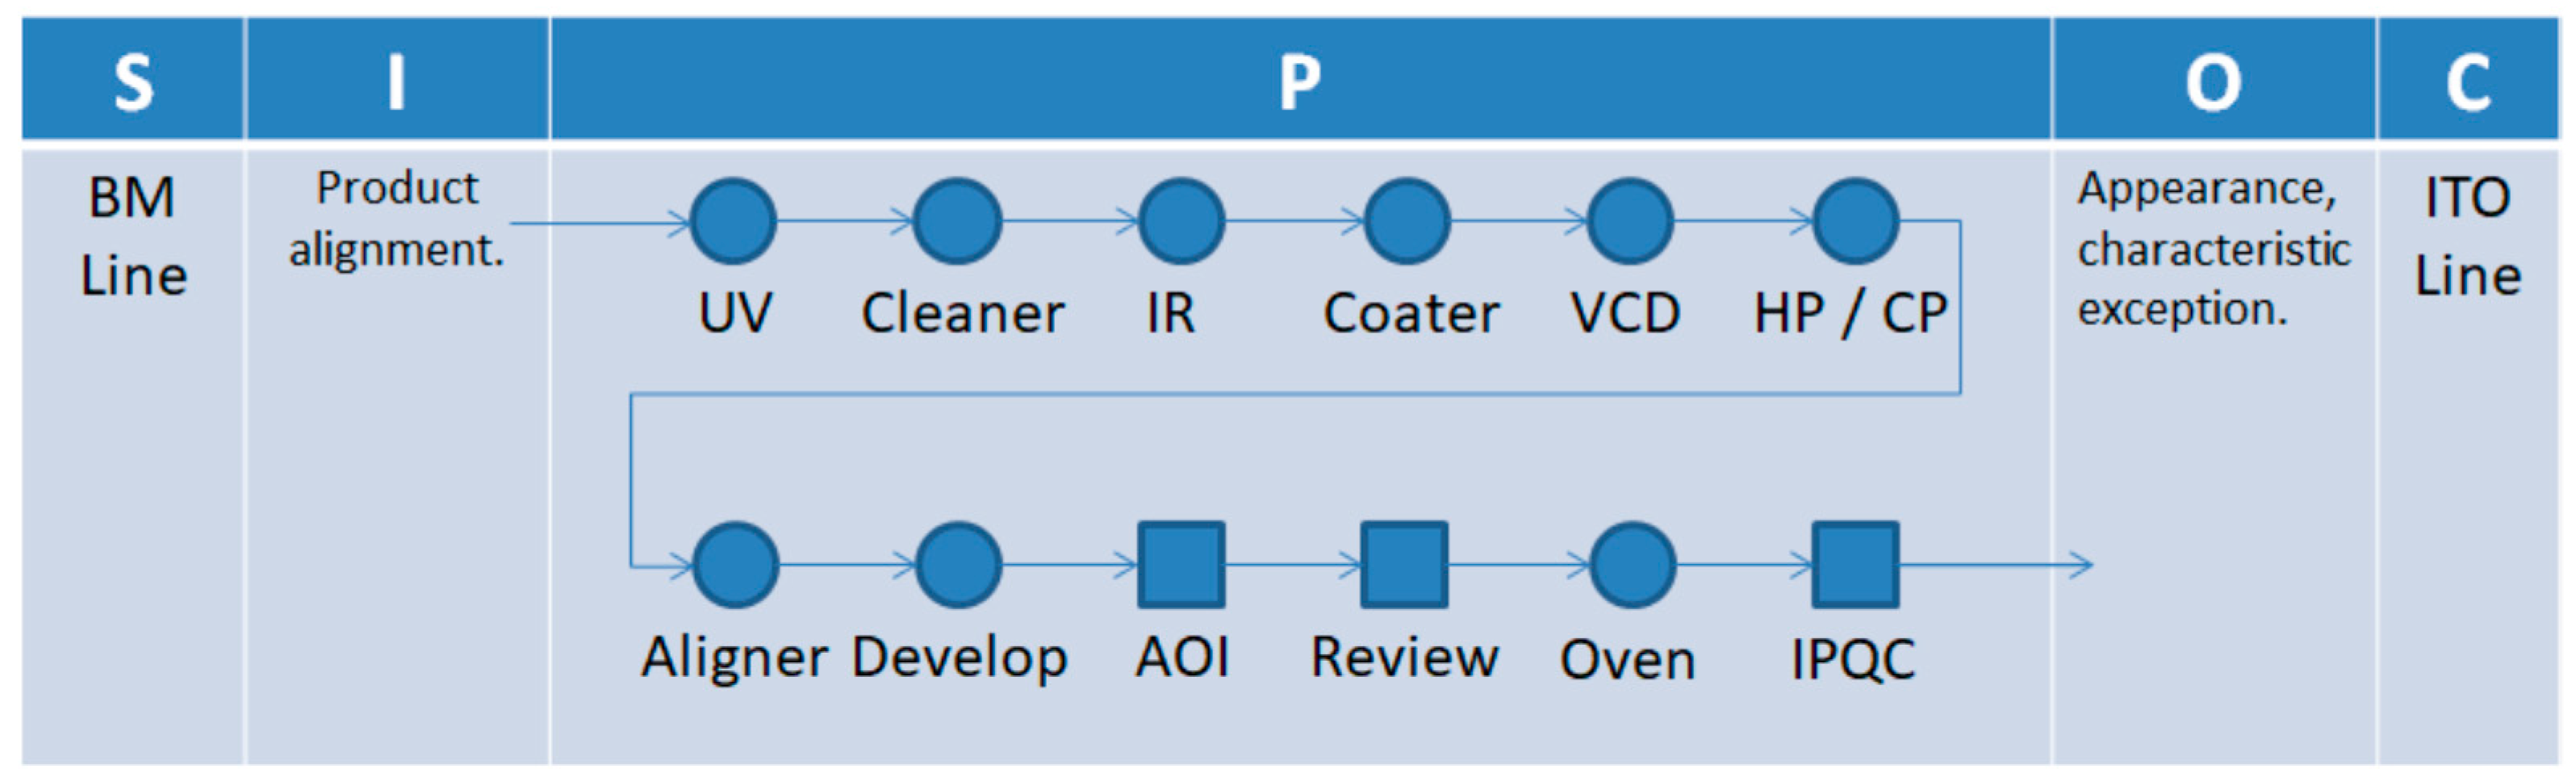
- The case study mainly produces color filters and touch sensors. In the processes, because the proportion of contamination is too high, affecting internal processes production, the number of rejects is too high. It even affects production schedules, equipment utilization, and product turnover. Therefore, the company set up an improvement project to solve this problem: the first phase of the project. Basically it involves defining the problem, the input/output, and the process factors. This consists of four steps: first is checking the problem statement, then current situation. Finding out what the customer really wants to improve about the problem, defining the quality specifications, and finding which characteristics the product needs to have in order to satisfy the customer. Next, we check the process map with a Supplier–Input–Process–Output-Customer (SIPOC) diagram. Finally, we set-up a project team. Table 1 shows the project’s steps, description, indicators, and tools. In this phase, the most important thing is to clarify the needs of internal and external customers and clearly define the project objectives. In this case, a project team was set up with a black belt as the project leader and six green belts as project members, and the members’ respective rights and responsibilities were defined in this phase: The project team can preconfirm the workflow and plan using the SIPOC diagram.
- Confirm the cause of the defect with the fishbone diagram.
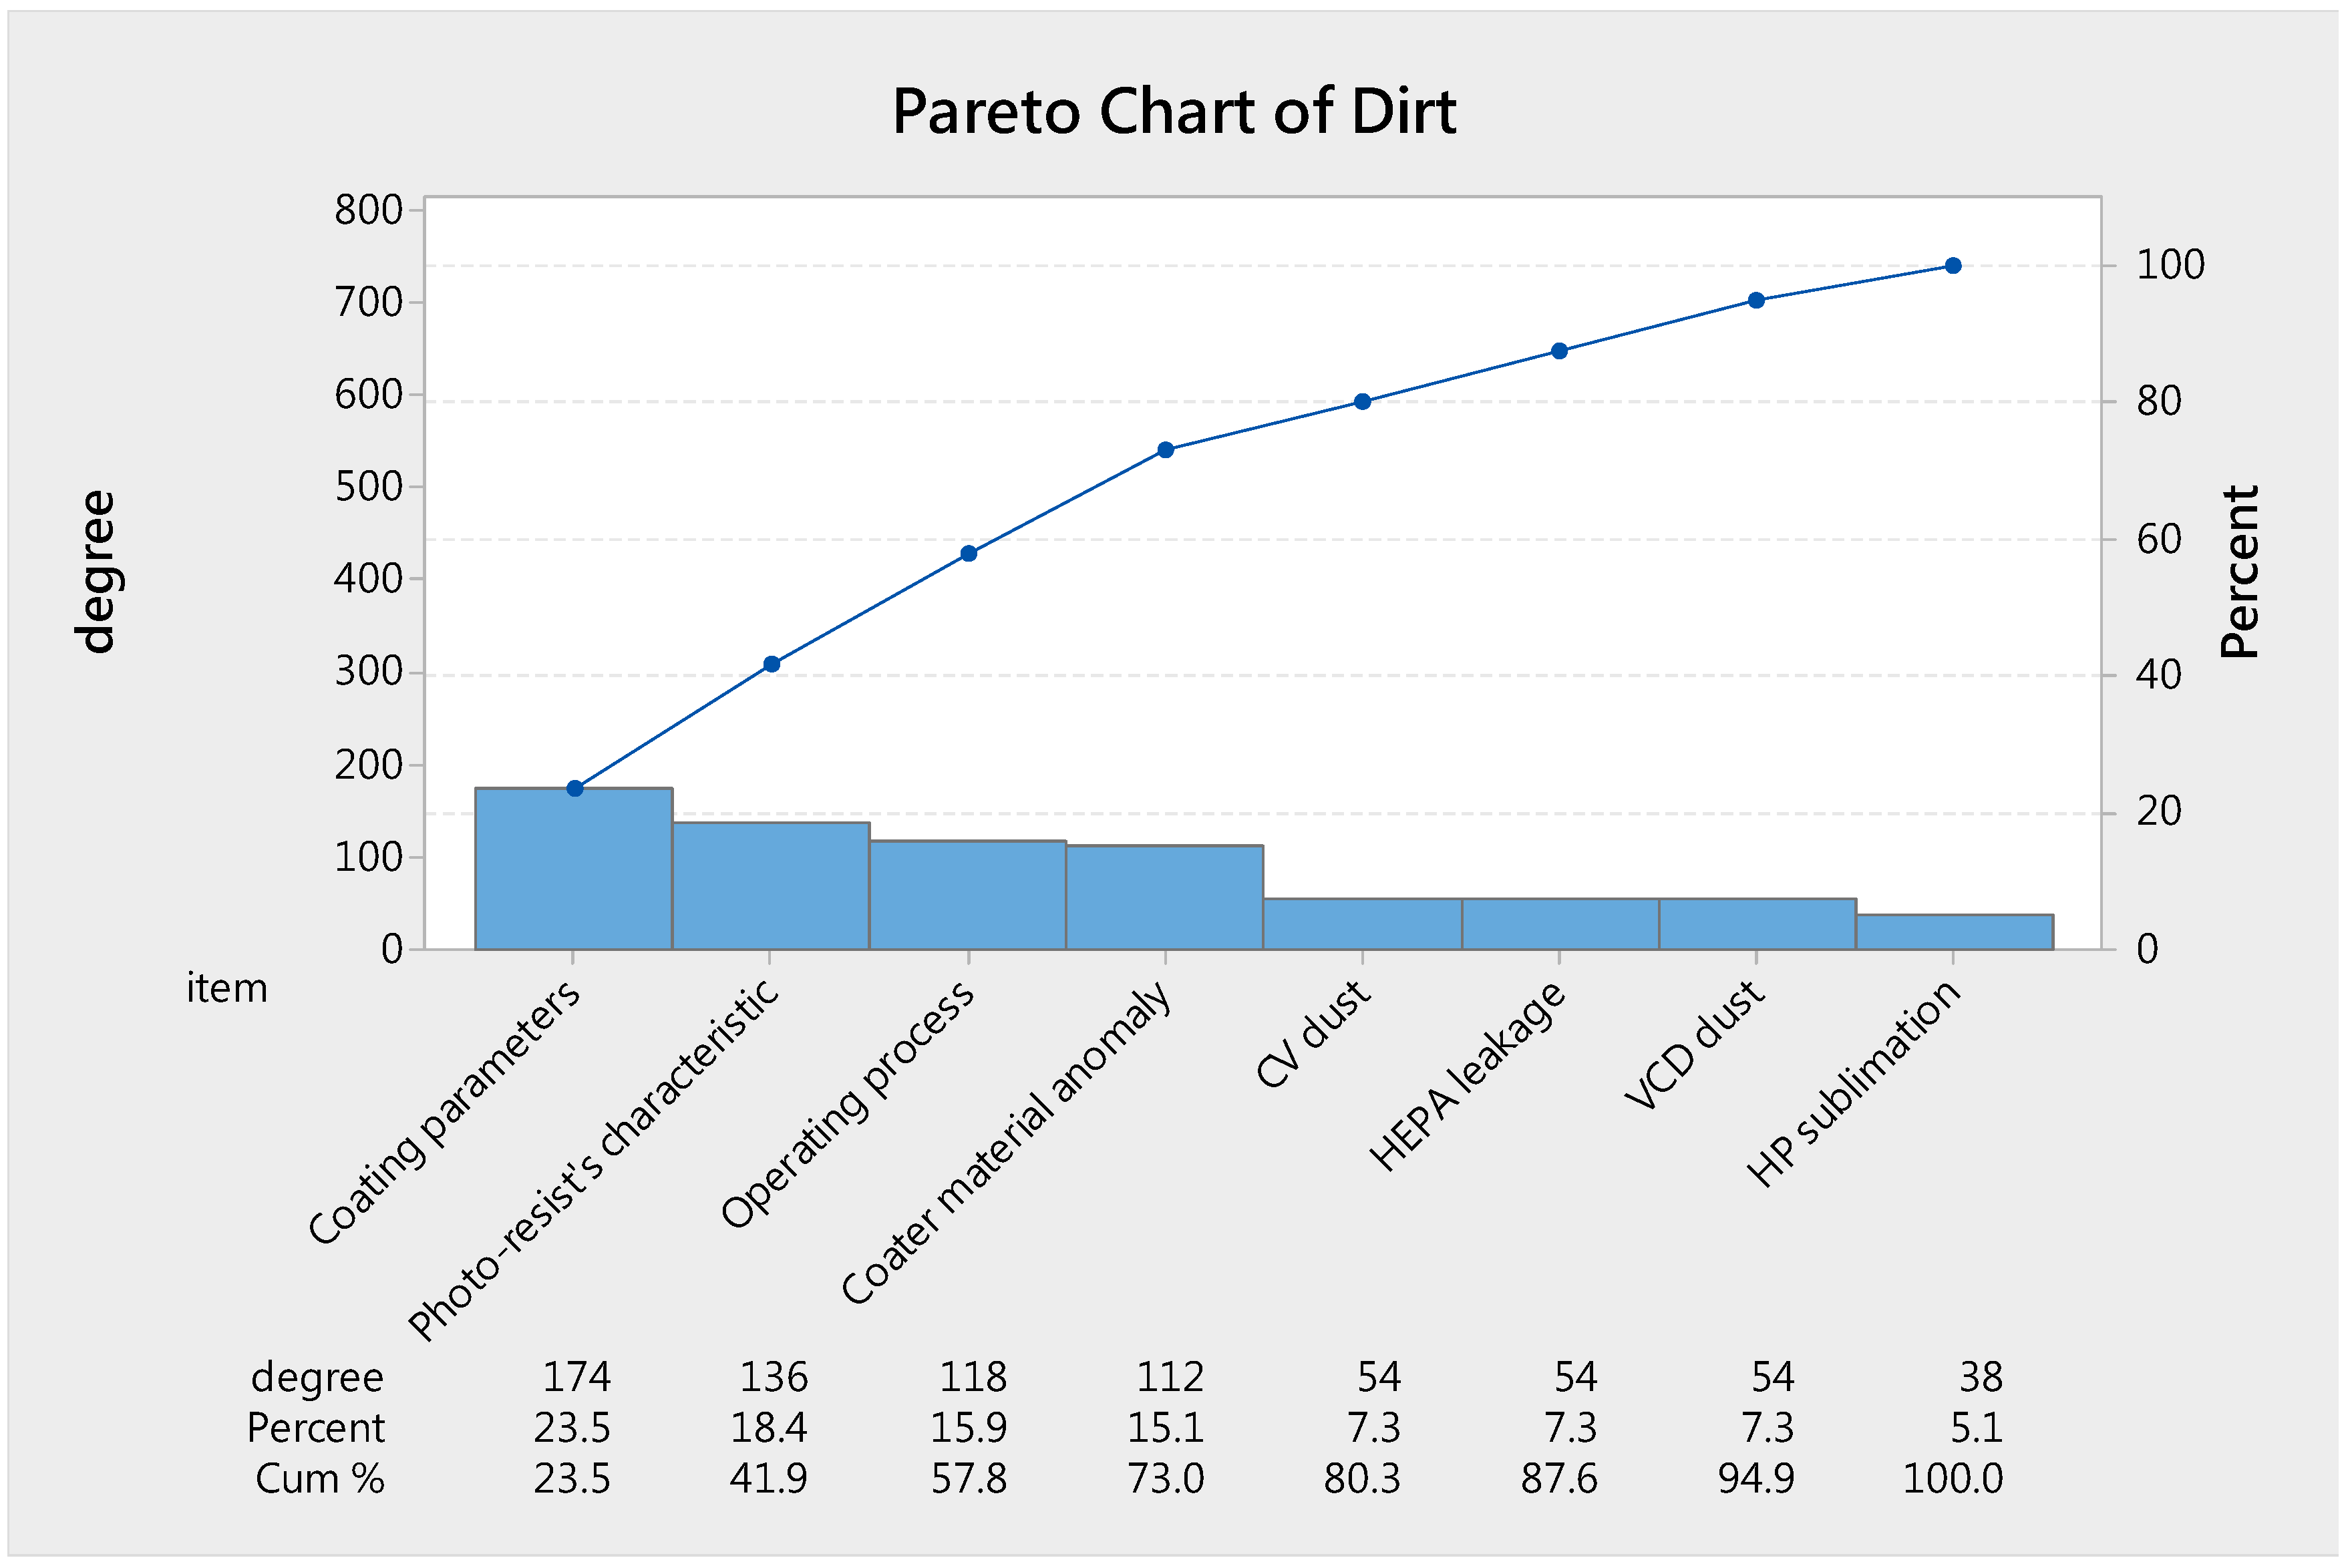
- Confirm the rate of defect with Pareto as the basis for the improve assessment.
- Accounting unit evaluates the financial performance of the project through cost profit analysis.
- Confirm internal and external customer needs to set the project’s goals through benchmark analysis.
3.2. M (Measure) Phase
- Combine the value engineering to confirm the current operation process, distinguish it into valuable, worthless, incidental actions, and reduce the eight wastes in the process to reconfirm the process flow diagram.
- Analyze and produce the Quality Function Deployment (QFD) in combination with product production requirements.
- The case has been electronically in the original production system, followed by the combination of lean manufacturing application-related tools, including kanban, to speed up production communication.
- 5S is a way to create and maintain an organized, clean, and secure high-performance work environment that continues to promote the organization of on-site workers to carry out 5S training and lets personnel develop good work habits.
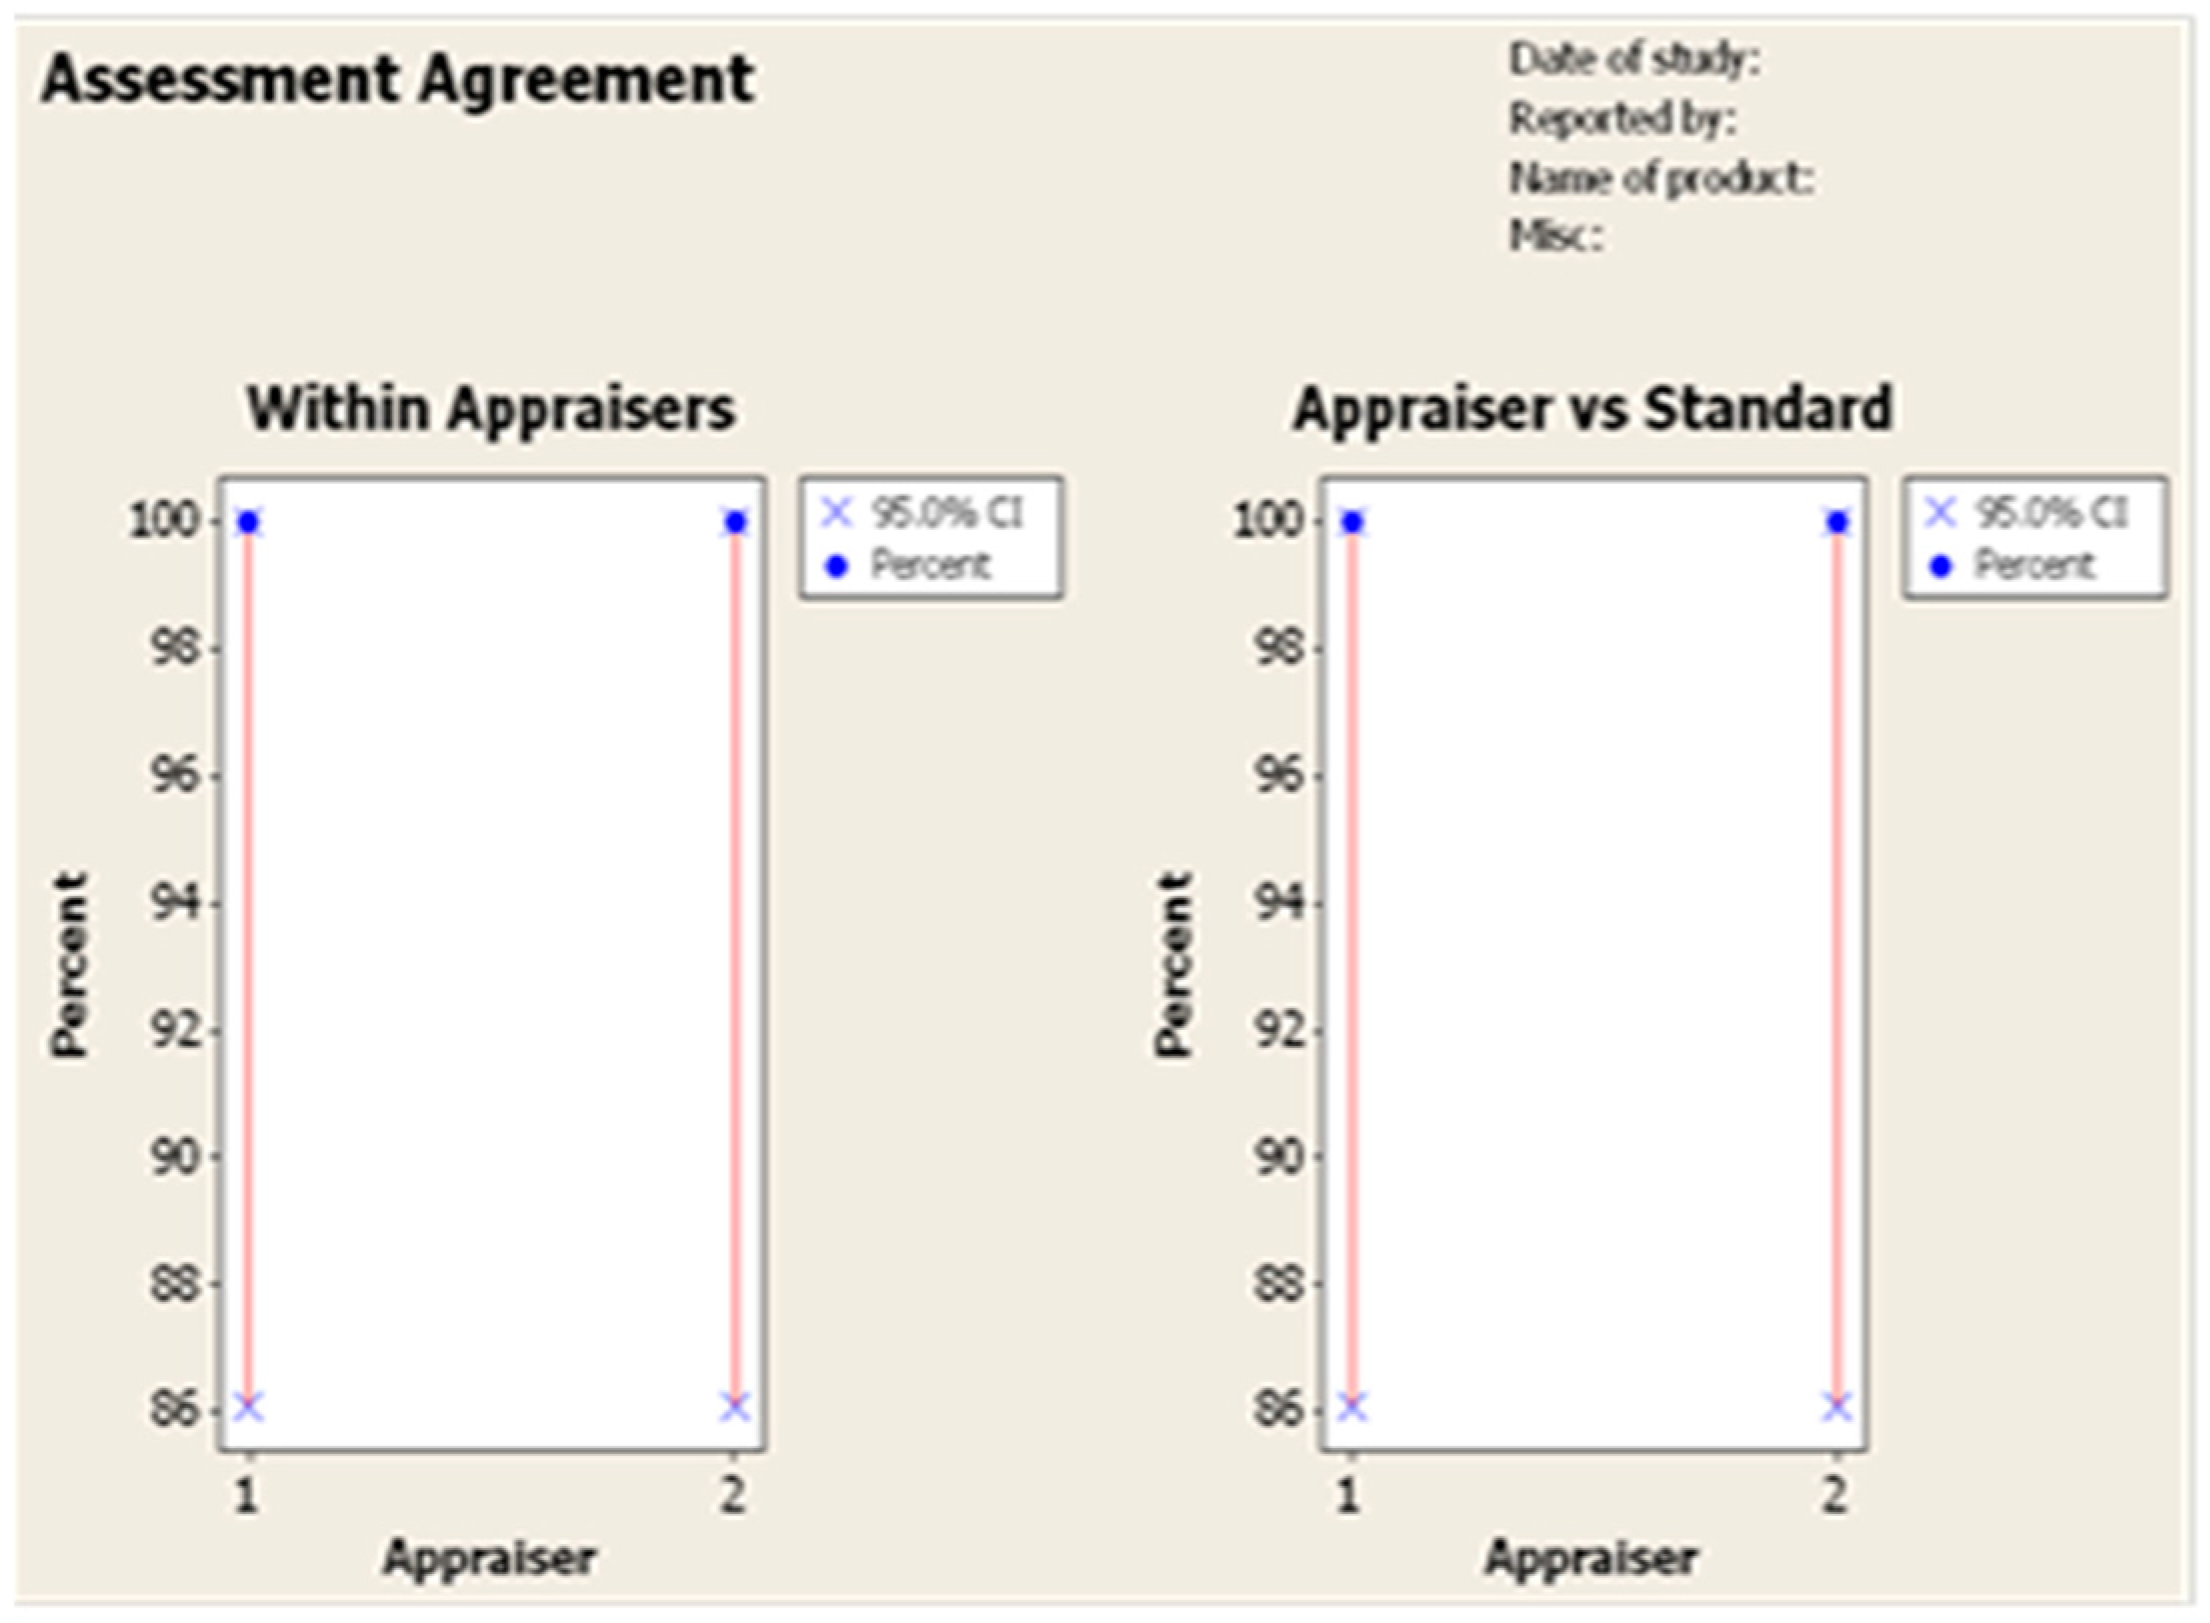
- Through the above-mentioned process monitoring indicators, the difference of the measurement system is analyzed if the measurement error exceeds 10%, and the improvement should be evaluated. If it exceeds 30%, the update measurement method needs to be evaluated.
3.3. A (Analysis) Phase
- The key to successful use of DOE in Lean Sigma is to have good planning and to keep the application practically based. First, through the observation of the process, we first confirm the cause of the experiment.
- DOE is not just a single tool, and in fact, it is best not to conduct a single experiment to understand a process. The best approach is to use what is known as sequential experimentation. Simple experiments are conducted first, and once completed the information they generate is used to plan the next experiment.
- The case is expected to perform the DOE-screening design and DOE-optimized design.
- After the experimental data is obtained, with the application of the graphic analysis method and the statistical software, the results of the experiment are analyzed for the production planning.
3.4. I (Improve) Phase
- After a large number of statistical tools are used for analysis and the effects of each analysis factor are evaluated, the production conditions for the change required for mass production are confirmed.
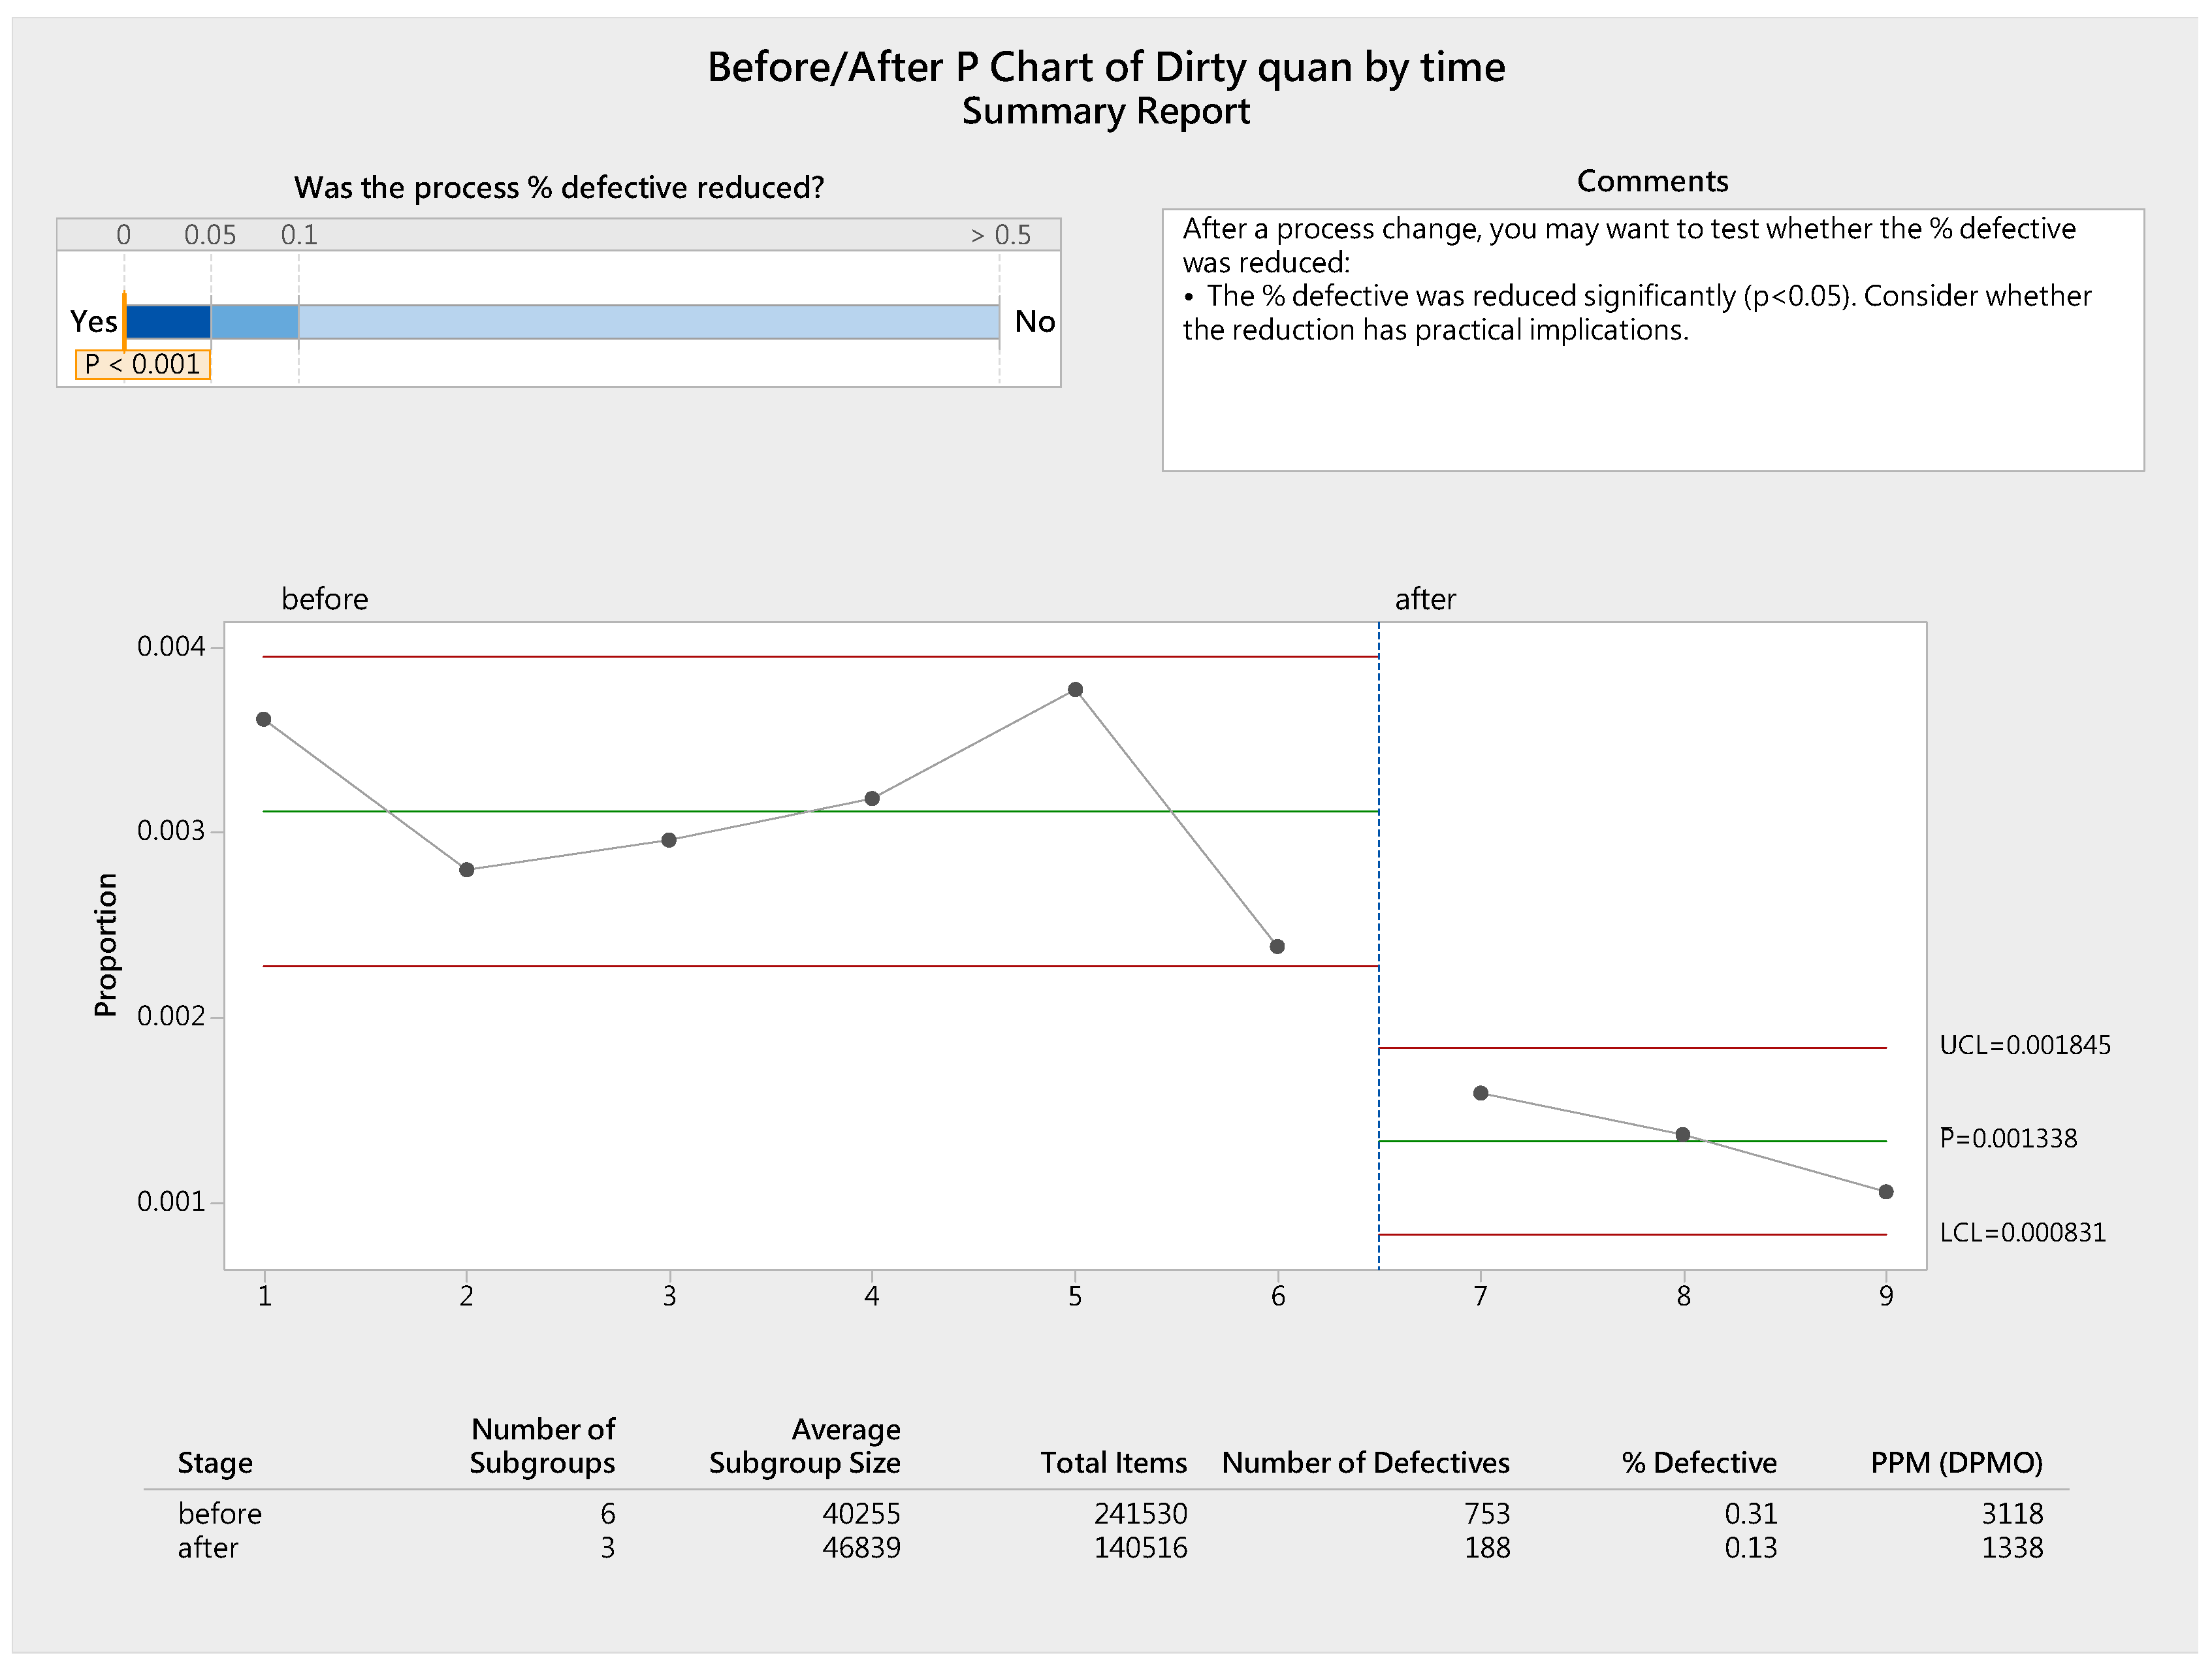
- Strict continuous monitoring is required after the change is implemented. At this time, the control chart is a very good tool.
3.5. C (Control) Phase
- Through the analysis of each stage, more information can be acquired regarding the failure analysis. This is not only valuable knowledge for the project team, but for the company as well. This is because it is recommended to include this information in the Technical Data - Failure Mode and Effects Analysis (FMEA).
- In addition to controlling the output indicators through Control Chart, the assessment incorporates the important input indicators learned during the analysis and improvement phases into the control chart. Reduce the production of fail products to reduce the cost of failure.
- Poka Yoke hopes to completely avoid failures. But if it can’t be achieved; the generalized Poka Yoke can also accept the possibility of reducing the failure. This is also helpful for manufacturing.
- Examine current manufacturing, incorporate the knowledge gained from the project, and revise the control plan.
- Based on the regulatory plan, it is rolled out to all standardized documents, including the Standard Inspection Program (SIP), Standard Operating Procedures (SOP), and Checklists for regular inspections.
4. Case Study
4.1. Define Phase
4.2. Measure Phase
4.3. Analysis Phase
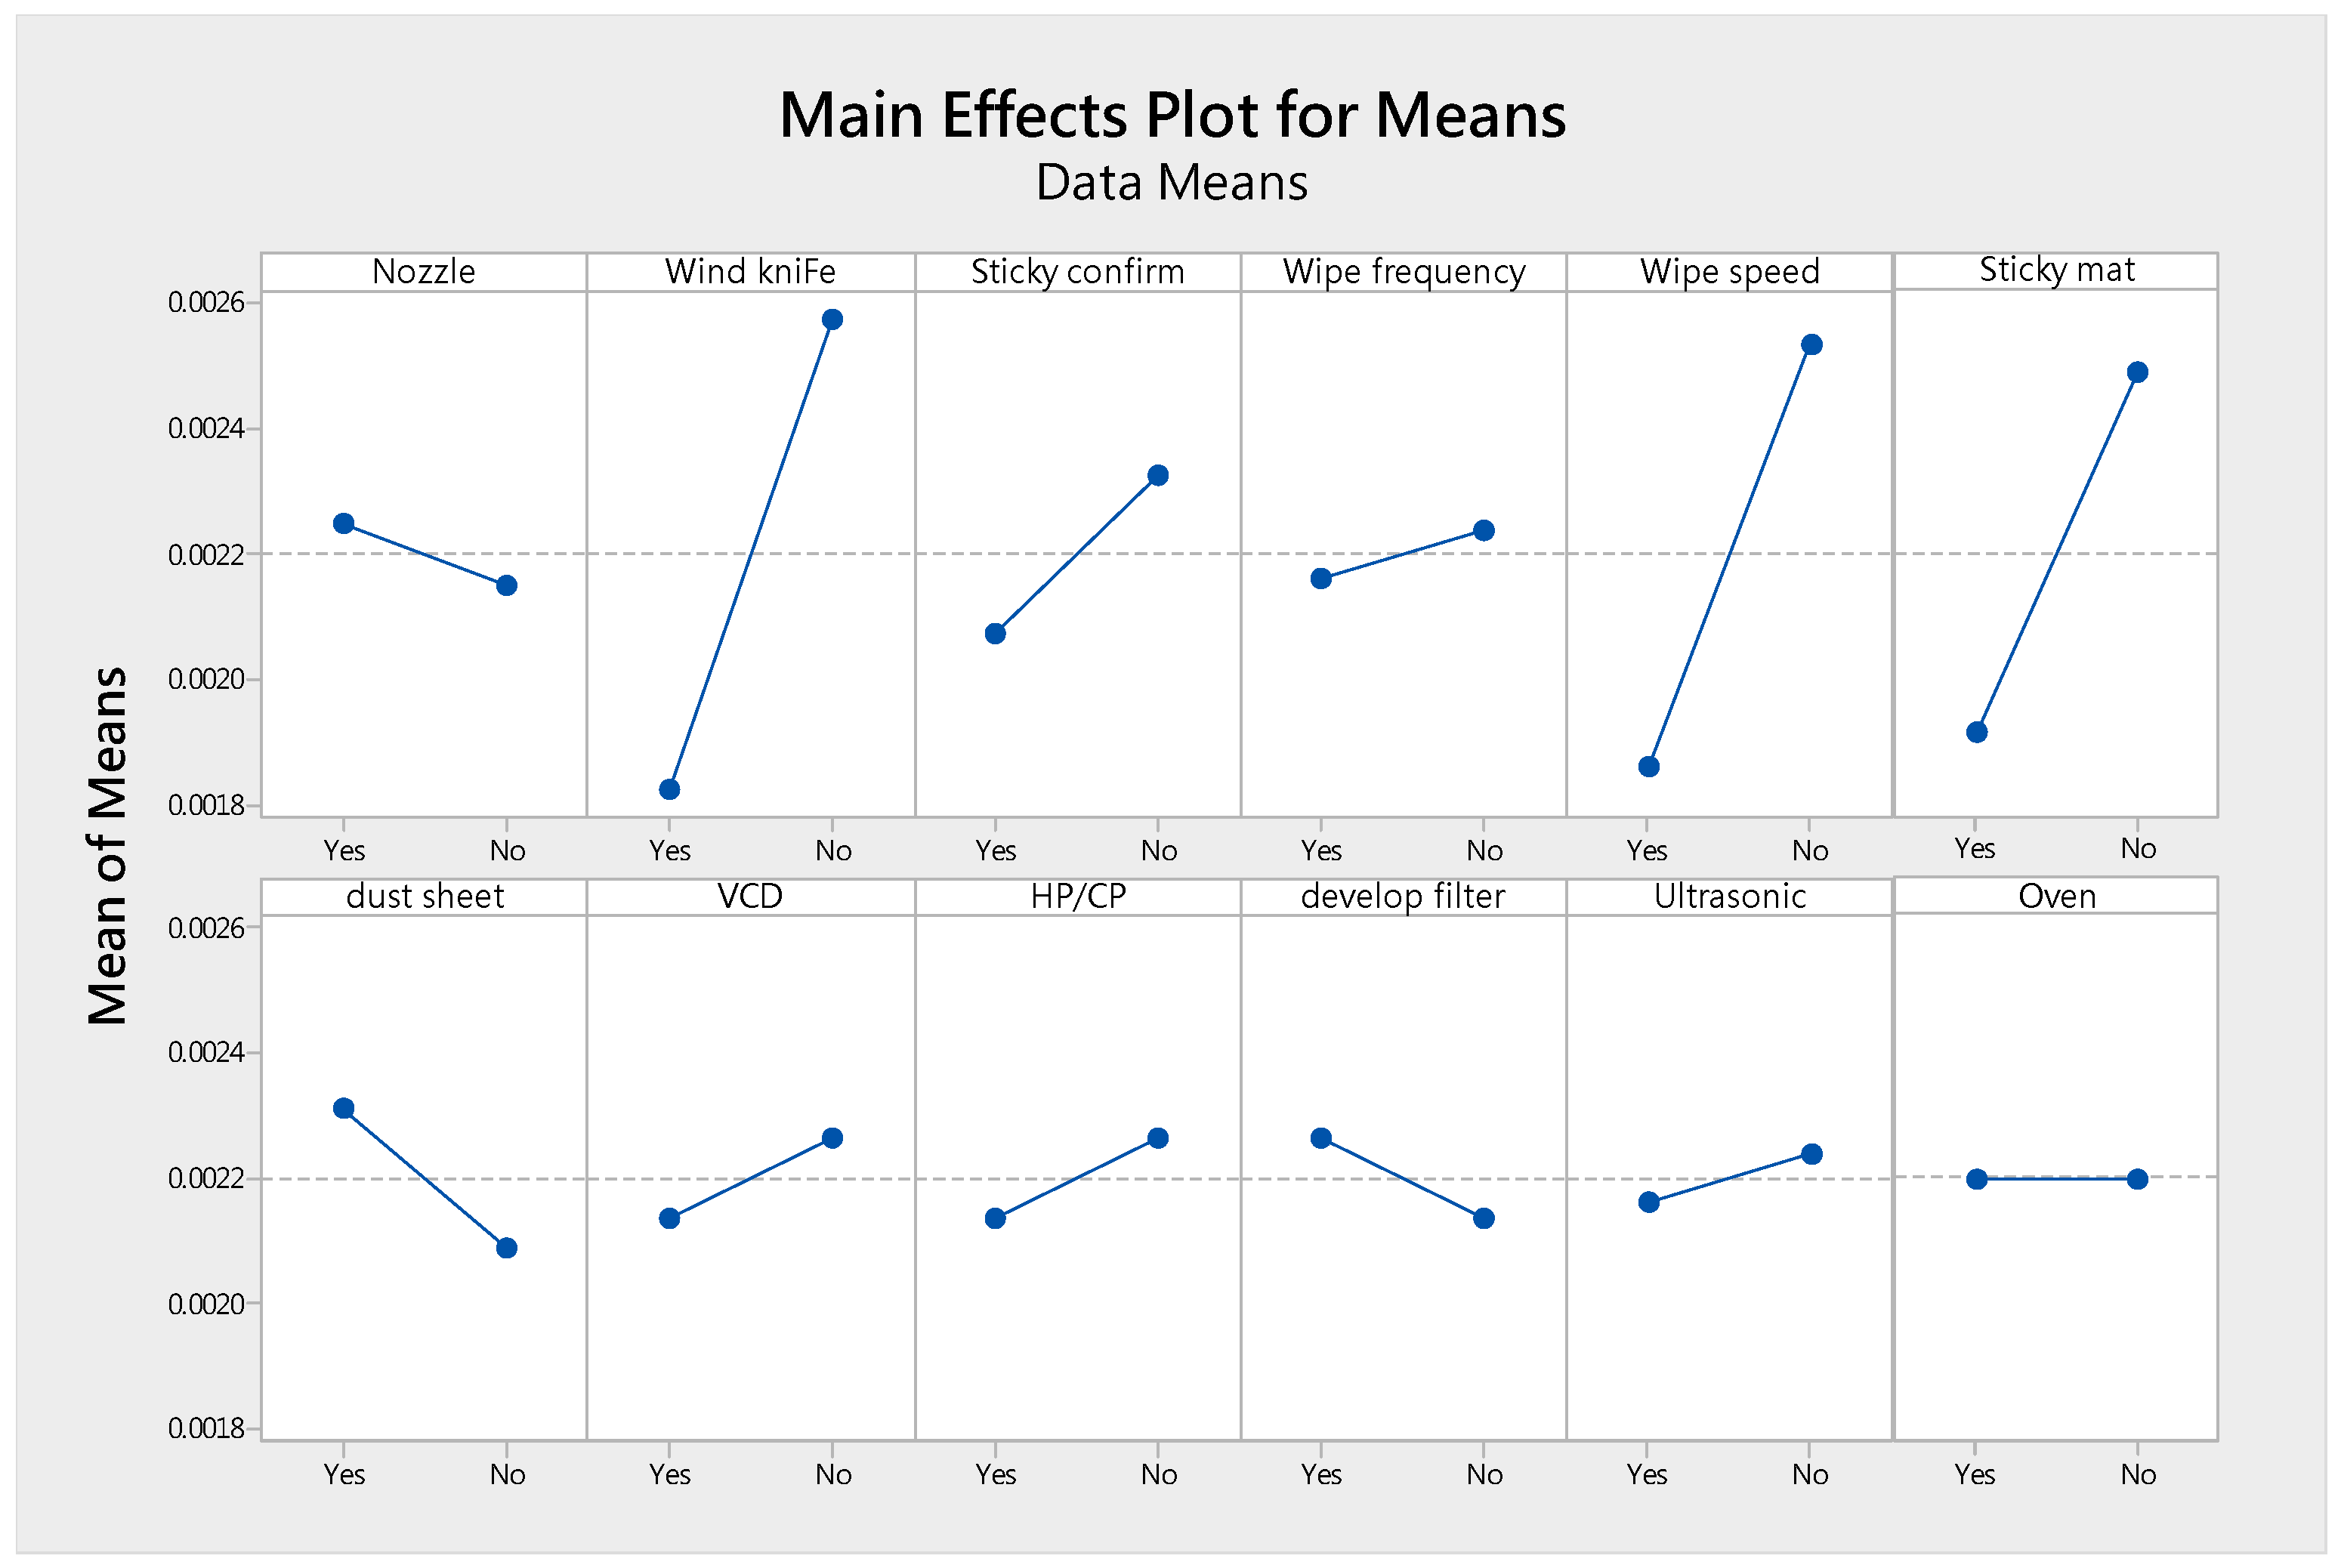
- Nozzle: For use of the precleaner equipment, spray water with nozzle and wash glass substrate with brush. Experimental conditions—whether to open the nozzle swing to increase the sprinkler area. If the experiment level is “Yes”, the nozzle will turn on the swing to increase the area of the sprinkler. If the level is “No”, nozzle will turn on the swing.
- Wind knife: The main function of the wind knife is to use high-pressure air to remove residual water on the glass after cleaning the glass. The test condition is to change the wind knife to a 45–60 degree angle relative to the direction of the glass. If the experimental level is “Yes”, the wind knife should be set at an angle of 45–60 degrees from the direction of travel of the glass. If the level is “No”, the setting of the wind knife is perpendicular to the direction in which the glass travels.
- Sticky confirms: When a die-coater is used for photo resistor coating, the scraper may have the problem of staining the photo resistor. The test condition is to verify the coating results every shift change (confirm with variation in film’s thickness or color). If the experimental level is “Yes”, the operator will test the coater when each class the shift is changed. Monitor product film thickness or chromaticity changes in coating. If the variation is too large, it is necessary to reclean and confirm the production conditions. If the level is “NO”, the change in film thickness or chromaticity is maintained every time the production conditions are changed.
- Wipe frequency: Continue with the above question. The test condition is to clean the dirt on the scraper in the coating every 30 min by the operator. If the experimental level is “Yes”, the operator will clean the coater’s scraper every 30 min. Avoid curing the photo resistor on the scraper. If the level is “No”, the operator will not increase this cleaning action.
- Wipe speed: Continue with the above question. The test condition requires the operator to clean the scraper, and the cleaning speed must slow down and remove the photo resistor on the scraper. If the experimental level is “Y”, the operator must use the special organic solvent for each cleaning and the cleaning should not be too fast; the cleaning time should be more than 30 s. The residual photo resistor on the blade is completely removed. If the level is “No”, the operator only needs to clean with 95% alcohol. And the wiping time needs to be within 30 s.
- Sticky mat: The test condition is that the substrate is a wet film, and the sticky mat is installed on the floor of the working site near the working area, e.g., coating machine. If the experimental level is “Yes”, the sticky mat is placed on the floor to prevent particle floating generation when the person is moving. If the level is “No”, the floor maintains a perforated floor.
- Dust sleeve: In order to prevent the equipment from dusting, the test condition is to set up the dust sleeve or adhesive paper on the machine to reduce the problem of dirt in the equipment (e.g., dusting on the arm of robot). If the experimental level is “Yes”, put a dust sleeve or sticky paper that is easy to dust on the equipment. If the level is “No”, it does not need to put on a dust sleeve and sticky paper.
- VCD (vacuum dry): Test conditions for each exchange product change, the site required to clean the VCD equipment, and the High Efficiency Particulate Air (HEPA) on the ceiling of the area, because there is ~70% or greater by proportion of chemical solvents in the photo resistor. Therefore, the photo resistor needs to be extracted and dissociated by a chemical solvent after coating. The goal is to improve the stability of the process. This part is handled by the VCD. If the experimental level is “Yes”, the VCD will be cleaned each time the production conditions are changed, and the HEPA above the VCD will be cleaned. If the level is “No”, no cleaning is required when changing the production conditions. It only needs to be cleaned and maintained according to the original equipment maintenance frequency.
- HP/CP: Test conditions for each exchange product line change, the site required to clean HP/CP equipment and the High Efficiency Particulate Air (HEPA) on the ceiling of the area. The photo resistor is coating on the glass, and the photo resistor exhibits a liquid state. It is easy to shift due to the movement of the glass. Therefore, it is necessary to cure through HP/CP. HP mainly heats the coated glass at a high temperature to fix the photo resistor. The temperature of the glass is cooled down through the CP to return to normal temperature. If the experimental level is “Yes”, the HP/CP is cleaned each time the production conditions are changed. And clean the HEPA above the HP/CP. If the level is “No”, there is no need to clean and maintain when changing production conditions. Just keep the general cleaning cycle.
- Develop filter: In the wet development, the test condition is to add a secondary filter core to the pure water filter center. After the photo resistor is exposed, a chemical change is produced by the Developer. The developer during Development is recycled. Originally filtered through a filter before use. If the experimental level is “Yes”, a filter with a smaller aperture will be added. The impurities in the developer are filtered. If the level is “No”, keep a filter.
- Ultrasonic: Test conditions for glass cleaning, open ultrasonic cleaning in the cleaner. In the current wet equipment, both the precleaner and developing machine are cleaned with pure water. And the Ultrasonic cleaning function can be turned on during cleaning. It can clean particles on the glass. If the experiment level is “Yes”, the Ultrasonic cleaning function is turned on. If the level is “No”, this feature is not used.
- Oven: Test conditions for each exchange product line change, as well as the site required to clean oven equipment and the High Efficiency Particulate Air (HEPA) on the ceiling of the area. The front HP/CP device only slightly fixes the photo resistor quickly at high temperatures. Oven equipment will be baked at high temperatures. Oven will be baked at high temperatures for a long-time baking. Therefore, it is easy to have many problems of aging, rust and dust. The experimental level is “Yes” and will require cleaning of Oven each time the production conditions change. However, if the level is “No”, the cleaning frequency of the Oven device maintains the original cleaning frequency (monthly).
4.4. Improve Phase
- Changing the angle of the wind knife to 45 degrees angle with the flow direction of the glass substrate.
- The change of color or film thickness is controlled, and the change of unit distance is abnormal according to the product requirement.
- The control wiping speed must not be too fast and the photo resistor residue attached to the scraper should be completely removed.
- Set sticky mat on the floor of scraper coating equipment.
4.5. Control Phase
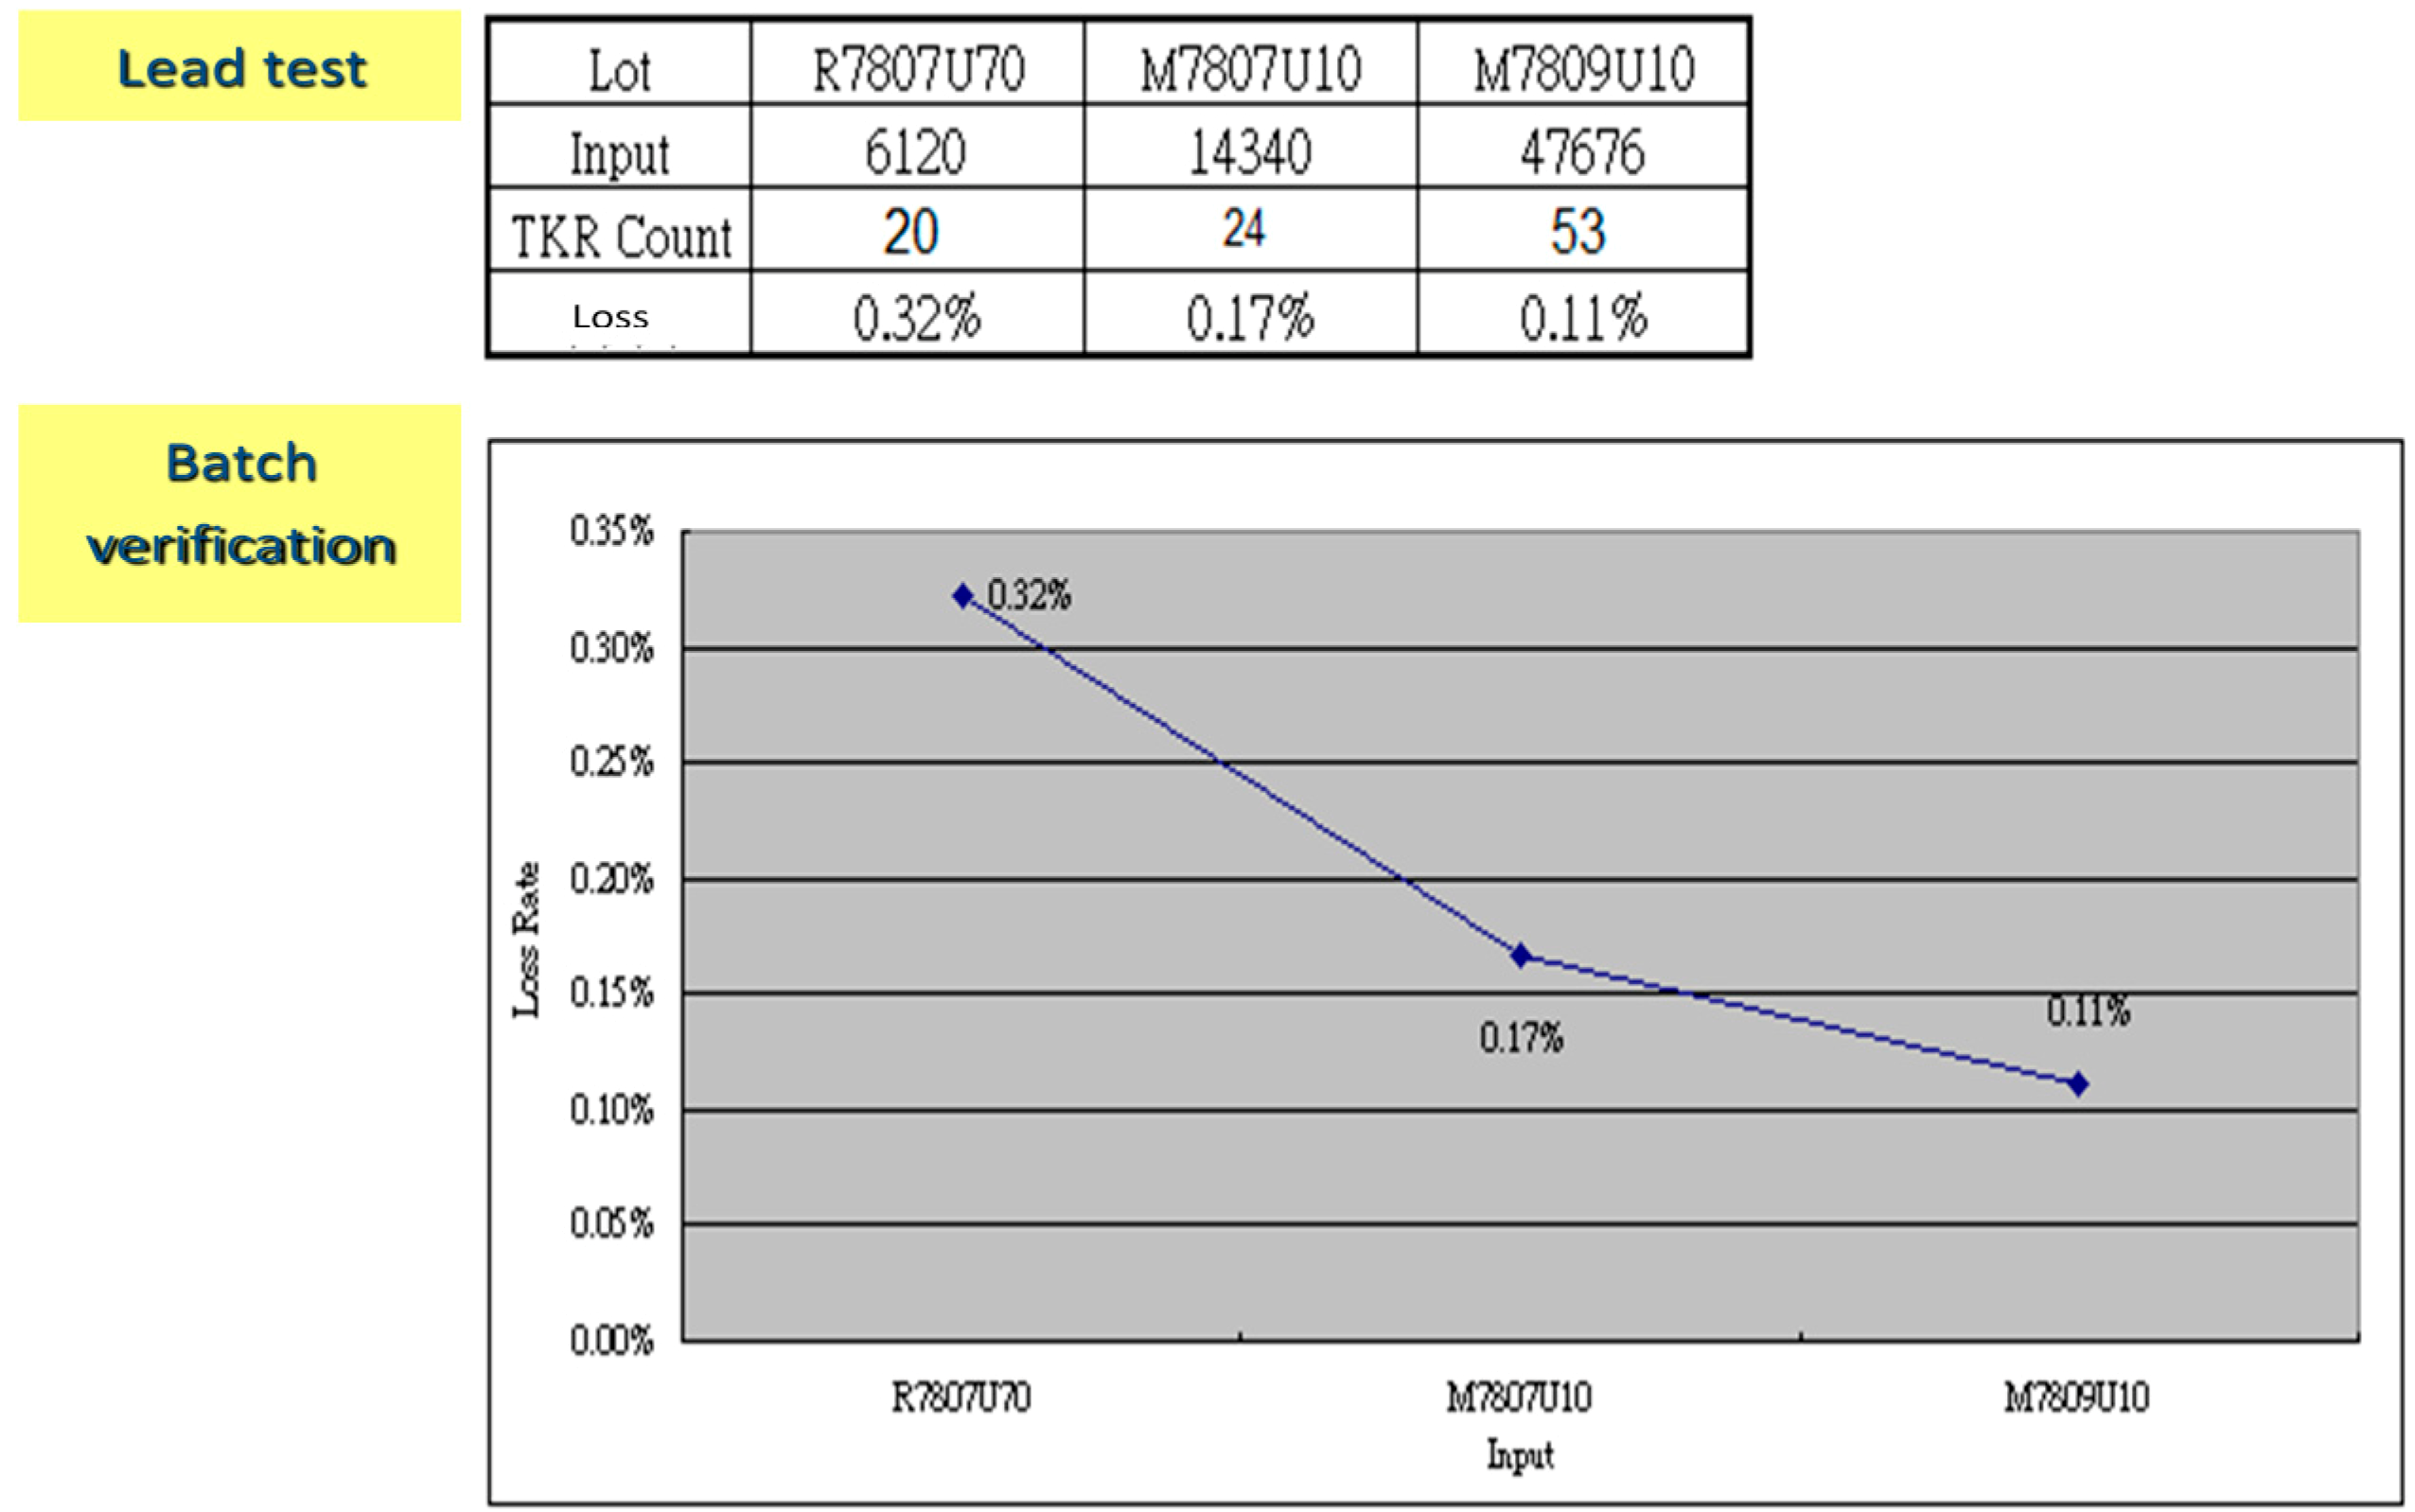
- Improvement of photo resistor solubility: it is suggested that photo resistor materials are verified by introducing lip test with supplier.
- Wind knife setting of the cleaning line: the angle of the wind knife and the direction of the glass travel are clamped at 45 degrees angle.
- Wipe speed of the scraper and formulates in the SOP.
- Control chromaticity or thickness of film: it is recommended that be included in the control plan.
- Sticky mat: set sticky mat on the floor of the die-coater.
5. Conclusions
Author Contributions
Funding
Conflicts of Interest
References
- Mills, C.; Carnell, M.; Wheat, B. Leaning into Six Sigma: The Path to Integration of Lean Enterprise and Six Sigma; McGraw-Hill Education: New York, NY, USA, 2001. [Google Scholar]
- Womack, J.; Jones, D. Lean Thinking: Banish Waste and Create Wealth in Your Corporation; Simon & Schuster: New York, NY, USA, 2003. [Google Scholar]
- George, M. The Lean Six Sigma Pocket Tool Book: A Quick Reference Guide to 100 Tools for Improving Quality and Speed; McGraw-Hill Education: New York, NY, USA, 2004. [Google Scholar]
- Wheat, B.; Mills, C.; Carnell, M. Learning into Six Sigma: A Parable of the Journey to Six Sigma and a Lean Enterprise; McGraw-Hill Education: New York, NY, USA, 2001. [Google Scholar]
- Krafcik, J.F. Triumph of the lean production system. Sloan Manag. Rev. 1988, 30, 41–52. [Google Scholar]
- Kwak, Y.H.; Anbari, F.T. Benefits, obstacles, and future of six sigma approach. Technovation 2006, 26, 708–715. [Google Scholar] [CrossRef]
- Holweg, M. The genealogy of lean production. J. Oper. Manag. 2007, 25, 420–437. [Google Scholar] [CrossRef]
- De Feo, J.A.; Barnard, W. JURAN Institute’s Six Sigma Breakthrough and Beyond—Quality Performance Breakthrough Methods; McGraw-Hill Education: New York, NY, USA, 2004. [Google Scholar]
- Womack, J.; Roos, D.; Jones, D.T. Lean Thinking—Banish Waste and Create Wealth in Your Corporation; Simon & Schuster: New York, NY, USA, 1996. [Google Scholar]
- Furterer, S. Lean Six Sigma in Service: Applications and Case Studies; CRC Press Taylor & Francis Group: Boca Raton, FL, USA, 2009. [Google Scholar]
- Wedgwood, I. Lean Sigma—A Practitioner’s Guide; Prentice Hall: Upper Saddle River, NJ, USA, 2006. [Google Scholar]
- Chen, K.S.; Wang, C.H.; Chen, H.T. A MAIC approach to TFT-LCD panel quality improvement. Microelectron. Reliab. 2006, 46, 1189–1198. [Google Scholar] [CrossRef]
- Chen, M.N.; Lyu, J.J. A Lean Six-Sigma approach to touch panel quality improvement. Prod. Plan. Control 2009, 20, 445–454. [Google Scholar] [CrossRef]
- Caligiana, G.; Liverani, A.; Francia, D.; Frizziero, L.; Donnici, G. Integrating QFD and TRIZ for innovative design. J. Adv. Mech. Des. 2017, 11, 1–15. [Google Scholar] [CrossRef]
- Francia, D.; Caligiana, G.; Liverani, A.; Frizziero, L.; Donnici, G. PrinterCAD: A QFD and TRIZ integrated design solution for large size open moulding manufacturing. Int. J. Interact. Des. Manuf. 2018, 12, 81–94. [Google Scholar] [CrossRef]
- Frizziero, L.; Francia, D.; Donnici, G.; Liverani, A.; Caligiana, G. Sustainable design of open molds with QFD and TRIZ combination. J. Ind. Prod. Eng. 2018, 35, 21–31. [Google Scholar] [CrossRef]
- Takatsuji, H.; Arai, T. Pinholes in Al thin films: Their effects on TFT characteristics and a taguchi method analysis of their origins. Vacuum 2000, 59, 606–613. [Google Scholar] [CrossRef]
- Chiang, Y.M.; Hsieh, H.H. The use of the Taguchi method with grey relational analysis to optimize the thin-film sputtering process with multiple quality characteristic in color filter manufacturing. Comput. Ind. Eng. 2009, 56, 648–661. [Google Scholar] [CrossRef]
- Kornfeld, B.J.; Kara, S. Project portfolio selection in continuous improvement. Int. J. Oper. Prod. Manag. 2011, 31, 1071–1088. [Google Scholar] [CrossRef]
- Cima, R.R.; Brown, M.J.; Hebl, J.R.; Moore, R.; Rogers, J.C.; Kollengode, A.; Amstutz, G.J.; Weisbrod, C.A.; Narr, B.J.; Deschamps, C.; et al. Use of lean and six sigma methodology to improve operating room efficiency in a high-volume tertiary-care academic medical center. J. Am. Coll. Surg. 2011, 213, 83–92. [Google Scholar] [CrossRef] [PubMed]
- Dahlgaard, J.J. Lean production, six sigma quality, TQM and company culture. TQM Mag. 2006, 18, 263–281. [Google Scholar] [CrossRef]
- Realyvásquez-Vargas, A.; Arredondo-Soto, K.C.; Carrillo-Gutiérrez, T.; Ravelo, G. Applying the Plan-Do-Check-Act (PDCA) Cycle to Reduce the Defects in the Manufacturing Industry. A Case Study. Appl. Sci. 2018, 8, 2181. [Google Scholar] [CrossRef]
- Zheng, Y.; Gao, P.; Xiao, Z.; Zhou, J.; Duan, J.; Chen, B. Improving the Lot Fabrication Stability and Performance of Silica Optical Films during PECVD. Appl. Sci. 2019, 9, 785. [Google Scholar] [CrossRef]


| Steps | Description | Indicators (Outputs) | Tools |
|---|---|---|---|
| 1. Problem statement 2. Current situation 3. Process map-As-is SIPOC 4. Set up a project team | We divide our customers and classify this one’s using data as the market share or the loyalty index, knowing which ones are the most important for us. After knowing our main customers, we understood what their expectations. | 1. Project evaluation plan 2. Project team members’ powers and responsibilities allocation table 3. Process definition flow chart and key process indicators | 1. SIPOC 2. Pareto Diagram 3. Fishbone diagram 4. Cost Profit Analysis 5. Benchmark analysis |
| Steps | Description | Indicators (Outputs) | Tools |
|---|---|---|---|
| 1. Clear project definition 2. Identification of input and output indicators 3. Analysis measurement system 4. Identify the process capability of the product 5. Defining project performance and objectives | Through the flow chart to identify the definition of the project and calculate the mobile output rate of the project (RTY), Lean manufacturing is applied to eliminate waste and improve the process; after the MSA is identified, the current manufacturing process capability is identified again. | 1. FTY (First Time Yield), IPY (In Process Yield), RTY (Rolled Throughput Yield) 2. MSA: %R&R, NDC 3. Cpk, Ppk, DPU | 1. Process Flow Diagram, PFD 2. Quality Function Deployment, QFD 3. Lean, Pull System 4. 5S (Sorting, Storage, Shining, Standardize, Sustaining) 5. Analysis of basic statistical ability and process capability |
| Steps | Description | Indicators (Outputs) | Tools |
|---|---|---|---|
| 1. Identify the source of variation 2. Screening test design 3. Perform analysis after performing screening test 4. Confirm test results and process variation 5. Reconfirm the production conditions of the product | The information collected during the Measure phase will be confirmed by the expenimental design method for the variation reasons that may affect the project results. After confirming the conditions affecting the variation, re-analyze to confirm the mass production test of the subsequent improvement phase of the improved production conditions. | Decide on the x factor that affects the Y-value. | 1. Graphic analysis methods: including scatter diagrams, matrix plots… 2. Statical method: including regression analysis, DOE - Screening… |
| Steps | Description | Indicators (Outputs) | Tools |
|---|---|---|---|
| 1. Plan for improved production conditions and test production in mass production 2. Collect relevant information about the production procee 3. Confirm whether the production process is derived from other process issues 4. Improt formal mass production | The improvement conditions obtained during the improve phase may be introduced into mass production, which may cause derivative problems. Therefore, it is necessary to arrange mass production trial, and then import the mass production conditions after confirmation. If there are any problems, you can also adjust before improving, which will increase the stability of the process. | 1. Process Change Request (PCR) 2. Closing Report | 1. Statistical tools: ANOVA analysis, Effect Plot 2. SPC: Control chart |
| Steps | Description | Indicators (Outputs) | Tools |
|---|---|---|---|
| 1. Continuous observation of the changed production system 2. Collect production data 3. Confirm whether performance has achieved target 4. Modify relevant SOP and transfer technical information 5. End the project and return the members to the original unit | The control phase primarily seeks to confirm improved performance through long-term monitoring. If the performance is confirmed to achieve the goal. The project team should recorganize the project technical data to produce a closed report for the project transfer. After the handover is completed, members of the project team can return to the organization’s original preparation to end the project task. | Closing report: 1. Assess improved performance 2. Related technical information 3. Future improvement suggestions | 1. FMEA 2. Control Chart 3. Poka-Yoke 4. Control Plan 5. SIP/SOP 6. Check list |
| Importance Degree | 1 | 3 | 8 | 9 | 9 | ||
|---|---|---|---|---|---|---|---|
| KPOVs | Poor Production Environment | Poor Cleanliness | Fluid Instability | Nozzle Sticked | Photo Resist Stripping | Total | |
| KPIVs | |||||||
| Coating parameters | 1 | 1 | 1 | 9 | 9 | 174 | |
| Photo resist characteristic | 1 | 1 | 3 | 3 | 9 | 136 | |
| Operating process | 1 | 1 | 3 | 9 | 1 | 118 | |
| Coater material anomaly | 1 | 1 | 9 | 3 | 1 | 112 | |
| The arm of Robot dust | 1 | 9 | 1 | 1 | 1 | 54 | |
| CV dust | 1 | 9 | 1 | 1 | 1 | 54 | |
| VCD dust | 1 | 9 | 1 | 1 | 1 | 54 | |
| HEPA leakage | 9 | 1 | 1 | 1 | 1 | 38 | |
| HP sublimation | 1 | 1 | 1 | 1 | 1 | 30 | |
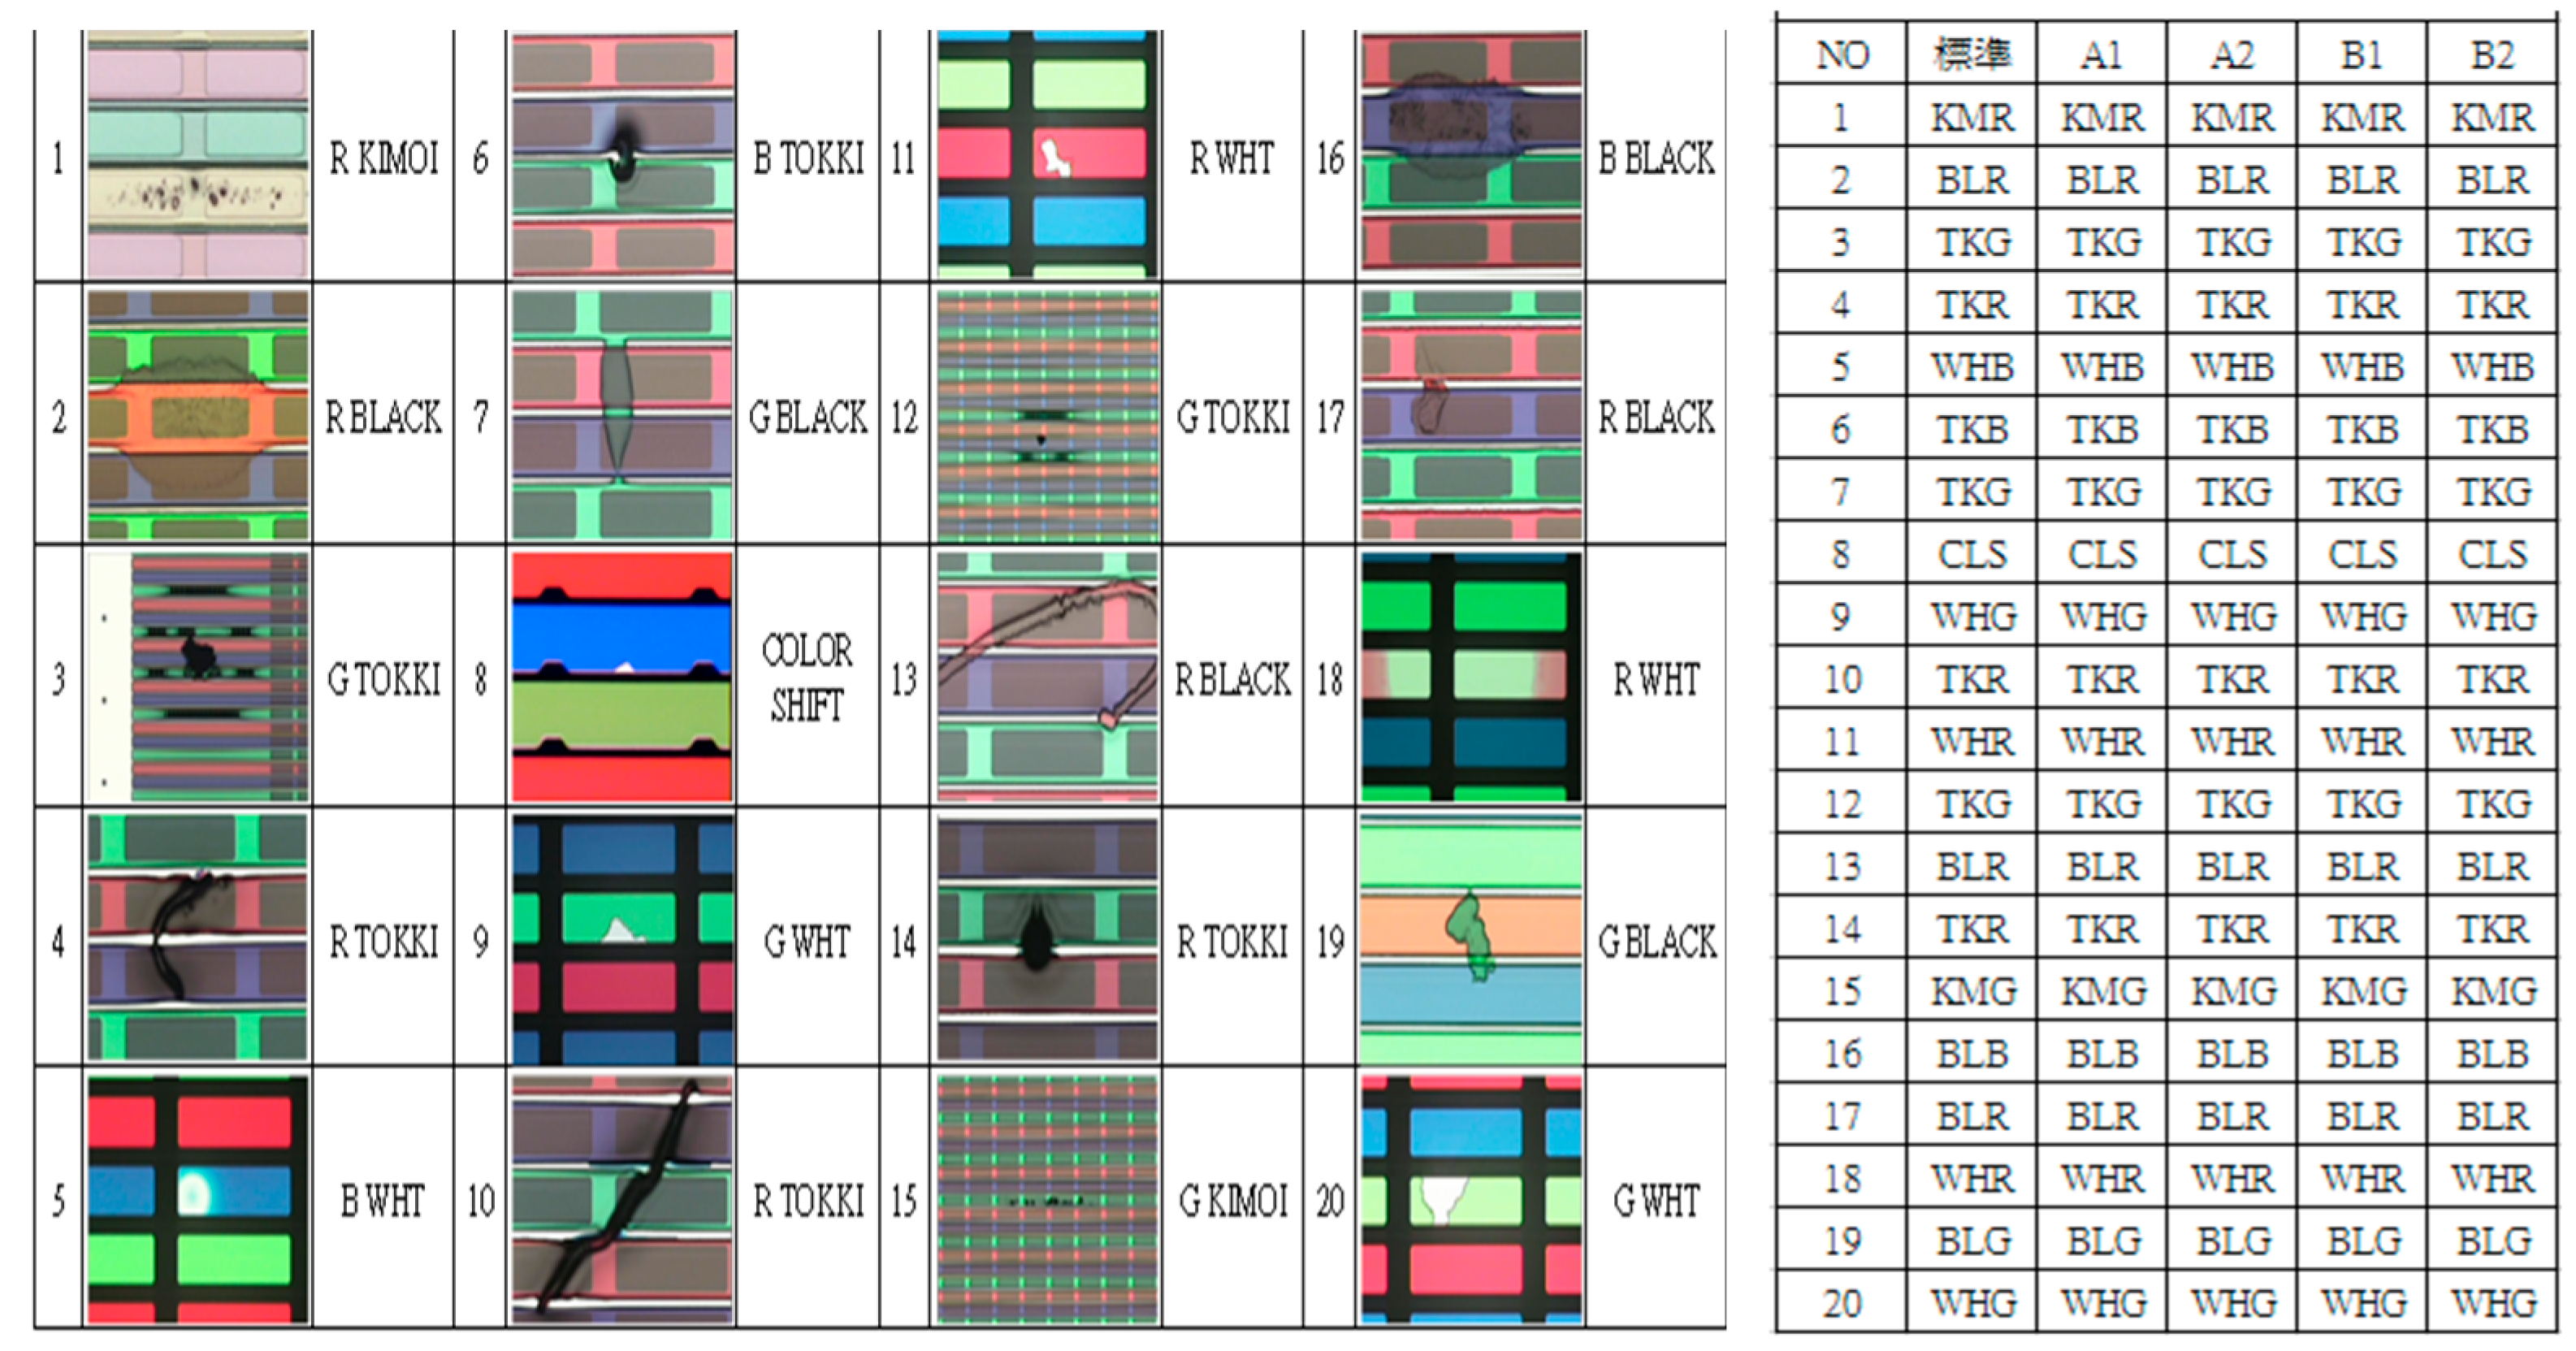
| Product Separation | 15′ CF |
|---|---|
| Test item | The personnel judge whether the defect is correct or not. |
| Is It correct to measure the height and size of the dirty. | |
| Inspection equipment | AOI & Laser Tape Repair. |
| Sample Size | Middle repair 20 pcs sample. |
| Analysis | Project team |
| ecord | Project team |
| Nozzle | Wind Knife | Sticky Confirms | Wipe Frequence | Wipe Speed | Sticky Mat | Dust Sheet | VCD | HP/CP | Develop Filter | Ultrasonic | Oven | Dirty Loss |
|---|---|---|---|---|---|---|---|---|---|---|---|---|
| Yes | Yes | Yes | Yes | Yes | Yes | Yes | Yes | Yes | Yes | Yes | Yes | 0.11% |
| Yes | Yes | Yes | Yes | Yes | Yes | Yes | No | No | No | No | No | 0.13% |
| Yes | Yes | Yes | No | No | No | No | Yes | Yes | Yes | Yes | No | 0.22% |
| Yes | Yes | Yes | No | No | No | No | No | No | No | No | Yes | 0.24% |
| Yes | No | No | Yes | Yes | No | No | Yes | Yes | No | No | Yes | 0.25% |
| Yes | No | No | Yes | Yes | No | No | No | No | Yes | Yes | No | 0.26% |
| Yes | No | No | No | No | Yes | Yes | Yes | Yes | No | No | No | 0.27% |
| Yes | No | No | No | No | Yes | Yes | No | No | Yes | Yes | Yes | 0.32% |
| No | Yes | No | Yes | No | Yes | No | Yes | No | Yes | No | Yes | 0.18% |
| No | Yes | No | Yes | No | Yes | No | No | Yes | No | Yes | No | 0.18% |
| No | Yes | No | No | Yes | No | Yes | Yes | No | Yes | No | No | 0.22% |
| No | Yes | No | No | Yes | No | Yes | No | Yes | No | Yes | Yes | 0.18% |
| No | No | Yes | Yes | No | No | Yes | Yes | No | No | Yes | Yes | 0.30% |
| o | No | Yes | Yes | No | No | Yes | No | Yes | Yes | No | No | 0.32% |
| No | No | Yes | No | Yes | Yes | No | Yes | No | No | Yes | No | 0.16% |
| No | No | Yes | No | Yes | Yes | No | No | Yes | Yes | No | Yes | 0.18% |
| Analysis of Variance | |||||
|---|---|---|---|---|---|
| Source | DF | Adj SS | Adj MS | F-Value | P-Value |
| Nozzle | 1 | 0.000000 | 0.000000 | 1.50 | 0.308 |
| Wind knife | 1 | 0.000002 | 0.000002 | 84.37 | 0.003 |
| Sticky confirms | 1 | 0.000000 | 0.000000 | 9.37 | 0.055 |
| Wipe frequency | 1 | 0.000000 | 0.000000 | 0.84 | 0.426 |
| Wipe speed | 1 | 0.000002 | 0.000002 | 68.34 | 0.004 |
| Sticky mat | 1 | 0.000001 | 0.000001 | 49.59 | 0.006 |
| dust sheet | 1 | 0.000000 | 0.000000 | 7.59 | 0.07 |
| VCD | 1 | 0.000000 | 0.000000 | 2.34 | 0.223 |
| HP / CP | 1 | 0.000000 | 0.000000 | 2.34 | 0.223 |
| develop filter | 1 | 0.000000 | 0.000000 | 2.34 | 0.223 |
| Ultrasonic | 1 | 0.000000 | 0.000000 | 0.84 | 0.426 |
| Oven | 1 | 0.000000 | 0.000000 | 0.00 | 1.000 |
| Error | 3 | 0.000000 | 0.000000 | ||
| Total | 15 | 0.000006 | |||
| Model Summary | |||||
| S | R-sq | R-sq(adj) | R-sq(pred) | ||
| 0.0001633 | 98.71% | 93.55% | 63.30% |
| Classify | Month | Quantity | TKR | Loss % |
|---|---|---|---|---|
| Before | 4 | 35229 | 1559 | 0.37% |
| 5 | 21669 | 1108 | 0.43% | |
| Test | 6 | 12865 | 620 | 0.40% |
| 7 | 10586 | 286 | 0.23% | |
| After | 8 | 18292 | 339 | 0.15% |
| 9 | 18398 | 299 | 0.14% |
© 2019 by the authors. Licensee MDPI, Basel, Switzerland. This article is an open access article distributed under the terms and conditions of the Creative Commons Attribution (CC BY) license (http://creativecommons.org/licenses/by/4.0/).
Share and Cite
Wang, C.-N.; Chiu, P.-C.; Cheng, I.-F.; Huang, Y.-F. Contamination Improvement of Touch Panel and Color Filter Production Processes of Lean Six Sigma. Appl. Sci. 2019, 9, 1893. https://doi.org/10.3390/app9091893
Wang C-N, Chiu P-C, Cheng I-F, Huang Y-F. Contamination Improvement of Touch Panel and Color Filter Production Processes of Lean Six Sigma. Applied Sciences. 2019; 9(9):1893. https://doi.org/10.3390/app9091893
Chicago/Turabian StyleWang, Chia-Nan, Po-Chih Chiu, I-Fang Cheng, and Ying-Fang Huang. 2019. "Contamination Improvement of Touch Panel and Color Filter Production Processes of Lean Six Sigma" Applied Sciences 9, no. 9: 1893. https://doi.org/10.3390/app9091893
APA StyleWang, C.-N., Chiu, P.-C., Cheng, I.-F., & Huang, Y.-F. (2019). Contamination Improvement of Touch Panel and Color Filter Production Processes of Lean Six Sigma. Applied Sciences, 9(9), 1893. https://doi.org/10.3390/app9091893