1. Introduction
With the advance of artificial intelligence, pedestrian loitering detection has been more and more widely applied in many fields. As one case of abnormal behavior detection, it plays an important role in the urban video surveillance system. According to IMS Research’s research prediction, in the next five years the market demand of domestic security software will increase at the speed of 30% to 50%, which is enough to show that today’s video surveillance and management software platform has huge potential market [
1,
2,
3]. The demand of video surveillance systems in public places is large [
4,
5]. Pedestrian loitering detection is mainly applied to safety monitoring in public places such as public transportation areas to ensure the urban safety [
6].
Automatic loitering detection can help recognize vulnerable people who needing attention and potential suspects that might be harmful to public security [
7]. For example, older patients with Alzheimer’s disease in vulnerable groups are prone to be victims of unexpected security event [
8,
9]. Nowadays, people are paying more and more attention to this. Alzheimer’s patients are often in a state of loitering when they need attention. In addition, public safety has always been a matter of great concern. The presence of dangerous suspicious individuals in public places poses a great threat [
10,
11,
12]. Some scholars made an example about human behavior detection in transit scenes told us that detecting specific activities like loitering needs scarce human resources [
13]. Even with costly human resources, facing such a mass of data, operators may be unfocused because of fatigue, distraction, or interruption [
14]. It means that traditional loitering detection is achieved by manual monitoring through observation or with assistance of videos, which is not only time-consuming, but also hard in operation.
During recent years, different kinds of approaches have been proposed to detect loitering behavior, but there are not explicit definition of loitering in the existing research literatures. Some researchers define loitering by time, others define loitering by classify trajectories by curvature or grid [
15,
16], these studies consider single scenario, without considering the different needs of multiple scenarios and external environments. Patino [
17] compared the stationary time of boats on a given area with the time that boats normally stay to determine whether the boats are loitering. Our paper detects pedestrian loitering in different situations. It uses the change of pedestrian activity area size to detect pedestrian loitering. The common loitering detection methods mainly include the feature optical flow method and the motion trajectory method [
18]. Trajectory detection is one of the most common and accurate methods. There are also some motion trajectory-based detected methods [
19,
20]. The abnormal behavior was analyzed by combining the motion tracking and shape aspect ratio [
21]. Kang [
22] used the trajectory distribution and the probability of the trajectory feature to determine loitering. The loitering detection methods in literatures [
23,
24] were performed by capturing the trajectories of the pedestrian area. Although there is large amount of research on trajectory analysis, using trajectory analysis to detect loitering is still a challenge. Authors like Ko [
25] detected loitering by analyzed the simple trajectory but ignored the reality, loitering is usually random and arbitrary. Another loitering detection method based on trajectory tracking in literature [
26] needed use historical traces as an assistive model. A method in the literature [
27] analyzed the trajectory of object through the duration time and angles variation between the initial point and remaining points on the trajectory, but is not suitable for practical complex scenarios. Target missing, occlusion, detection errors, and trajectory terminations all belong to complex scenarios. In order to achieve satisfactory trajectory detection results, complex scenarios must be handled [
28].
In recent years, deep learning has been applied in many fields, obtaining remarkable achievements. Lim [
29] present an intelligent framework for detection of multiple events, but relies on robust known approaches and video content needs to be partitioned by attributes. Commonly used deep learning algorithms are too complex and difficult to build model, affecting real-time performance. Due to the large amount of data and auxiliary equipment required, it also meets some challenges in a wider range of applications. In this paper, loitering behavior is judged by analyzing the size of the active area. Some scholars proposed the use of sparse methods to detect abnormal events [
30,
31,
32]. These methods are not mature yet. Algorithm operations, calculation of regulation parameters, and training models all require high performance computers, as well as long running time. Zin [
33] proposed a monitoring system for automatic detection of wanderers, based on two-dimensional Markov random filed. Artificial intelligence technology was used to detect the loitering of the elderly through tracking and analyzing the mobile targets [
34]. In Dawn [
35] and Hassan [
36] several simple pedestrian activities were analyzed by computer vision. Some pedestrian abnormal behaviors were analyzed by the auxiliary equipment using the human torso motion model [
37]. Zhao [
38] used wavelet transformation to detect loitering behavior in the crowd. Some scholars applied the dynamic texture blending theory to the abnormal analysis of space–time video [
39,
40] to detect pedestrian abnormal. N. Kumar chose Bayesian probability and some probability plot models for video surveillance and detection [
41]. The likelihood function was used to estimate the probability of each individual [
42,
43]. Some methods used auxiliary equipment to complete the loitering detection. The most common method was pedestrian loitering detected with the help of GPS [
44,
45], the target needs to wear a wristband analog, which detection for specified targets cannot be monitored in public. In a method using the stereo camera to analyze abnormal behavior [
46], stereo cameras are needed to track people in dense environments such as queues, otherwise this loitering detection technique works in a generic manner on any trajectory data. Our method has no special requirement for equipment.
The above-existing loitering detection methods used time or target trajectories as assessment criteria, and only handled some simple loitering circumstances because of complexity of target tracks. In order to solve these problems of lacking theoretic foundation of loitering detection and failing to detect loitering in complicated situations, this paper proposes a loitering detection method based on pedestrian activity area classification. First, the Gaussian mixture models (GMMs) and MeanShift are used to detect and track the target. The residence time of the target is used as a prejudgment for loitering detection; the complex trajectory is transformed into area using coordinate points of trajectory to describe the geometric figure. Pedestrian loitering behaviors are divided into three categories, i.e., the rectangle loitering, the ellipse loitering, and the sector loitering. The loitering is recognized if the pedestrian activity is detected to be constrained in an area within a certain period of time. The algorithm does not need to consider the complex trajectories, and it is effective and efficient in detecting loitering behaviors.
2. The Overview of Our Proposed Loitering Detection Method
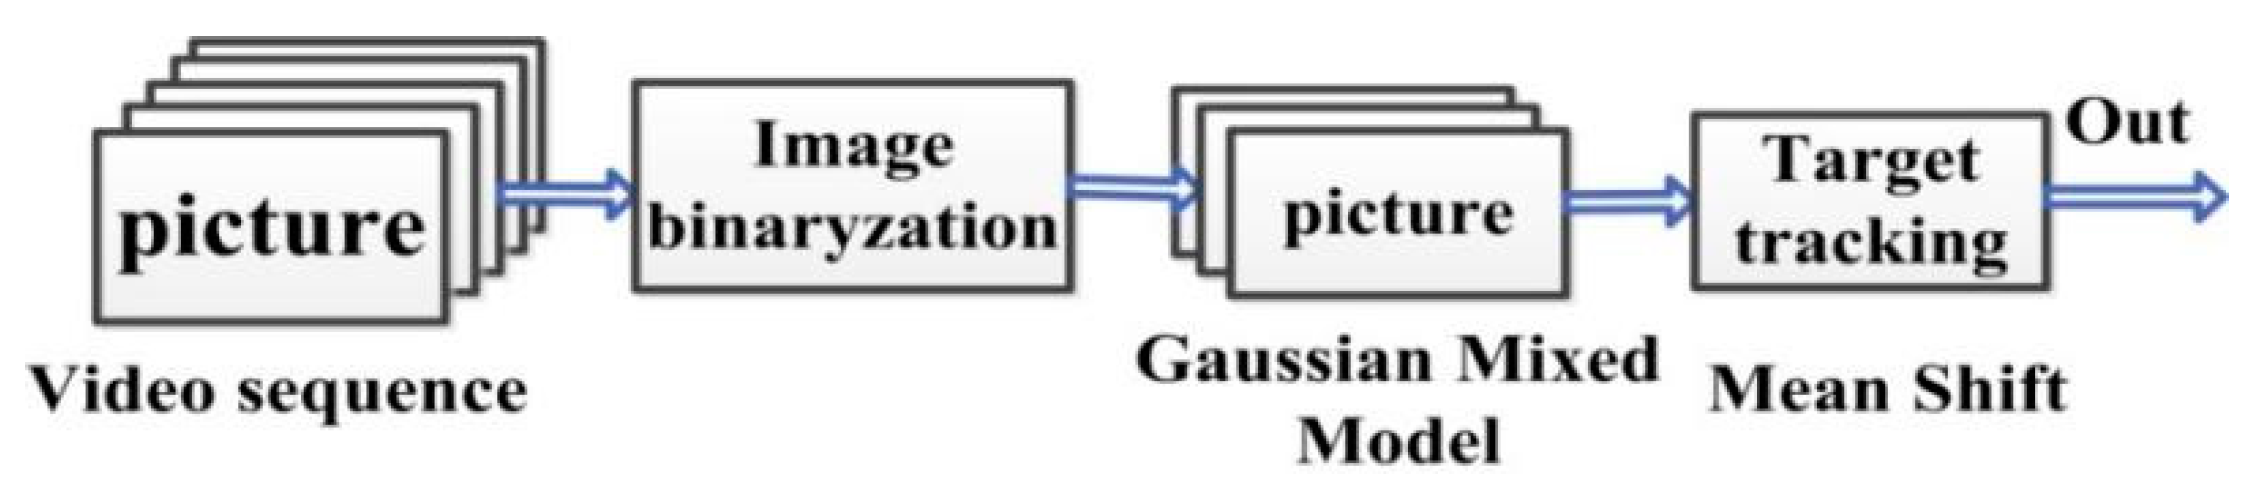
Figure 1 shows the overall framework of our proposed loitering detection method. According to different scenarios, the method analyzes and calculates the size of the target activity area using the best adaptive fitting curve for loitering detection. An automatic alarm will be performed when loitering behavior occurs.
The previous research was based on simple scenarios and lacks reliability. This paper redefines and classifies loitering through the new perspective of pedestrian activity area. In the analysis of loitering in various situations, pedestrian activity areas were used to divide loitering behavior into three categories.
In the spacious and wide scene, normal pedestrians usually walk straight line with a strict goal [
47]; the suspects are aimless. They keep loitering with a complex and disordered trajectory in order to not to be noticed.
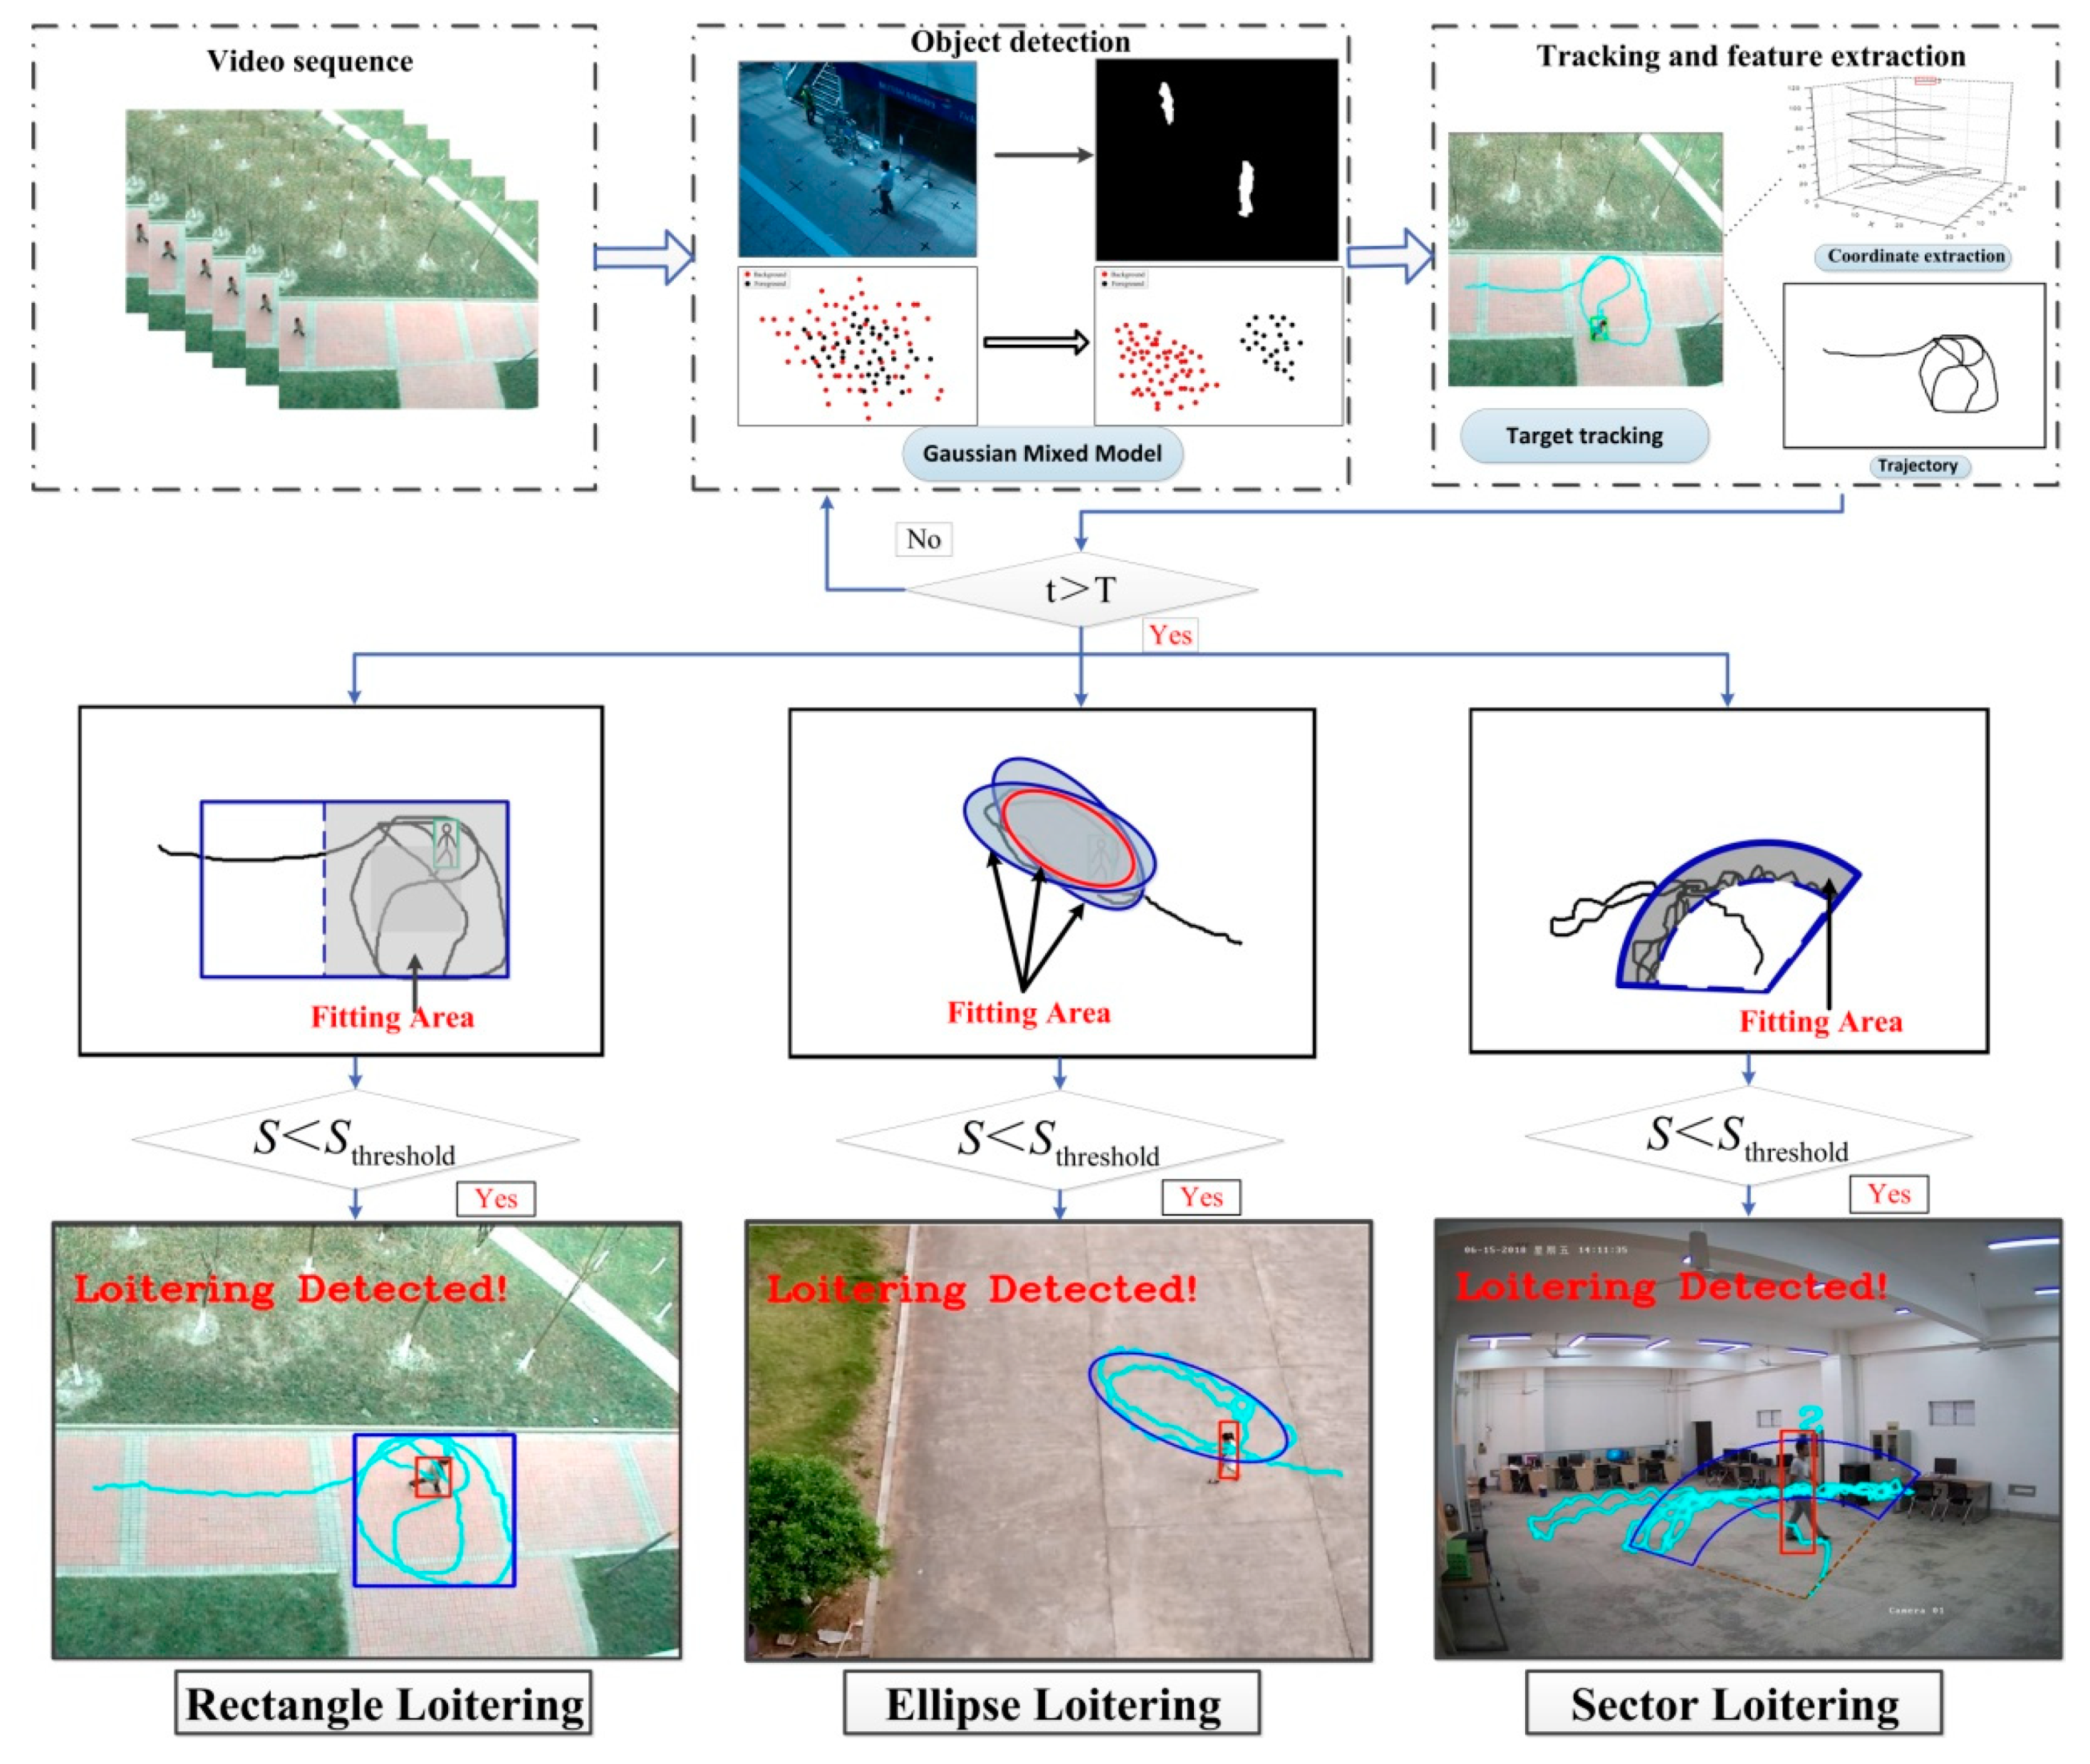
Figure 2 shows a rectangle loitering in the real scene. Through the trajectory map and analysis of suspicious target trajectory, the target’s area of motion is completely in the red rectangle. So, we call this type of loitering as rectangle loitering within a rectangle area.
In some small spaces, suspects with abnormal behavior loiter in a narrow area with back-and-forth movement. However, when the area of activity decreases, the distribution of target trajectory is dispersed, and the trajectory coordinate change greatly and discrete. The rectangular analysis method not satisfy this kind of small area movement, which will miss the judgment of loitering behavior.
Figure 3 shows the different detection methods used for fitting the loitering in the same situation. The rectangle frame and ellipse frame were used to fit the same area of activity, and the shaded area was the difference of the area. So, it is necessary to propose ellipse detection in order to improve the accuracy of detection. Aiming at the narrow moving scene and the large return distance of target trajectory, an ellipse area fitting method is proposed. The trajectory of the suspect will constantly change. We first detected the convex hulls of all the trajectory points, and then used the ellipse fitting to solve the problem of uncertainty in the active area and the irregularity of the trajectory.
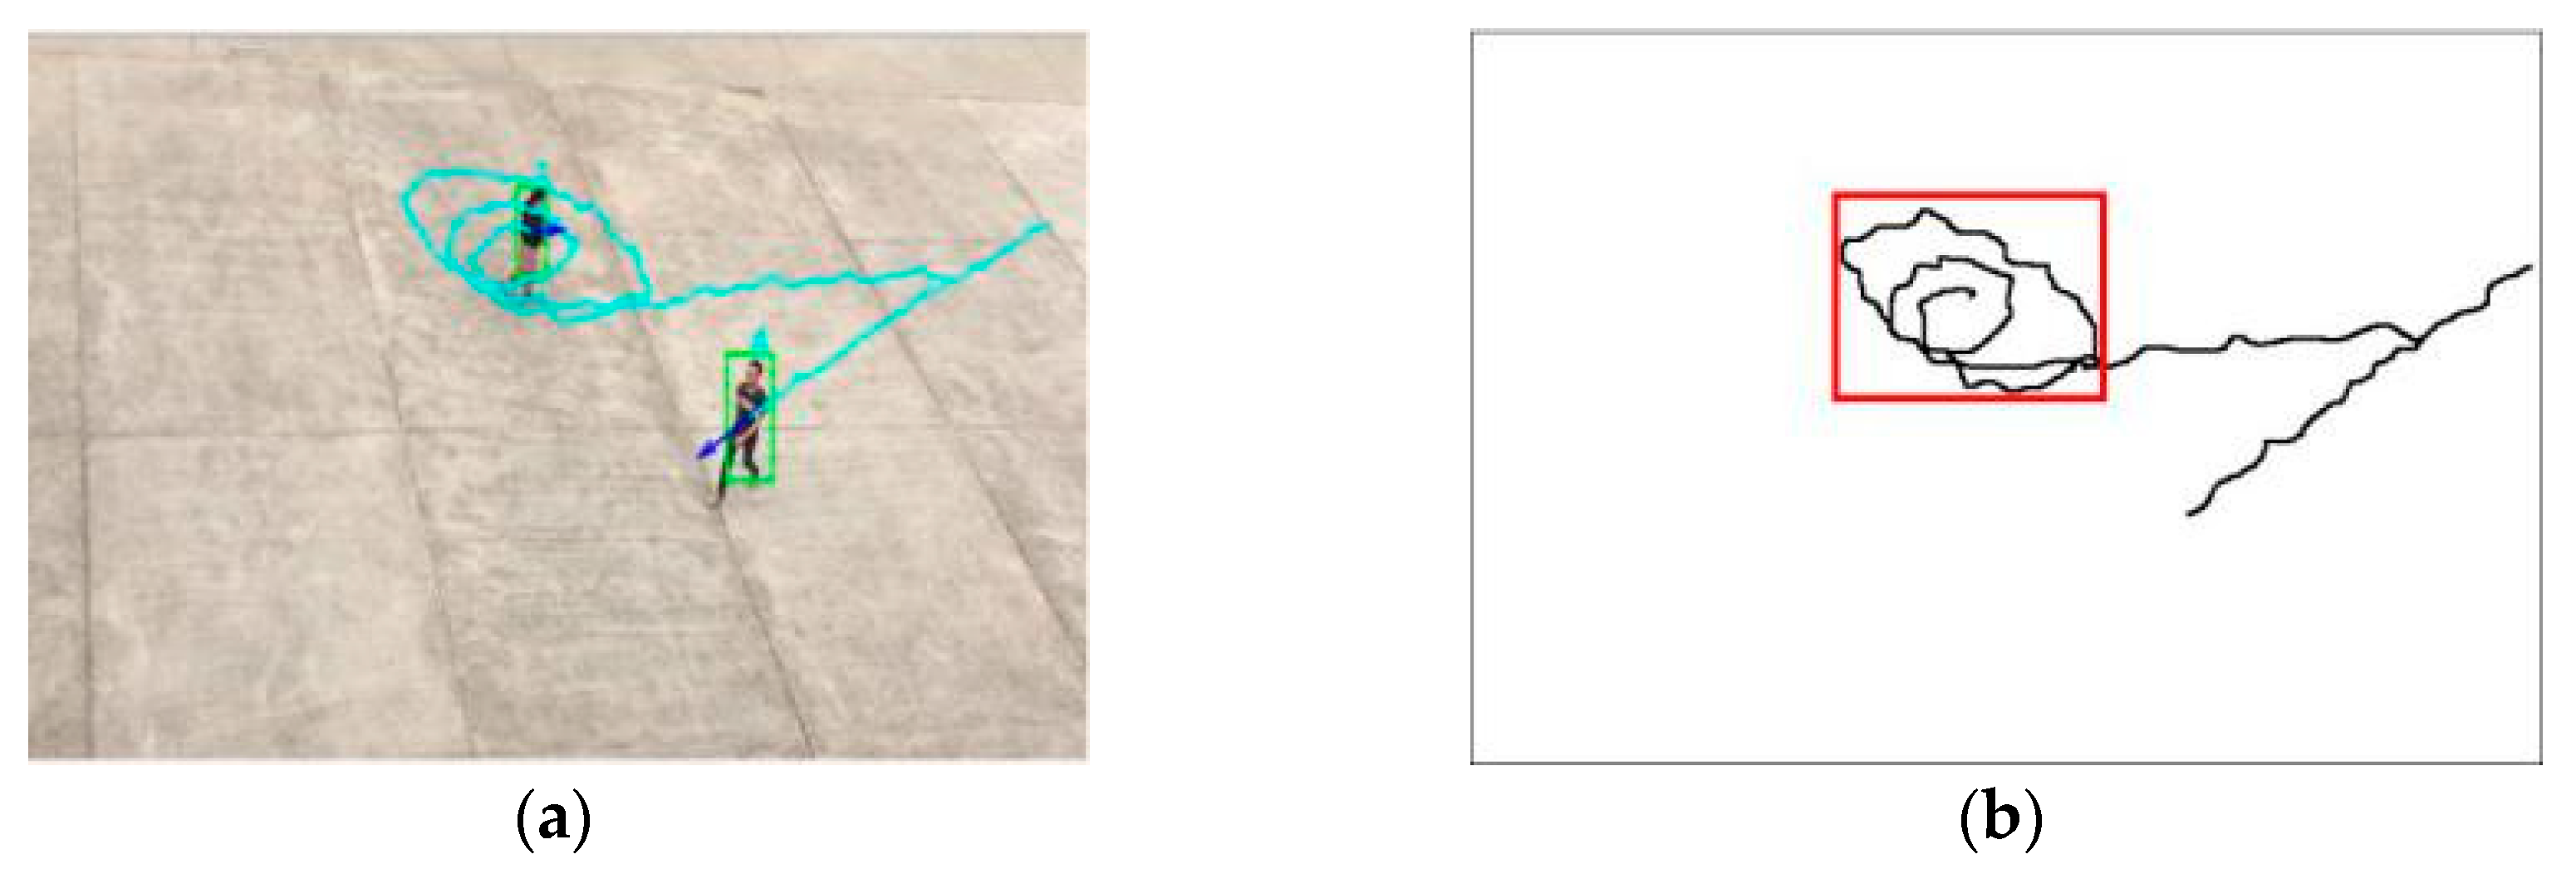
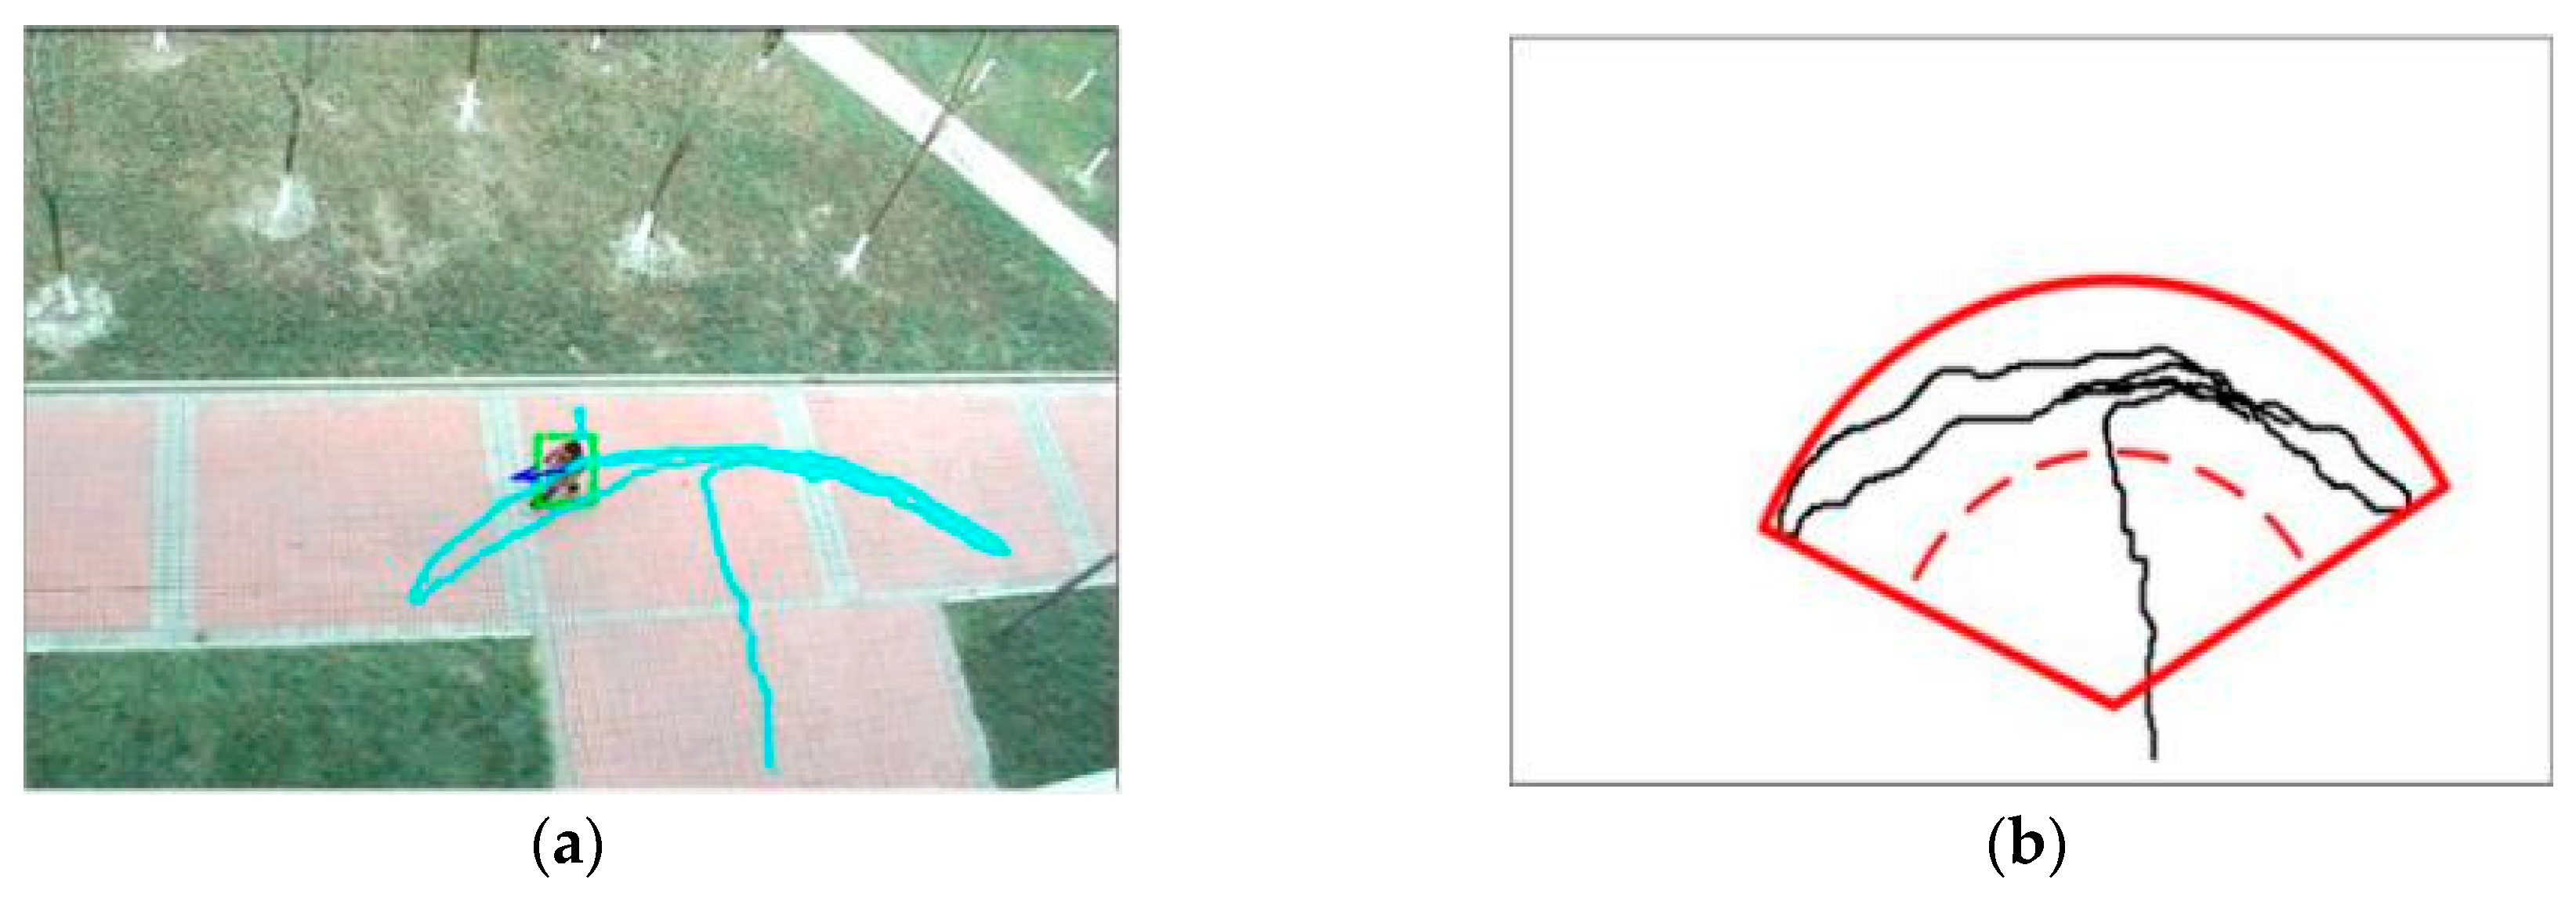
In some occasions, the suspects, such as thieves or drug dealers, are purposefully loitering around points of interest. Candamo [
13] the author claims that the suspect’s motion is purposeful, for example, drug dealers focusing on the goals of interest, purposeful round trip loitering, to achieve drug dealing or stealing. This is very similar to the reality of the detection of dropped objects [
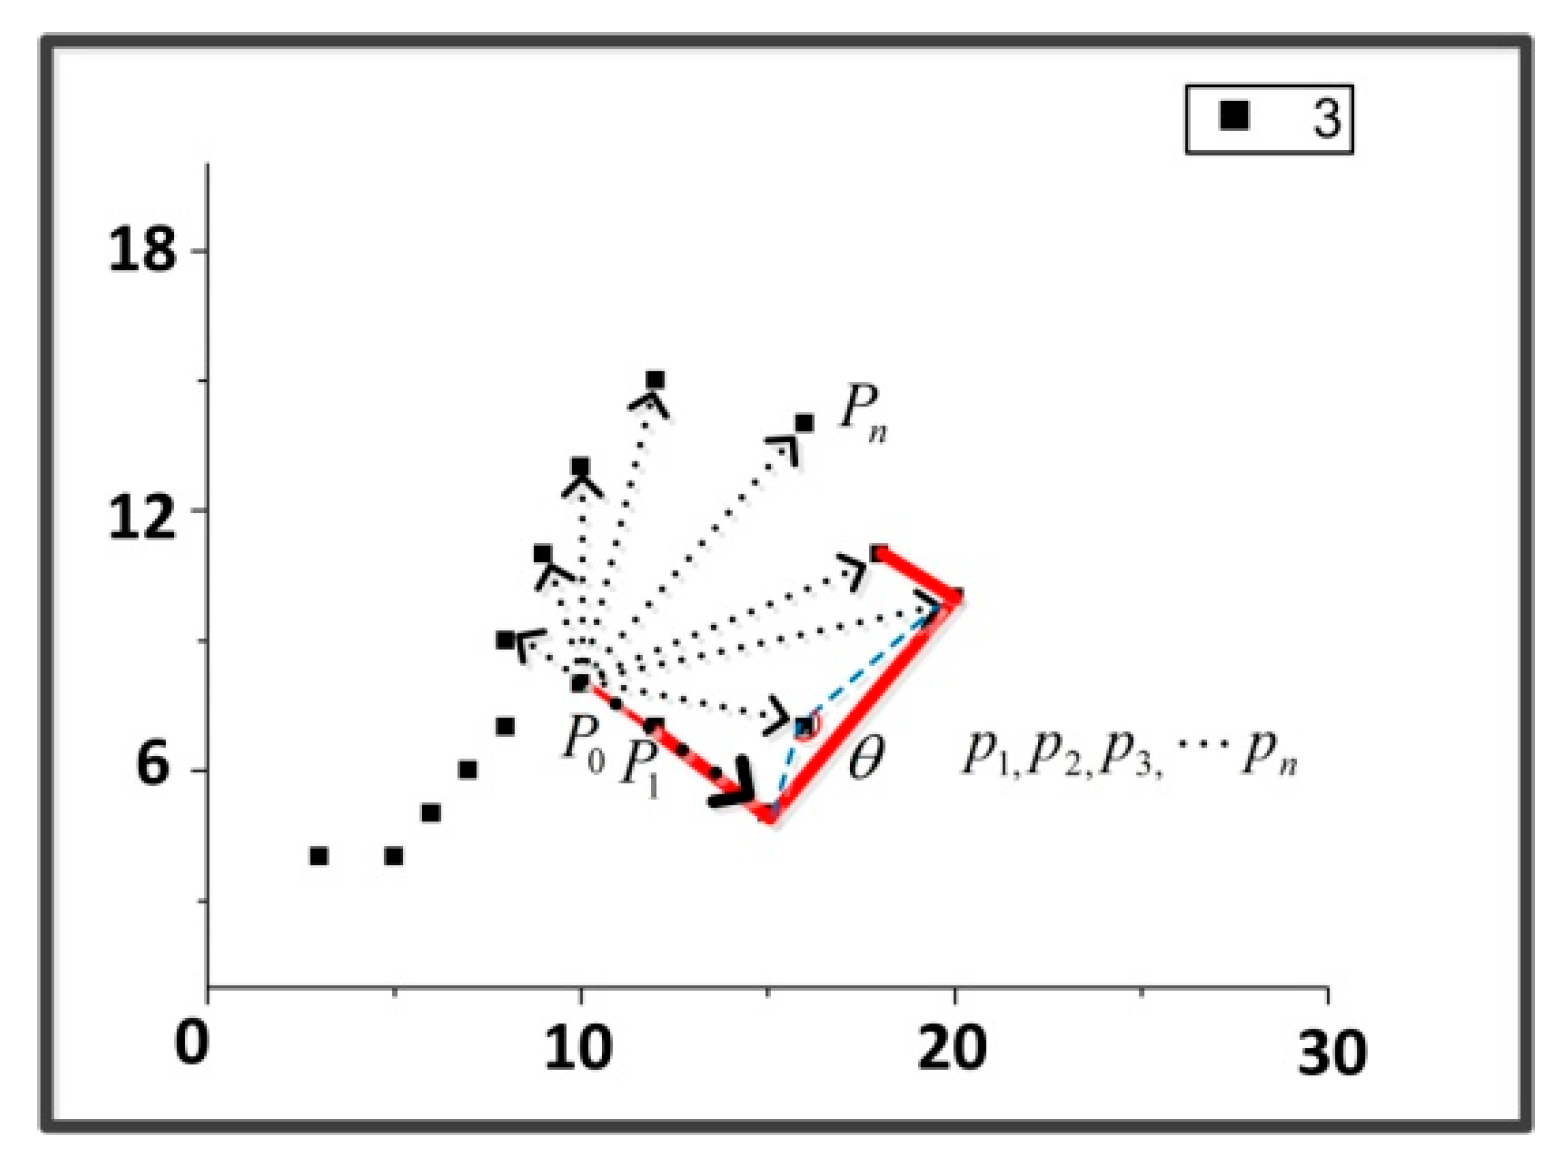
48]. From the perspective of the mathematical model for analysis, this kind of activity area is similar to a sector. A sector loitering example is shown in
Figure 4. The pedestrians’ activity area is fitted with a red sector which contains the motions of the pedestrian. We call this type of loitering as a sector loitering around a point in a sector area.
3. The Loitering Detection Methods
3.1. Target Detection and Tracking
Loitering detection video is usually shot statically, and the background is changed slowly, mainly considering the impact of illumination, occlusion, and so on. In this paper, in order to achieve the purpose of detecting moving objects, GMM [
49] is used to detect the target. The probability density of image gray level is estimated by the gray level difference between target and background, this method has high accuracy and objectivity. Multiple Gaussian models are selected to represent the feature distribution, then compared with the GMM. The EM iterative algorithm is used to solve the parameters of the GMM. Based on the existing library implementation algorithm, some parameter values are default values and complete the classification of target and background.
We established
GMM fusion models in each pixel, the probability density function of a pixel
at time
is shown in Equation (1).
where
is the weight of the Gaussian model,
is the mean vector of the Gaussian model, and
is the covariance vector of n GMM fusion models. We used the EM algorithm to calculate the parameters of the GMM and posterior probability, set a new latent variable
Z, and then transformed Equation (1) by variable
Z to Equation (2).
Attain the posterior probability
by the prior probability
, and
is likelihood probability. The posterior probability
is shown in Equation (3).
From the Equation (3), the derivative expressions of three variables are shown in Equation (4).
where
Q is the number of all the pixels, we update the parameters to convergence by using Equations (3) and (4) so as to achieve the purpose of detecting moving objects; this method has high accuracy and objectivity.
After targets are detected, we used the MeanShift method to find the most likely target location in the current video frame [
50]. The process of object tracking is to find a target position to make the Bhattacharyya coefficient maximize, it is defined in the following Formula (5).
and
represent the relative density functions of the discrete position and the target model, respectively. The specific flowchart of target tracking is shown in
Figure 5.
Through the above method, we can track the pedestrian and get a series of tracking coordinates defined in Equation (6).
where
respectively, represent the position coordinates
at the corresponding time.
Figure 6 shows the motion trajectory.
represents the trajectory of the
target. We use Equation (7) to calculate the change of the pedestrian angle to select the feature points:
where
represents the direction vector’s angle value of the target at the different moment.
is the angle threshold set to
in our experiment if it meets the condition in the Equation (7) at a point, then we record this point as feature point
.
The moment of the initial direction vector is the moment. Once a feature point is found, the direction vector will be replaced by the direction vector . The eigenvector of the trajectory is marked. As the number of eigenvectors appearing in the time exceeds 4, it needs to find corresponding loitering detection based on different activity area characteristics.
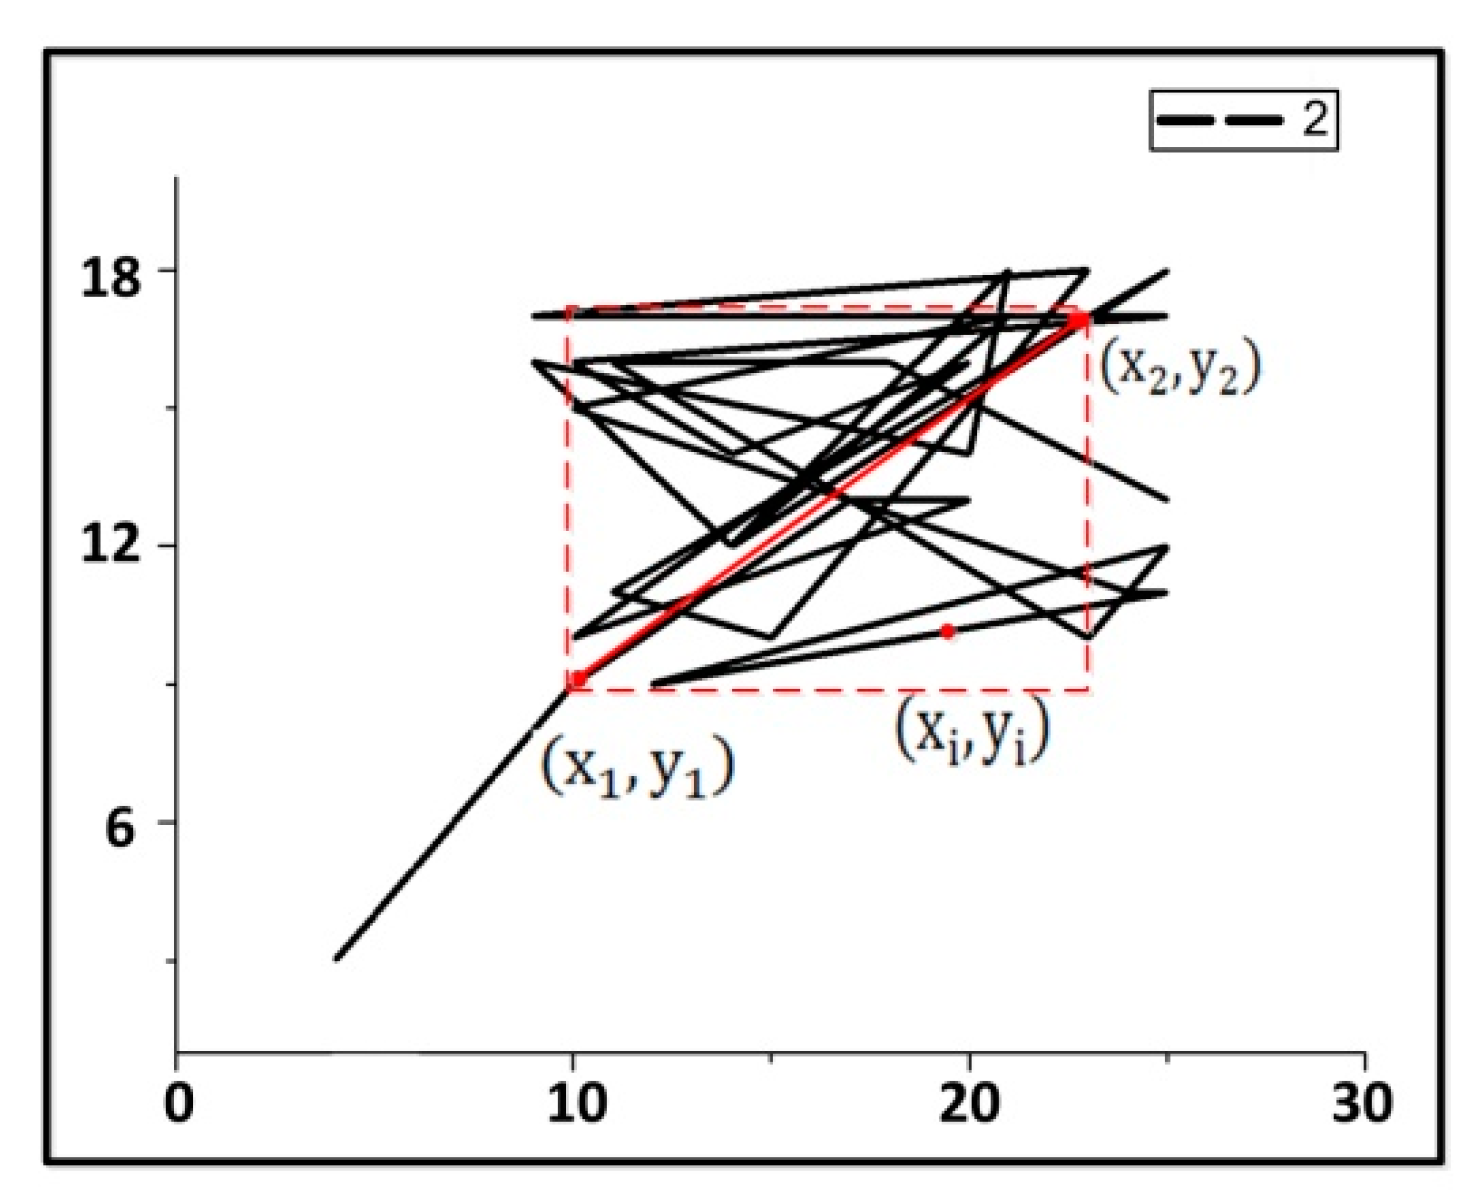
3.2. The Rectangle Loitering
We use Equation (8) to establish an active rectangle frame to determine whether the pedestrian’s activity area is in a rectangle frame. A rectangle trajectory is defined as a trajectory contained within a rectangle, as shown in
Figure 7.
In Equation (8), represents any coordinate in the period, represents the coordinates of moments, represents the coordinates of moments, and represents all coordinate points in the rectangular domain with and as diagonals.
We propose a dynamic rectangular frame to judge loitering, which avoids judging the motion trajectory of each frame in the video. The detailed of our algorithm is described in the Algorithm 1, where represents the initial threshold. In our experiments using PETS 2007 dataset, the time threshold is set to 60 s. The time threshold should be set according to different scenarios.
| Algorithm 1 Rectangle loitering detection |
Input: the trajectory coordinates
Output: loitering detection result |
Extract the trajectory coordinates when , calculate the distance between and , Update , calculate the size of activity area: Compare the area, if , a rectangle loitering is detected.
|
3.3. The Ellipse Loitering
An ellipse trajectory is defined as a trajectory contained within an ellipse. We use the following steps to determine whether the pedestrian’s active area is in an ellipse area. Firstly, the Graham scan [
51] method is used to find convex hulls for all track points in time
, then ellipse fitting is performed.
Figure 8 shows the process of finding a convex hull of a set of point.
| Algorithm 2 Ellipse loitering detection |
Input: the trajectory coordinates
Output: loitering detection result |
Extract the trajectory coordinates . when , find convex hull, input point set ; calculate the distance between and . Sort the clockwise direction through the polar angle and distance , then cycle points; select six points in the calculate coordinates, ; calculate parameters: Record num-match and num-index, when update ellipse parameter. Calculate the size of activity area: , compare area, if , an ellipse loitering is detected.
|
In order to fit the ellipse, we use the general elliptic equation in Equation (9).
We used some constraints [
52] so that we can directly use the coordinates of the trajectories to do the least square. The coefficients of the equation can be obtained using Equation (10).
Each coefficient is determined by its minimum value. Equation (11) can be obtained by the principle of extreme value.
Thus, we can get values, so that we can perform ellipse fitting on the given coordinates, calculate the optimal elliptic equation with least squares method. The detailed algorithm is described in the Algorithm 2.
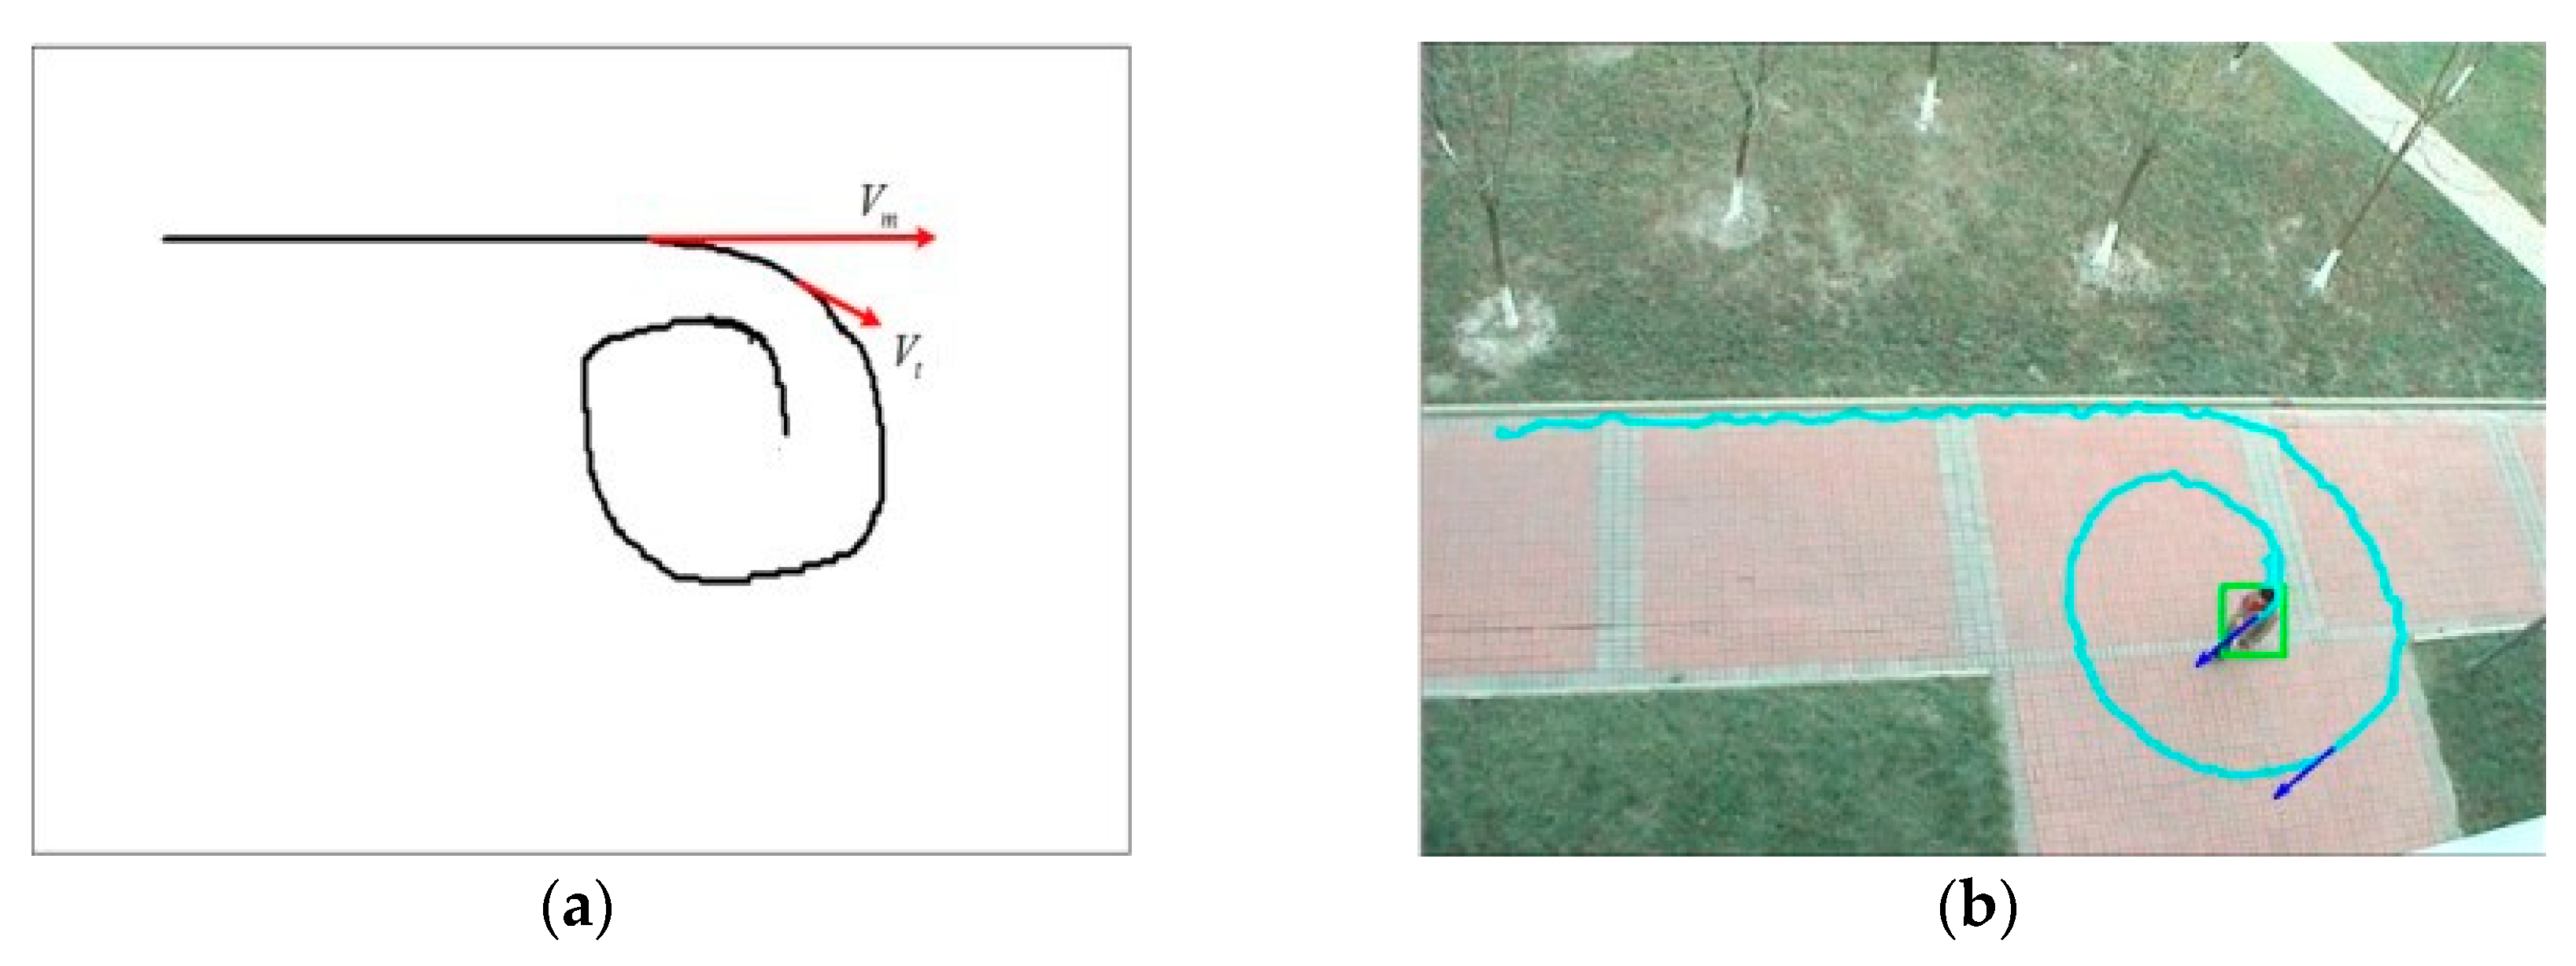
3.4. The Sector Loitering
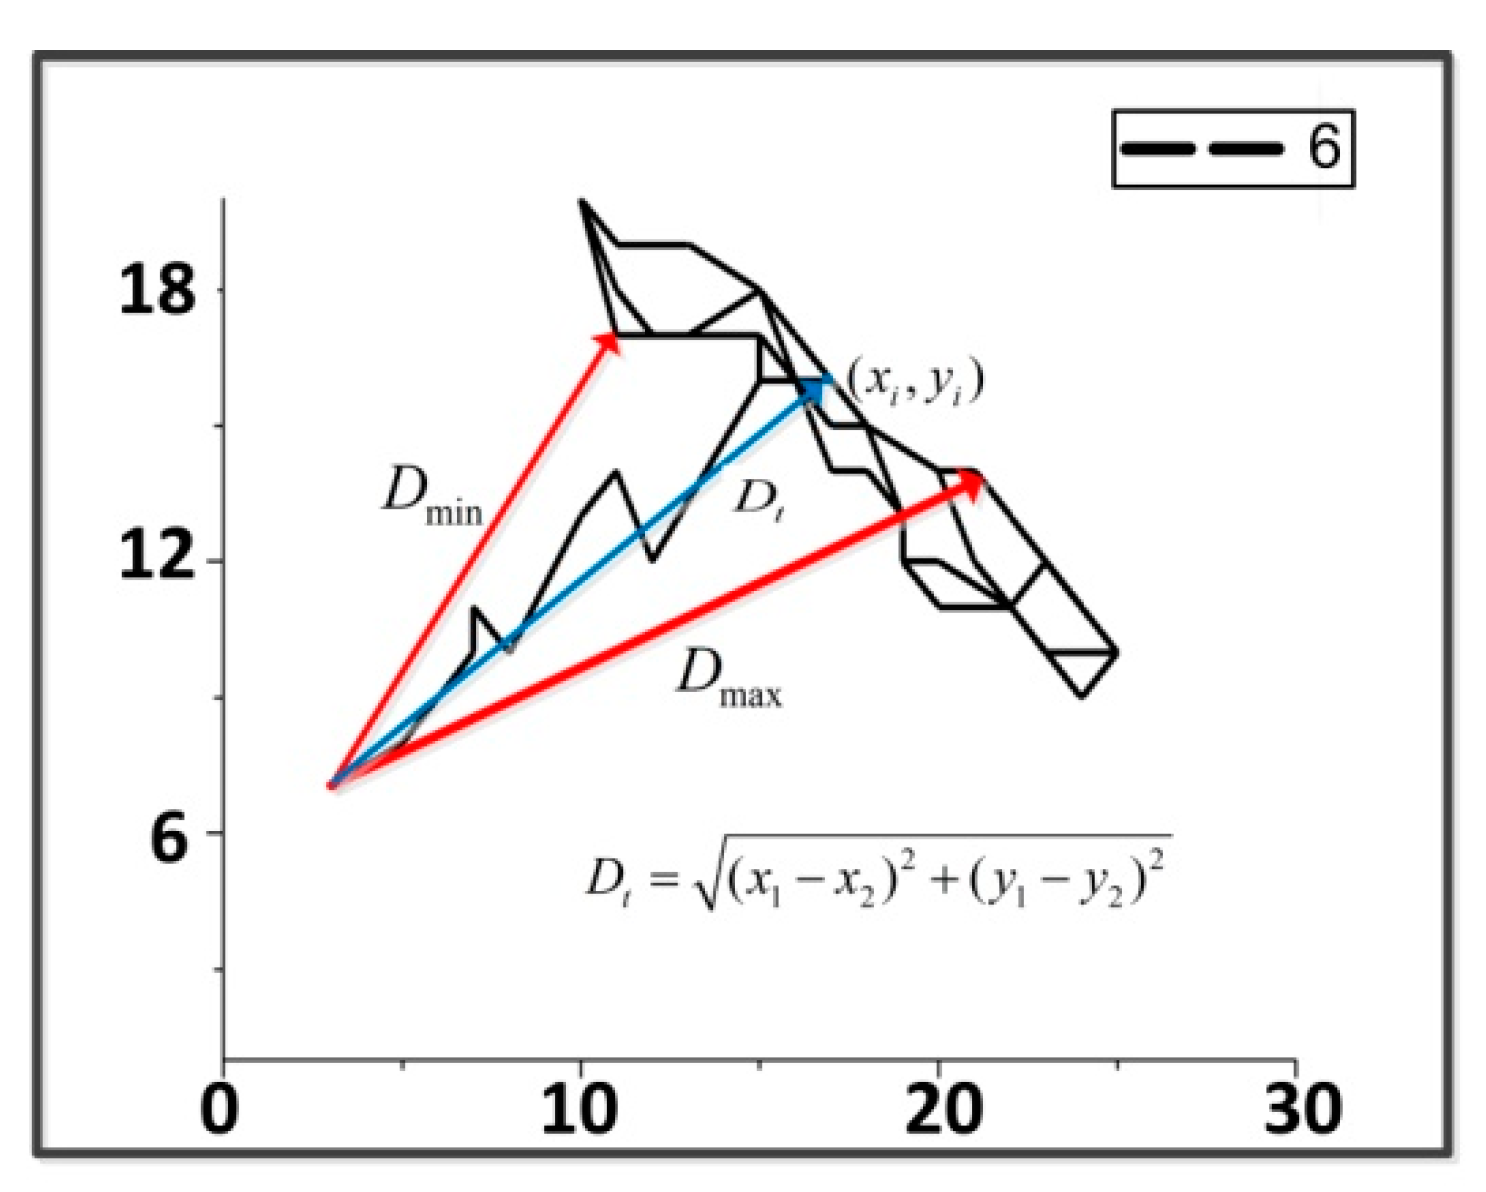
When suspicious person loiters around the point of interest, suspect’s activity area revolves around one point. The displacement calculating cannot accurately determine whether pedestrians have abnormal behavior. Therefore, a sector trajectory is defined as a trajectory contained within a sector. As shown in
Figure 9. Equation (12) is the loitering definition based on the sector.
The is the displacement between the initial detection coordinate and the current coordinate and and are the set thresholds. is the maximum value of the coordinate point displacement, while is the minimum value of the coordinate point displacement in the time . The detailed algorithm is described in the Algorithm 3.
| Algorithm 3 Sector loitering detection |
Input: the trajectory coordinates
Output: loitering detection result |
Record the initial position , extract the trajectory coordinates Calculate the distance between and , when , then update into the scope Calculate the size of activity area, the sector angle is : , So, the area is: . Compare the area, when , then a sector loitering is detected.
|
4. Experimental Results and Analysis
Most of the public abnormal behavior dataset are abnormal behaviors for public safety. There are only a few datasets for loitering. The most classic dataset is PETS2007 [
53]. This dataset was taken by four cameras at four different angles. The shooting scenes were changeable and complex. The PETS2007 dataset has specialized experimentation and testing for loitering. Loitering is defined as a person who enters the scene, and remains within the scene for more than 60 s.
We also collected our own dataset by using video cameras. About our collected dataset, we used HIKVISON DS-2CD5152F-IZ camera, choose different scenarios for experiments. The video was saved in AVI format. Videos in the dataset were captured at 15 frames per second. To ensure the quality of the experiment, each video has at least 800 frames. We collected 120 videos (90 videos of loitering and 30 videos of normal walking), including loitering detection in many scenarios from both indoor and outdoor scenes.
In order to ensure the loitering experiment, we tested PETS2007 and our collected dataset which contain different angles, different illumination, target occlusion, multitarget, and so on.
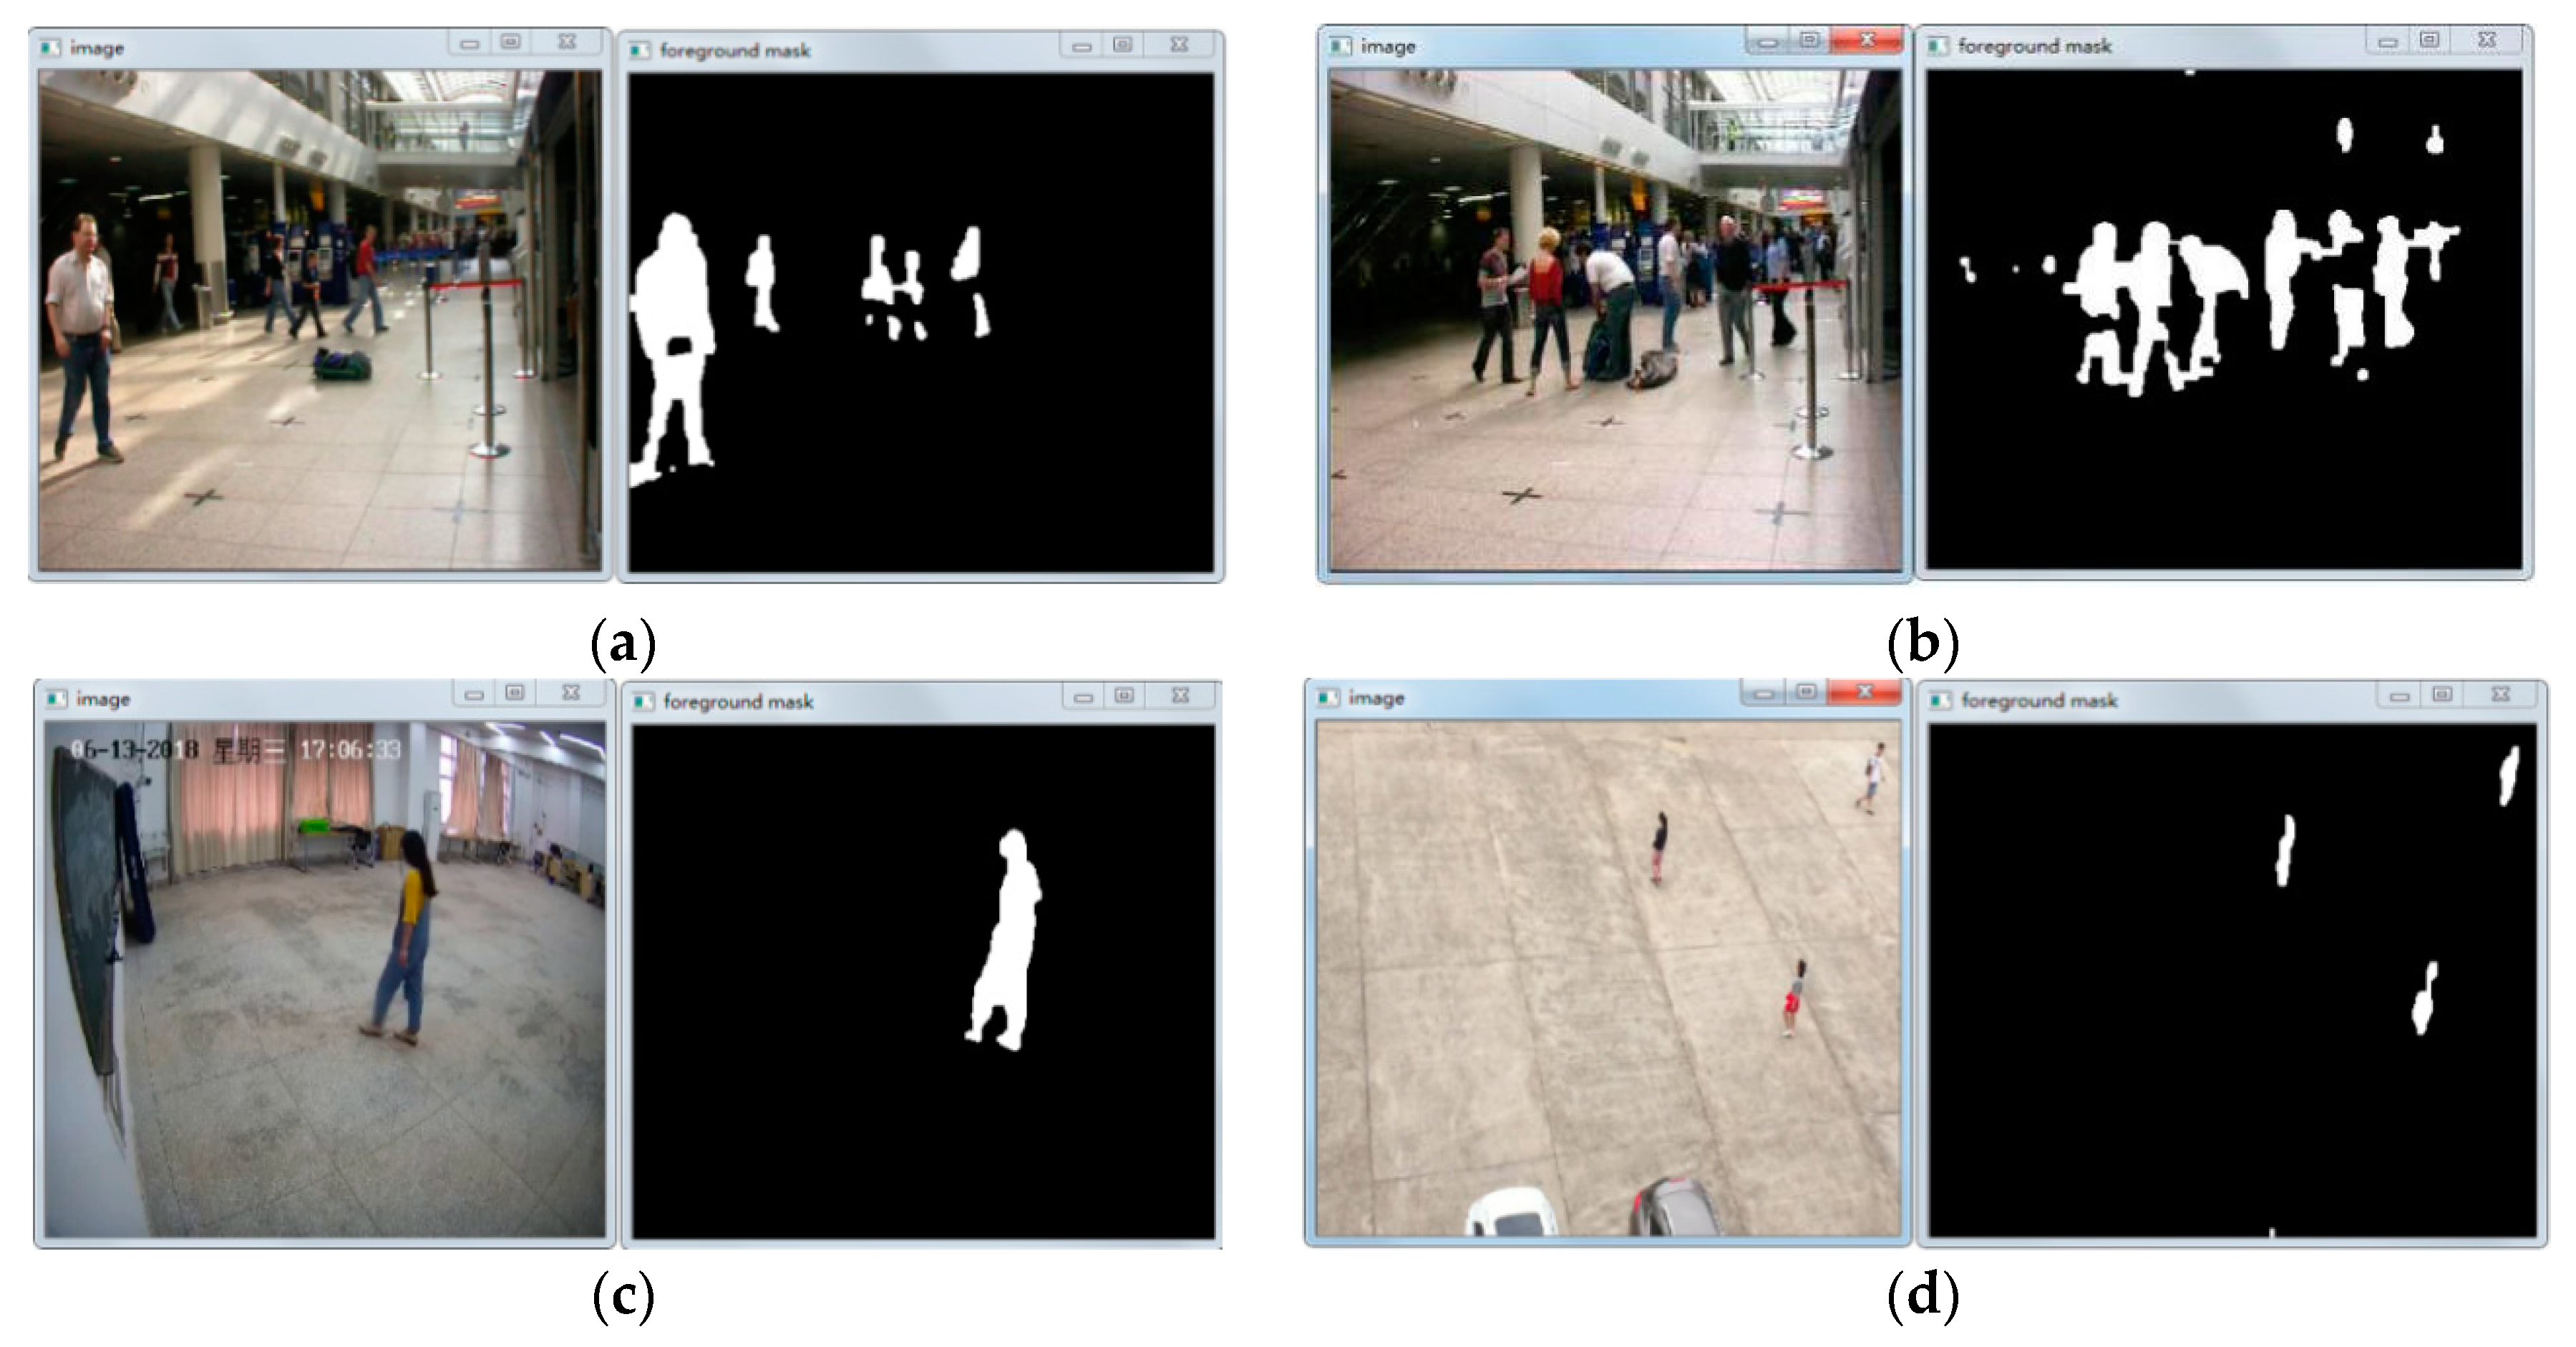
Figure 10 shows the results of test PETS2007 dataset and our self-collected dataset by using the GMM fusion model. The background of the PETS 2007 dataset is complex and many challenges exist while detecting objects such as dynamic environment, illumination, occlusion of objects, etc.
Figure 10a,b shows the detection effect of the PETS 2007 dataset. The detection scene is complex background in public places, and there are many external factors such as illumination change and occlusion. Although the experimental results provided by PETS 2007 dataset were inevitably incoherent and some residual, the overall effect was still relatively accurate.
Figure 10c–d shows the results of our collected dataset including outdoor and indoor scenes. The dataset collected had accurate detection results and distinct human contours were extracted.
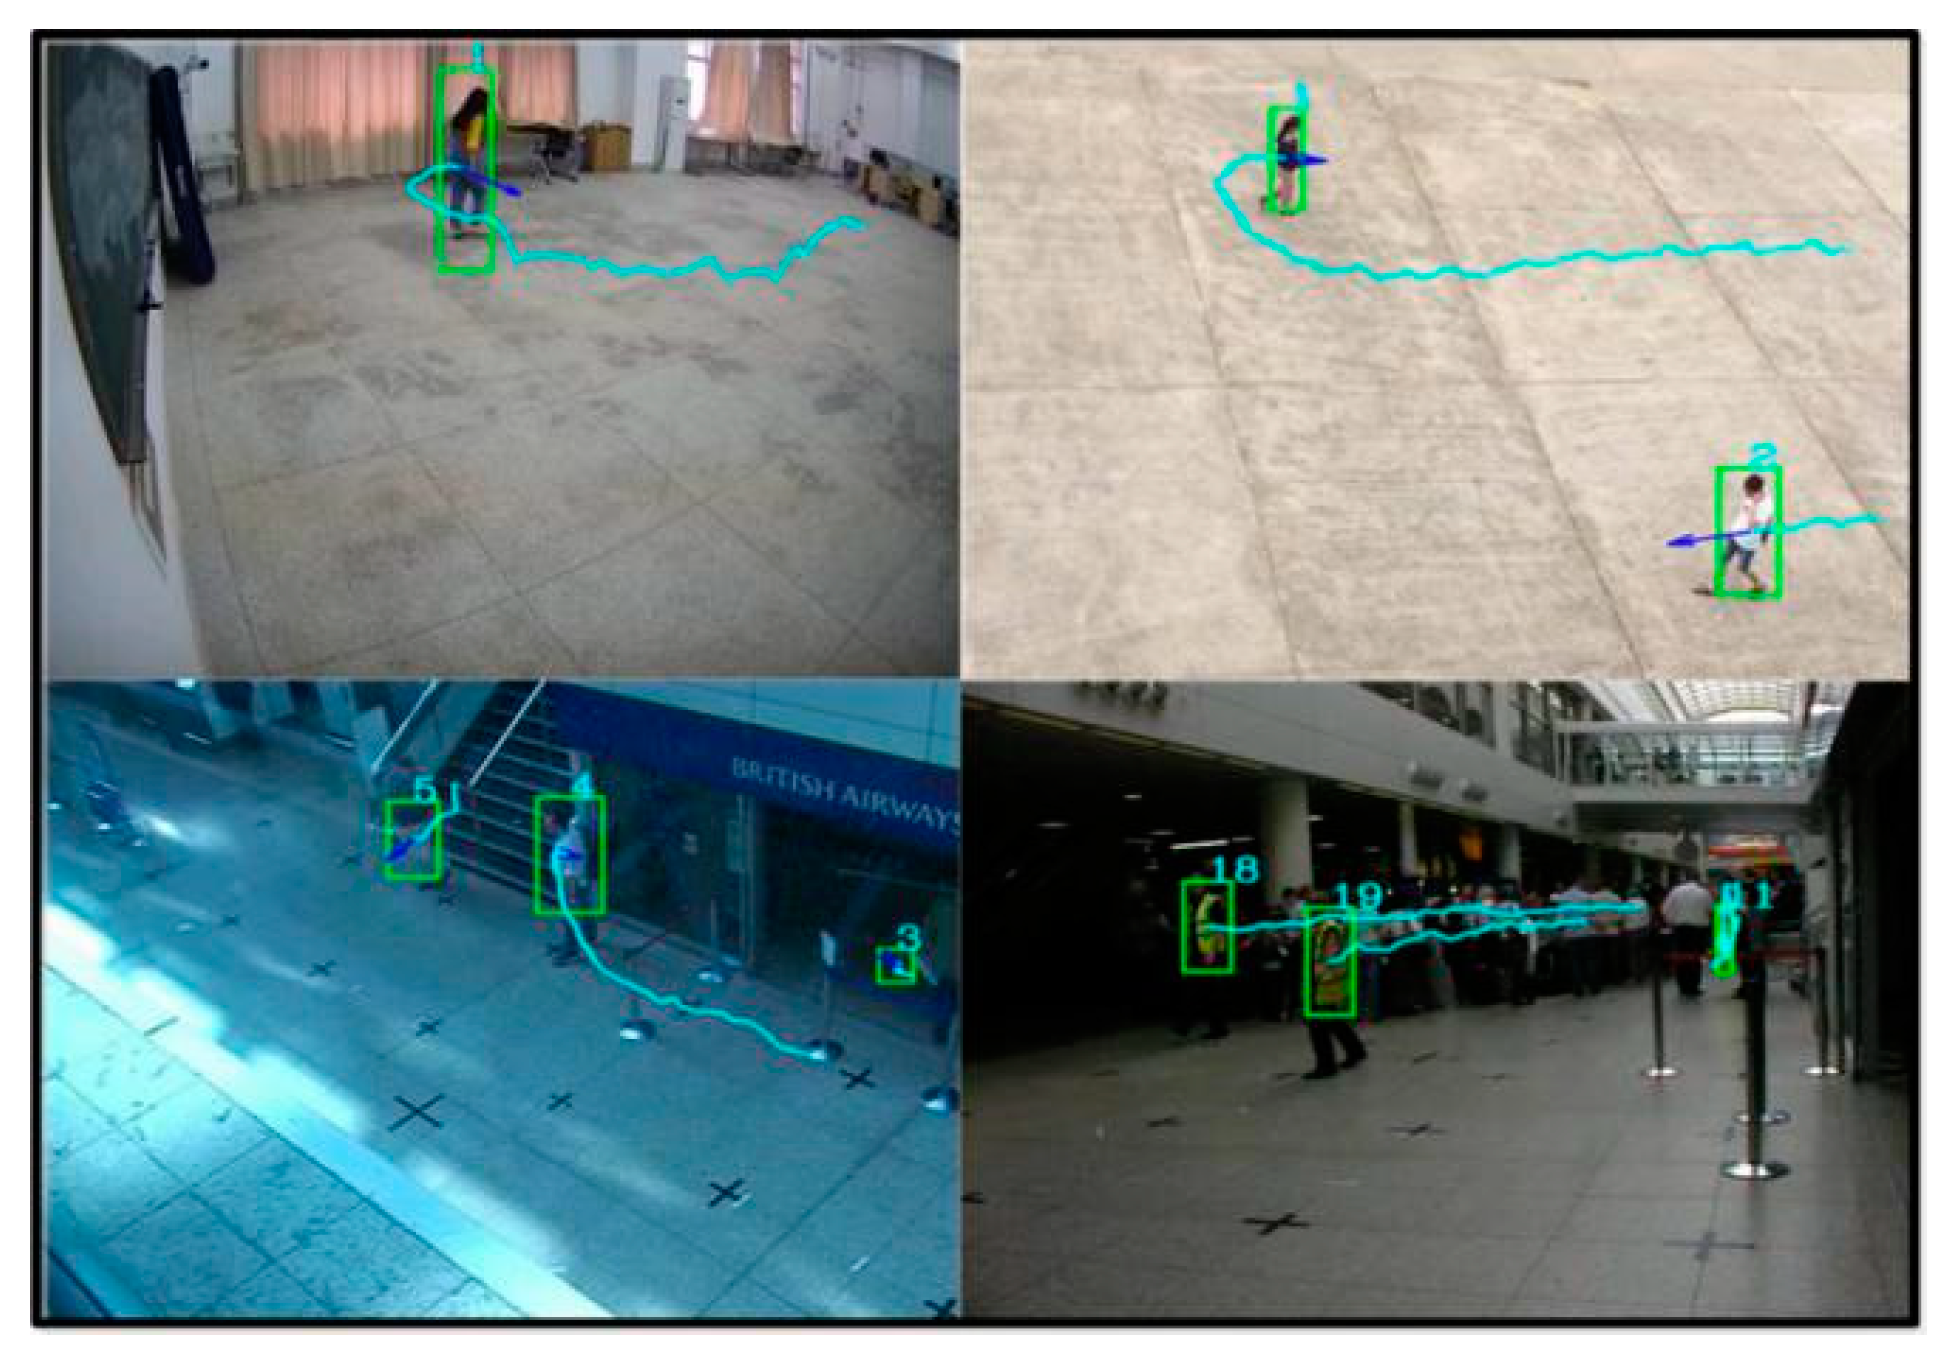
Figure 11 shown the experimental results of tracking and detecting pedestrians. The trajectory of pedestrians was plotted, the green frame is used as the detection frame, and the center of the frame is used as the trajectory plotting point. For the PETS 2007 dataset, mobile pedestrians could be detected. The test results are valid for our collected dataset.
Table 1 shows the accuracy of target detection and tracking based on our collected dataset and PETS 2007 dataset.
After the detection and tracking algorithm achieves high accuracy and good robustness, a loitering detection method is added to the framework. Through the analysis and testing of the dataset we selected 30 videos of each algorithm for area threshold testing. Those videos are all from loitering dataset collected by ourselves. In order to be applicable for video surveillance scenarios, all videos are converted to the same resolution 704
576, which can reduce the influence of different resolution on detection results.
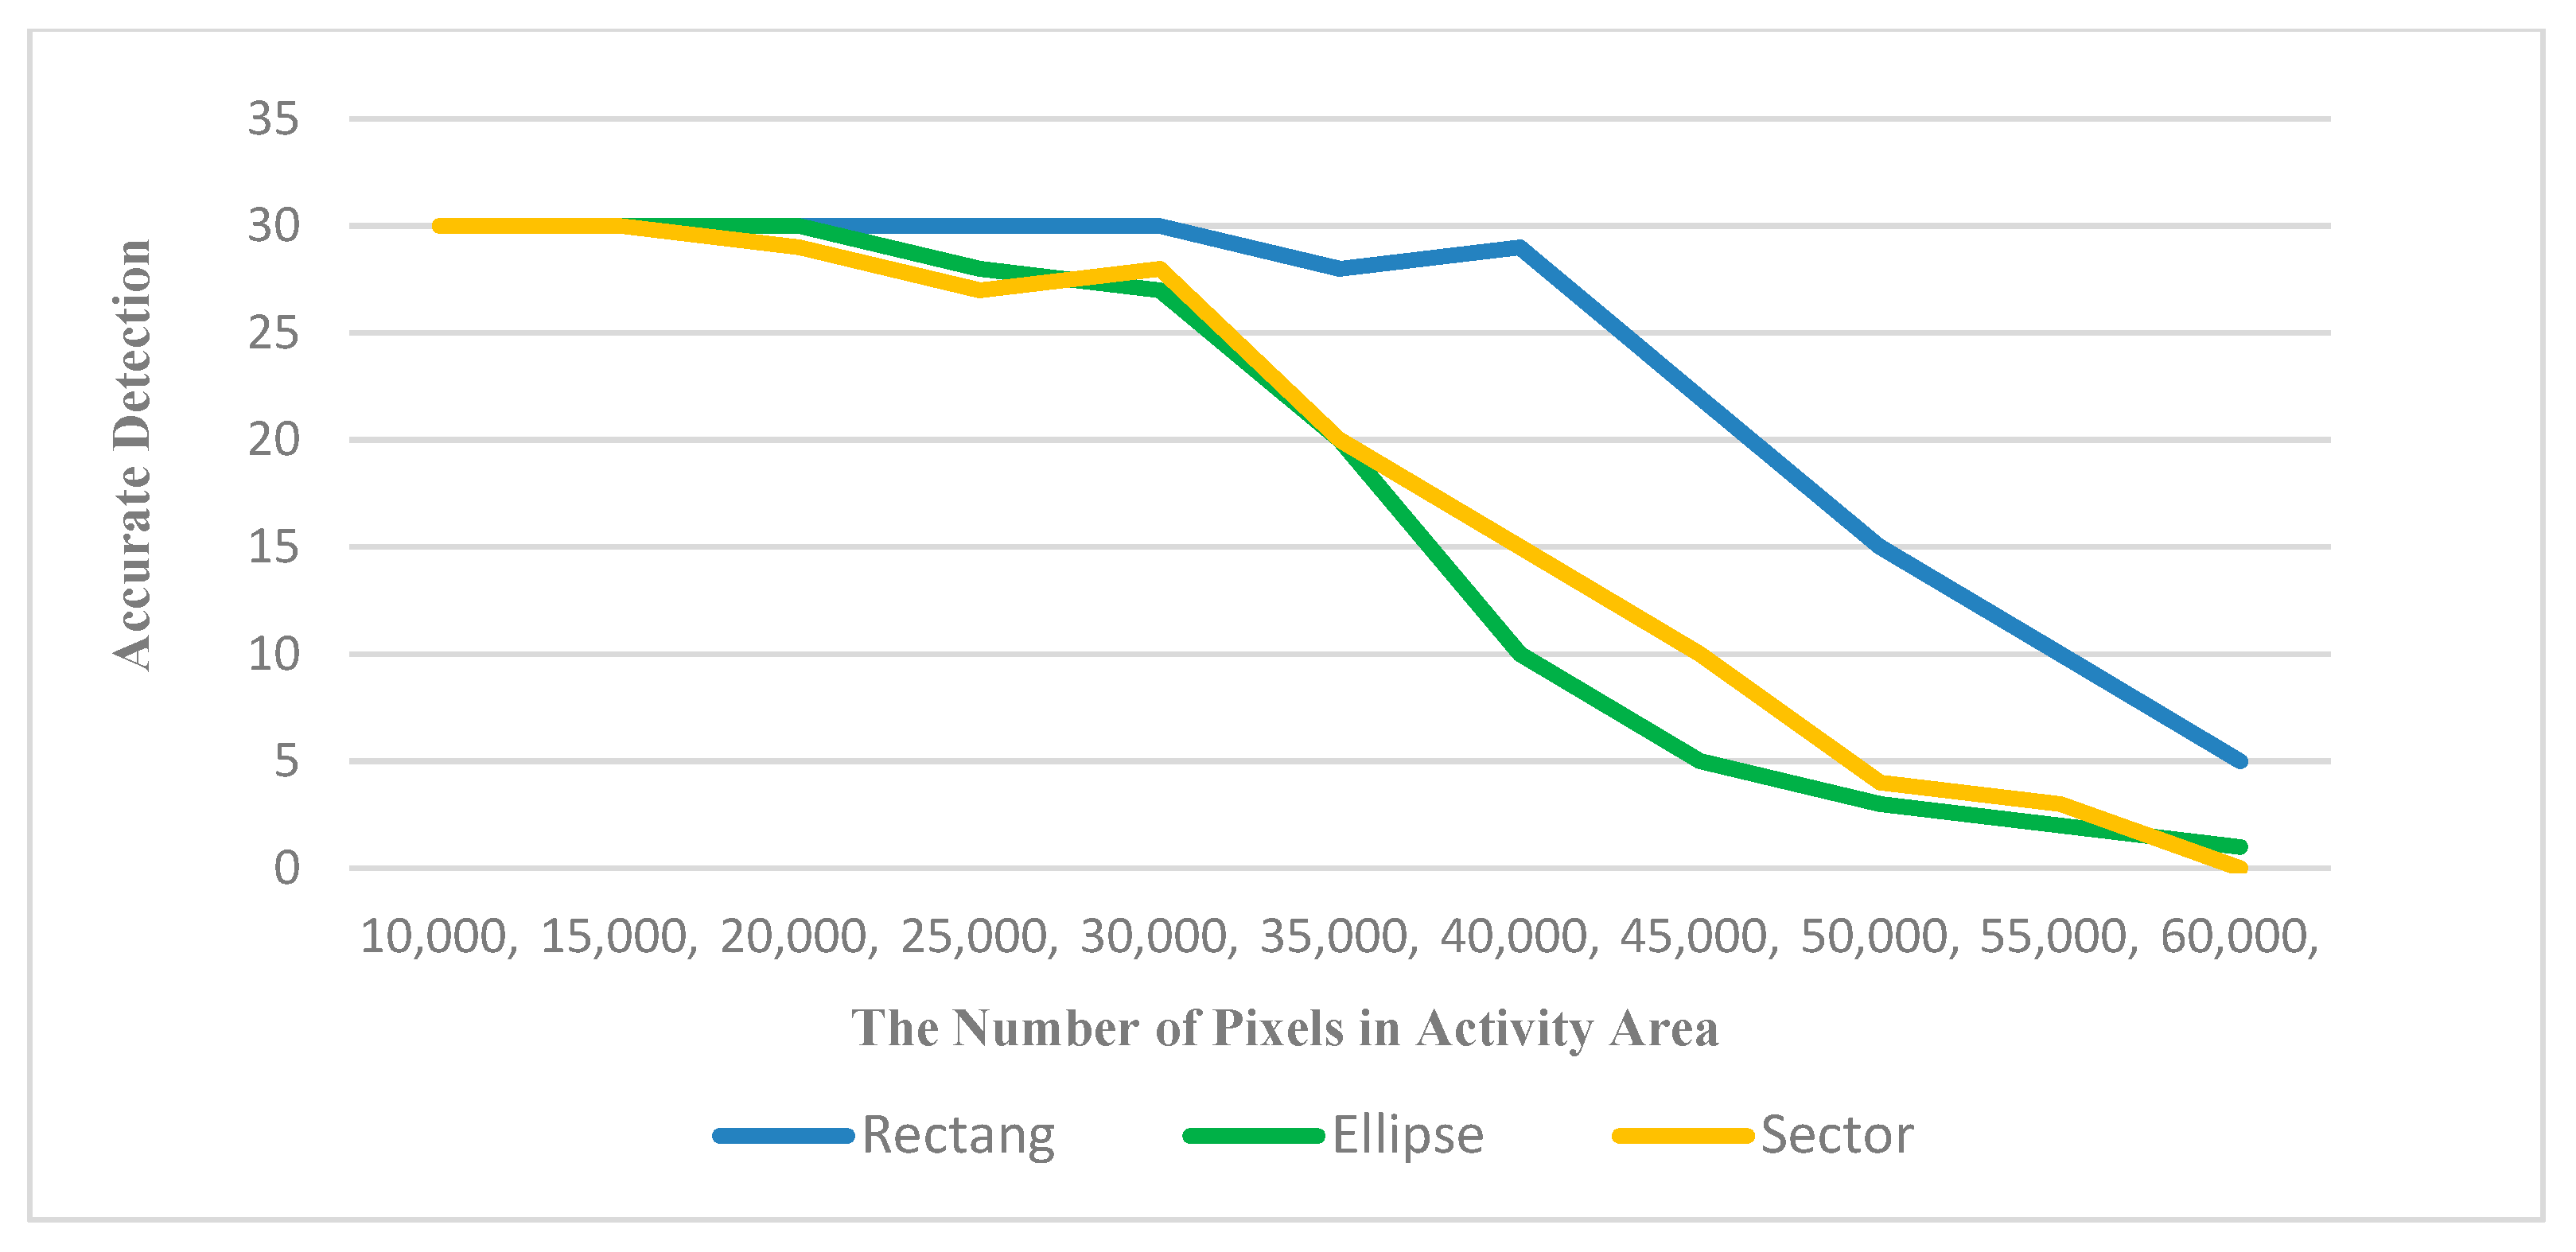
Figure 12 shows the accuracy of loitering detection algorithms with different area thresholds. The abscissa is the number of pixels which represents the area of geometric figure while the ordinate represents the number of correctly detected videos containing loitering instances. The change of curve represents the ability of the algorithm to detect correctly under different area thresholds. The higher the curve is, the better the detection effect is.
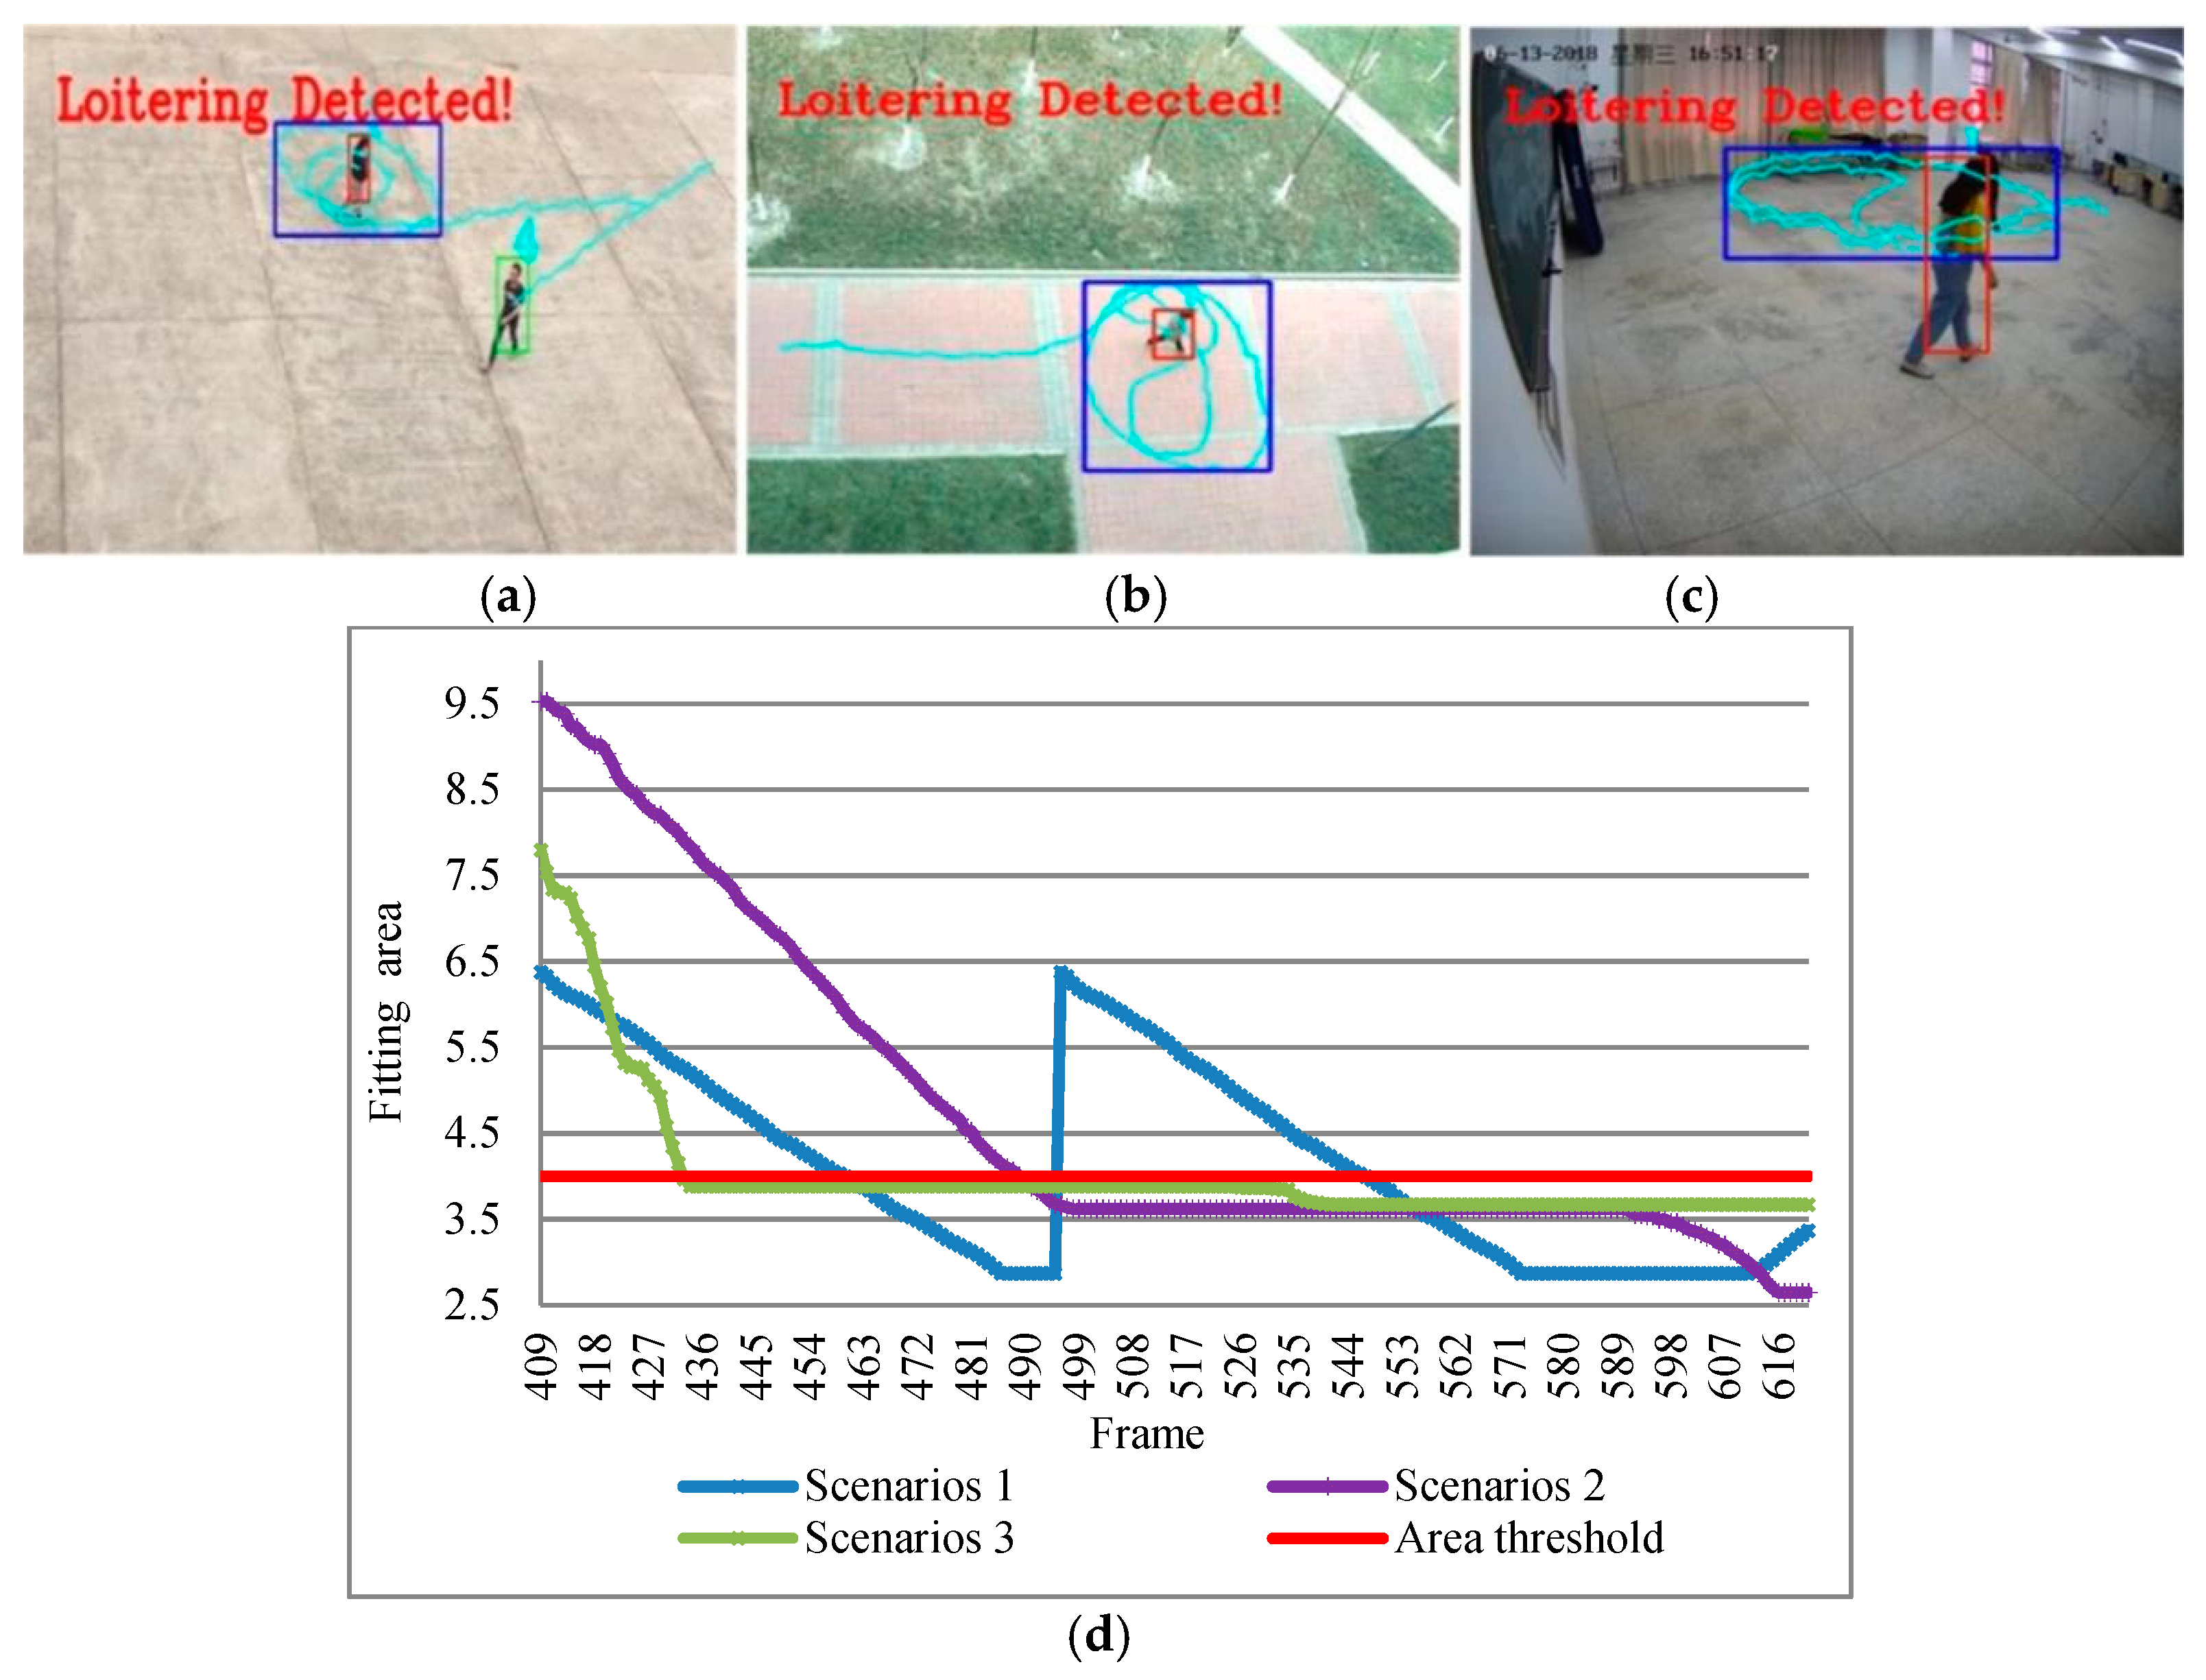
Figure 13 shows the rectangle loitering detection results and corresponding fitting area changed. The horizontal coordinate represents frames of videos, and the vertical coordinate is the size of fitting rectangle area. The curve change corresponds to the change of fitted area. When the area is over the threshold area it will stop alarm, until the pedestrian out of the camera field of views which can reduce misjudgment. We can clearly see that the rectangle loitering detection algorithm was accurate and stable throughout the fitting process.
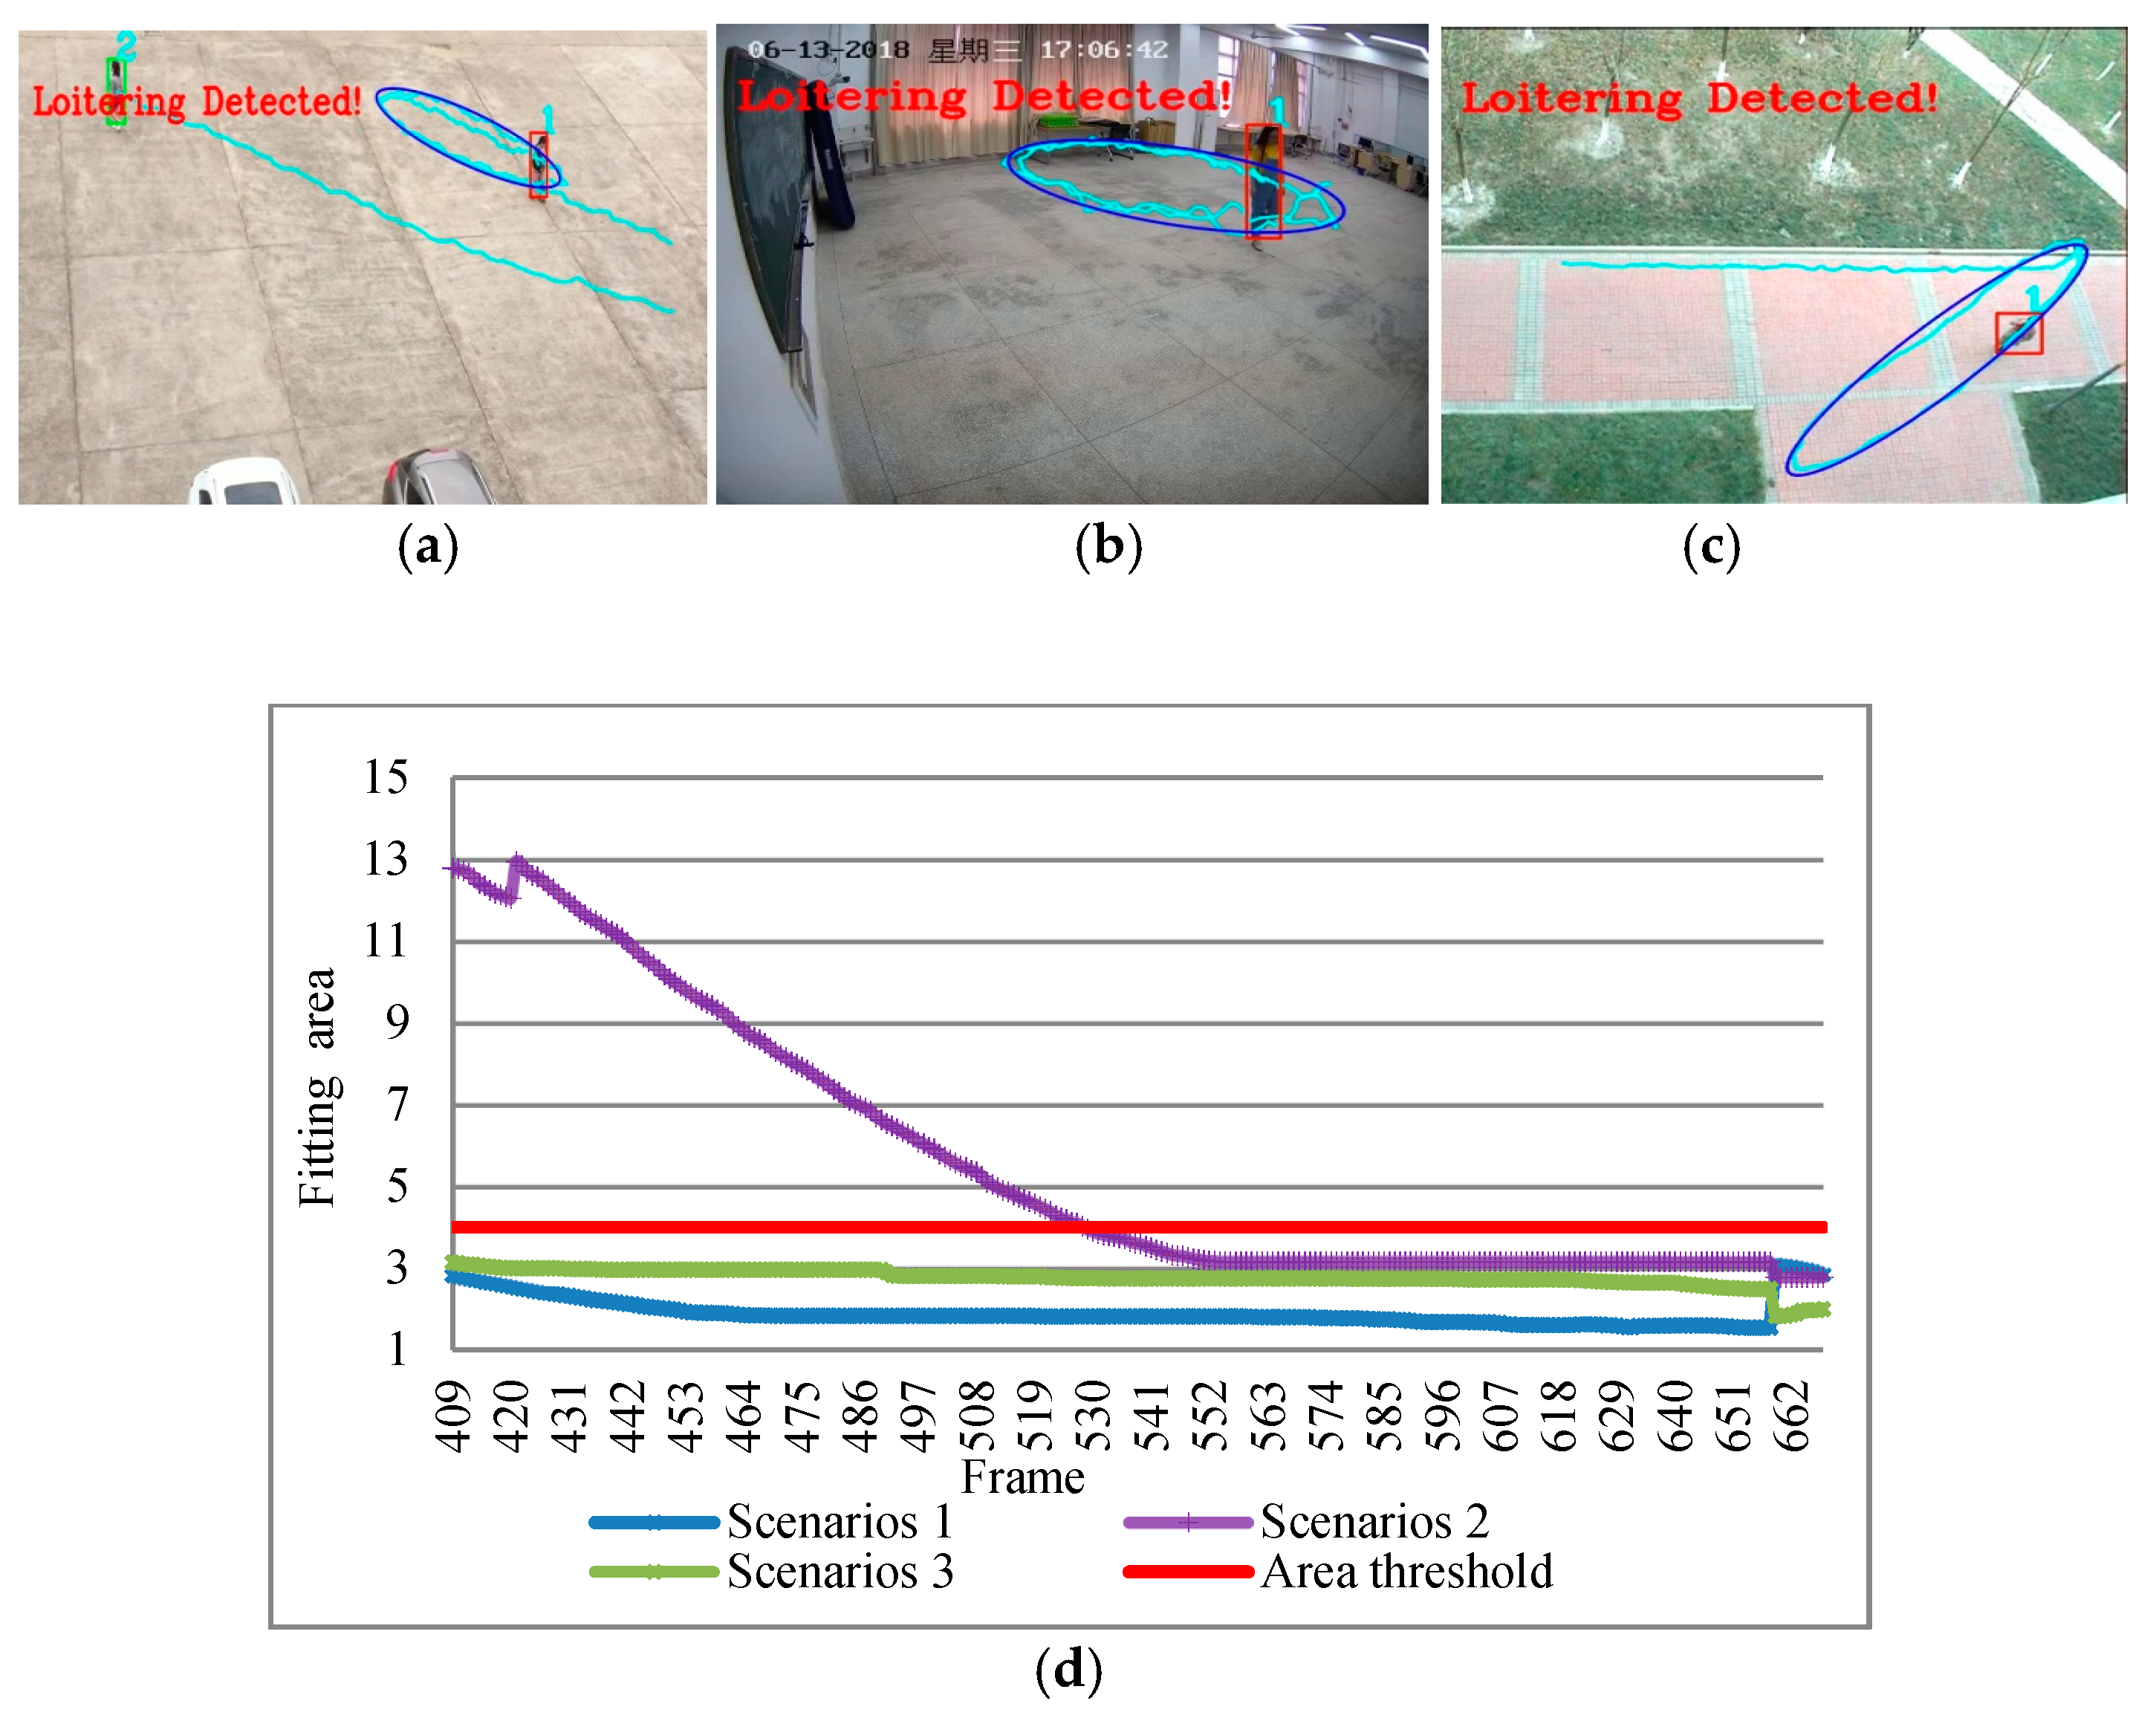
Figure 14 shows the detected result of ellipse loitering in different scenarios and the activity area fitting curve. Once it exceeds the time, it immediately alarms. From the results, the entire fitting process is continuous without interruption, so it has good robustness and real-time performance.
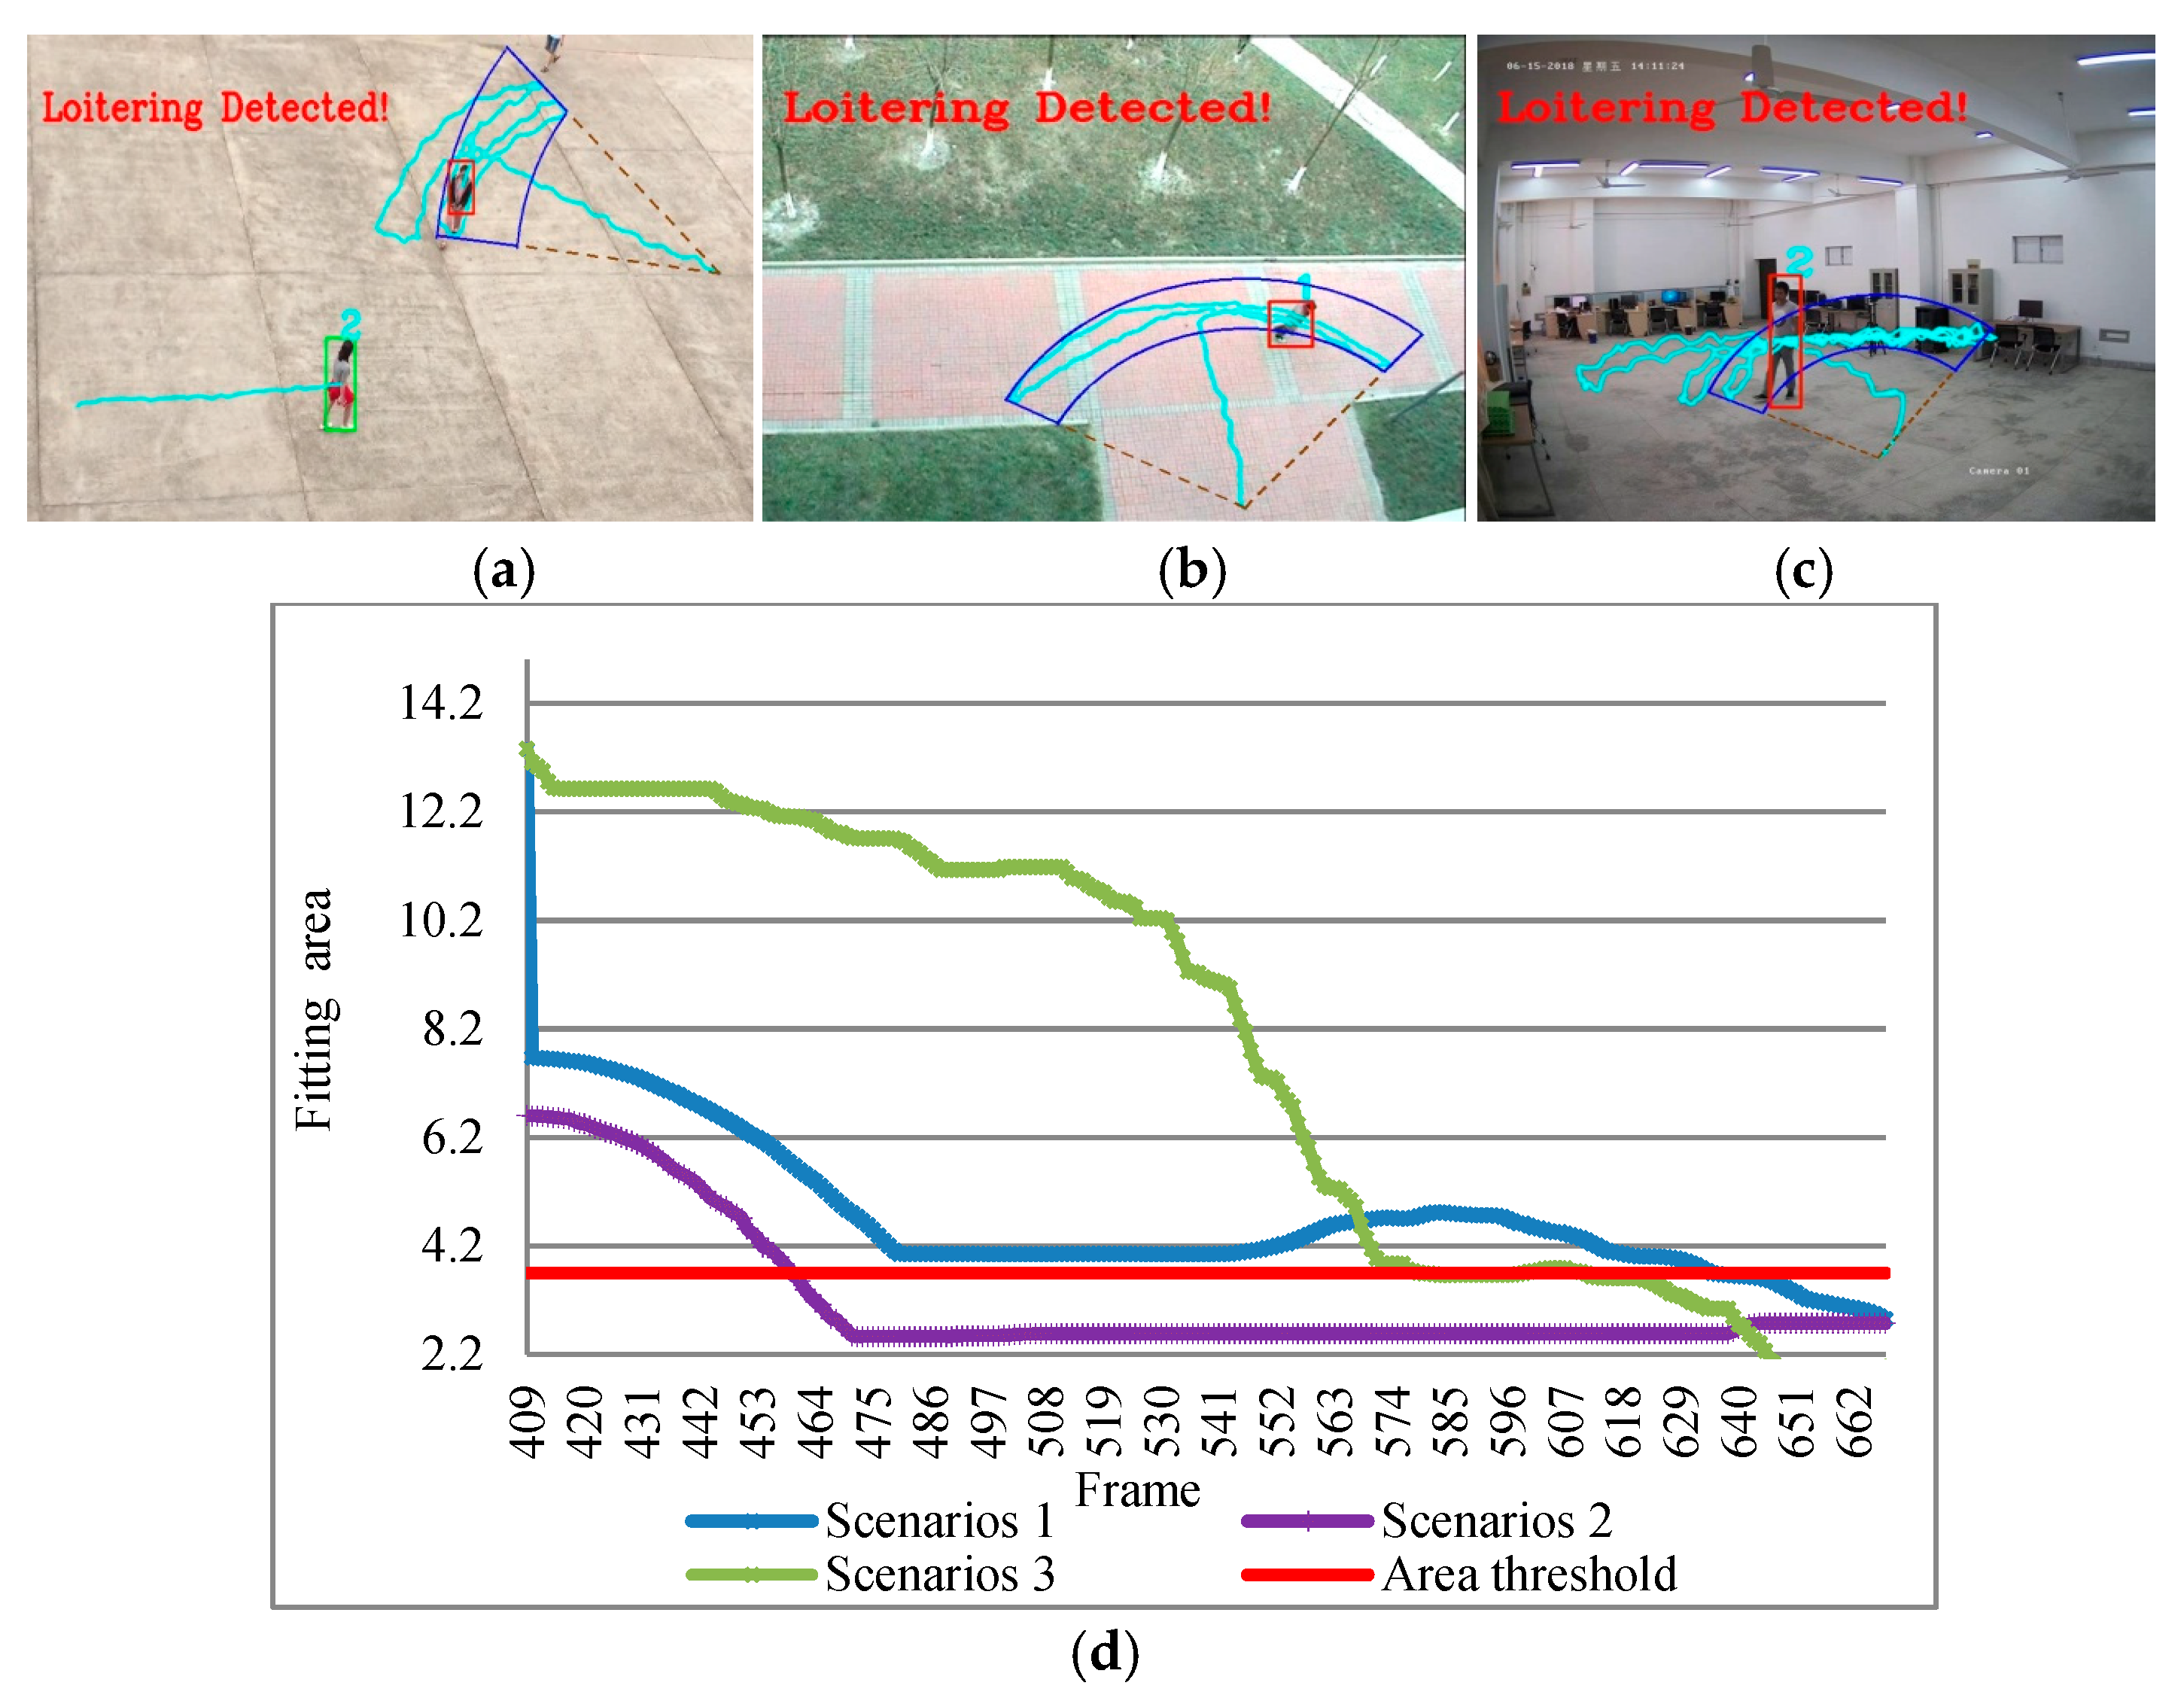
Figure 15 shows the experimental results of the sector loitering detected in three different scenarios and activity area fitting. From these experimental results, it can be seen that the sector loitering detected can perfectly fitted the suspect’s activity area for both indoor and outdoor. The whole process of sector fitting was very smooth and stable.
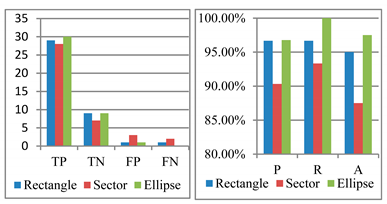
In order to directly demonstrate the superiority of the algorithm presented in this paper,
Table 2 shows the real experimental record and result analysis of this paper. Our collected dataset was accurately classified according to different scenarios. Each scenario has loitering and normal walking. Here, TP (True Positive) means the true loitering can be detected. TN (True Negative) means normal walking can be detected. FP (False Positive) is the normal behavior detected as abnormal. FN (False Negative) is loitering detected as normal. In the
Table 2, P stands for precision (
), R stands for recall rate (
), and A stands for accuracy (
).
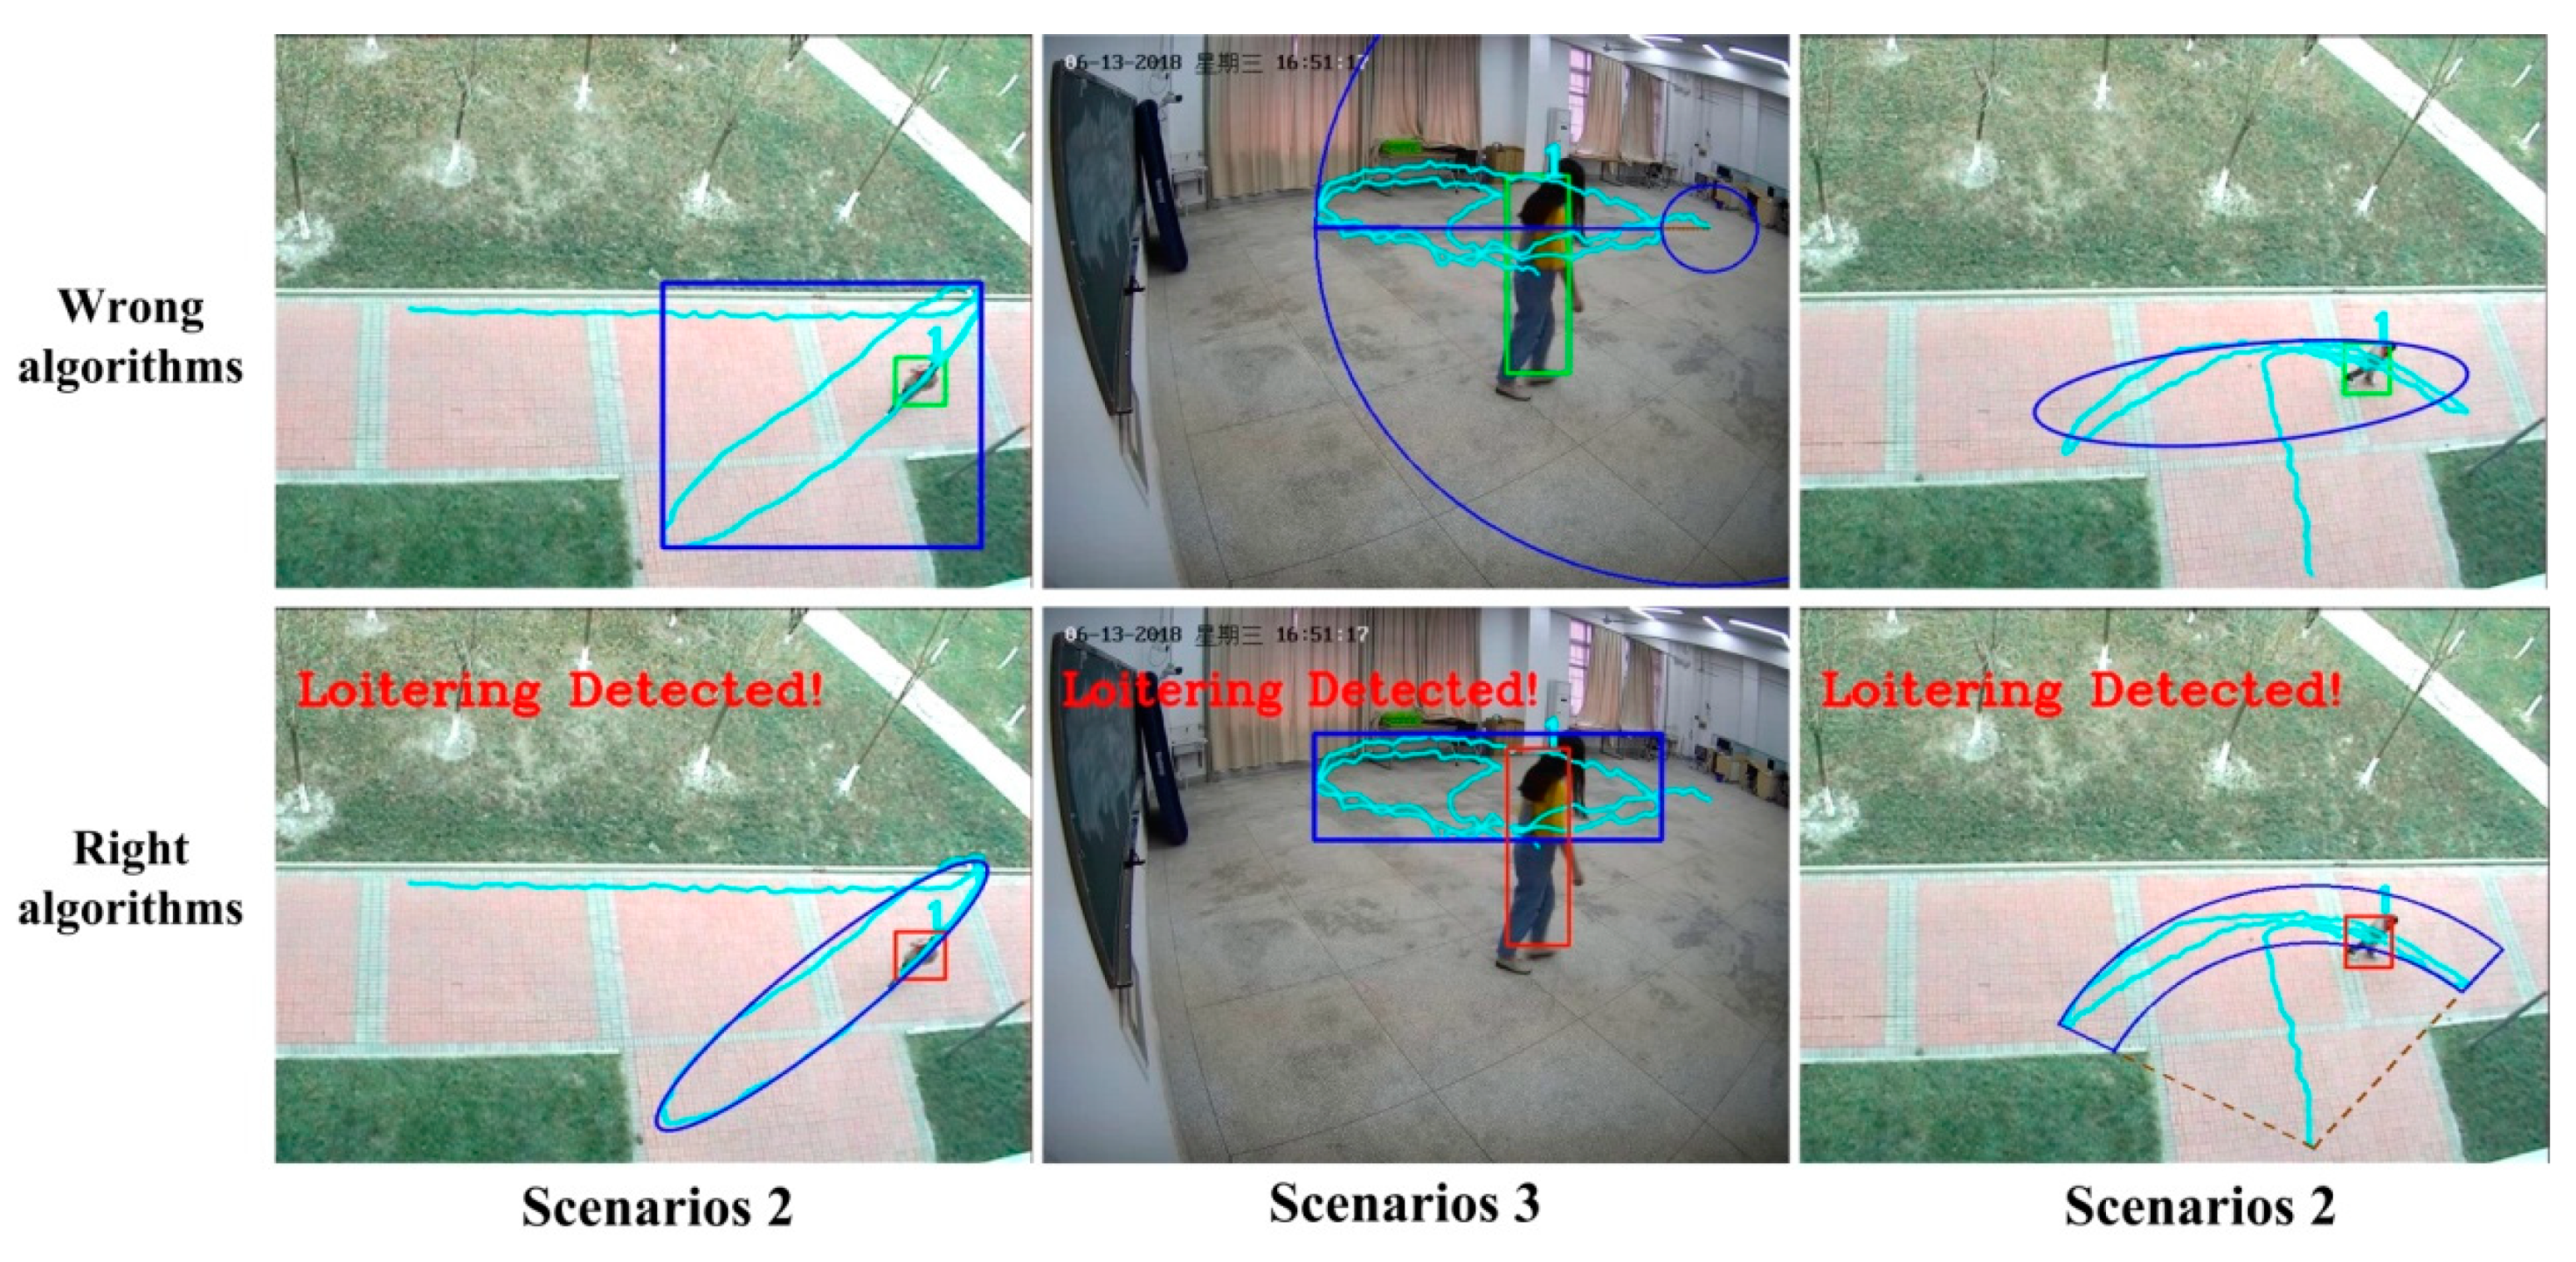
Figure 16 shows the advantages and differences of the three algorithms. From the results, an unsuitable algorithm does not only consumes time but also fails to detect loitering correctly. Therefore, the detection of loitering should be achieved based on scene and motivation to choose the correct algorithm.
Table 3 shows the results of the three algorithms applied to our collected dataset.
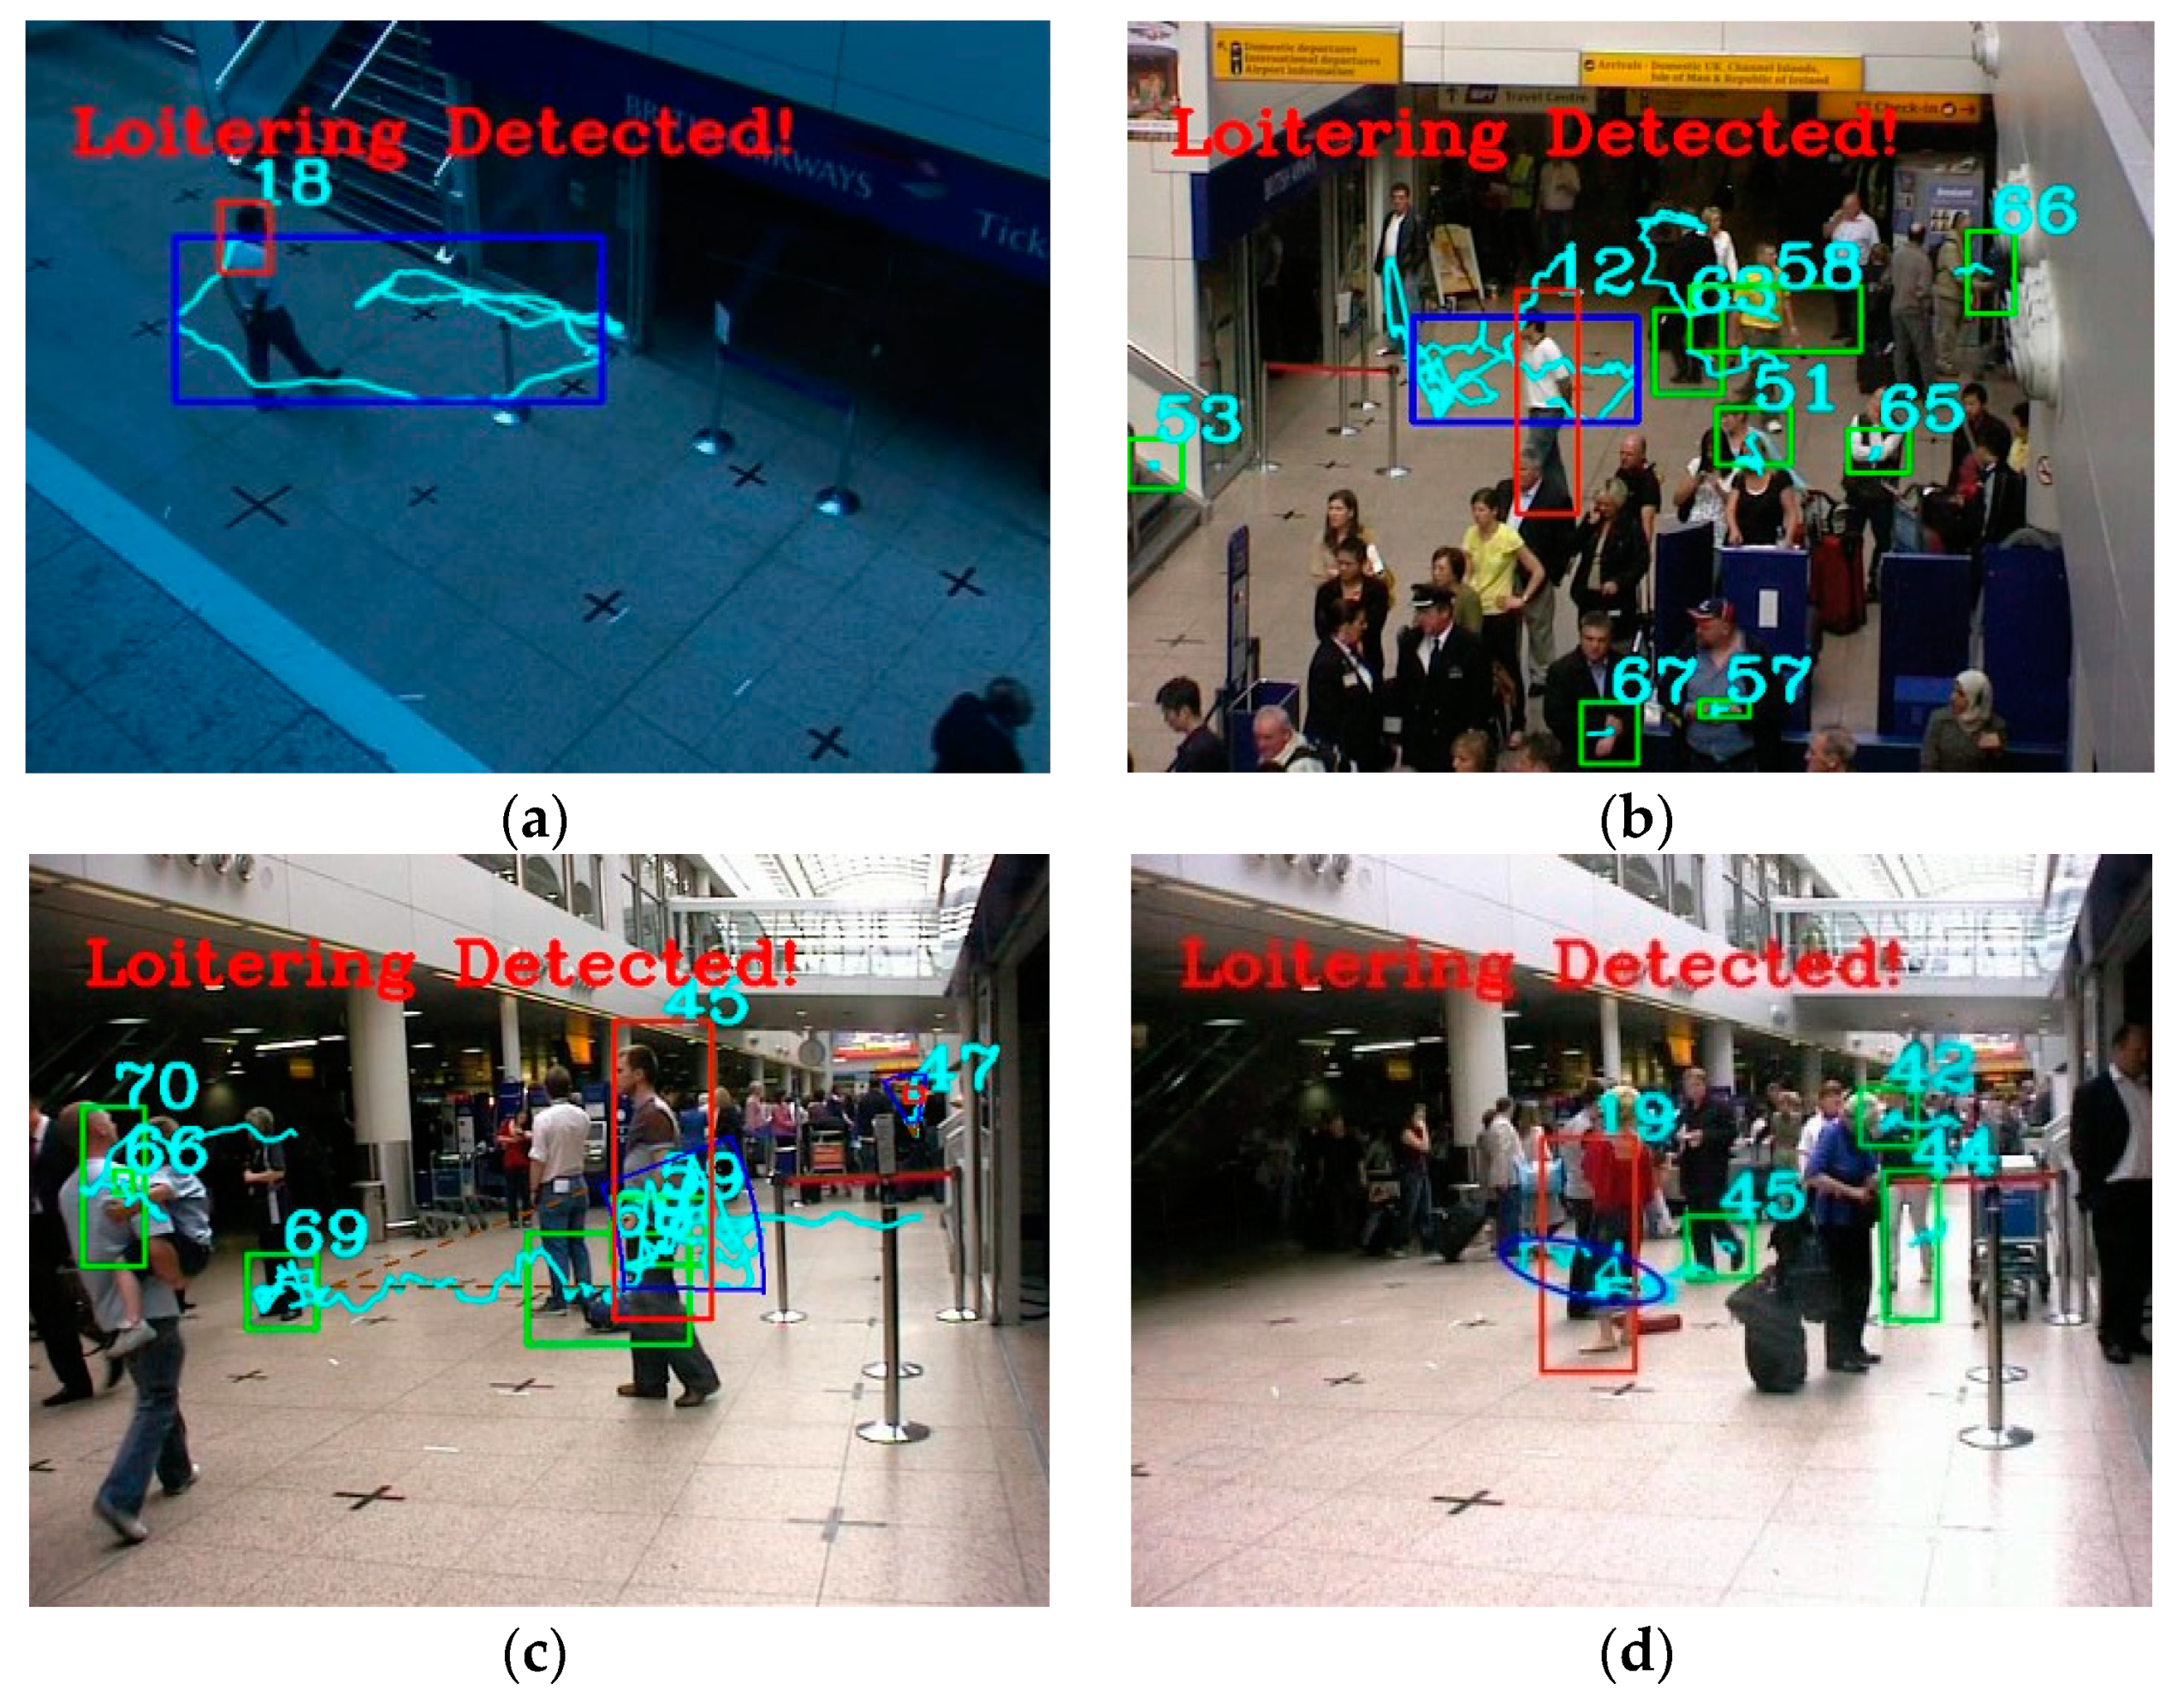
Figure 17 shows the detected results of the PETS2007 dataset (S00, S01, S03, S05, and S08) based on our method. The experimental results show that our proposed algorithms can also be used to detect suspects in crowded scenarios. Our method was compared with the method of Nam 2015 [
54]. Our method can detect loitering in videos from multiple angles, while Nam 2015 only detected loitering in a video from one angle where the number of pedestrians is small. For dataset S00 without containing loitering behavior, our algorithms successfully detected them as normal. It is good to pick a rectangle algorithm to detect suspects in emptiness and high activity areas, learning from the result of dataset S01. Dataset S05 is a video with a thief in public: the suspect loitered around the interest point of the package; we used the sector loitering detection algorithm. The suspicious loitering in a small area in dataset S03, we choose the ellipse loitering algorithm. All the loitering detecting algorithms can effective and accurately detect the suspects.
Table 4 is the loitering detection results using the PETS2007 dataset compared with Dalley’s method [
55]. First of all, our algorithms can accurately detect loitering in the PETS2007 dataset. All our three algorithms performed much better and achieved much higher detection accuracy than the Dalley’s algorithm. Our algorithms successfully detected the loitering which could not be detected by the Dalley’s method, such as those in dataset S05 and S08.
5. Conclusions
In this paper, we first gave a loitering definition from a new perspective using pedestrian activity areas. We propose a loitering detection method based on pedestrian activity areas classification. The pedestrian loitering behaviors are divided into three categories, i.e., the rectangle loitering, the ellipse loitering and the sector loitering. Unlike other loitering detection algorithms judging the loitering only by trajectory angle or time, this paper converts complex trajectory processing into activity area fitting. The loitering is recognized if the pedestrian activity is detected and to be constrained in an area within a certain period of time. From the experimental results, the proposed three algorithms are very effective for detecting various loitering. No matter whether it is indoors or outdoors, it has good accuracy and robustness in loitering detection for both the PETS2007 dataset and our self-collected dataset. The proposed method can detect loitering in videos captured from different angles, and can be applied to crowded scenes also. Compared with the existing methods, the proposed method not only can detect some loitering that the existing methods could not detect, but also is practical to handle complicated situations, efficient, robust, and simplified in implementation. Self-adaptive time threshold setting for loitering detection in different scenarios is worth of further research. We will further research on this in the future.


