Article

Box-Jenkins Transfer Function Modelling for Reliable Determination of VO2 Kinetics in Patients with COPD

by
Joren Buekers
1,2,
Jan Theunis
1,
Alberto Peña Fernández
2,
Emiel F. M. Wouters
3,4,
Martijn A. Spruit
3,4,5,6,
Patrick De Boever
1,7 and
Jean-Marie Aerts
2,*
1
Health unit, Flemish Institute for Technological Research (VITO), 2400 Mol, Belgium
2
Measure, Model & Manage Bioresponses (M3-BIORES), Department of Biosystems, KU Leuven, 3000 Leuven, Belgium
3
Department of Research and Education, Centre of Expertise for Chronic Organ Failure (CIRO), 6085 NM Horn, The Netherlands
4
Department of Respiratory Medicine, Maastricht University Medical Centre, 6229 HX Maastricht, The Netherlands
5
REVAL—Rehabilitation Research Center, BIOMED—Biomedical Research Institute, Faculty of Rehabilitation Sciences, Hasselt University, 3500 Diepenbeek, Belgium
6
NUTRIM School of Nutrition and Translational Research in Metabolism, Maastricht University Medical Centre, 6211 LK Maastricht, The Netherlands
7
Centre for Environmental Sciences, Hasselt University, 3500 Diepenbeek, Belgium
*
Author to whom correspondence should be addressed.
Appl. Sci. 2019, 9(9), 1822; https://doi.org/10.3390/app9091822
Submission received: 4 March 2019 / Revised: 11 April 2019 / Accepted: 29 April 2019 / Published: 1 May 2019
(This article belongs to the Special Issue Human Health Engineering)

Abstract

:
Oxygen uptake (VO2) kinetics provide information about the ability to respond to the increased physical load during a constant work rate test (CWRT). Box-Jenkins transfer function (BJ-TF) models can extract kinetic features from the phase II VO2 response during a CWRT, without being affected by unwanted noise contributions (e.g., phase I contribution or measurement noise). CWRT data of 18 COPD patients were used to compare model fits and kinetic feature values between BJ-TF models and three typically applied exponential modelling methods. Autocorrelation tests and normalised root-mean-squared error values (BJ-TF: 2.8 ± 1.3%; exponential methods A, B and C: 10.5 ± 5.8%, 11.3 ± 5.2% and 12.1 ± 7.0%; p < 0.05) showed that BJ-TF models, in contrast to exponential models, could account for the most important noise contributions. This led to more reliable kinetic feature values compared to methods A and B (e.g., mean response time (MRT), BJ-TF: 74 ± 20 s; methods A-B: 100 ± 56 s–88 ± 52 s; p < 0.05). Only exponential modelling method C provided kinetic feature values comparable to BJ-TF features values (e.g., MRT: 75 ± 20 s). Based on theoretical considerations, we recommend using BJ-TF models, rather than exponential models, for reliable determinations of VO2 kinetics.

1. Introduction

Chronic obstructive pulmonary disease (COPD) is a common lung disease characterised by persistent airflow limitations due to a combination of airway and alveolar abnormalities. COPD is associated with high morbidity and mortality rates, posing a high economical and societal burden [1]. The most important symptom of COPD is dyspnoea during daily activities, but later also at rest. As a result, patients become physically less active, which is the start of a vicious circle of physical deconditioning [2]. Physical capacities can be assessed using standard exercise tests like a cardiopulmonary exercise test (CPET, incremental cycling load) or a constant work rate test (CWRT, constant cycling load) [3]. During a CPET, oxygen uptake (VO2, ml.min−1) increases linearly until the maximal or peak VO2 value is reached. This maximal (or peak) VO2 value, the maximal load reached during CPET and the endurance time during CWRT are the most frequently used metrics for evaluating physical capacities. However, there is additional information, besides these maximal values, that can be extracted from the breath-by-breath VO2 time series that are generated during these tests.
During a CWRT, there is typically a 3-phase VO2 response towards the step increase of cycling load (W). During phase I, the cardiodynamic phase, VO2 shows an instant response driven by an increased cardiac output and pulmonary blood flow (Figure 1). In phase II, the primary component of the response, VO2 increases exponentially, similar to the working muscle oxygen uptake. In phase III, VO2 can reach a steady-state or can steadily keep increasing, i.e., VO2 slow component (Figure 1), depending on the exercise intensity [4]. Kinetic analyses of the VO2 response aim to quantify the speed and amplitude of the primary (phase II) response using a combination of features. Time delay (TD), time constant (TC) and mean response time (MRT = TD + TC) assess the speed of the response. Response amplitude (Amp) and steady state gain (SSG = Amp.ΔW−1) assess the magnitude of the response, with ΔW indicating the step increase of cycling load at the start of the exercise test (Figure 1). These features quantify the ability to respond to the increased physical load during a CWRT [4]. Generally, COPD patients exhibit a slower VO2 response than healthy subjects [5,6], but supplemental oxygen [7], medication use [8,9] and exercise training [10], can speed up the VO2 response to the step increase in cycling load.
Typically, exponential models are used to extract these kinetic features from the VO2 time series. Three mono-exponential modelling methods have been described in COPD literature, which will be referred to as method A [6,8], B [10,11] and C [9,12]. Method A assumes there is no delay in the VO2 response (TD = 0 s), whereas methods B and C estimate a TD value as one of the model parameters. Method B uses data starting from t = 0 s (load onset), while method C aims to exclude the contribution of the cardiodynamic phase by only using data starting from t = 20 s. Nevertheless, these exponential models are all still influenced by other unwanted noise contributions, such as measurement noise or cardiac output dynamics that are not related to the increased working muscle oxygen uptake.
In contrast to the generally applied exponential models, Box-Jenkins transfer function (BJ-TF) models can extract the same kinetic features [13] without being affected by these unwanted noise contributions. BJ-TF models are able to separate the unwanted contributions from the noise-free primary VO2 response (i.e., phase II). Therefore, extraction of the kinetic features will not be influenced by the unwanted contribution of these additional components, and will only reflect the working muscle oxygen uptake. To the authors’ knowledge, BJ-TF models have not yet been used to extract kinetic features from CWRT data. Therefore, the aim of this study was to compare model fits and kinetic feature values between BJ-TF models and the three different exponential modelling methods that were identified in COPD literature.

2. Materials and Methods

2.1. Study Design and Participants

Twenty COPD patients (GOLD II-IV) were recruited at CIRO (Horn, the Netherlands) during a standard baseline assessment prior to pulmonary rehabilitation [14]. Two patients were excluded from analyses because they failed to perform a CWRT during the baseline assessment. Demographics, partial pressure of oxygen and carbon dioxide, post-bronchodilator pulmonary function data (e.g., forced expiratory volume in 1 second, forced vital capacity and transfer factor for carbon monoxide) and modified Medical Research Council dyspnoea scores were collected during the standard baseline assessment at CIRO. The study was approved by the Medical Research Ethics Committees United (NL58079.100.16, MEC-U, the Netherlands) and all patients provided written informed consent.

2.2. Exercise Testing

Patients performed a CPET during the first day and a CWRT during the second day of the baseline assessment. The tests were performed on an electrically braked cycle ergometer and VO2 data were collected breath-by-breath (Oxycon Pro, Carefusion, Houten, the Netherlands). Both tests started with 3 minutes of rest, followed by 3 minutes of unloaded cycling (W = 0). During CPET, the load then increased 1 Watt per 4, 6 or 12 seconds, depending on the relative fitness of the patient. During CWRT, the load remained constant at 75% of the maximal load obtained during the CPET. In both tests, patients were asked to keep their cycling speed constant between 60 and 70 rotations per minute and to cycle until limitation (exhaustion and/or severe dyspnoea). The tests ended with a 3-minute recovery period. CWRT time series data were used for the analyses described below.

2.3. Data Pre-Processing

Deviating breath values, identified as data samples deviating more than 3 standard deviations from the local mean (i.e., 31 s centred moving average), were deleted. An integrated random walk smoothing algorithm (CAPTAIN toolbox [15]) was used to converse the non-equidistant breath-by-breath VO2 data into a smoothed 1 Hz time series, while still preserving the dynamics of the time series. Data after 180 s of loaded cycling were discarded to exclude any potential contribution of the VO2 slow component.

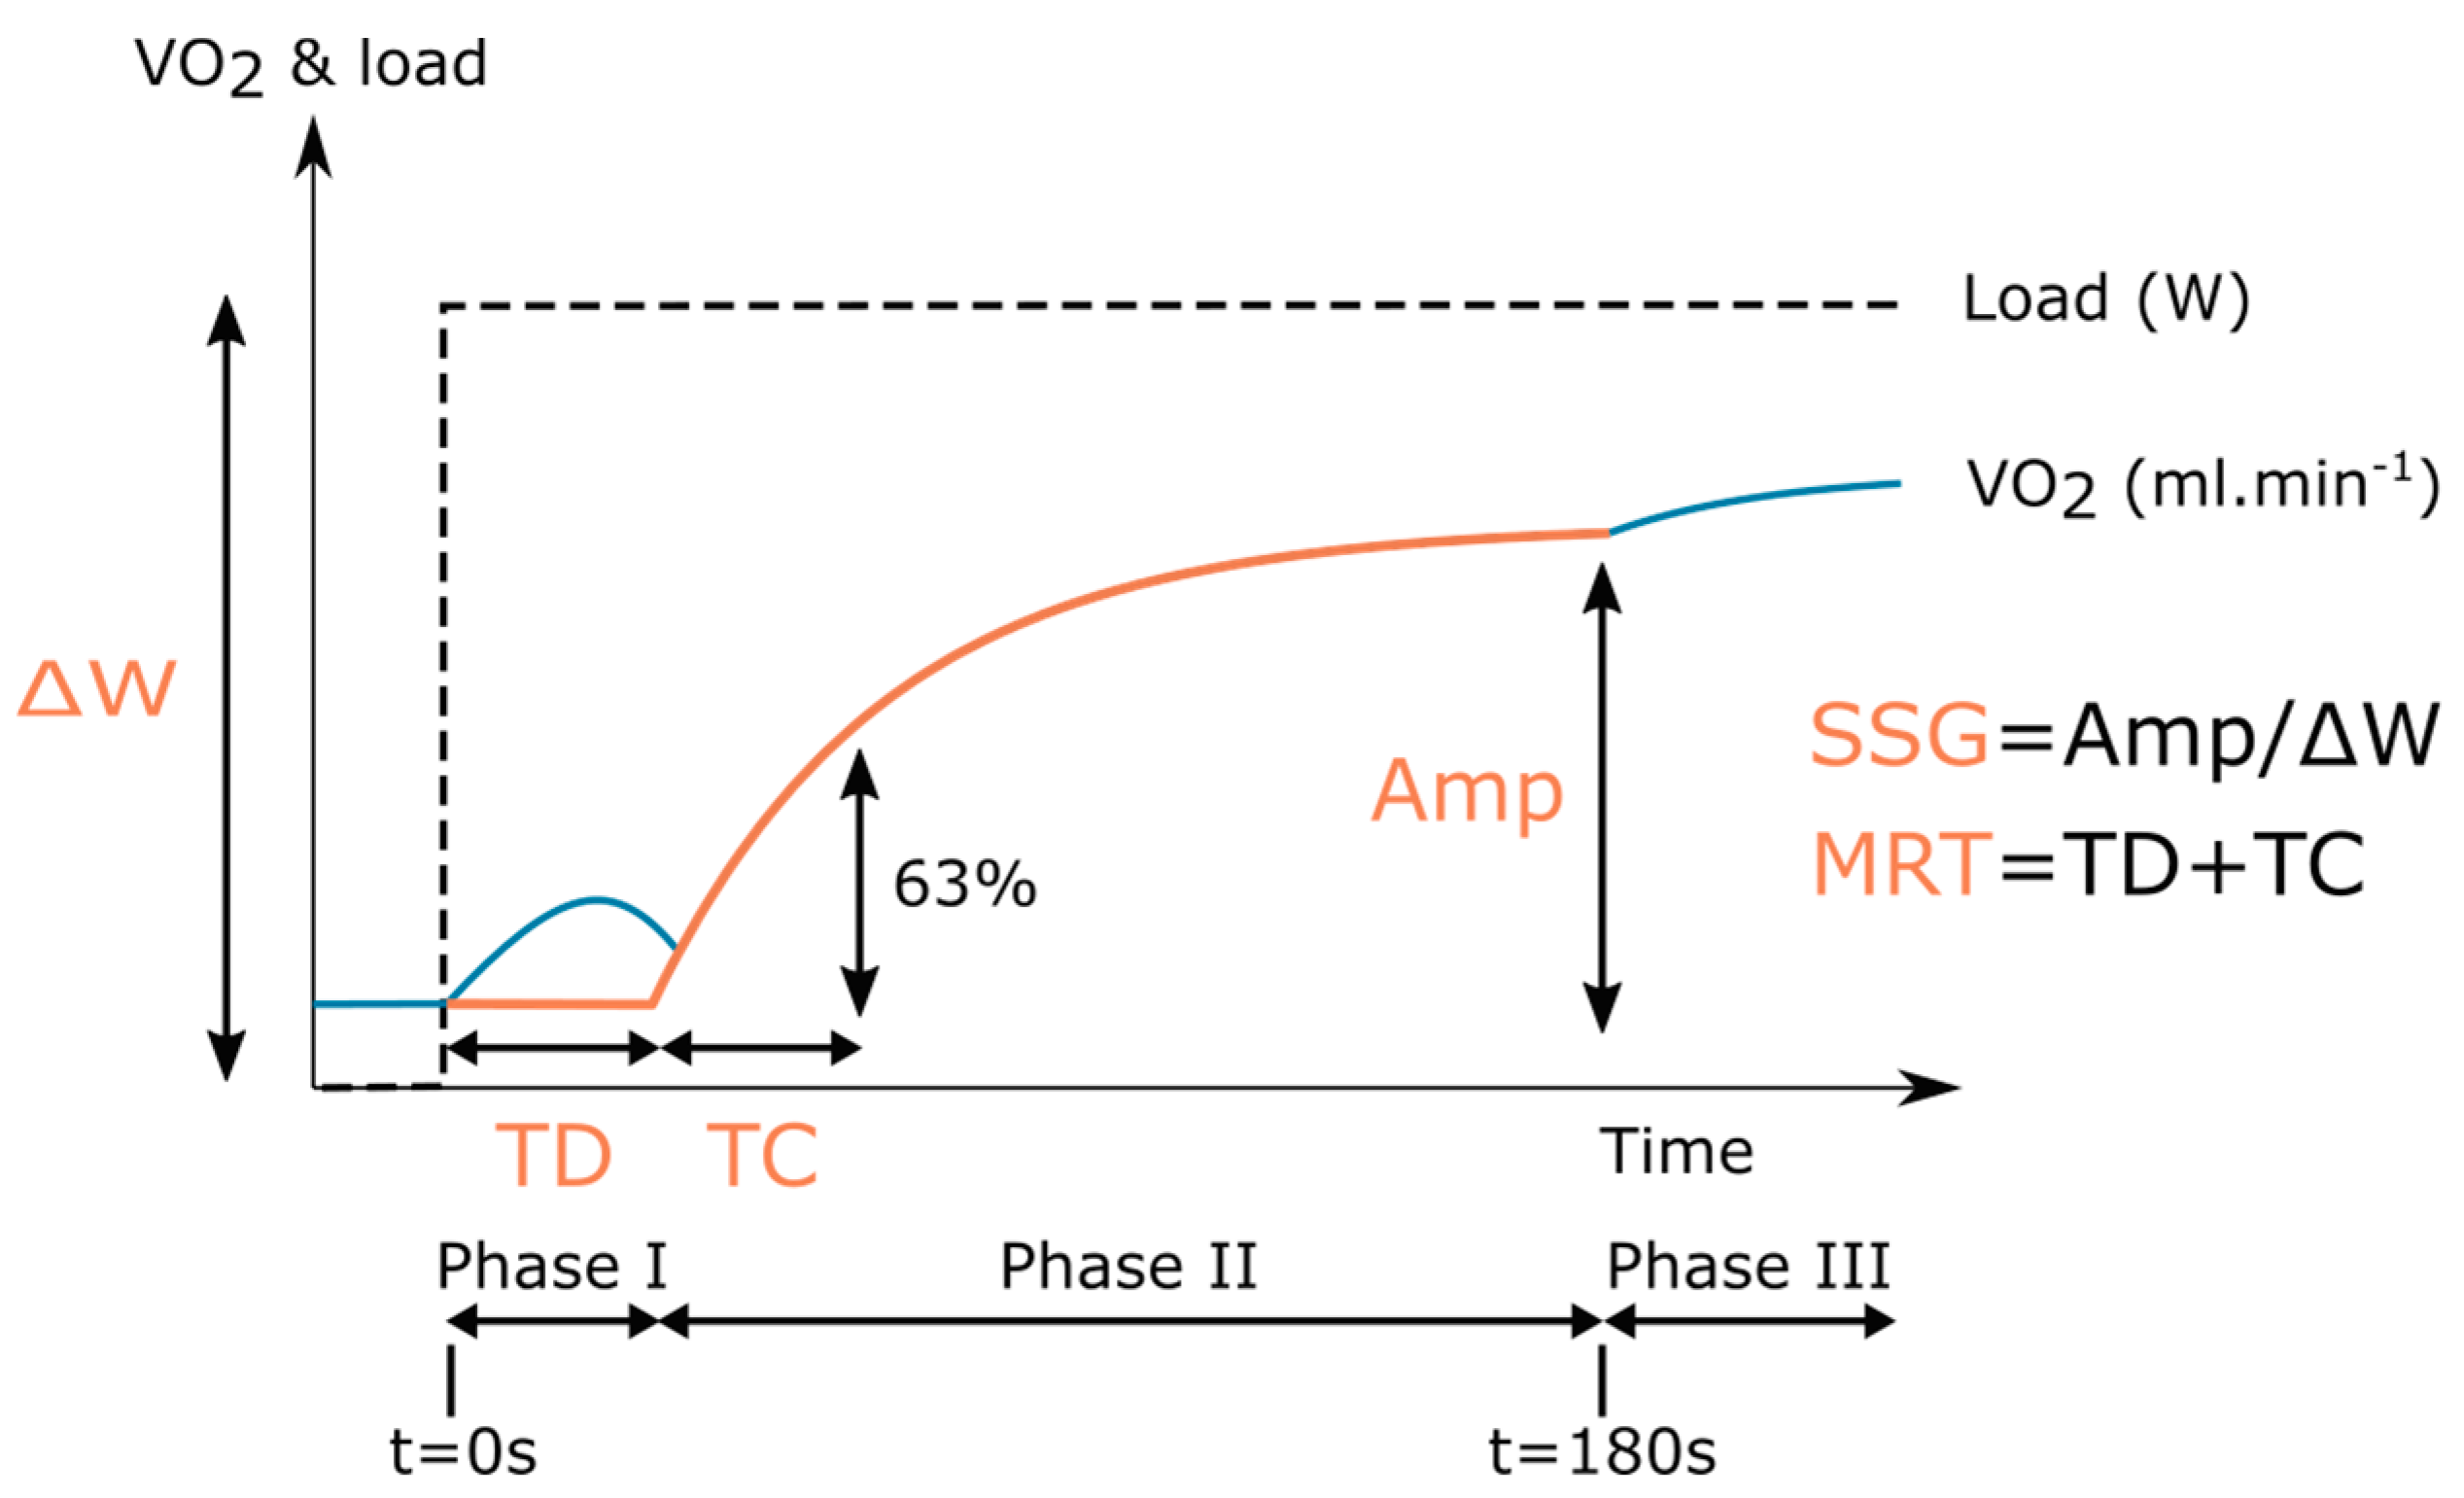
2.4. Kinetic Analyses

The dynamic response of physiological variables towards an increase in physical load can be described by a number of features (Figure 1). These features were extracted using both exponential models and BJ-TF models. The following first order model was used as a basis for exponential modelling:
0 t T D : Δ V O 2 ( t ) = 0 , T D < t 180 : Δ V O 2 ( t ) = A m p · ( 1 e ( t T D T C ) ) ,
where ΔVO2(t) is the difference between the pre-processed VO2 time series and the baseline VO2 level (VO2,baseline), i.e., ΔVO2(t) = VO2(t) − VO2,baseline. VO2,baseline is calculated as the mean VO2 value of the last 30 s of unloaded cycling. The model parameters (Amp, TD and TC) were estimated using non-linear least squares (Matlab 2015b, MathWorks Inc., Natick, Massachusetts, USA). Three mono-exponential modelling methods have been described in COPD literature. They will be referred to as method A [6,8], B [10,11] and C [9,12]. Method A assumes there is no TD in the VO2 response (TD = 0 s). Method B estimates the three model parameters using data from t = 0 s (load onset) until t = 180 s, whereas method C only uses data between t = 20 s and t = 180 s to exclude the contribution of the cardiodynamic phase (phase I).
Time evolutions and autocorrelation tests of the model residuals were checked to assess whether the model residuals retained any meaningful structure. Remaining structure in the model residuals indicates that the residuals contain information that is not captured by the model. The relative amplitude of these residuals was assessed by the normalised root-mean-squared error (NRMSE), defined as the root-mean-squared error divided by the amplitude of the VO2 response:
N R M S E = t = 1 n r e s i d u a l s ( t ) 2 n · A m p 1 .
A discrete-time, single-input, single-output BJ-TF model with time-invariant parameters can generally be written as follows:
y ( t ) = B ( z 1 ) A ( z 1 ) u ( t T D ) + C ( z 1 ) D ( z 1 ) e ( t ) ,
where y(t) is the model output at time t, u(t) is the model input at time t, z−1 is the backwards shift operator (i.e. z−s y(t) = y(t−s)), e(t) is zero mean white noise and A(z−1), B(z−1), C(z−1) and D(z−1) are polynomials containing the model parameters:
A ( z 1 ) = 1 + a 1 z 1 + + a m z m , B ( z 1 ) = b 0 + b 1 z 1 + + b n z n , C ( z 1 ) = 1 + c 1 z 1 + + c p z p , D ( z 1 ) = 1 + d 1 z 1 + + d q z q .
Thus, the full BJ-TF model (3) is a combination of a ‘noise-free’ system model (first term) and a noise model (second term). As phase II is known to follow a first-order exponential response, the system model was defined as a first order model with one gain parameter. This transformed the full model (3) as follows:
Δ V O 2 ( t ) = b 0 1 + a 1 z 1 W ( t T D ) + C ( z 1 ) D ( z 1 ) e ( t ) ,
where the input variable W(t) was defined as:
t 0 : W = 0   W a t t , t > 0 : W = 75 %   o f   t h e   m a x i m a l   l o a d   r e a c h e d   d u r i n g   C P E T .
The order of the noise model, given by the order of polynomial D(z−1), was unknown and was therefore identified by comparing the performances of models with noise models up to order three in C(z−1) and/or D(z−1). Full model fits were inspected visually and the residuals were checked using autocorrelation tests and NRMSE values. In addition, the full models with different noise structures were compared by their Young Identification Criterion (YIC) value [16]. YIC combines goodness of fit and reliability of the parameter estimations, while penalising for over-parameterisation. A more negative YIC value indicates a better model performance. The noise model structure will be referred to as [p q], where p and q are the orders of polynomials D(z−1) and Z(z−1), respectively.
The parameters of the full model were estimated using the refined instrumental variable approach of the CAPTAIN toolbox in Matlab [16,17]. From the system model parameters a1 and b0, TC and SSG were calculated as follows:
T C = Δ t log ( a 1 ) ,
S S G = b 0 1 + a 1 .
where Δt is the sampling time (= 1 s). MRT was calculated as the sum of TD and TC, Amp was calculated by multiplying SSG with the load increase (ΔW).

2.5. Statistical Analysis

Patient characteristics were summarised for all patients as mean and standard deviation (SD). NRMSE and kinetic feature values were summarised as median and interquartile range (IQR). Wilcoxon signed-rank tests were used to look for differences in NRMSE and kinetic feature values as calculated with the different exponential modelling methods and BJ-TF modelling. A p-value lower than 0.05 was considered to provide statistical significance. All analyses were performed using Matlab 2015b (MathWorks Inc., Natick, Massachusetts, USA).

3. Results

Eighteen patients (14 male and four female) performed a CWRT. Table 1 summarises the clinical characteristics of the participants. On average, the elderly patients had a moderate-to-severe degree of airflow limitation, an impaired diffusing capacity and a slightly overweight body mass index. None of the patients were on long-term oxygen therapy. A median of 1.5 (± 2) deviating breath values were deleted per patient.

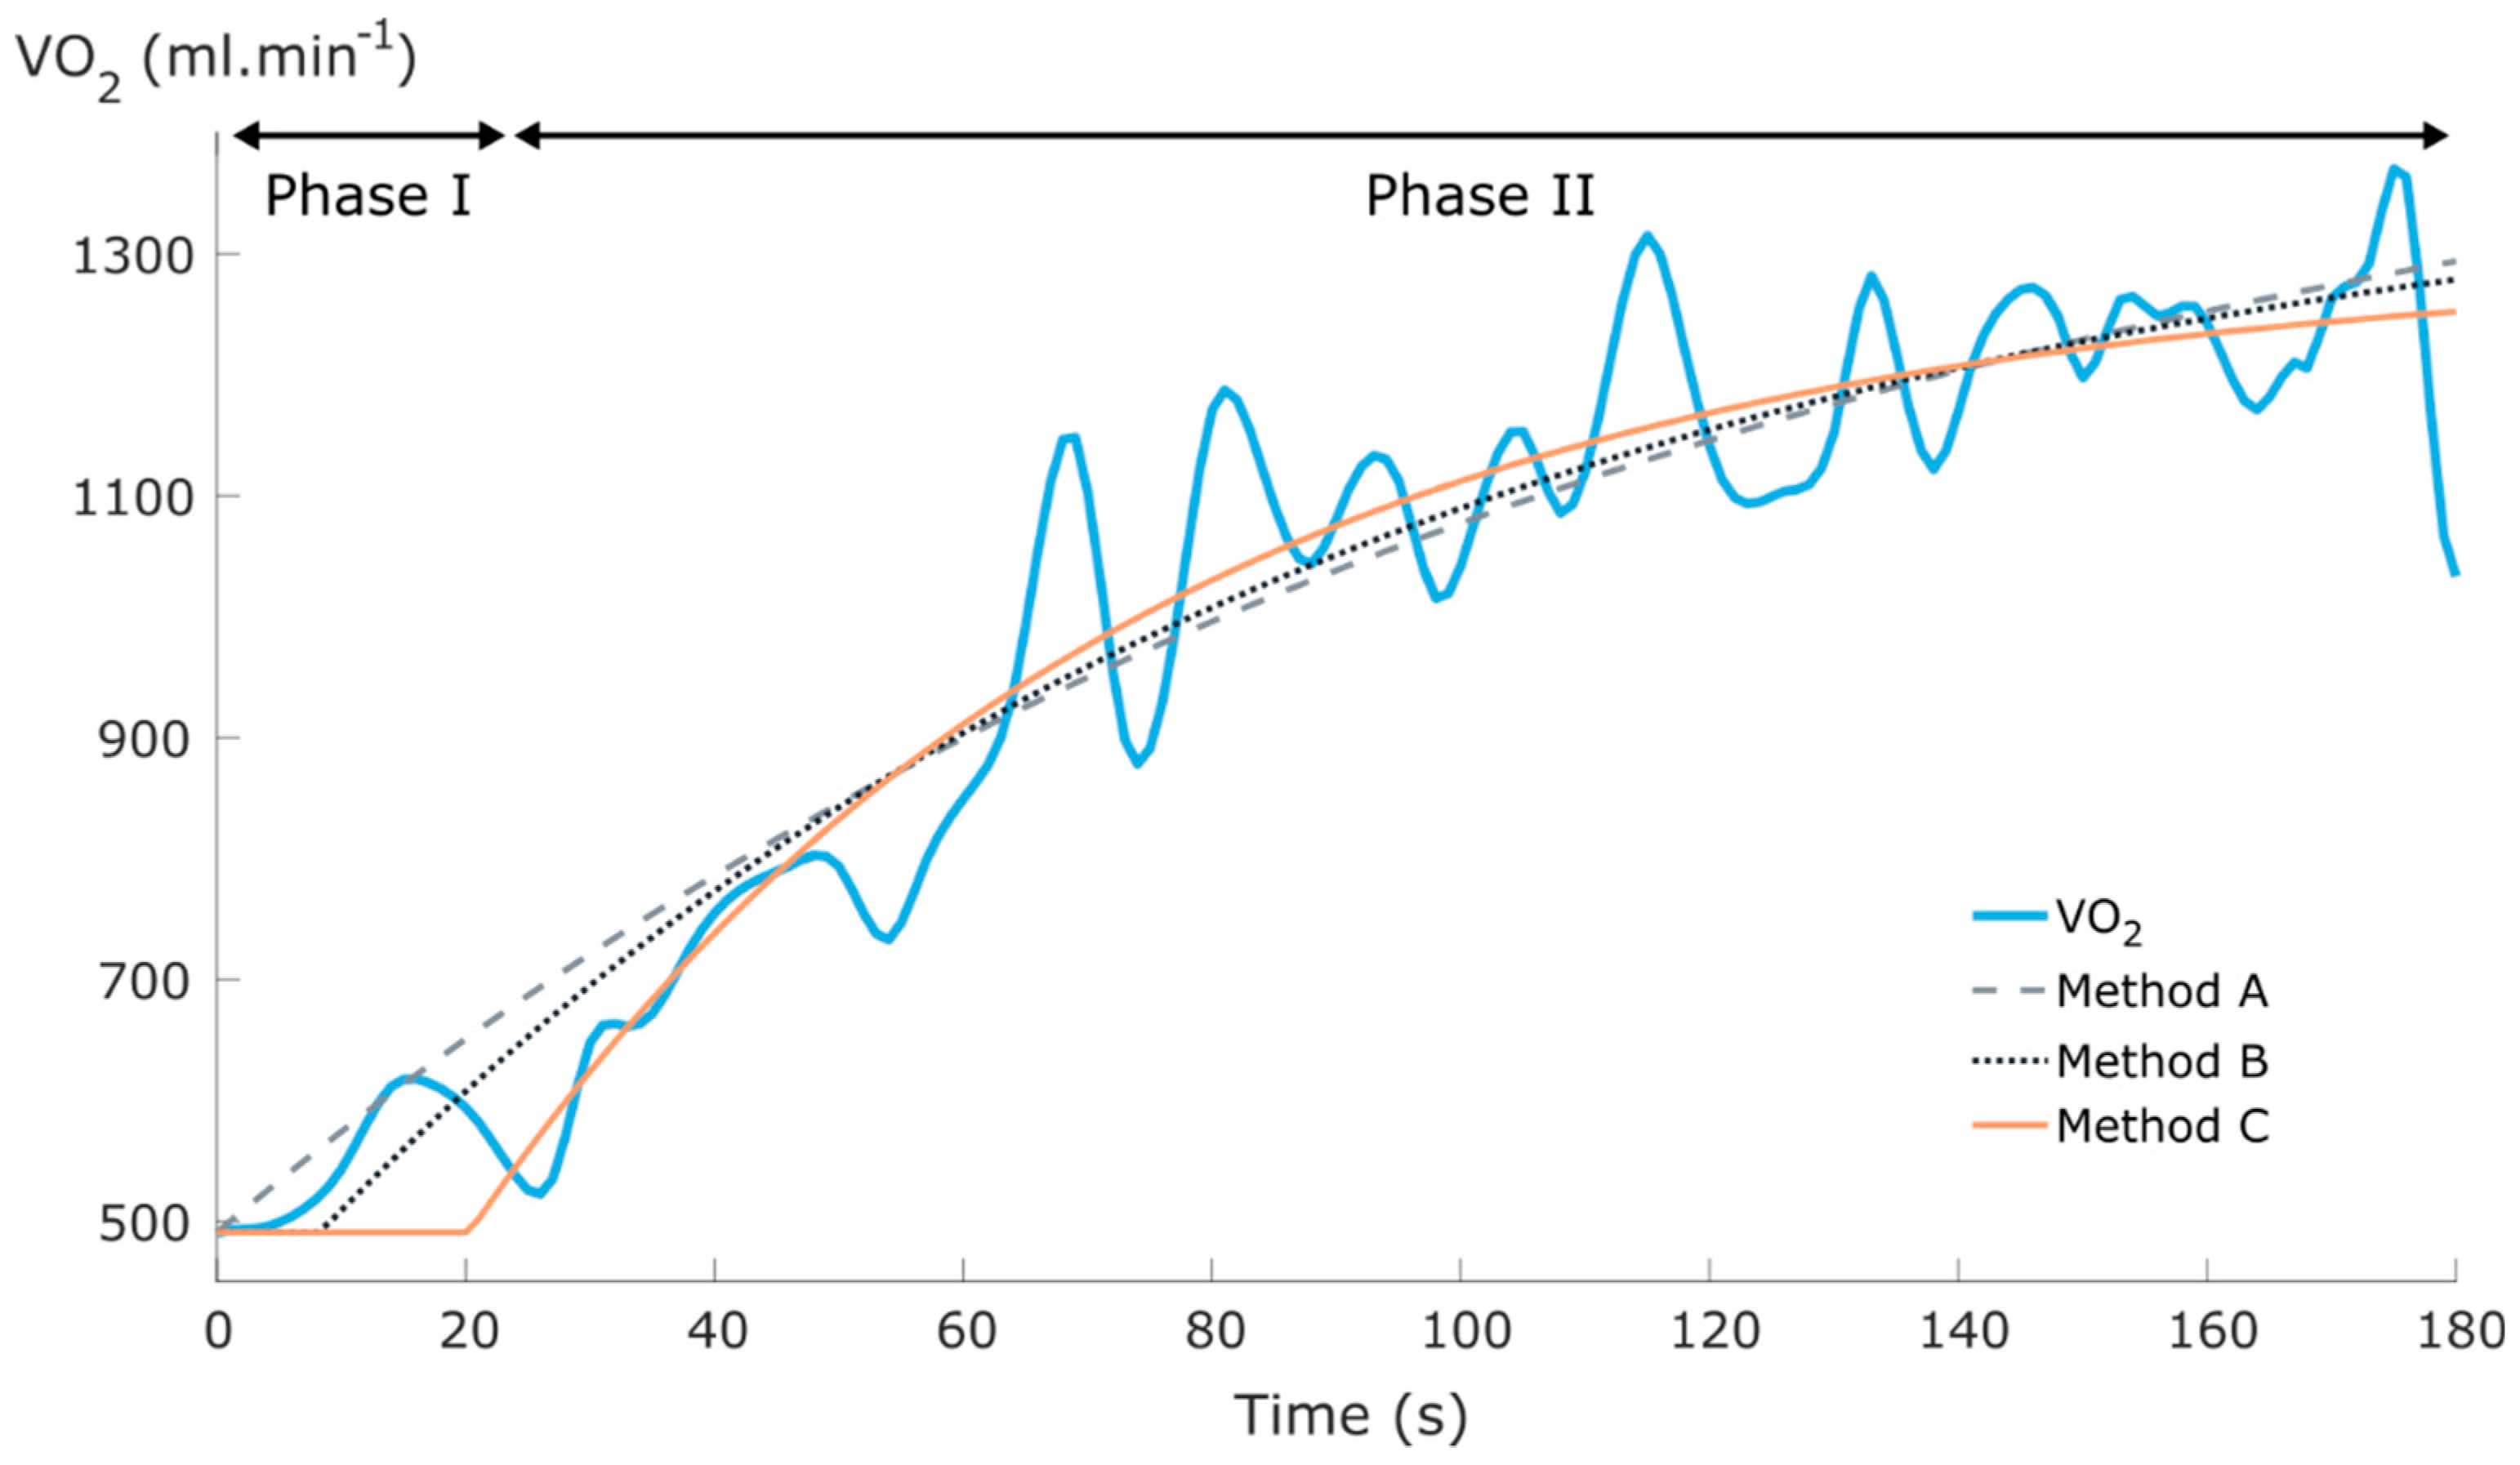
3.1. Exponential Modelling

Figure 2 shows an example of the three exponential modelling methods fitted to data of the same patient. NRMSE values differed between the three methods (method A: 10.5 ± 5.8; method B: 11.3 ± 5.2; method C: 12.1 ± 7.0; p < 0.05 for all pairwise comparisons). As shown in Figure 2, method C is the only method that can completely surpass the cardiodynamic phase.
The exponential model residuals contained remaining structure, as can be seen by plotting the relative residual values in function of time and the autocorrelation coefficients from lag 1 to 10 (example shown in Figure 3a). The same behaviour was obtained for all patients for all three methods.

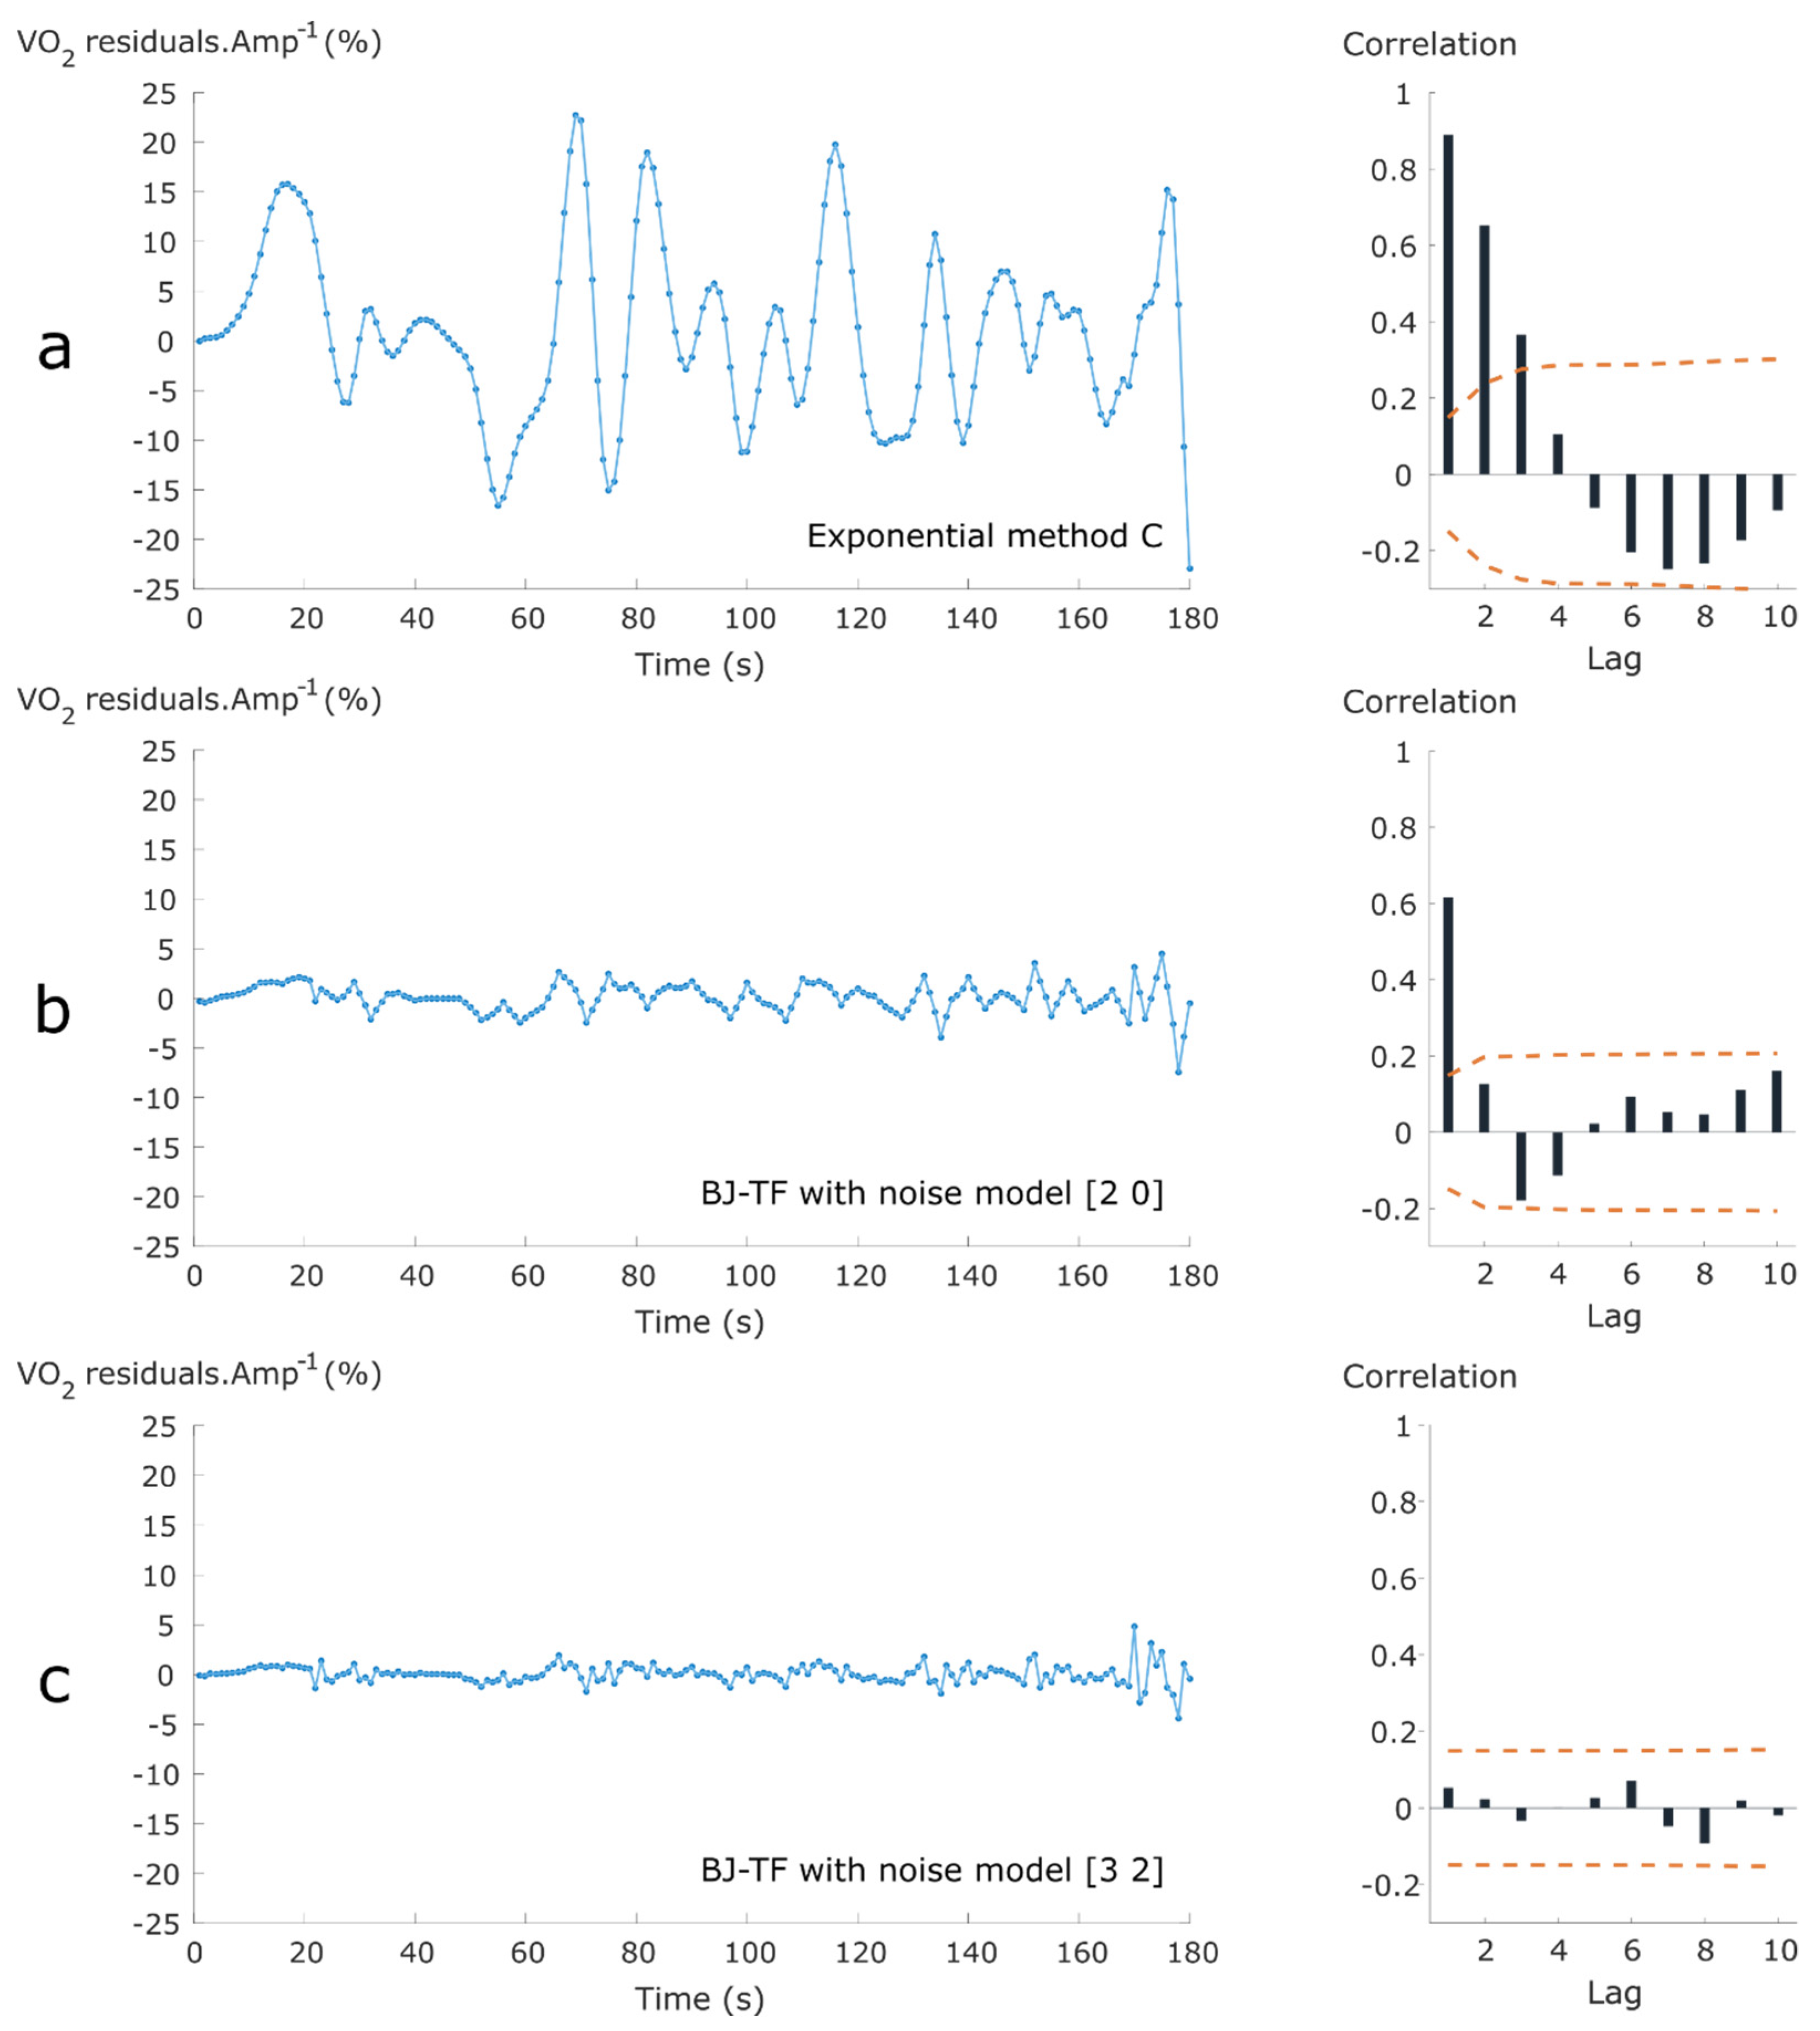
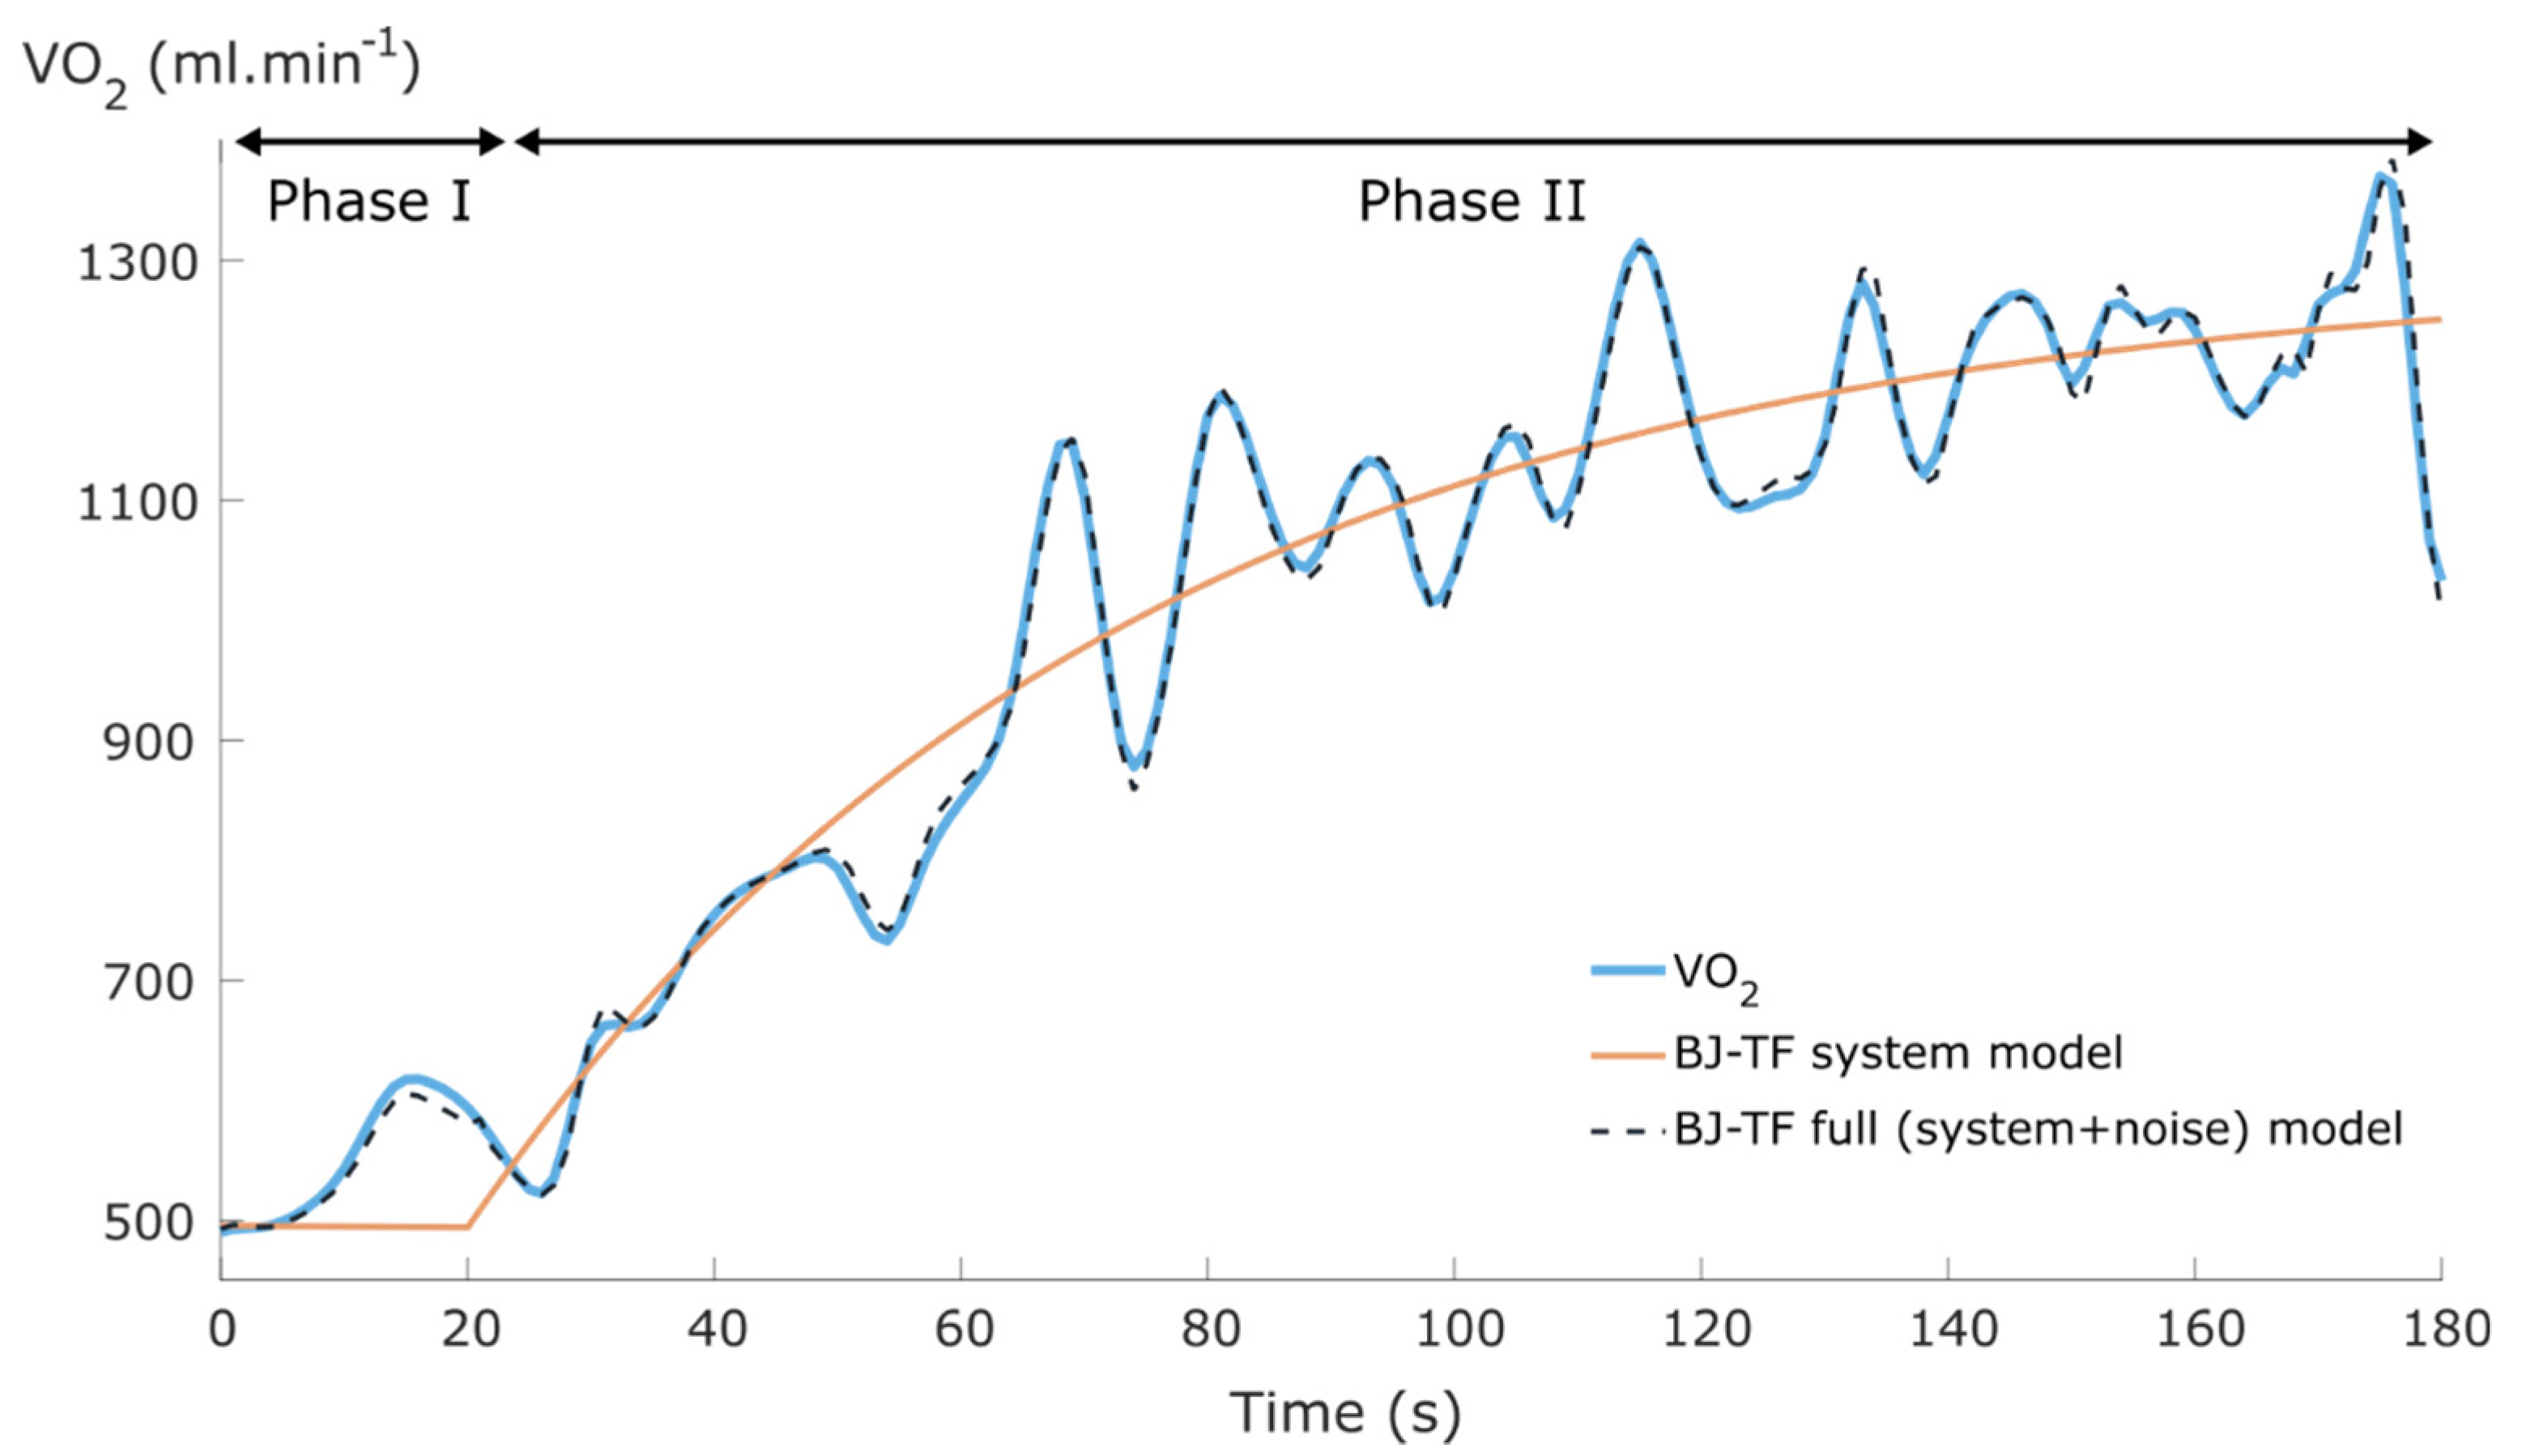
3.2. Box-Jenkins Transfer Function Modelling

Based on the full model fits, YIC values and NRMSE values (see below and Discussion), a first order system model with a [2 0] noise model order was selected and used for comparing kinetic feature values between exponential and BJ-TF models in the next section. An example of applying this BJ-TF model is shown in Figure 4.
BJ-TF models with first order noise models (i.e., first order in D(z−1)) resulted in visually inappropriate model fits. Noise models of order [1 0] and [1 1] led to the full model (i.e., system + noise model) lagging behind the measured VO2 data. This lag was solved in the noise models of order [1 2] and [1 3]. However, for both these noise model structures the full model fits were completely off for some patients. Similarly, noise model orders [2 3] and [3 3] led to bad fits for some patients. YIC and NRMSE values of the remaining noise model orders are summarised in Table 2. Second order noise models had more negative (i.e., better) YIC values, but slightly higher residual values compared to third order models. Example residual and autocorrelation plots for [2 0] and [3 2] noise models are shown in Figure 3b,c, respectively. These noise model orders were chosen as examples because they had the lowest YIC value of all second and third order noise models, respectively. All second order noise models exhibited similar residual and autocorrelation plots, whereas some third order noise models still had a significant autocorrelation coefficient at lag 1, opposite to the example in Figure 3c.

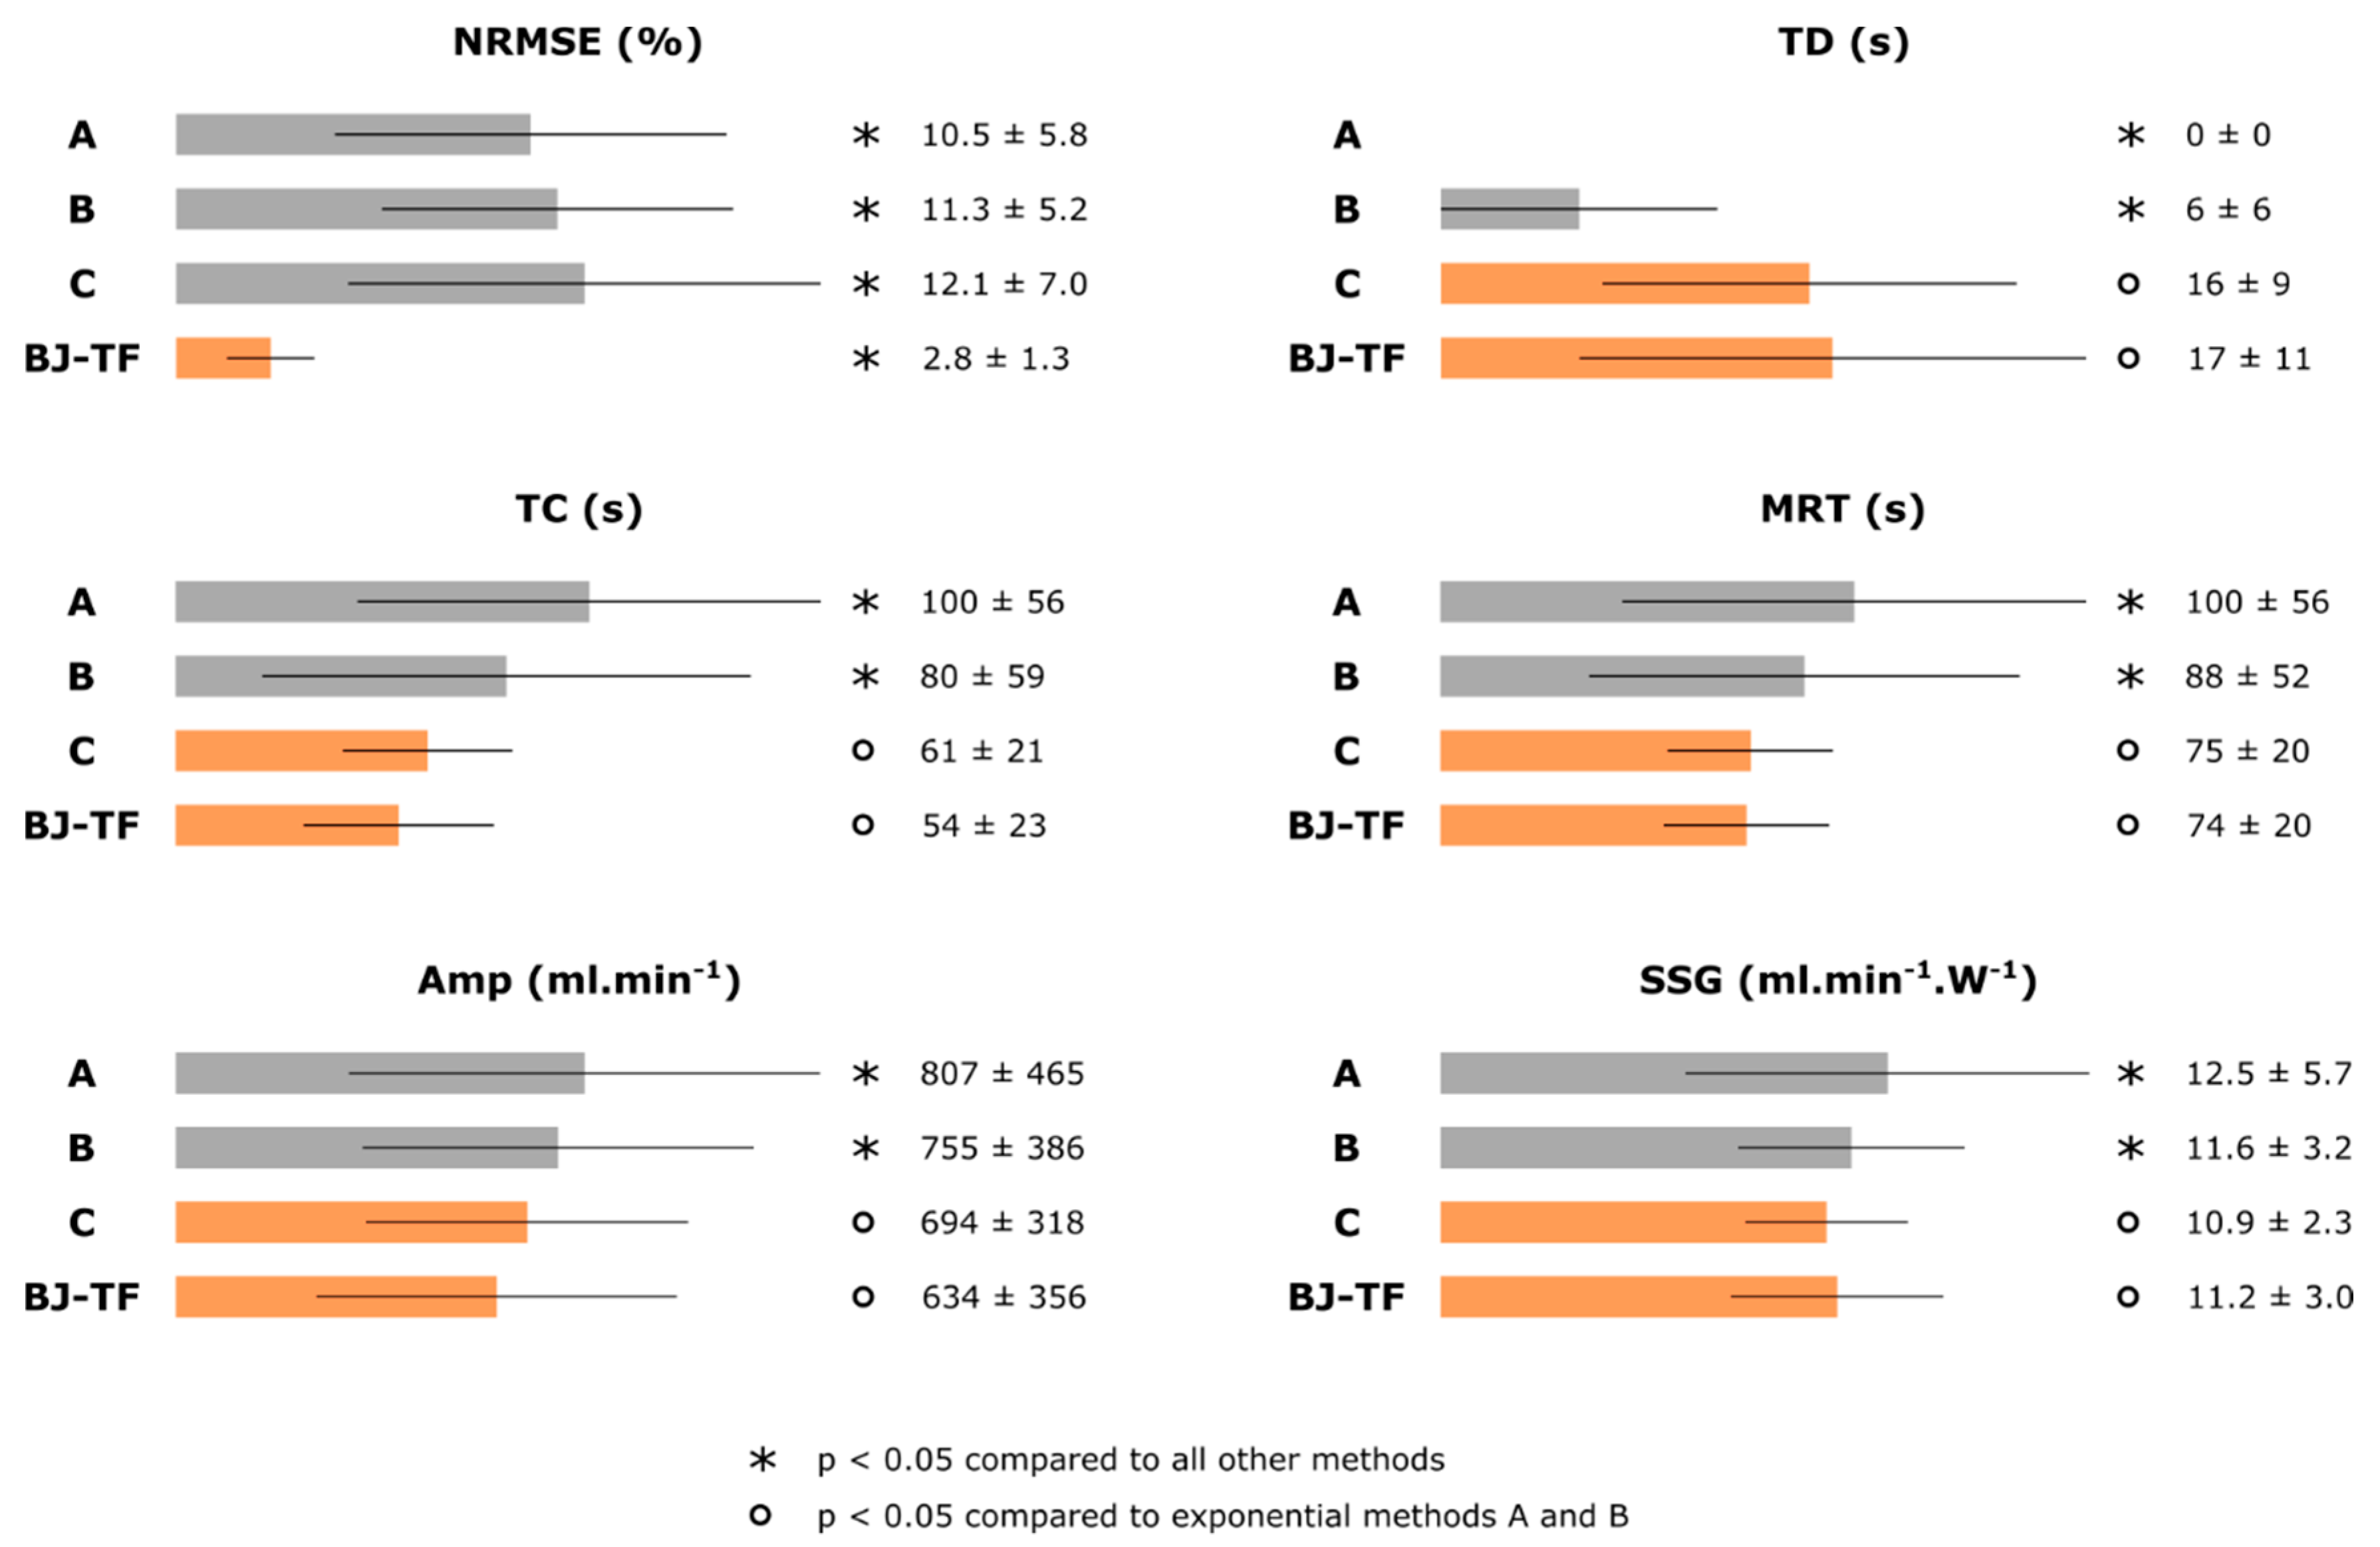
3.3. Kinetic Features

Figure 5 provides an overview of the VO2 kinetic feature values as calculated with the different exponential (methods A, B and C) and full BJ-TF models. Methods A and B resulted in a smaller TD and a higher TC, MRT, Amp and SSG compared to method C and the BJ-TF full model (Figure 5). On a group level, method C and BJ-TF did not show significant differences between the kinetic feature values of the included patients (Figure 5). On an individual level, the median (± IQR) of the absolute differences between the feature values as calculated with method C and BJ-TF were 4 ± 13 s, 11 ± 17 s, 7 ± 8 s, 27 ± 43 ml·min−1 and 0.5 ± 0.7 ml·min−1·W−1 for TD, TC, MRT, Amp and SSG, respectively. These absolute differences were respectively 24%, 20%, 9%, 4% and 4% of the respective median feature values as extracted from BJ-TF models. MRT values varied less than TC values between the different methods (Figure 5).
Two patients had extremely large kinetic feature values in all applied models (e.g., TC > 200 s and/or SSG > 20 ml·min−1·W−1). One of these patients cycled at a very low load during CWRT (22 W), the other patient showed a VO2 response that increased almost linearly. When applying method A, one additional patient had extremely large kinetic feature values.

4. Discussion

This is the first study to apply BJ-TF models to determine VO2 kinetics during a CWRT. BJ-TF models provided better fits than the typically applied exponential models and were able to account for unwanted contributions (e.g., phase I contribution or measurement noise). When applying exponential models, method C succeeded best at surpassing the phase I contribution and most closely resembled the “noise-free” system model of BJ-TF models.
Exponential models are most commonly used to examine VO2 kinetics [4]. However, none of the applied exponential modelling methods were able to account for the noise components in the VO2 time series, as could be seen in the VO2 time series, residual and autocorrelation plots (Figure 2 and Figure 3). NRMSE values showed that the residuals acted on a magnitude of 10–12% of the total response amplitude, indicating that these noise components should not be neglected. Methods B and C had higher NRMSE values because they tried to surpass the contribution of the cardiodynamic phase (phase I), leading to higher residual values at the start of the test when the cardiodynamic phase plays an important role (Figure 2 and Figure 3). However, method A is mechanistically unrealistic, as it does not assume any transit delays between muscle oxygen uptake and oxygen uptake at the mouth [19]. Only method C was able to fully discard the phase I contribution by removing the first 20 s of data. The ability to (partly) surpass the cardiodynamic phase was mainly reflected in the TD values, which in turn greatly affected all other feature values (Figure 5). This shows that for COPD patients, similar to healthy subjects [19,20], the applied exponential modelling method had a significant effect on the kinetic feature values.
Another strategy to exclude the phase I contribution might be applying a second-order exponential model, which aims to separately model the phase I and phase II contributions [4,20]. However, a second-order exponential model is based on the unproven assumption that the phase I response is exponential of nature [20]. Furthermore, the phase I contribution was not the only unwanted noise component in the data, as can be seen in Figure 3a. These other noise contributions acted at a similar level as phase I, making it difficult to distinguish phase I from other noise contributions (Figure 3a). The relatively small phase I contributions, compared to the other noise contributions, might be a result of the patients suffering from COPD [5] or because the test was preceded by unloaded cycling [19]. Averaging the VO2 response of several repetitions of the same exercise can cancel out the noise contributions that are not related to the phase I contribution [21,22], but this requires unnecessarily strenuous exercise sessions. Therefore, BJ-TF models were preferred because of their ability to account for all unwanted components at once.
A [2 0] noise model structure was considered the most suitable for BJ-TF modelling. When considering all second order noise models, NRMSE values were all at the same magnitude, and a [2 0] structure had the best YIC values. This indicates that increasing the order of C(z−1) above zero induced unnecessary complexity. Some structure remained in the residuals when applying a second order noise model, but at a very low magnitude (Figure 3b and Table 2). When increasing the noise model dynamics to order three, this low-magnitude structure in the residuals disappeared in most patients (Figure 3c) and NRMSE values became slightly lower, but were still at a similar magnitude as second order models (Table 2). The improvements of increasing the noise model order were thus minimal compared to the cost of the increased complexity (i.e., more difficult to interpret, greater risk of overfitting and more computationally expensive), resulting in higher YIC values for third order noise models (Table 2). A [2 0] noise model showed the best balance between model fit and model complexity.
BJ-TF models provided better fits than the exponential modelling methods. Whereas exponential models only provided an estimate of the general trend of the VO2 response (Figure 2), BJ-TF models were able to account for the unwanted noise contributions around the general trend (Figure 5), without having to average VO2 responses over several repetitions [21,22]. These noise contributions are especially important for COPD patients, as the reduced VO2 responses, due to the lower workloads that are feasible for COPD patients [3], increase the relative magnitude of the noise contributions (i.e., lower signal to noise ratio). Residual and autocorrelation plots confirmed that the noise models accounted for the most important noise contributions (Figure 3), and the remaining residuals were four times smaller than residuals from exponential models (Figure 5). Whereas exponential modelling models A and B failed to provide satisfying estimates of TD, BJ-TF models with a [2 0] noise model always provided satisfactory results without having to manipulate the data manually (cf. method C).
The ability of BJ-TF models to separate the phase II contribution from other unwanted noise contributions ensured that these noise contributions could not influence the extracted kinetic feature values, which is a key advantage compared to exponential modelling. The influence of the unwanted contributions, mostly phase I, led to lower TD and higher TC, MRT, Amp and SSG values when applying methods A and B. Only method C produced similar feature values as BJ-TF models on a group level, pointing out that this method should be preferred over methods A and B when exponential models are applied on CWRT data from COPD patients. Nevertheless, median absolute differences between the feature values of individual patients, as calculated with method C and BJ-TF models, were up to 24%, showing that different feature values were obtained for individual patients when the two different methods were applied. Unfortunately, due to the unwanted noise components in VO2 responses, the true VO2 kinetic feature values are never exactly known. As a result, no quantitative evidence could be provided that indicates which model (method C or BJ-TF) was mainly responsible for these differences in feature values on an individual level. Nevertheless, some theoretical considerations favour BJ-TF models over exponential models, as discussed below.
Unwanted noise contributions influencing VO2 kinetic features values are a general concern when applying exponential models [22,23,24]. In contrast, BJ-TF models explicitly account for the unwanted contributions and the extracted feature values will thus be less influenced by these contributions. Furthermore, parameters in the exponential models were estimated using the generally applied method of least squares, which can be influenced by unwanted noise contributions in the data, in contrast to the more robust refined instrumental variable approach that was used to estimate the model parameters in BJ-TF models [16,25]. In addition, BJ-TF models do not require data manipulation by removing the first 20 s of data after the load onset. Although this method has been proven robust for changes in the amount of removed data under specific conditions, e.g., using the averaged data of four repetitions of the test and a sampling time of 10 s [26], the effect of changing the amount of removed data under less strict conditions, e.g., when only a single test is available, is still unclear and could thus influence the extracted feature values. Based on these elements, BJ-TF models are believed to be more reliable than exponential method C for the determination of kinetic feature values.
MRT varied less than TC over the different modelling methods for quantifying the speed of the primary VO2 response (Figure 5). This confirms the findings from test–retest reliability studies that determine VO2 kinetics from healthy subjects using a treadmill [27] or step test [28]. Inaccurate TD estimates will directly affect TC estimates in the opposite direction. These opposing effects are balanced in the calculation of MRT, making MRT more robust towards inaccurate TD estimations. This study also confirms earlier findings that not all CWRT datasets of COPD patients are well-suited for kinetic analyses [29]. One patient showed no meaningful VO2 response due to a very low cycling load (22 W). More interestingly, another patient had an almost linear primary VO2 response that was not due to a low cycling load. The airway and alveolar abnormalities in COPD patients, which can limit the oxygen delivery to the working muscles [4], might have led to this alteration of the VO2 response. Analyses of larger COPD populations will be required to confirm this hypothesis.
In addition to the more reliable determination of kinetic feature values compared to exponential methods, A and B, BJ-TF models can also be applied more broadly than exponential models. Exponential models do not explicitly include an input variable in their model, limiting their use to experiments with a single input transition (e.g., non-active to active or unloaded to loaded cycling). BJ-TF, however, are able to estimate kinetic feature values with multiple input transitions, e.g., for time-domain analyses of pseudo-random binary sequences of the cycling load [30], or during unsupervised physical activities. As physical activity and VO2 can nowadays be measured with wearable devices [31,32], combining these measurements with BJ-TF modelling can produce frequent estimates of kinetic feature values during standard unsupervised training sessions, without the need for elaborate testing procedures. Similar models have already been successfully used to model heart rate responses during road cycling [33].
Although this study showed the advantages of applying BJ-TF models, some considerations should be taken into account. We only examined a specific population, which exhibits a reduced signal to noise ratio (due to the reduced VO2 response amplitudes [3]) and phase I contribution [5]. It would thus be interesting to test the performance of BJ-TF models in other population types (e.g., athletes or other disease states). Furthermore, other exercise modalities (e.g., treadmill walking) and exercise intensities should be examined to test the general applicability of BJ-TF models for analysing VO2 kinetics.
In conclusion, low residual values showed that BJ-TF models accurately model the VO2 response of COPD patients during a CWRT. These models, in contrast to the typically used exponential models, were able to account for unwanted noise contributions (e.g., the phase I contribution), leading to more reliable determinations of kinetic feature values compared to methods A and B. Only exponential modelling method C, which excludes the data during the cardiodynamic phase, led to comparable kinetic feature values as extracted from BJ-TF models. Based on theoretical considerations, we recommend using BJ-TF, rather than exponential models, for reliable determinations of VO2 kinetics.

Author Contributions

Conceptualization, J.B., J.T., M.A.S., P.D.B. and J.-M.A.; methodology, J.B., A.P.F. and J.-M.A.; formal analysis, J.B.; writing—original draft preparation, J.B.; writing—review and editing, J.T., A.P.F., E.F.M.W., M.A.S., P.D.B. and J.-M.A.; visualization, J.B.; supervision, J.T., M.A.S., P.D.B. and J.-M.A.

Funding

This research received no external funding.

Acknowledgments

This research is part of a PhD research funded by Flemish Institute for Technological Research (VITO), Mol, Belgium.

Conflicts of Interest

The authors declare no conflict of interest.

References

  1. Global Initiative for Chronic Obstructive Lung Disease (GOLD). Global strategy for the diagnosis, management, and prevention of Chronic Obstructive Pulmonary Disease—2019 Report 2019. Available online: https://goldcopd.org/wp-content/uploads/2018/11/GOLD-2019-v1.7-FINAL-14Nov2018-WMS.pdf (accessed on 30 January 2019).
  2. Watz, H.; Pitta, F.; Rochester, C.L.; Garcia-Aymerich, J.; ZuWallack, R.; Troosters, T.; Vaes, A.W.; Puhan, M.A.; Jehn, M.; Polkey, M.I.; et al. An official European respiratory society statement on physical activity in COPD. Eur. Respir. J. 2014, 44, 1521–1537. [Google Scholar] [CrossRef] [PubMed]
  3. American Thoracic Society (ATS); American College of Chest Physicians (ACCP). ATS/ACCP Statement on cardiopulmonary exercise testing. Am. J. Respir. Crit. Care Med. 2003, 167, 211–277. [Google Scholar] [CrossRef] [PubMed]
  4. Poole, D.C.; Jones, A.M. Towards an understanding of the mechanistic bases of VO2 kinetics. Compr. Physiol. 2012, 2, 933–996. [Google Scholar]
  5. Nery, L.E.; Wasserman, K.; Andrews, J.D.; Huntsman, D.J.; Hansen, J.E.; Whipp, B.J. Ventilatory and gas exchange kinetics during exercise in chronic airways obstruction. J. Appl. Physiol. 1982, 53, 1594–1602. [Google Scholar] [CrossRef] [PubMed]
  6. Somfay, A.; Porszasz, J.; Lee, S.-M.; Casaburi, R. Effect of hyperoxia on gas exchange and lactate kinetics following exercise onset in nonhypoxemic COPD patients. Chest 2002, 121, 393–400. [Google Scholar] [CrossRef] [PubMed]
  7. Palange, P.; Galassetti, P.; Mannix, E.T.; Farber, M.O.; Manfredi, F.; Serra, P.; Carlone, S. Oxygen effect on O2 deficit and VO2 kinetics during exercise in obstructive pulmonary disease. J. Appl. Physiol. 1995, 78, 2228–2234. [Google Scholar] [CrossRef] [PubMed]
  8. Laveneziana, P.; Palange, P.; Ora, J.; Martolini, D.; O’Donnell, D.E. Bronchodilator effect on ventilatory, pulmonary gas exchange, and heart rate kinetics during high-intensity exercise in COPD. Eur. J. Appl. Physiol. 2009, 107, 633–643. [Google Scholar] [CrossRef]
  9. Berton, D.C.; Barbosa, P.B.; Takara, L.S.; Chiappa, G.R.; Siqueira, A.C.B.; Bravo, D.M.; Ferreira, L.F.; Neder, J.A. Bronchodilators accelerate the dynamics of muscle O2 delivery and utilisation during exercise in COPD. Thorax 2010, 65, 588–593. [Google Scholar] [CrossRef] [PubMed]
  10. Puente-Maestu, L.; Sánz, M.L.; Sánz, P.; De Oña, J.M.R.; Rodríguez-Hermosa, J.L.; Whipp, B.J. Effects of two types of training on pulmonary and cardiac responses to moderate exercise in patients with COPD. Eur. Respir. J. 2000, 15, 1026–1032. [Google Scholar] [CrossRef]
  11. Faisal, A.; Zoumot, Z.; Shah, P.L.; Neder, J.A.; Polkey, M.I.; Hopkinson, N.S. Effective bronchoscopic lung volume reduction accelerates exercise oxygen uptake kinetics in emphysema. Chest 2016, 149, 435–446. [Google Scholar] [CrossRef] [PubMed]
  12. Chiappa, G.R.; Borghi-Silva, A.; Ferreira, L.F.; Carrascosa, C.; Oliveira, C.C.; Maia, J.; Gimenes, A.C.; Queiroga, F.; Berton, D.; Ferreira, E.M.V.; et al. Kinetics of muscle deoxygenation are accelerated at the onset of heavy-intensity exercise in patients with COPD: Relationship to central cardiovascular dynamics. J. Appl. Physiol. 2008, 104, 1341–1350. [Google Scholar] [CrossRef]
  13. Box, G.E.; Jenkins, G.M.; Reinsel, G.C.; Ljung, G.M. Time Series Analysis, 4th ed.; Quigley, S., Van Horn, L., Eds.; John Wiley & Sons, Inc.: New York, NY, USA, 2008; ISBN 9780470272848. [Google Scholar]
  14. Spruit, M.A.; Vanderhoven-Augustin, I.; Janssen, P.P.; Wouters, E.F. Integration of pulmonary rehabilitation in COPD. Lancet 2008, 371, 12–13. [Google Scholar] [CrossRef]
  15. Pedregal, D.J.; Taylor, C.J.; Young, P.C. System Identification, Time Series Analysis and Forecasting: The Captain Toolbox handbook; Lancaster University: Lancaster, UK, 2007. [Google Scholar]
  16. Young, P.C. Recursive Estimation and Time-Series Analysis: An. Introduction for the Student and Practitioner, 2nd ed.; Springer: Berlin/Heidelberg, Germany; New York, NY, USA, 2011; ISBN 978-3-642-21980-1. [Google Scholar]
  17. Taylor, C.J.; Pedregal, D.J.; Young, P.C.; Tych, W. Environmental time series analysis and forecasting with the Captain toolbox. Environ. Model. Softw. 2007, 22, 797–814. [Google Scholar] [CrossRef]
  18. Jones, N.L.; Makrides, L.; Hitchcock, C.; Chypchar, T.; McCartney, N. Normal Standards for an Incremental Progressive Cycle Ergometer Test. Am. Thorac. Soc. J. 1985, 131, 700–708. [Google Scholar]
  19. Whipp, B.J.; Ward, S.A.; Lamarra, N.; Davis, J.A.; Wasserman, K. Parameters of ventilatory dynamics during exercise. J. Appl. Physiol. Respir. Environ. Exerc. Physiol. 1982, 52, 1506–1513. [Google Scholar]
  20. Bell, C.; Paterson, D.H.; Kowalchuk, J.M.; Padilla, J.; Cunningham, D.A. A comparison of modelling techniques used to characterise oxygen uptake kinetics during the on-transient of exercise. Exp. Physiol. 2001, 86, 667–676. [Google Scholar] [CrossRef] [PubMed]
  21. Spencer, M.D.; Murias, J.M.; Lamb, H.P.; Kowalchuk, J.M.; Paterson, D.H. Are the parameters of VO2, heart rate and muscle deoxygenation kinetics affected by serial moderate-intensity exercise transitions in a single day? Eur. J. Appl. Physiol. 2011, 111, 591–600. [Google Scholar] [CrossRef]
  22. Lamarra, N.; Whipp, B.J.; Ward, A.; Wasserman, K. Effect of interbreath fluctuations on characterizing exercise gas exchange kinetics. J. Appl. Physiol. 1987, 62, 2003–2012. [Google Scholar] [CrossRef]
  23. Puente-Maestu, L.; Buendía Abad, M.J.; Godoy, R.; Pérez-Parra, J.M.; Cubillo, J.M.; Whipp, B.J. Breath-by-breath fluctuations of pulmonary gas exchange and ventilation in COPD patients. Eur. J. Appl. Physiol. 2002, 87, 535–541. [Google Scholar] [CrossRef] [PubMed]
  24. Markovitz, G.H.; Sayre, J.W.; Storer, T.W.; Cooper, C.B. On issues of confidence in determining the time constant for oxygen uptake kinetics. Br. J. Sports Med. 2004, 38, 553–560. [Google Scholar] [CrossRef]
  25. Söderström, T. Errors-in-Variables Methods in System Identification; Springer International Publishing: Cham, Switzerland, 2018; ISBN 978-3-319-75000-2. [Google Scholar]
  26. Murias, J.M.; Spencer, M.D.; Kowalchuk, J.M.; Paterson, D.H. Influence of phase I duration on phase II VO2 kinetics parameter estimates in older and young adults. Am. J. Physiol. Regul. Integr. Comp. Physiol 2011, 301, 218–224. [Google Scholar] [CrossRef] [PubMed]
  27. Kilding, A.E.; Challis, N.V.; Winter, E.M.; Fysh, M. Characterisation, asymmetry and reproducibility of on-and off-transient pulmonary oxygen uptake kinetics in endurance-trained runners. Eur. J. Appl. Physiol. 2005, 93, 588–597. [Google Scholar] [CrossRef]
  28. De Müller, P.T.; Christofoletti, G.; Zagatto, A.M.; Paulin, F.V.; Neder, J.A. Reliability of peak O2 uptake and O2 uptake kinetics in step exercise tests in healthy subjects. Respir. Physiol. Neurobiol. 2015, 207, 7–13. [Google Scholar] [CrossRef]
  29. Puente-Maestu, L.; Sánz, M.L.; Sánz, P.; Nuñez, A.; González, F.; Whipp, B.J. Reproducibility of the parameters of the on-transient cardiopulmonary responses during moderate exercise in patients with chronic obstructive pulmonary disease. Eur. J. Appl. Physiol. 2001, 85, 434–441. [Google Scholar] [CrossRef] [PubMed]
  30. Edwards, A.M.; Claxton, D.B.; Fysh, M.L. A comparison of two time-domain analysis procedures in the determination of VO2 kinetics by pseudorandom binary sequence exercise testing. Eur. J. Appl. Physiol. 2003, 88, 411–416. [Google Scholar] [CrossRef] [PubMed]
  31. Macfarlane, D.J. Open-circuit respirometry: A historical review of portable gas analysis systems. Eur. J. Appl. Physiol. 2017, 117, 2369–2386. [Google Scholar] [CrossRef]
  32. Van Remoortel, H.; Raste, Y.; Louvaris, Z.; Giavedoni, S.; Burtin, C.; Langer, D.; Wilson, F.; Rabinovich, R.; Vogiatzis, I.; Hopkinson, N.S.; et al. Validity of Six Activity Monitors in Chronic Obstructive Pulmonary Disease: A Comparison with Indirect Calorimetry. PLoS ONE 2012, 7, e39198. [Google Scholar] [CrossRef]
  33. Lefever, J.; Berckmans, D.; Aerts, J.-M. Time-variant modelling of heart rate responses to exercise intensity during road cycling. Eur. J. Sport Sci. 2014, 14, S406–S412. [Google Scholar] [CrossRef] [PubMed]
Figure 1. Graphical representation of the kinetic features that quantify the phase II response. The blue line represents the theoretical VO2 response, the orange line shows the phase II contribution that should be modelled, the black dashed line visualises the load increase at t = 0 s. The blue and orange lines coincide during phase II. A slow component is visible in phase III. TD, Time delay; TC, time constant; MRT, mean response time; Amp, response amplitude; ΔW, the step increase in cycling load at t = 0 s; and SSG, steady state gain.
Applsci 09 01822 g001
Figure 2. Example plot of VO2 data and the three different exponential modelling methods. The estimated time delay (TD) values for methods B and C were 8.3 s and 20.3 s, respectively.
Applsci 09 01822 g002
Figure 3. Residual analyses of the residuals from (a) exponential method C (representative for methods A and B) and Box-Jenkins transfer function (BJ-TF) models with noise model orders (b) [2 0] and (c) [3 2]. Left: residual values divided by the model parameter Amp, plotted in function of time. Right: autocorrelation coefficients up to lag 10.
Applsci 09 01822 g003
Figure 4. Example plot of VO2 data and the BJ-TF system and full (system + noise) model. The estimated TD value was 20 s.
Applsci 09 01822 g004
Figure 5. NRMSE and kinetic feature values summarised as median (bar) and interquartile range (line) for exponential modelling methods A, B, C and the BJ-TF model with noise model order [2 0].
Applsci 09 01822 g005
Table 1. Patient characteristics.
Value Mean (SD)
Age (years)63 (7)
Body mass index (kg/m2)26 (5)
Forced expiratory volume in 1 second (FEV1) % predicted48 (14)
Forced vital capacity (FVC) % predicted105 (18)
FEV1/FVC (%)37 (13)
Transfer factor for carbon monoxide % predicted55 (15)
Partial pressure of oxygen (kPa)8.8 (1.8)
Partial pressure of carbon dioxide (kPa)5.3 (0.7)
Modified Medical Research Council dyspnoea scores (scores 1-2-3)2-14-2
CPET maximal cycling load % predicted [18]50 (23)
CPET maximal oxygen uptake (ml/min)1133 (231)
CPET maximal oxygen uptake % predicted [18]55 (21)
CWRT cycling load (W)57 (16)
CWRT endurance time (s)243 (81)
CPET, cardiopulmonary exercise test; CWRT, constant work rate test.
Table 2. Model performance characteristics for identification of the noise model order. Dark squares show noise model orders that resulted in visually inappropriate full model fits. Upper values for every noise model structure are Young Identification Criterion (YIC) values, and lower values are normalised root-mean-squared error values (NRMSE) (%).
Order D(z−1)
123
Order C(z−1)0 −6.94 (2.31)−5.69 (2.12)
2.8 (1.3)2.1 (1.1)
1 −6.82 (2.91)−6.20 (2.11)
2.5 (1.7)2.0 (2.6)
2 −6.75 (2.63)−6.21 (2.69)
2.1 (1.6)2.0 (1.6)
3

