Article

New Parameters for Seedling Vigor Developed via Phenomics

1
National Institute of Agricultural Sciences, Rural Development Administration (RDA), Jeonju 54874, Korea
2
Department of Plant Resources and Environment, Jeju National University, Jeju 63243, Korea
3
Department of Agricultural Machinery Engineering, Chungnam National University, Deajeon 34134, Korea
*
Author to whom correspondence should be addressed.
These authors also contributed equally to this work.
Appl. Sci. 2019, 9(9), 1752; https://doi.org/10.3390/app9091752
Submission received: 21 March 2019 / Revised: 13 April 2019 / Accepted: 23 April 2019 / Published: 27 April 2019

Abstract

:
Early seedling establishment in rice (Oryza sativa L.), which is measured by primary/secondary tiller, shoot length, biomass, root-related traits, and leaf area index, is an important trait because it helps to compete for light, air, and water for better tolerating various abiotic stresses. Consequently, it can affect the yield. However, there are not many research studies on this subject. Furthermore, previous studies have only measured the target traits once. However, this does not reflect the variation of growth rate during the seedling stage. Thus, two data points, two weeks and four weeks after planting, were used in the current study. As a result, two QTL regions were detected for the growth differences via plant height and green area (reflecting tillering). We expect that these results can be utilized by breeders to evaluate and select vigorous seedlings for their breeding programs.

1. Introduction

Early seedling establishment in rice (Oryza sativa L.) is a crucial trait to compete for light, air, and water for better tolerating various abiotic stresses. It also contributes to subsequent tillering quality [1]. Thus, it can highly affect the grain yield [2]. Kumar et al. [3] reported that early vigor has a very strong correlation with yield (0.84). Early seedling establishment is described in many research papers as seedling vigor and measured using several traits, such as primary/secondary tiller, shoot length, biomass, root-related traits, and leaf area index [1,2,3,4,5,6,7,8,9,10,11,12,13].
With the fact that the yield itself is one of the most poorly inherited traits in crop breeding [14], it would be very advantageous to invest in data collection during the early stage via examining seedling vigor. Among those traits for early seedling vigor, the majority of research has studied plant height and tillering because they are associated with yield. Plant height can help compete for light and indirectly affect biomass, which has a high impact on grain fill and grain weight. Tillering is highly related to the panicle number and eventually grain number. Other traits such as roots are also highly associated with the yield, while they are laborious and time-consuming to measure.
The labor-intensive and costly conventional phenotyping was the only method until the advent of high throughput phenotyping [15]. However, it has not been widely adapted in breeding programs. In rice, there are two research papers that have been published that collected data in the greenhouse [16] and field [17] using mature plants. However, the beauty of phenomics is the non-destructiveness, which means that the same objects can be repeatedly measured in different time intervals. Further, it can snap the data of many samples within a very short period of time very accurately and precisely. These are excellent features for collecting data in the early stage since the growth stage shift is fast in that stage. However, previous studies on seedling vigor only collected data once [7,12,13]. Although two data points were collected in one study, it did not examine the difference between the two data points [5]. As Hittalmani et al. [18] concluded that the quantitative trait loci (QTLs) on chromosome 1 for different traits, including projected plant height, panicle number, and panicle length, suggest the pleiotropism and or tight linkage of those traits, sharing several traits in the same region on chromosome 4 might be explained by pleiotropism as well.
There are several growth stage shifts, which means that many changes are involved in this time period. Thus, even the same trait, such as plant height and biomass, can be very different within this time span. Further, there is no research on the growth rate that has been conducted by measuring two different time points for growth comparison, which would enable researchers to understand what really occurs in the early stage. Hence, the objective of the current study is to measure the growth rate using plant height and green area which are highly associated with yield in second and fourth week in order to find out if these traits are related with any QTLs. The result would help us to understand how each phase of vegetative growth in the early stage moves. Furthermore, it would be the true feature of seedling vigor since it can measure the growth rate within a two to four-week time span.

2. Materials and Methods

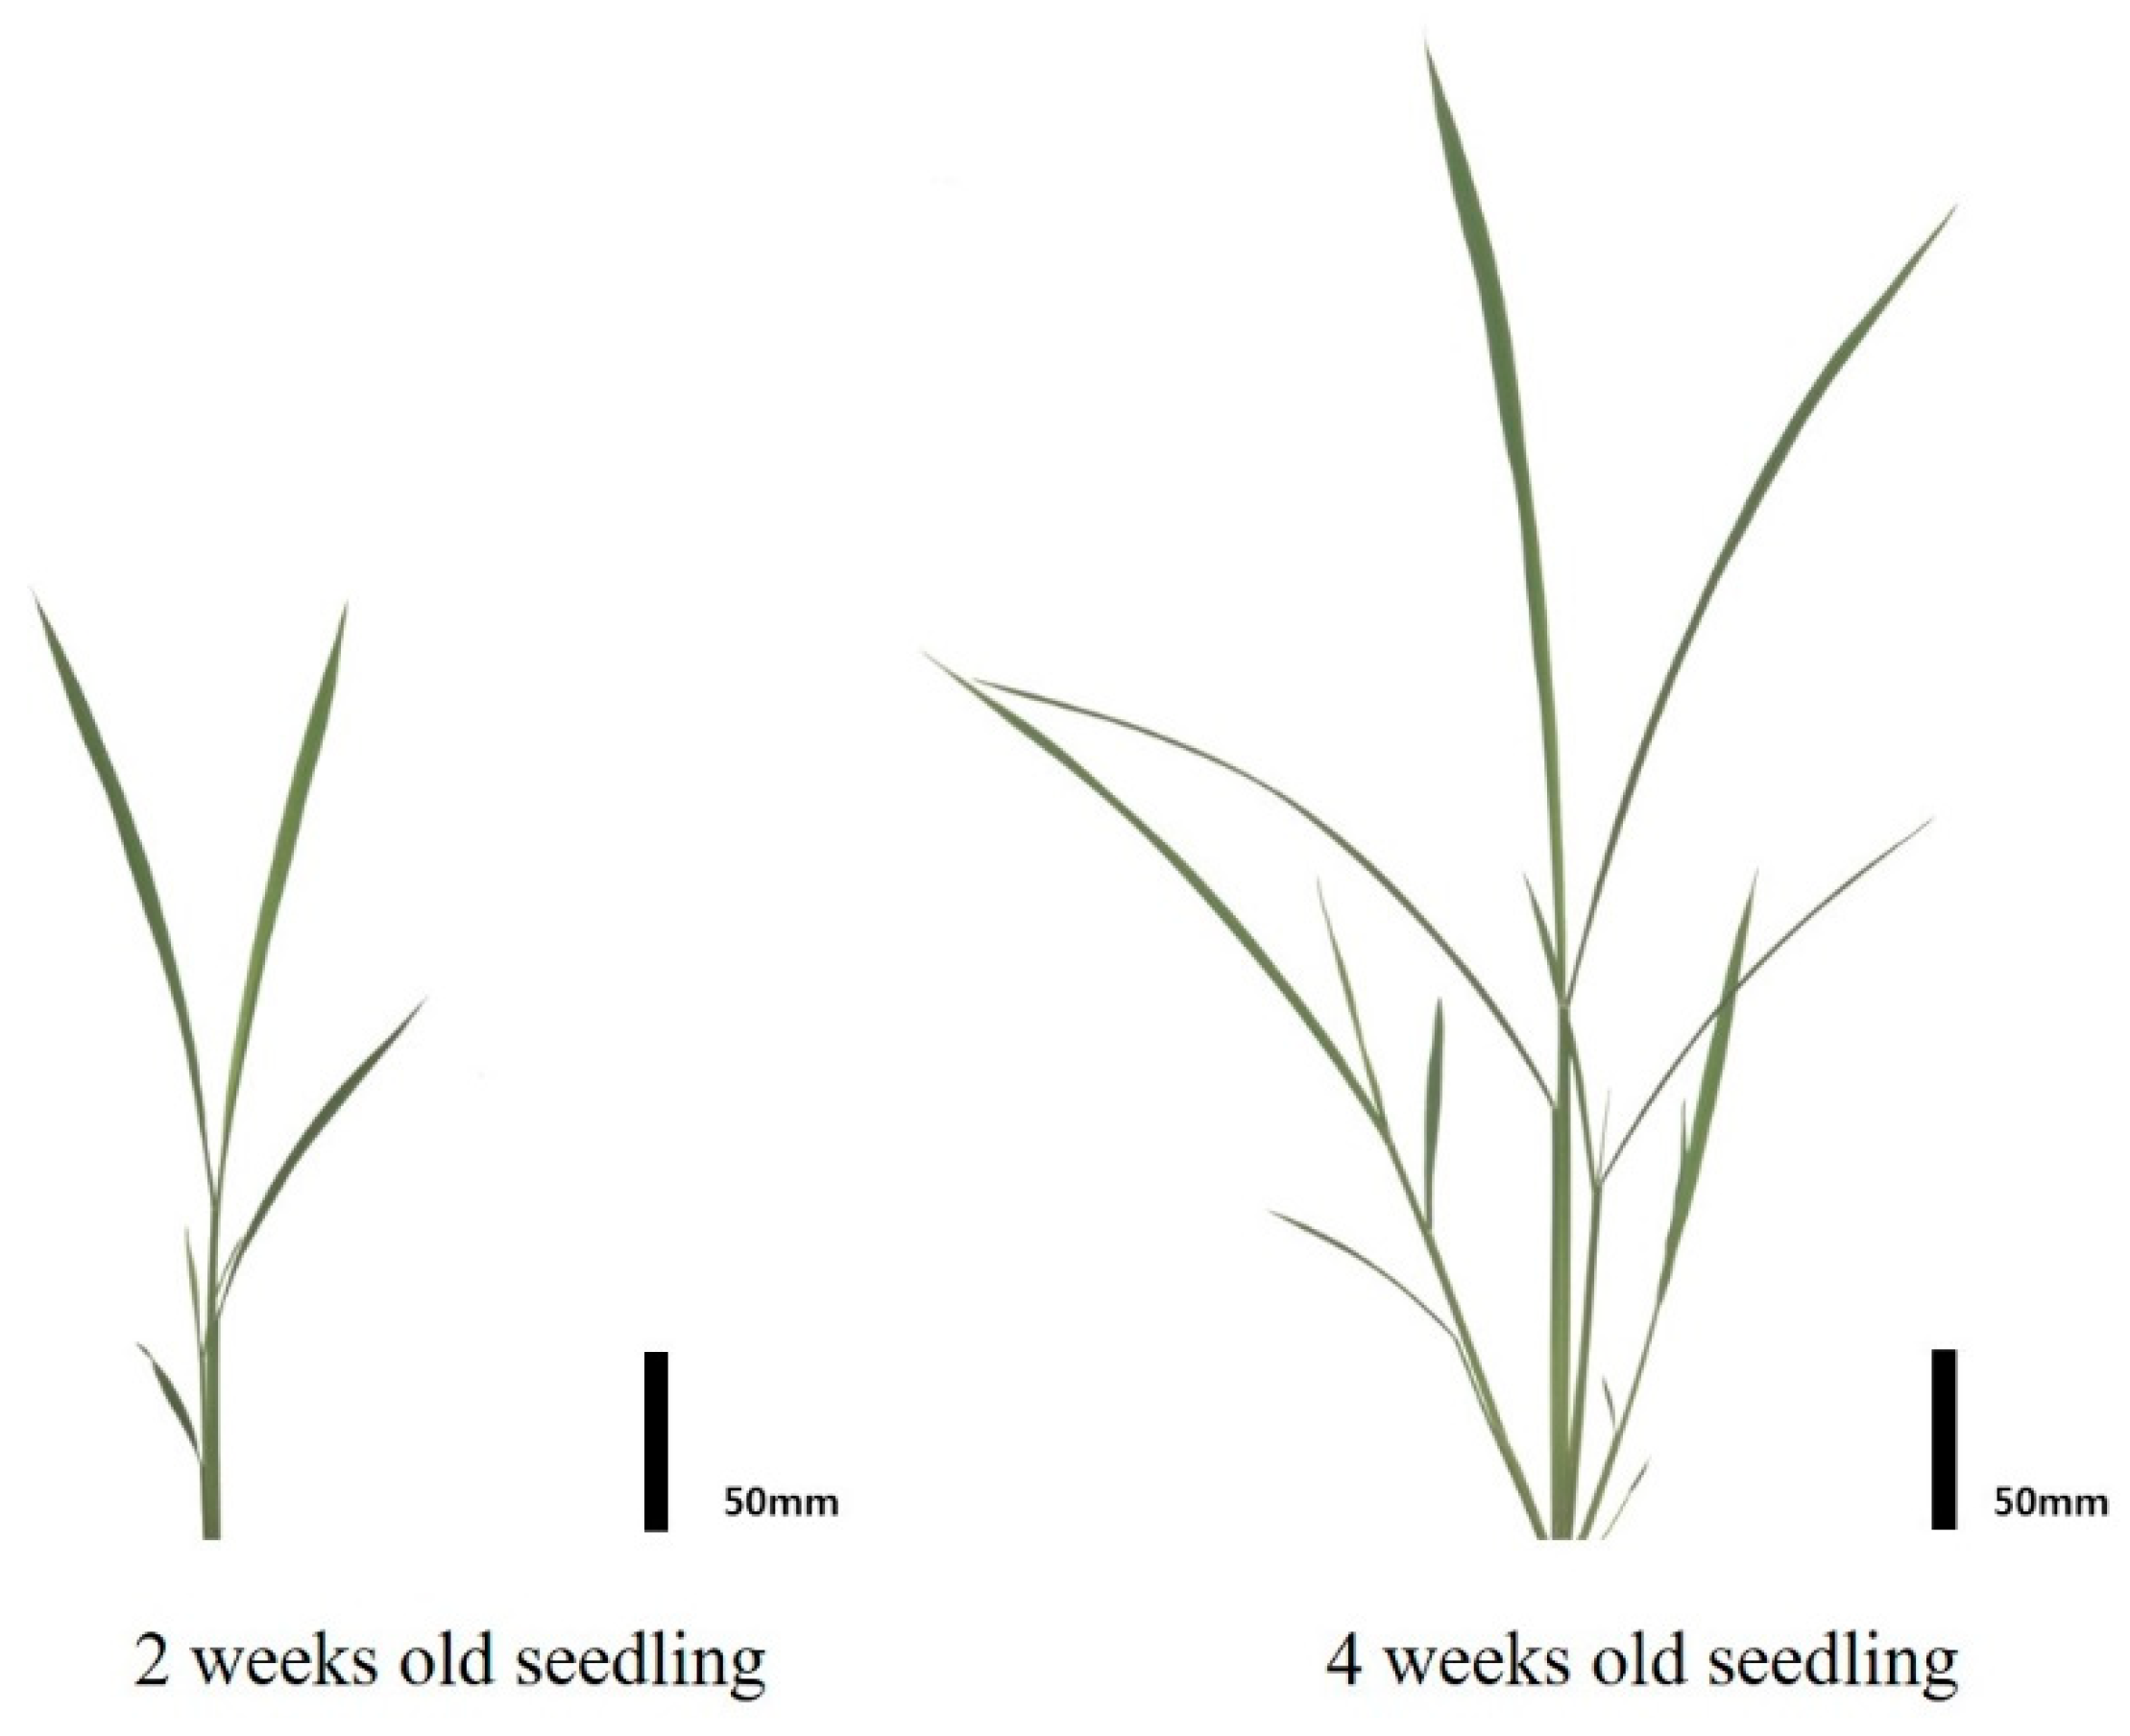
2.1. Plant Materials and Growth Condition

As plant materials, 162 recombinant inbred lines with eight sub-samples were used, which were made by the combination of Milyang 23 and Gihobyeo. These groups were developed more than F25 generation by the SSD method, and a physical map was made by Indel, STS, RTM marker [19]. Sowing and growing were carried out in a 50-well tray in a complete randomized block design and grown for two and four weeks in a 14-h light/10-h dark condition. At the time of imaging, the outermost growing plants were removed to exclude the edge effect (Figure 1).

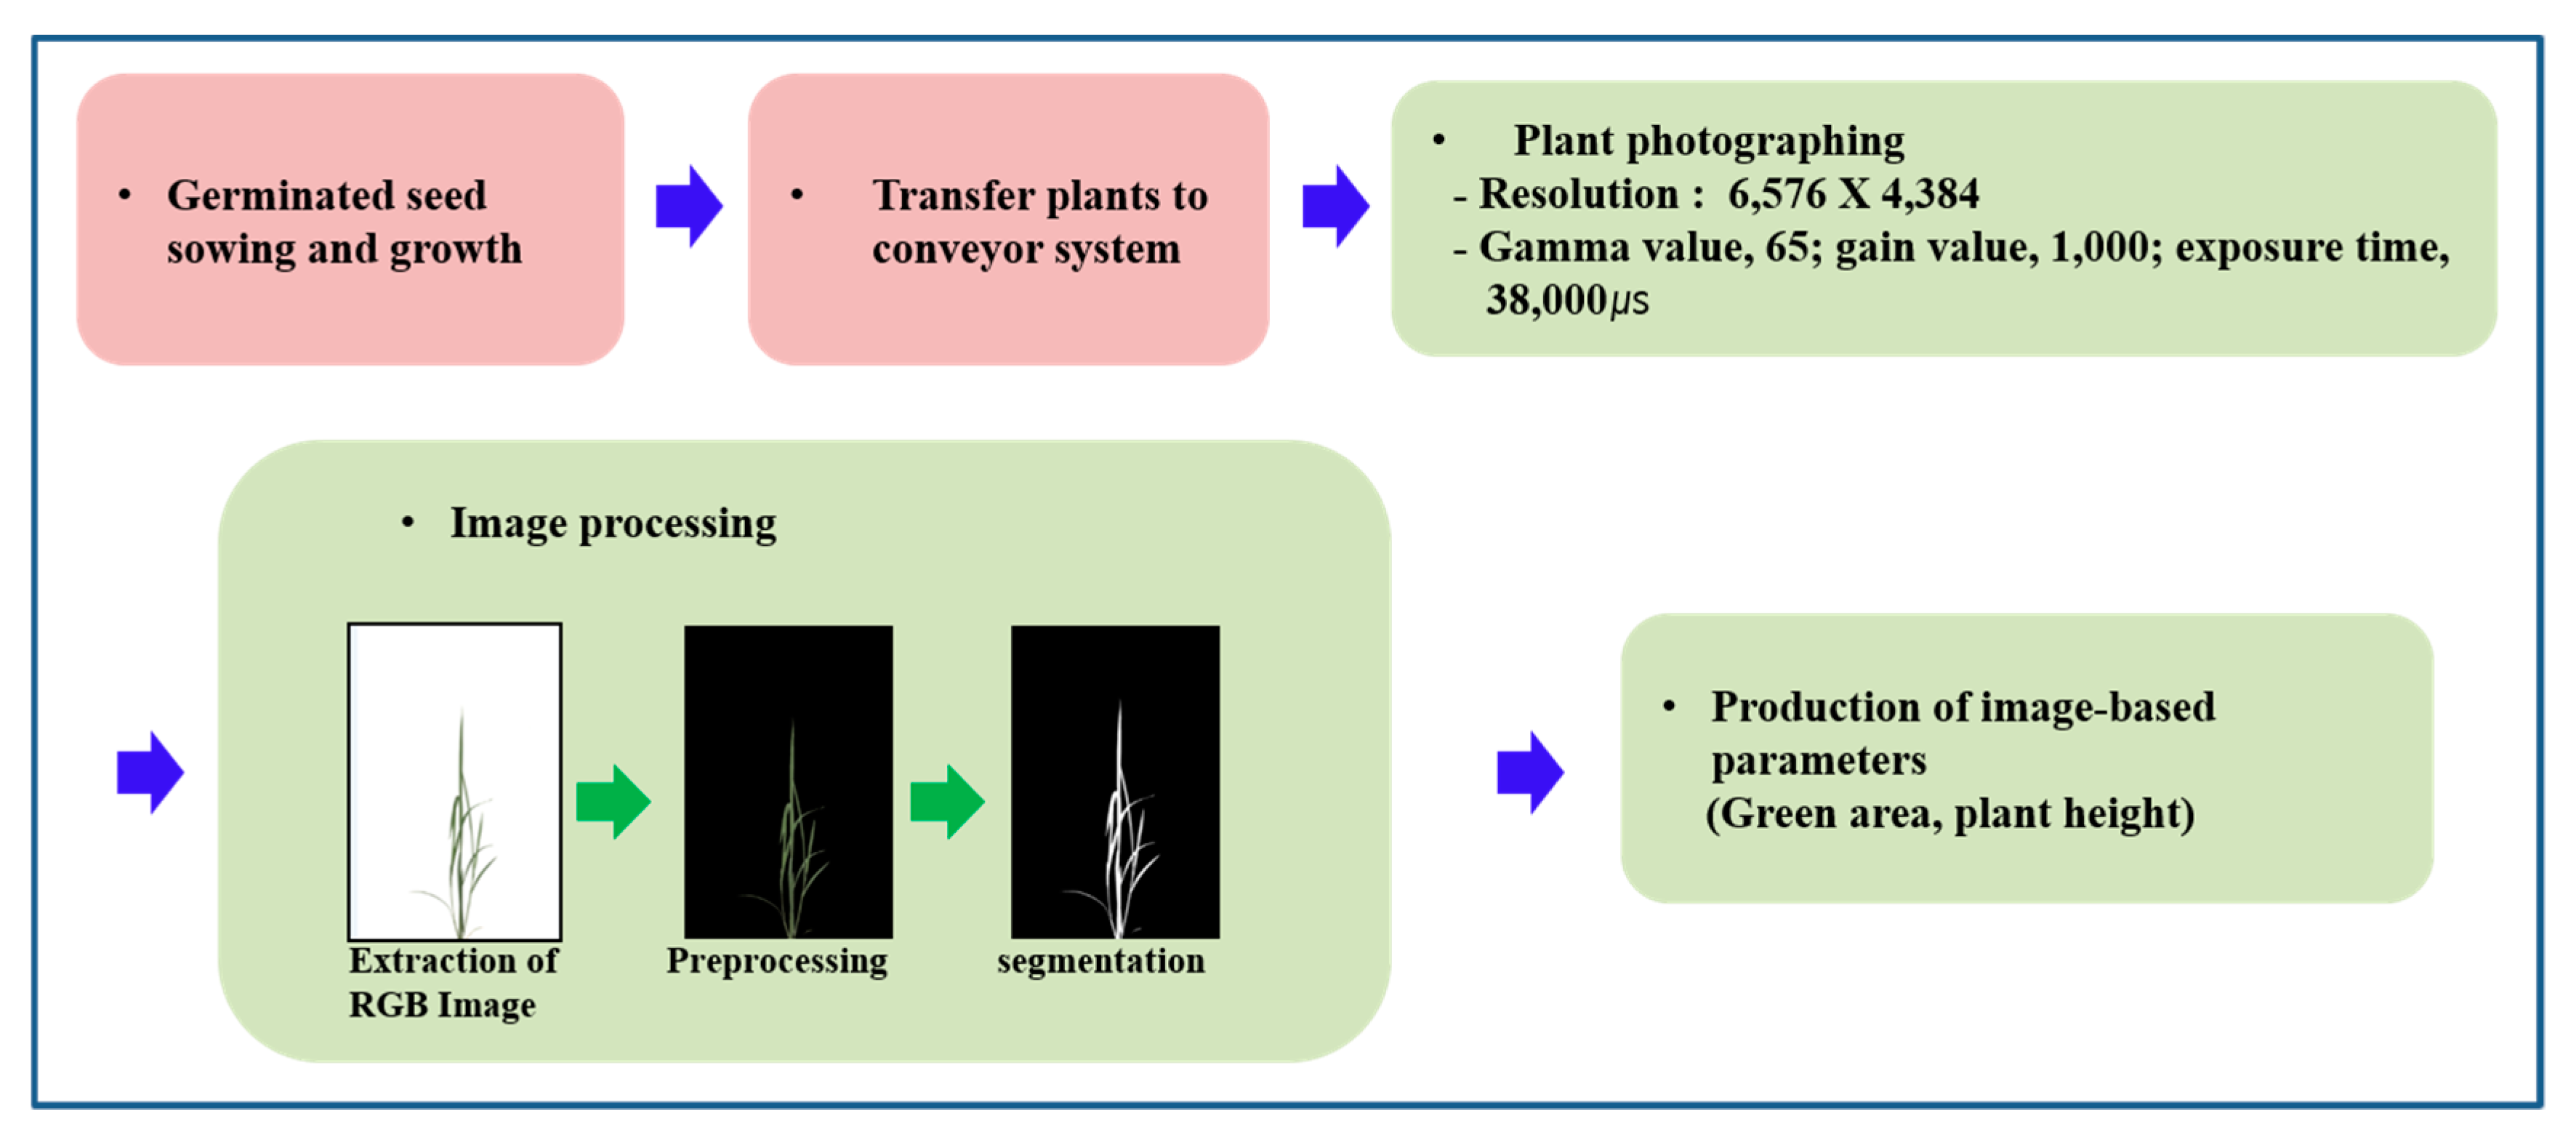
2.2. Image Acquisition

The image of the rice was photographed using a 3D-scanalyzer (LemnaTec, Germany) and analyzed using a Matlab (2013b, The MathWorks Inc., Natick, MA, USA) program. RGB (red, green, and blue) images of plants were obtained with the resolution of 6576 × 4384. Light condition was constantly maintained by the gamma value of 65, gain value of 1000, and exposure time of 38,000 µs (Figure 1). At this time, the number of pixels was calculated by separating the green area of the leaf and stem. The plant height using image information was also measured using the Matlab program. Afterwards, each trait was summarized in Excel format and used for QTL analysis as follows: After changing the RGB image extracted from the region of interest (ROI) into the HSI color space, a green region containing 73 to 180 degrees of the HUE channel was obtained. The plant height was obtained by using the ‘regionprops’ function in Matlab to create the minimum rectangle surrounding the ROI, followed by its longitudinal axis length. The obtained data of the green area and plant height were converted into Excel format using the ‘xlswrite’ function.

2.3. Algorithm Application in Image Analysis

Effective image analysis was performed using the intermediate value filter, fill area filter, and multi-step morphology by the Matlab program. The intermediate value filter was used as a median filer to remove small speckle noise using the ‘medfilt2’ function [20]. The untreated areas of images generated in the noise removal process were processed by using the fill area filter function ‘imfill’ [21]. Through the ‘imdilate’ and ‘imerode’ functions in the multi-step morphology process, morphological dilation and erosion eliminated problems of the reduction of the plant area or the background addition [22]. In order to improve the data processing speed, the obtained image was cut out of the plant area only by removing the background as much as possible. In the case of RGB, it is difficult to investigate the color value effectively because it uses the additive color mixture of the three primary colors. Color classification was performed by replacing RGB images with HSI and Lab channels [23]. HSI means Hue, Saturation, and Intensity, and Lab means L for lightness and a and b for the color opponents green–red and blue–yellow. The color classification process was used to obtain the maximum color information that appears mainly throughout the growth of rice [24,25,26,27,28]. The HSI-H, Lab-a, and Lab-b channels excluded the red and blue hue regions and mainly used the green and yellow hue regions (Figure 2 and Figure 3).

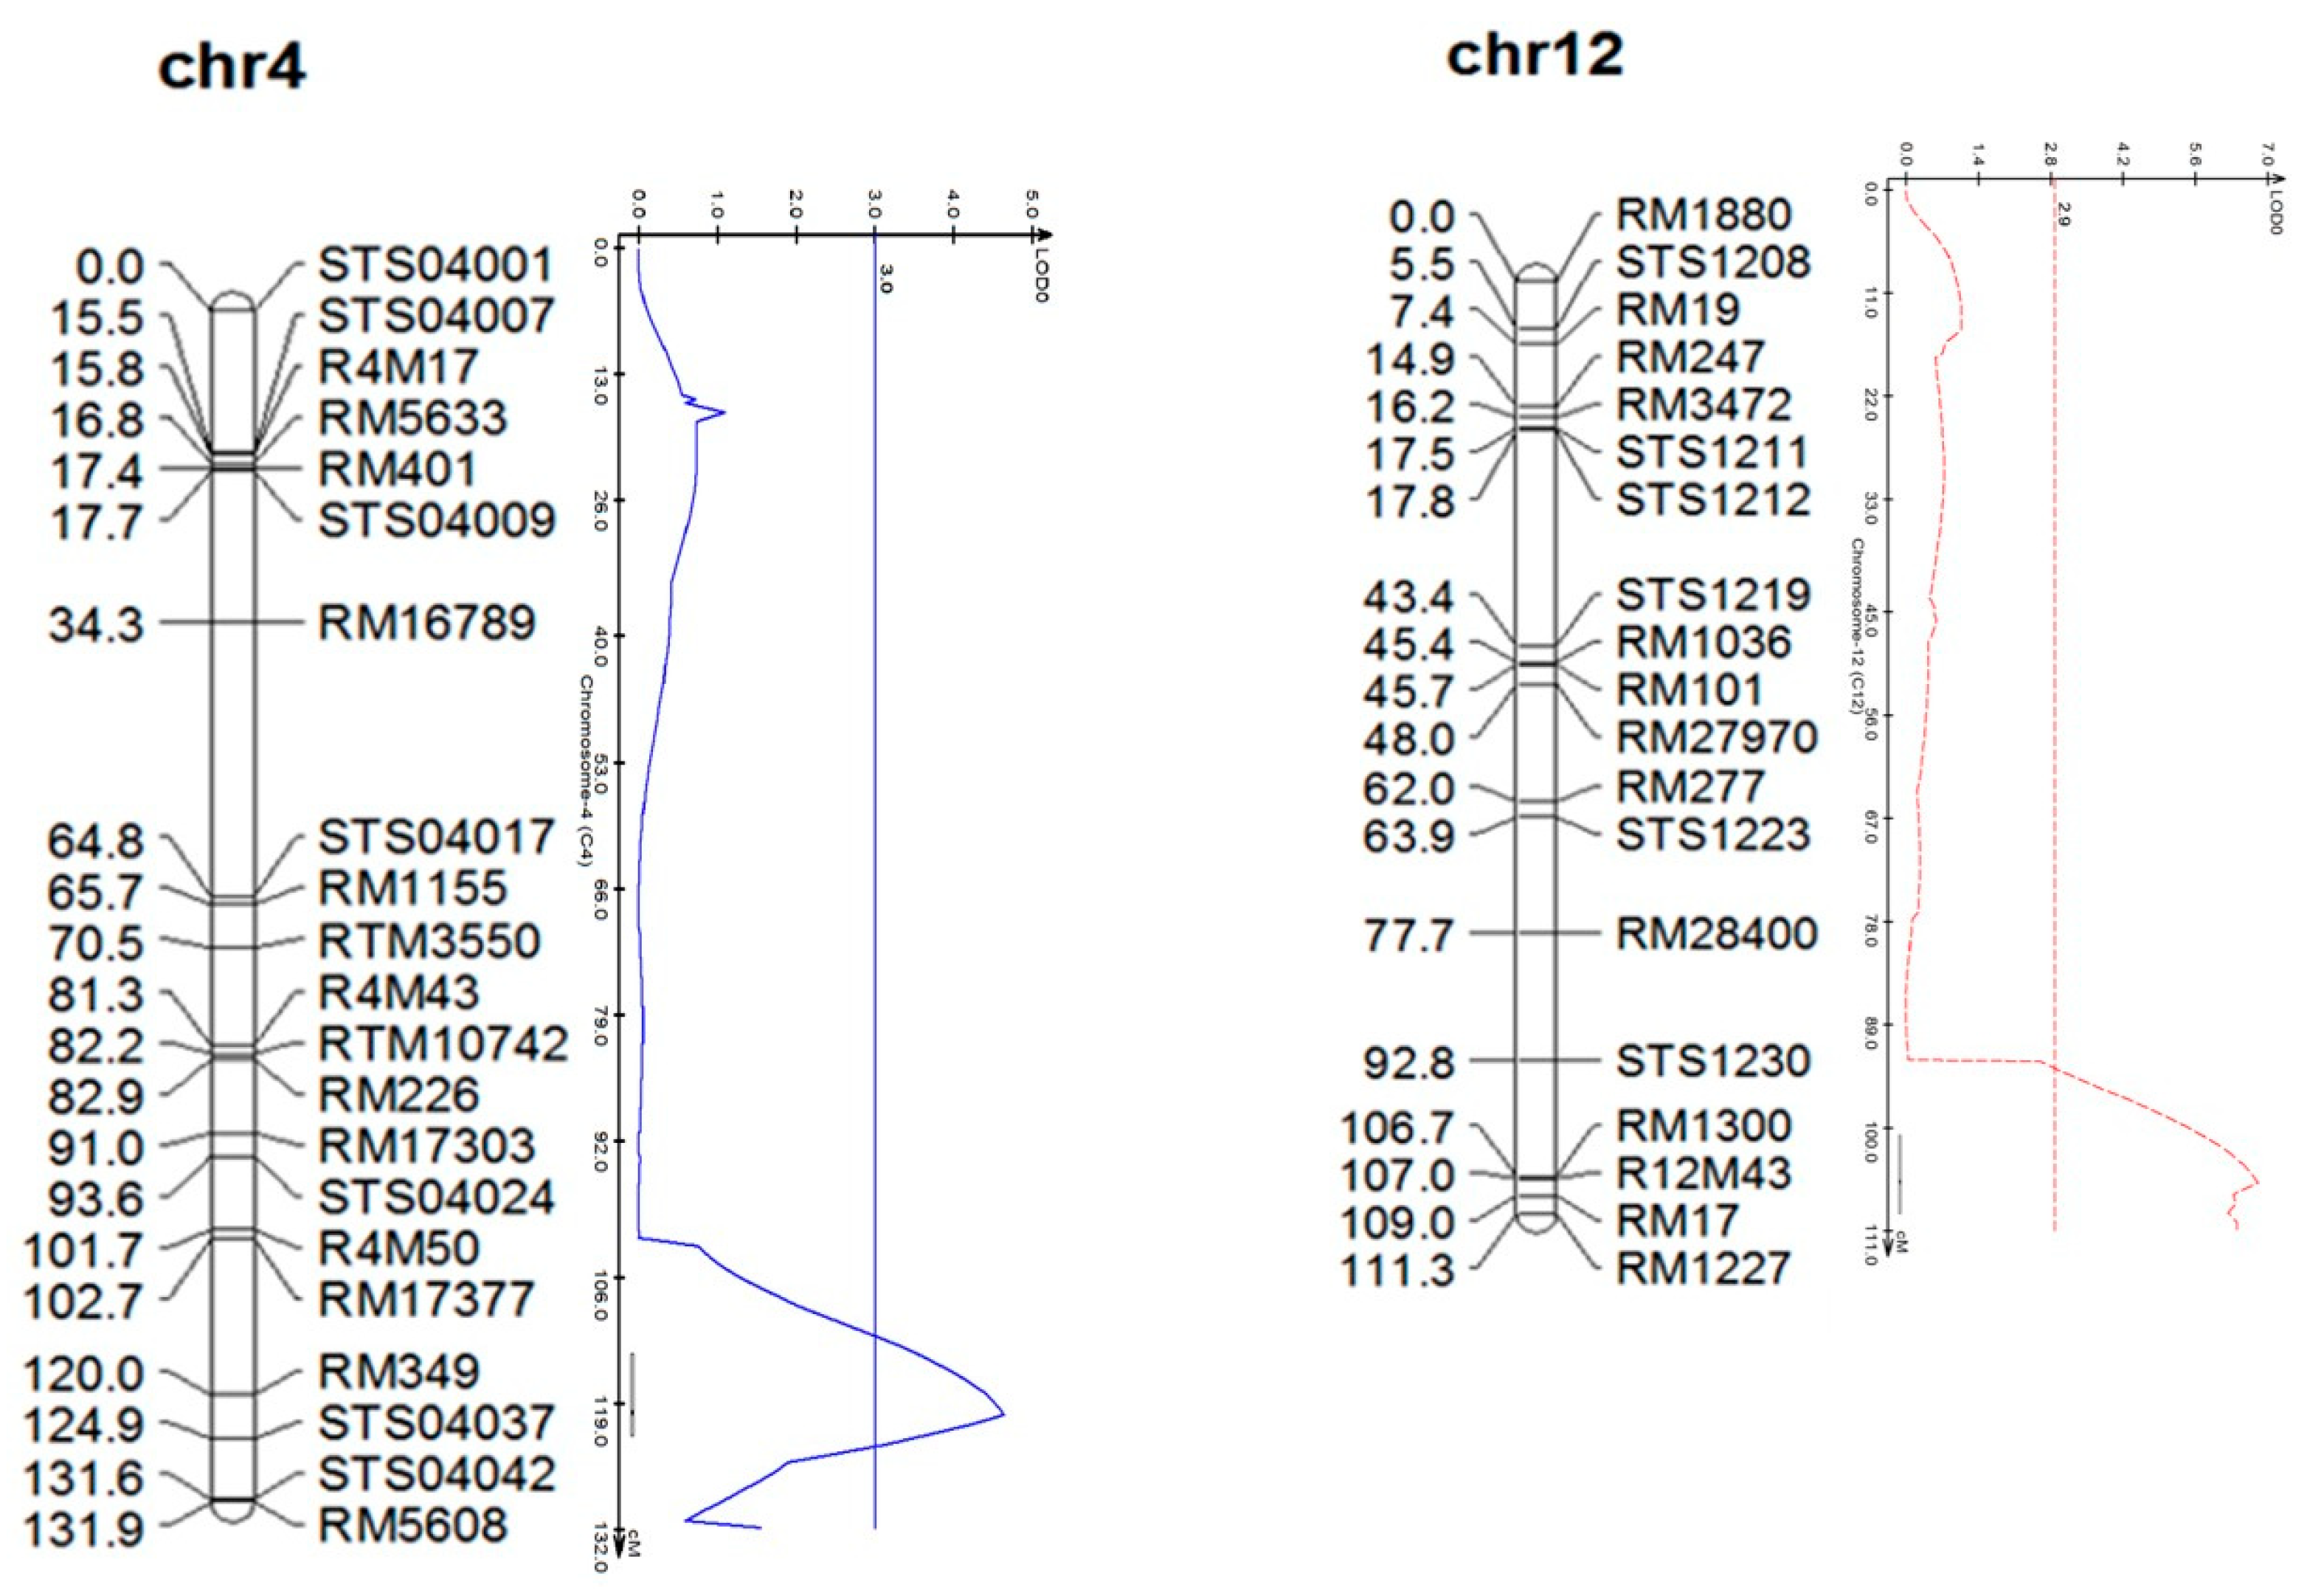
2.4. QTL Analysis for Calculating the Growth Rate

Data for QTL analysis were analyzed using the MapDisto program [28] for the genetic mapping of recombinant subspecies between Milyang 23 and Gihobyeo. Genetic mapping and physical mapping of each marker were performed using the MapChart program [19,26,29]. QTL analysis was performed using Windows QTL Cartographer V2.5 [30]. A significant logarithm of the odds (LOD) value was adopted for 1000 traits at a 95% significance level for each trait. The QTL results for the growth rate were analyzed through the program after calculating the differences in green area and plant height between two and four weeks. Green area QTL (qGA) was the total pixel number of the plant image, and plant height QTL (qPH) was calculated by the object extent Y of the Y-axis length of the least vertical oriented rectangle covering the object.

3. Results

The data for plant height and green area measured by image analysis followed a normal distribution and most of the variance in the growth phenotypes was explained by the genotype (data is not shown). QTL for plant height difference between two and four week-old seedlings was detected on chromosome 12 (Figure 3). The peak on chromosome 4 is located at 120 cM with LOD 4.7 (between R4M50 and STS04042) and that on chromosome 12 was at 105.0 cM with LOD 6.8 (between STS1230 and RM1227). QTL for the plant green area difference between two and four week-old seedlings was detected on chromosome 4, which is known to be associated with the plant height of mature rice, as shown in several studies such as [31]. Those regions on chromosome 12 and 4 are reported to be associated with plant height in mature rice [10,31].

4. Discussion

The seedling vigor is the early stage of the vegetative growth phase. Vegetative growth stages are characterized by a gradual increase in plant height, leaf emergence at regular intervals, and active tillering [32]. A recent study for plant height [16,17] in matured rice using the high throughput phenotyping method revealed a strong peak on chromosome 1, which is a known area where the semi-dwarf 1 (sd1) gene is located. However, several studies using seedlings reported that the same peak of QTL on chromosome 12 found in the current study is associated with plant height and that it is associated with the tolerance of anaerobic conditions using three week-old seedlings [33], as well as using mature rice [34,35,36,37,38]. However, the seedlings in the current study were not submerged. Thus, something else might be involved in the elongation of leaves or (inter)nodes.
Tillering is an important agronomic trait for grain production. The plant height consists of leaf length and culm length, which are composed of nodes and internodes. Thus, in order to grow vertically, both the leaf and culm should be extended. However, the growth rate of leaf length and culm length can be different, as found in sorghum [36]. Both plant height by means of leaf elongation and tiller can contribute to a greater area of blade leaf. This is crucial for energy production for the yield because a blade leaf contains more chlorophyll [39]. Rice tiller is a specialized grain-bearing branch that is formed on the unelongated basal internode and grows independently of culm [40]. Yang et al. [16] reported that the green area of images taken for the whole plants was associated with the peak on chromosome 4, which is associated with plant volume that can be increased by tillers. This region shares the same peak with the current study for the green area difference between two- and four-week-old seedlings. The difference here comes from the tiller initiation in this early stage. The sheath and blades are each longer and wider than their counterparts on the previously emerged leaf, and this trend continues until the ninth complete leaf while the plant is in the vegetative stage [40]. Notably, tillering occurs before the ninth leaf of the main shoot is completed. This transit speed required to initiate the tillering stage could be very important for seedling vigor as not only does the crown develop noticeably at the base of the main shoot during tillering [39], but also the number of productive tillers has a direct positive effect on the number of filled grains per panicle and the grain yield [41]. The QTL peak on chromosome 4 in the current study is reported to be associated with several important agronomic traits in mature rice, including root thickness, root dry weight per tiller [42], crown growth [43], basal root thickness, root fresh weight, and root volume [43], which are observed in the tiller initiation stage. This region is also related to the number of spikelets, number of panicles, panicle length, and number of spikelets per panicle [18,44], which are directly related to the yield since grain yield is the combined result of those factors.

5. Conclusions

Early seedling embellishment is advantageous for plants, enabling them to be ready for stable growth during the growing season for a high yield. Among many other traits used to measure seedling vigor, the current study measured two important components for seedling vigor, plant height data and green area data collected at two different time points, two and four weeks after planting, in a very accurate and high throughput manner, which was not possible before; the result in the current study introduces new parameters for seedling vigor. Furthermore, these two components are highly associated with rice yield, as described above. Thus, the result with the new parameters for seedling vigor using high throughput phenotyping could be useful to breeders not only for fast seedling establishment, but also for high yield potential.

Author Contributions

Conceptualization, Y.S.C.; methodology, Y.S.C.; software, H.J. and H.L.; formal analysis, N.K., E.L., J.B., J.O., D.-Y.K., and G.-S.L.; resources, T.-R.K.; investigation, S.L.K. and I.C.; visualization, H.J.; writing—original draft preparation, Y.S.C.; writing—review and editing, Y.S.C. and K.-H.K.; supervision, K.-H.K.

Funding

This research received no external funding.

Acknowledgments

This work was supported by a grant from the National Institute of Agricultural Sciences (NIAS), project number PJ01246801, Republic of Korea.

Conflicts of Interest

The authors declare no conflict of interest.

References

  1. Mishra, A.; Salokhe, V.M. Rice root growth and physiological responses to sri water management and implications for crop productivity. Paddy Water Environ. 2011, 9, 41–52. [Google Scholar] [CrossRef]
  2. Akram, M.; Ajmal, S.U.; Munir, M. Inheritance of traits related to seedling vigor and grain yield in rice (Oryza sativa L.). Pak. J. Bot. 2007, 39, 37–45. [Google Scholar]
  3. Kumar, A.; Verulkar, S.; Dixit, S.; Chauhan, B.; Bernier, J.; Venuprasad, R.; Zhao, D.; Shrivastava, M. Yield and yield-attributing traits of rice (Oryza sativa L.) under lowland drought and suitability of early vigor as a selection criterion. Field Crops Res. 2009, 114, 99–107. [Google Scholar] [CrossRef]
  4. Biswas, J.C.; Ladha, J.K.; Dazzo, F.B.; Yanni, Y.G.; Rolfe, B.G. Rhizobial inoculation influences seedling vigor and yield of rice. Agron. J. 2000, 92, 880–886. [Google Scholar] [CrossRef]
  5. Cui, K.; Peng, S.; Xing, Y.; Xu, C.; Yu, S.; Zhang, Q. Molecular dissection of seedling-vigor and associated physiological traits in rice. Theor. Appl. Genet. 2002, 105, 745–753. [Google Scholar] [CrossRef] [PubMed]
  6. Fukuda, A.; Terao, T. Qtls for shoot length and chlorophyll content of rice seedlings grown under low-temperature conditions, using a cross between indica and japonica cultivars. Plant Prod. Sci. 2015, 18, 128–136. [Google Scholar] [CrossRef]
  7. Lu, X.-L.; Niu, A.-L.; Cai, H.-Y.; Zhao, Y.; Liu, J.-W.; Zhu, Y.-G.; Zhang, Z.-H. Genetic dissection of seedling and early vigor in a recombinant inbred line population of rice. Plant Sci. 2007, 172, 212–220. [Google Scholar] [CrossRef]
  8. Redona, E.; Mackill, D. Genetic variation for seedling vigor traits in rice. Crop Sci. 1996, 36, 285–290. [Google Scholar] [CrossRef]
  9. Redona, E.; Mackill, D. Mapping quantitative trait loci for seedling vigor in rice using rflps. Theor. Appl. Genet. 1996, 92, 395–402. [Google Scholar] [CrossRef] [PubMed]
  10. Yano, K.; Takashi, T.; Nagamatsu, S.; Kojima, M.; Sakakibara, H.; Kitano, H.; Matsuoka, M.; Aya, K. Efficacy of microarray profiling data combined with qtl mapping for the identification of a qtl gene controlling the initial growth rate in rice. Plant Cell Physiol. 2012, 53, 729–739. [Google Scholar] [CrossRef]
  11. Zhang, Z.-H.; Qu, X.-S.; Wan, S.; Chen, L.-H.; Zhu, Y.-G. Comparison of qtl controlling seedling vigour under different temperature conditions using recombinant inbred lines in rice (Oryza sativa). Ann. Bot. 2004, 95, 423–429. [Google Scholar] [CrossRef]
  12. Zhang, Z.-H.; Yu, S.-B.; Yu, T.; Huang, Z.; Zhu, Y.-G. Mapping quantitative trait loci (qtls) for seedling-vigor using recombinant inbred lines of rice (Oryza sativa L.). Field Crops Res. 2005, 91, 161–170. [Google Scholar] [CrossRef]
  13. Zhou, L.; Wang, J.-K.; Yi, Q.; Wang, Y.-Z.; Zhu, Y.-G.; Zhang, Z.-H. Quantitative trait loci for seedling vigor in rice under field conditions. Field Crops Res. 2007, 100, 294–301. [Google Scholar] [CrossRef]
  14. Richards, R.A.; Rebetzke, G.J.; Watt, M.; Condon, A.T.; Spielmeyer, W.; Dolferus, R. Breeding for improved water productivity in temperate cereals: Phenotyping, quantitative trait loci, markers and the selection environment. Funct. Plant Biol. 2010, 37, 85–97. [Google Scholar] [CrossRef]
  15. Furbank, R.T.; Tester, M. Phenomics–technologies to relieve the phenotyping bottleneck. Trends Plant Sci. 2011, 16, 635–644. [Google Scholar] [CrossRef]
  16. Yang, W.; Guo, Z.; Huang, C.; Duan, L.; Chen, G.; Jiang, N.; Fang, W.; Feng, H.; Xie, W.; Lian, X. Combining high-throughput phenotyping and genome-wide association studies to reveal natural genetic variation in rice. Nat. Commun. 2014, 5, 5087. [Google Scholar] [CrossRef] [Green Version]
  17. Tanger, P.; Klassen, S.; Mojica, J.P.; Lovell, J.T.; Moyers, B.T.; Baraoidan, M.; Naredo, M.E.B.; McNally, K.L.; Poland, J.; Bush, D.R. Field-based high throughput phenotyping rapidly identifies genomic regions controlling yield components in rice. Sci. Rep. 2017, 7, 42839. [Google Scholar] [CrossRef] [Green Version]
  18. Hittalmani, S.; Huang, N.; Courtois, B.; Venuprasad, R.; Shashidhar, H.; Zhuang, J.; Zheng, K.; Liu, G.; Wang, G.; Sidhu, J. Identification of qtl for growth-and grain yield-related traits in rice across nine locations of asia. Theor. Appl. Genet. 2003, 107, 679–690. [Google Scholar] [CrossRef] [PubMed]
  19. Ji, H.; Kim, H.; Lee, G.-S.; Yoon, U.-H.; Kim, T.-H.; Seol, Y.-J.; Yun, D.-W.; Koh, H.-J.; Eun, M.-Y. Development of rice molecular genetic and physical map using pcr-based DNA markers with the recombinant inbred population derived from milyang23/gihobyeo cross. Korean J. Breed. Sci. 2012, 44. [Google Scholar]
  20. Lee, J.S. Digital image smoothing and the sigma filter. Comput. Vis. Graph. Image Proc. 1983, 24, 255–269. [Google Scholar] [CrossRef]
  21. Chen, L.; Hui, L.; Shutao, L. Depth Image Enhancement for Kinect Using Region Growing and Bilateral Filter. In Proceedings of the 21st International Conference on Pattern Recognition (ICPR2012), Tsukuba, Japan, 11–15 November 2012; IEEE: Piscataway, NJ, USA, 2012. [Google Scholar]
  22. Haralick, R.M.; Stanley, R.S.; Xinhua, Z. Image analysis using mathematical morphology. IEEE Trans. Pattern Anal. Mach. Intell. 1987, 9, 532–550. [Google Scholar] [CrossRef]
  23. Yin, W.; Cheng, X.; Cui, H.; Li, D.; Zhou, L. Adaptive and accurate color edge extraction method for one-shot shape acquisition. Opt. Eng. 2016, 55, 094104. [Google Scholar] [CrossRef]
  24. Bai, X.; Wu, B.; Xing, Y. Yield-related qtls and their applications in rice genetic improvement f. J. Integr. Plant Biol. 2012, 54, 300–311. [Google Scholar] [CrossRef]
  25. Khattab, D.; Ebied, H.M.; Hussein, A.S.; Tolba, M.F. Color image segmentation based on different color space models using automatic grabcut. Sci. World J. 2014, 2014. [Google Scholar] [CrossRef] [PubMed]
  26. Khoshroo, A.; Arefi, A.; Khodaei, J. Detection of red tomato on plants using image processing techniques. Agric. Commun. 2014, 2, 9–15. [Google Scholar]
  27. Phakade, S.; Flora, D.; Malashree, H.; Rashmi, J. Automatic fruit defect detection using hsv and rgb color space model. Int. J. Innov. Res. Comput. Sci. Technol. 2014, 3, 67–73. [Google Scholar]
  28. Lorieux, M. Mapdisto: Fast and efficient computation of genetic linkage maps. Mol. Breed. 2012, 30, 1231–1235. [Google Scholar] [CrossRef]
  29. Voorrips, R. Mapchart: Software for the Graphical Presentation of Linkage Maps and Qtls. J. Hered. 2002, 93, 77–78. [Google Scholar] [CrossRef] [PubMed]
  30. Wang, S. Windows QTL Cartographer 2.5; Department of Statistics, North Carolina State University: Raleigh, NC, USA, 2006. [Google Scholar]
  31. Hemamalini, G.; Shashidhar, H.; Hittalmani, S. Molecular marker assisted tagging of morphological and physiological traits under two contrasting moisture regimes at peak vegetative stage in rice (Oryza sativa L.). Euphytica 2000, 112, 69–78. [Google Scholar] [CrossRef]
  32. Moldenhauer, K.; Slaton, N. Rice Growth and Development. In Rice Production Handbook; Africa Rice Center: Bouaké, Côte d’Ivoire, 2001; pp. 7–14. [Google Scholar]
  33. Septiningsih, E.M.; Ignacio, J.C.I.; Sendon, P.M.; Sanchez, D.L.; Ismail, A.M.; Mackill, D.J. Qtl mapping and confirmation for tolerance of anaerobic conditions during germination derived from the rice landrace ma-zhan red. Theor. Appl. Genet. 2013, 126, 1357–1366. [Google Scholar] [CrossRef] [PubMed]
  34. Hattori, Y.; Miura, K.; Asano, K.; Yamamoto, E.; Mori, H.; Kitano, H.; Matsuoka, M.; Ashikari, M. A major qtl confers rapid internode elongation in response to water rise in deepwater rice. Breed. Sci. 2007, 57, 305–314. [Google Scholar] [CrossRef]
  35. Hattori, Y.; Nagai, K.; Furukawa, S.; Song, X.-J.; Kawano, R.; Sakakibara, H.; Wu, J.; Matsumoto, T.; Yoshimura, A.; Kitano, H. The ethylene response factors snorkel1 and snorkel2 allow rice to adapt to deep water. Nature 2009, 460, 1026. [Google Scholar] [CrossRef]
  36. Kawano, R.; Doi, K.; Yasui, H.; Mochizuki, T.; Yoshimura, A. Mapping of qtls for floating ability in rice. Breed. Sci. 2008, 58, 47–53. [Google Scholar] [CrossRef]
  37. Nagai, K.; Hattori, Y.; Ashikari, M. Stunt or elongate? Two opposite strategies by which rice adapts to floods. J. Plant Res. 2010, 123, 303–309. [Google Scholar] [CrossRef]
  38. Nagai, K.; Kondo, Y.; Kitaoka, T.; Noda, T.; Kuroha, T.; Angeles-Shim, R.B.; Yasui, H.; Yoshimura, A.; Ashikari, M. Qtl analysis of internode elongation in response to gibberellin in deepwater rice. AoB Plants 2014, 6. [Google Scholar] [CrossRef]
  39. Dunand, R.; Saichuk, J. Rice Plant Growth and Development. In Lousiana Rice Production Handbook; Louisiana State University Agricultural Center: Baton Rouge, LA, USA, 2014; pp. 41–53. [Google Scholar]
  40. Li, X.; Qian, Q.; Fu, Z.; Wang, Y.; Xiong, G.; Zeng, D.; Wang, X.; Liu, X.; Teng, S.; Hiroshi, F. Control of tillering in rice. Nature 2003, 422, 618. [Google Scholar] [CrossRef] [PubMed]
  41. Champoux, M.; Wang, G.; Sarkarung, S.; Mackill, D.; O’Toole, J.; Huang, N.; McCouch, S. Locating genes associated with root morphology and drought avoidance in rice via linkage to molecular markers. Theor. Appl. Genet. 1995, 90, 969–981. [Google Scholar] [CrossRef] [PubMed]
  42. Qu, Y.; Mu, P.; Zhang, H.; Chen, C.Y.; Gao, Y.; Tian, Y.; Wen, F.; Li, Z. Mapping qtls of root morphological traits at different growth stages in rice. Genetica 2008, 133, 187–200. [Google Scholar] [CrossRef] [PubMed]
  43. Hittalmani, S.; Shashidhar, H.; Bagali, P.G.; Huang, N.; Sidhu, J.; Singh, V.; Khush, G. Molecular mapping of quantitative trait loci for plant growth, yield and yield related traits across three diverse locations in a doubled haploid rice population. Euphytica 2002, 125, 207–214. [Google Scholar] [CrossRef]
  44. Sürek, H.; Beşer, N. Correlation and path coefficient analysis for some yield-related traits in rice (Oryza sativa L.) under thrace conditions. Turk. J. Agric. For. 2003, 27, 77–83. [Google Scholar]
Figure 1. The process of image acquisition.
Applsci 09 01752 g001
Figure 2. Phenotype of two and four week-old plants.
Applsci 09 01752 g002
Figure 3. Genetic map showing the growth rate-related QTLs between two and four week-old seedlings of the MGRILs. qGA-4 in the blue peak indicates the green area; qPH-12 in the red peak indicates the plant height.
Applsci 09 01752 g003

