Abstract
In thick section laser welding, filler metal addition is usually required to improve joint fit-up tolerances or to control the chemical composition of the weld metal. With deep and narrow welds produced using an over-alloyed filler metal, it may be challenging to ensure that the filler metal and its elements are homogeneously mixed and evenly distributed throughout the fusion zone. Inhomogeneous filler metal mixing can cause unfavourable changes to weld metal chemistry and microstructure. Filler metal mixing behaviour in laser-arc hybrid and laser cold-wire welding is studied in this work. Welding tests were conducted on 10 mm thick butt-welded joints of AISI 316L austenitic stainless steel. An overmatching type 2205 duplex stainless steel filler wire was used to obtain a composition contrast between the base metal and filler metal. Energy dispersive spectroscopy (EDS) with chromium as the trace element was used for element mapping and stepwise characterization of the weld cross-section samples. Optical metallography was used to observe possible inhomogeneous filler metal mixing behaviour like local acute changes in macro- and microstructural features. The results showed a clear difference in filler metal mixing between the weld surface part (upper half) of the weld and the weld root part (lower half) in 10 mm thick welded cross-sections for closed root gap of I-groove welds or when the gap was only 0.4 mm. In narrow I-groove preparations, inhomogeneous mixing phenomena were more pronounced in laser cold-wire welds than in laser-arc hybrid welds. In both welding processes, a combination of trailing wire feeding and the use of a wider groove enabled filler metal to be introduced deeper into the bottom of the groove and improved mixing in the root portion of the welds.
1. Introduction
The utilization of modern high-power laser systems in laser-arc hybrid welding and laser welding with filler wire processes can provide new tools and techniques for efficiency improvement in heavy-section welding. For example, efficiency enhancement via reduced manufacturing time can be achieved if thicker sections can be welded using deep single-pass welding. Single-pass welding tends to result in less weld distortion and thus less time-consuming post-weld finishing is required [1,2,3,4,5]. When considering welding of thick section joints an autogenous laser beam welding is not always practically feasible and that is why filler metal addition to the welding process is needed. Filler metal can be introduced to the laser process for example, via an arc (laser-arc hybrid) as a molten form or using a cold-wire [6,7,8,9] or pre-heated wire feeding [10,11]. Also pre-set filler metal foil inserts [12,13] inside the joint has been used. The need for the use of filler addition can be associated with the joint fit-up tolerance requirements of the welded parts or for example, metallurgical and mechanical properties required for the produced weldments. Although offering clear benefits, the use of filler material in thick section laser or laser-arc hybrid welding applications faces a number of challenges. Results from previous investigations have indicated that in thick section joints with closed or narrow square butt configurations, the filler metal proportion in the weld metal is mainly limited to the surface part of the weld cross-section and filler metal mixing in the root area of the weld metal is minor or negligible [14,15,16,17]. Depending on the application and the combination of base metal and filler metal used, inhomogeneous filler metal mixing can have an adverse effect on weld metal microstructural homogeneity and weld metal phases. In turn, the non-optimal microstructure can cause, for example, loss of corrosion resistance, reduction in ductility properties or enhanced susceptibility to weld solidification cracking [13,18,19,20,21].
The aim of this study is to investigate filler metal mixing behaviour in 10 mm thick joints of austenitic stainless steel in single-pass laser-arc hybrid and laser cold-wire welding processes. The objective was to examine the effect of groove geometry and filler wire feeding orientation on filler metal mixing in terms of the intensity and homogeneity of mixing throughout the weld cross-section from the weld surface to the root. The experimental work aimed to gain practical knowledge and provide answers to the following research questions: Can filler metal mixing at the root portion of the weld be enhanced by widening the root gap of an I-groove weld or by using a suitable V-groove? Can any difference be found between the results of using leading or trailing wire feeding, that is, when the filler wire is introduced to the melt pool in front of or behind the laser beam with respect to the welding direction? Is there any noticeable difference in filler metal mixing behaviour between laser-arc hybrid and laser cold-wire welding?
2. Materials and Methods
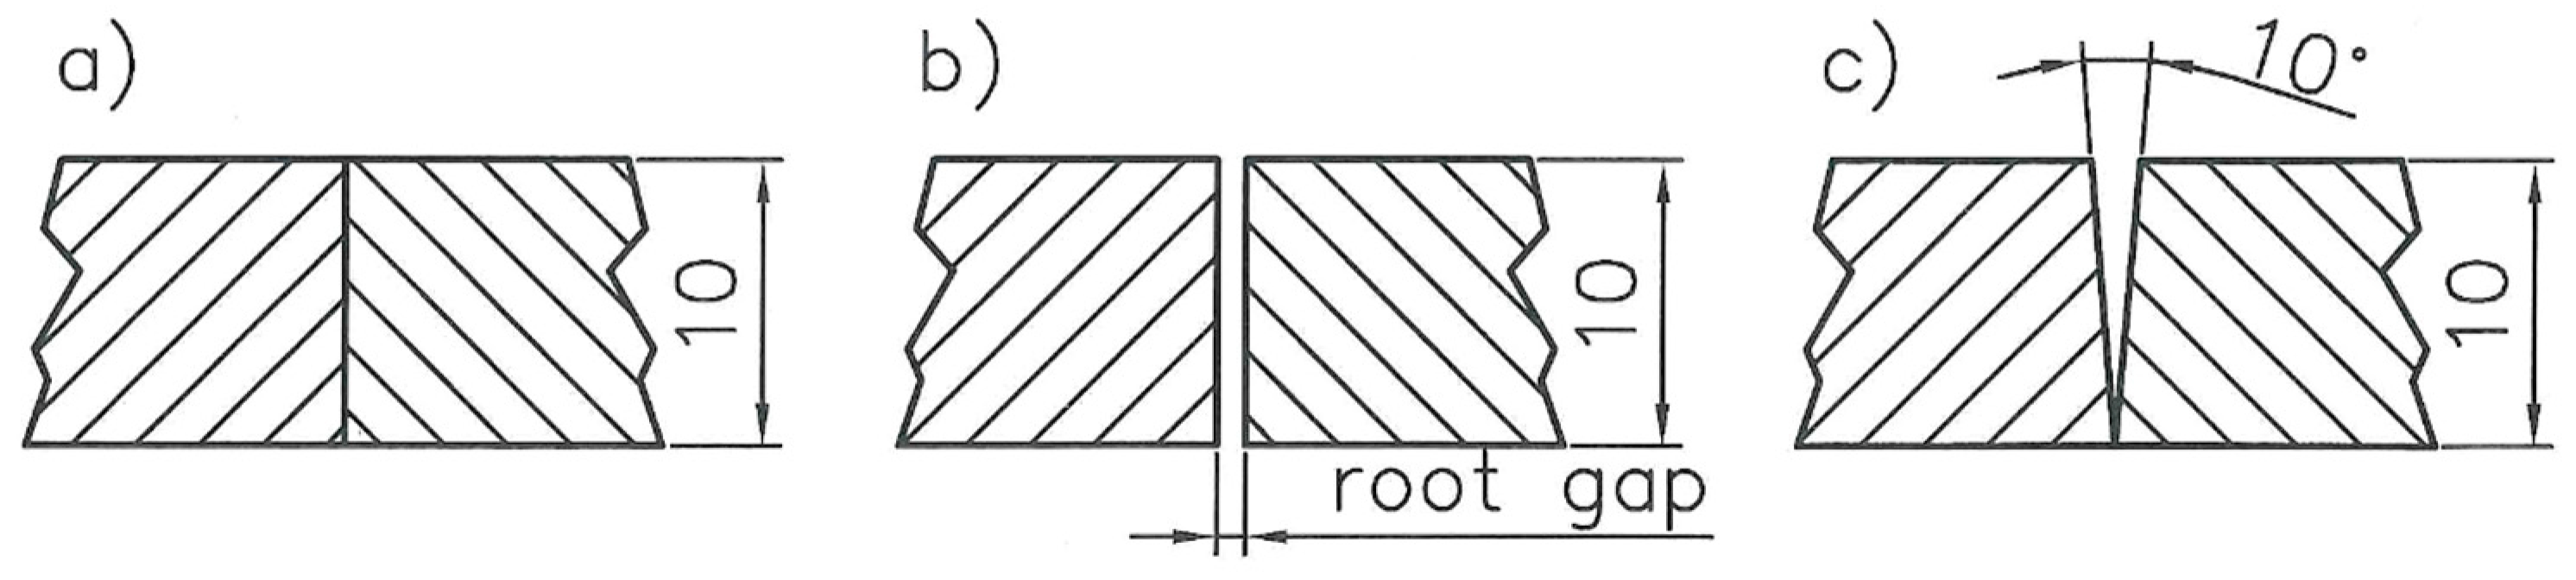
The base material used in the experiments was an austenitic stainless steel grade, AISI 316L, with plate thickness of 10 mm. The test specimens for the welding tests were rectangular pieces 150 mm in width and 300 mm in length. Preparation of the fusion faces of the joints was done by machining. Both I- and V-grooves were prepared for the experiments. The test specimens were tack-welded at both ends and in the centre to achieve the required butt joint configurations. In welds with I-grooves, both closed (root gap = 0 mm) and open square (root gap = 0.4 mm and 0.8 mm) configurations were used, Figure 1a,b. In tests with a V-groove, the configuration was 10-degree groove angle, closed gap and without root face, Figure 1c. The nominal cross-sectional groove area for the 0.4 mm and 0.8 mm open square configurations and the V-groove configuration is 4 mm2, 8 mm2 and 8.6 mm2, respectively. The filler material used was a type 2205 duplex stainless steel filler wire (Ø 1.0 mm) that has an over-matched chemical composition compared to the base material. The exact chemical composition of the base and filler material is given in Table 1.
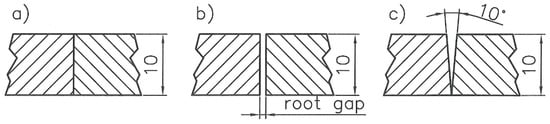
Figure 1.
Butt-joint configurations used in the experiments: (a) Closed square (root gap = 0 mm); (b) open square (root gap = 0.4 mm and 0.8 mm); and (c) V-groove with 10-degree groove angle, closed gap and without root face.

Table 1.
Chemical composition of the base (AISI 316L) and filler (2205 duplex) material.
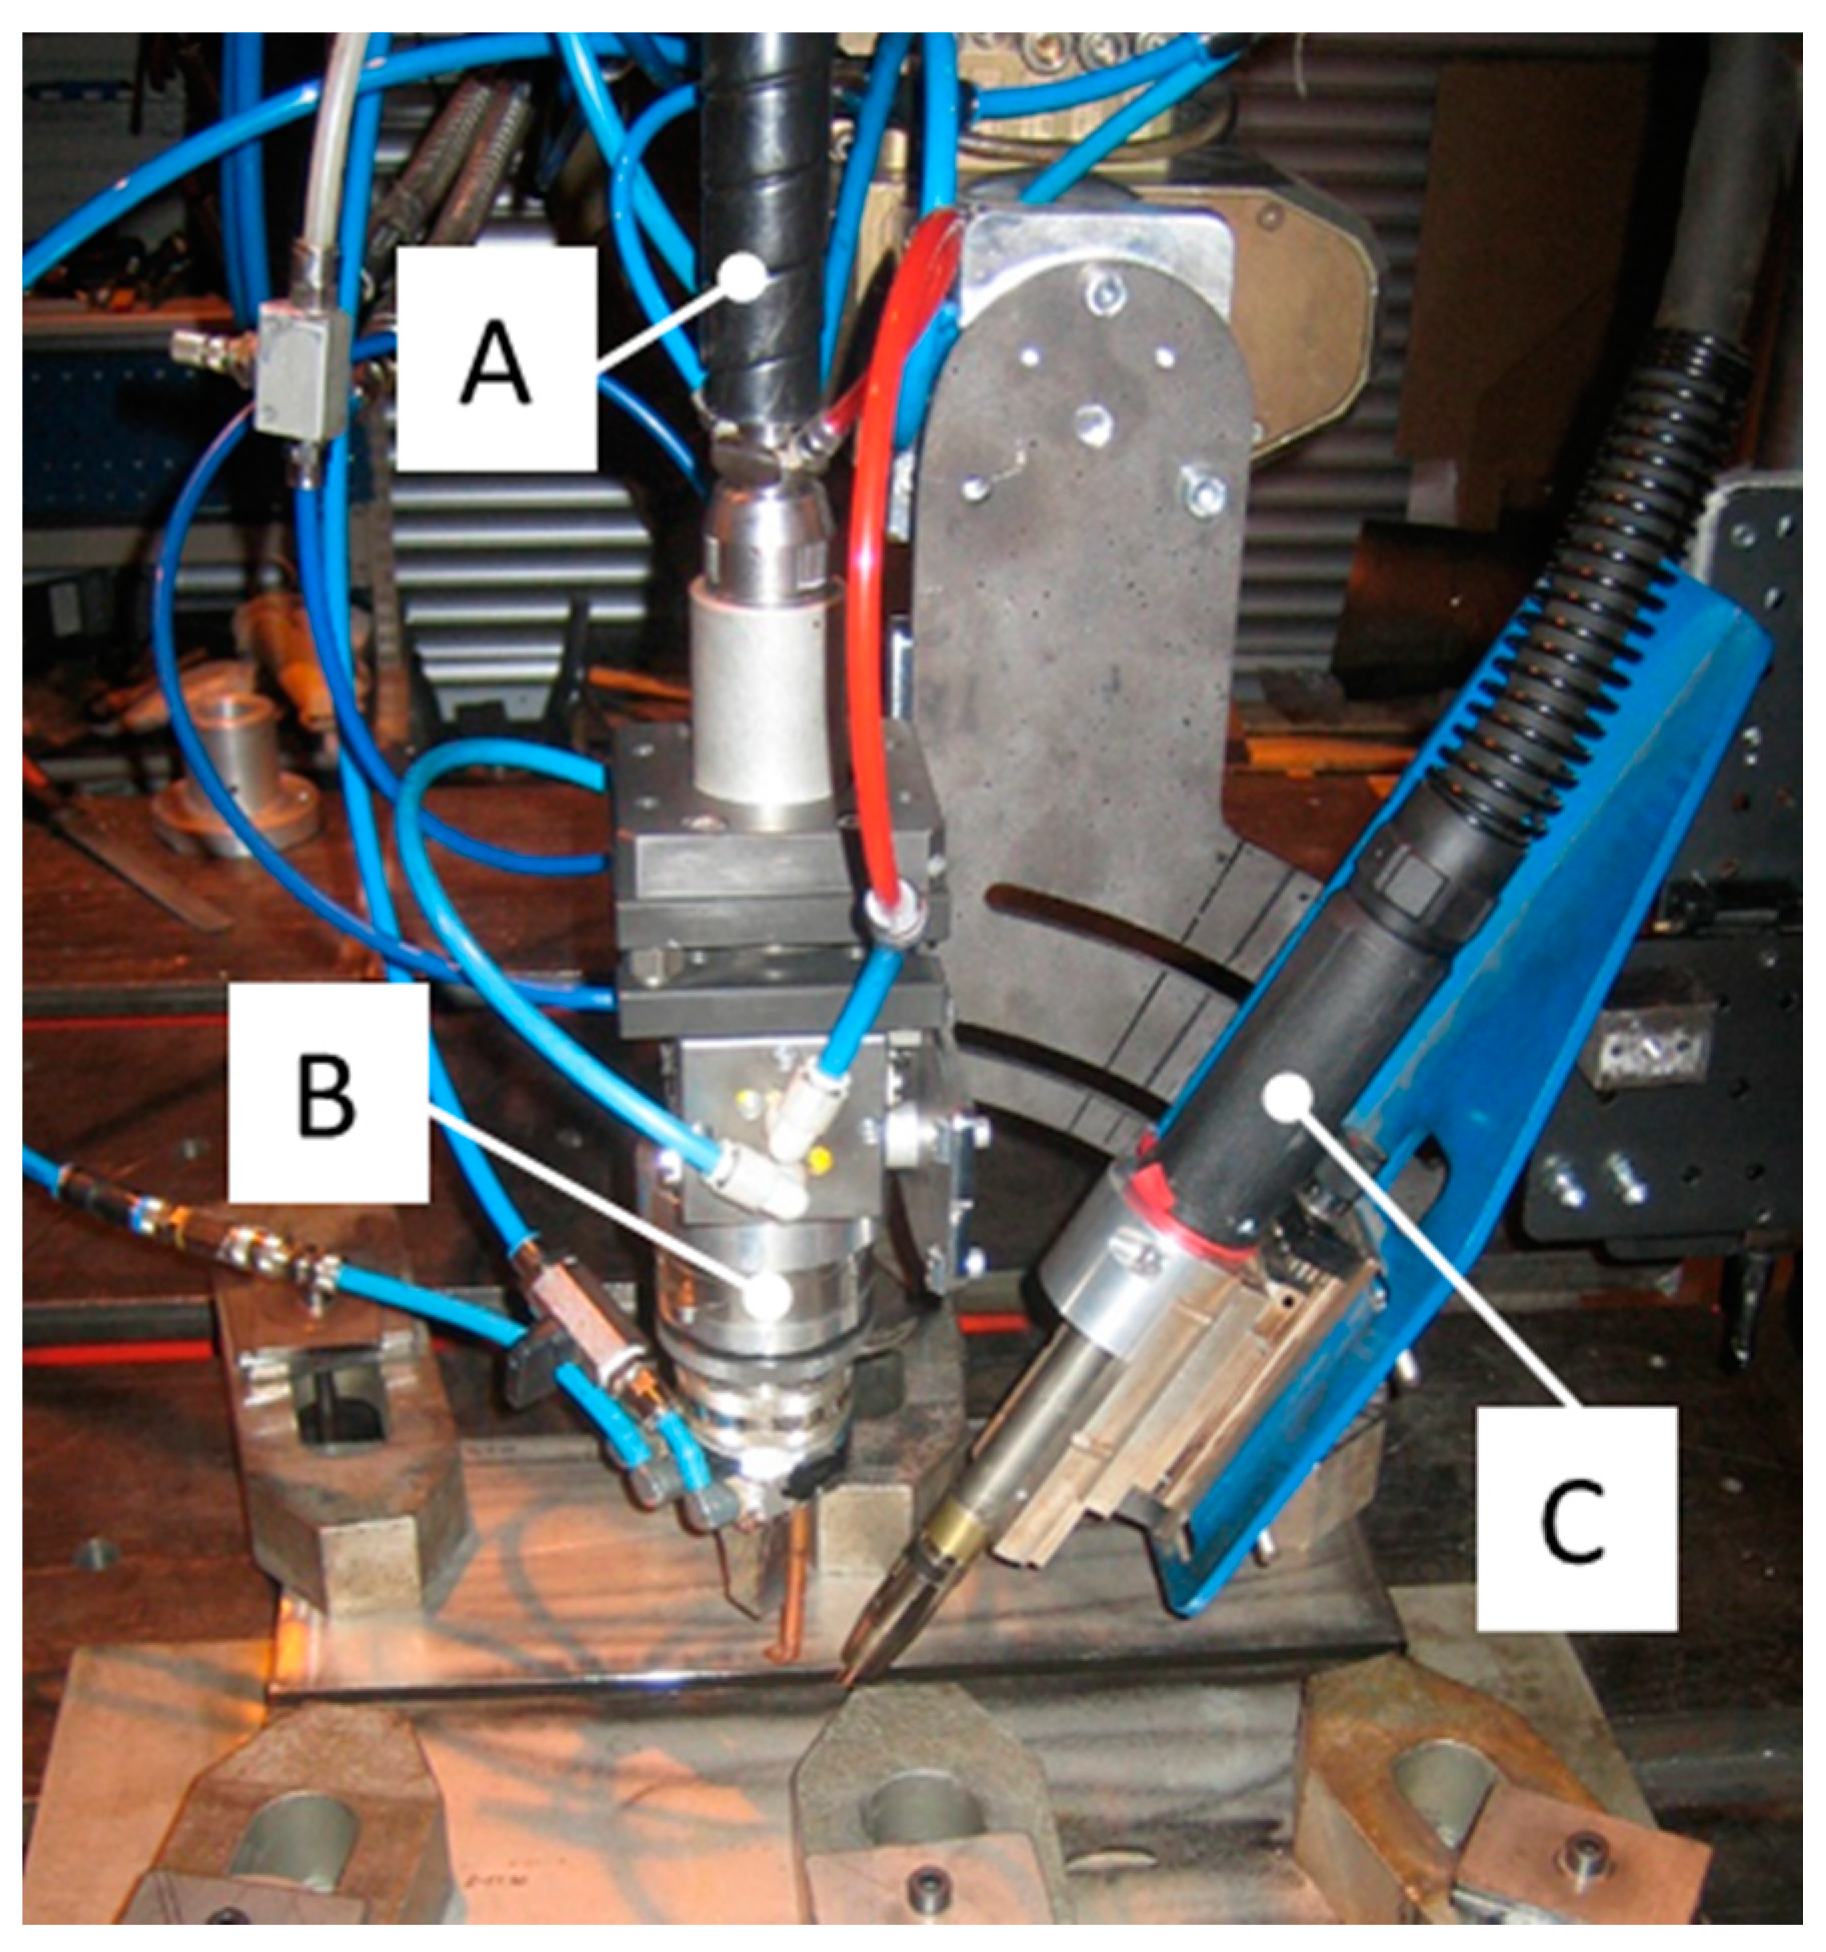
The welding equipment used in the laser-arc hybrid and laser cold-wire welding experiments was an IPG 10 kW YLS-10000 (IPG Inc., New York, NY, USA) fibre laser and a Kemppi Pro 5200 (Kemppi Oy, Lahti, Finland) gas metal arc welding (GMAW) machine. In the laser cold-wire tests, the filler wire was guided through the same GMAW torch as used in the laser-arc hybrid experiments. A grounding cable shoe was disconnected from the fastening table to enable the use of cold-wire welding. Beam delivery from the laser source to the welding station and welding head was with a process fibre of 200 µm core diameter. The welding head was a laser welding head-unit from Kugler GmbH with copper metal optics and an adjustable GMAW torch unit. The optical system of the Kugler laser welding head consisted of 120 mm collimation and 300 mm focusing lenses. The optical set-up can provide a focal spot diameter of 500 µm. The laser system enables a beam parameter product of 7.1 mm × mrad and a Rayleigh length of 13.86 mm. A custom-built gantry-based X/Y/Z- linear movement station was used to execute the required welding movements. Figure 2 shows the welding head set-up attached to the linear movement station.

Figure 2.
Welding head set-up used in the laser-arc hybrid and laser cold-wire experiments. (A) process fibre with connector; (B) laser welding head-unit; (C) adjustable gas metal arc welding (GMAW) torch unit.
Experiments consisted of sets of single-pass test welds made on 10 mm thick butt-joints in flat position using laser-gas metal arc (GMA) hybrid welding and laser cold-wire welding. The shielding gas used is commercially available mixture for welding of stainless steels. It contained a mixture of Ar + 2% CO2 + 30% He and was supplied via an arc torch with the flow rate of 24 L/min. Pulsed current GMAW was deployed in the laser-arc hybrid experiments. Table 2 presents the welding parameters used.
Table 2.
Welding parameters in the laser-arc hybrid and laser cold-wire welding experiments.
The objective of the experiments was to gain information about filler metal mixing behaviour in laser-arc hybrid and laser cold-wire welding of thick sections by comparing the effects of wire feeding orientation and groove cross-section. The welding tests included the following parameter combinations (A and B):
- (A)
- Wire feeding orientation with respect to the laser beam and welding direction
- A1 = leading wire feeding
- A2 = trailing wire feeding
- (B)
- Groove type / width of root gap
- B1 = I-groove, closed gap = 0 mm
- B2 = I-groove, open gap = 0.4 mm
- B3 = I-groove, open gap = 0.8 mm
- B4 = V-groove with 10 degree groove angle, closed gap = 0 mm
Welding speed and filler wire feeding rate were determined based on the four different groove cross-sections used. Filler wire feeding rates have to match the volume of the used groove type. Welding speed values were set to balance full joint penetration and good root side formation.
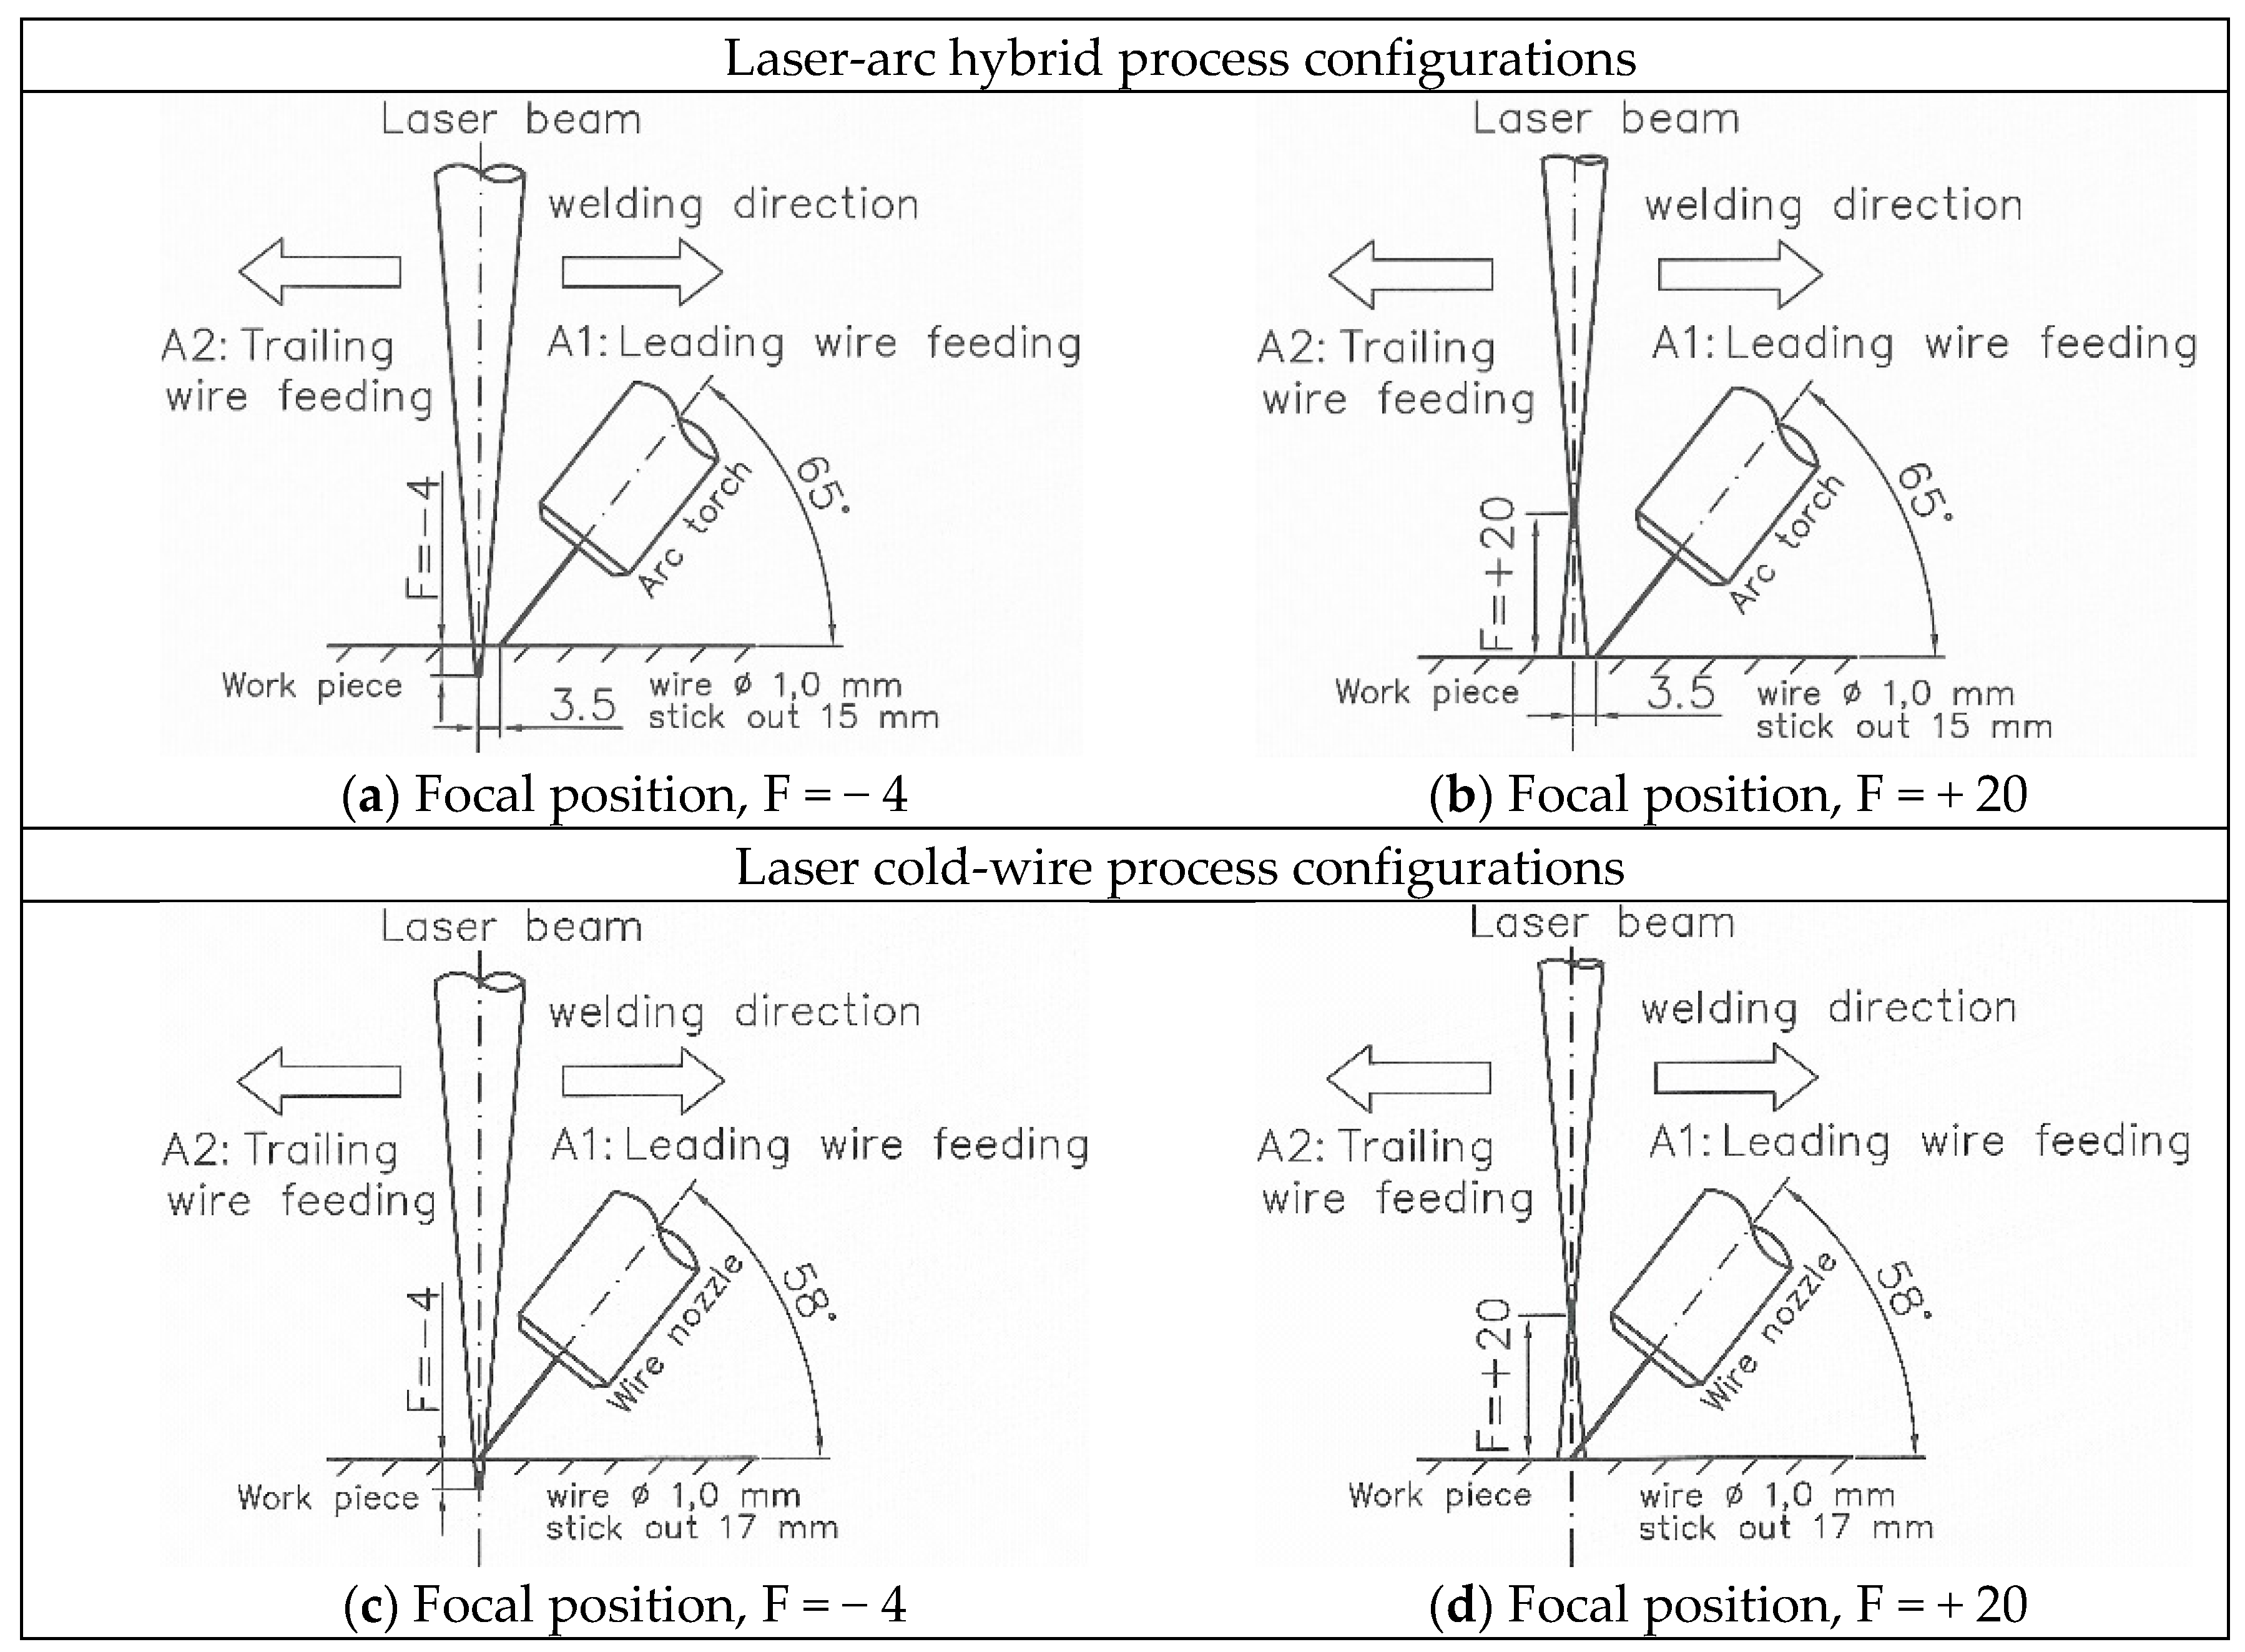
Table 3 summarizes the welding parameter combinations used in the laser-arc hybrid and laser cold-wire welding tests. Figure 3 presents schematic descriptions of the configuration set-up of the laser beam and filler wire arrangement and alignment in the laser-arc hybrid and laser cold-wire welding experiments. The horizontal distance between the laser beam spot and arc (DLA) or wire tip (DLW) was 3.5 mm for the laser-arc hybrid process and zero for the laser cold-wire welding, respectively. The above-mentioned distances were chosen according to previous experiences gained from the corresponding experiments: In laser-arc hybrid welding, use of a short DLA (2–4mm) was observed to ensure robust process behaviour and produce lesser welding spatters. In order to secure fluent wire melting in laser welding with cold-wire process, however, wire is advisable to feed direct into the laser beam spot that is produced on the work piece surface. Test welds with 0.8 mm wide root gap (groove type B3) showed that the laser spot diameter had to get wider in order to ensure proper melting of the fusion faces of the groove. Consequently, a defocused laser beam (F = +20 / beam spot diameter ~ Ø 1.2 mm) was used in the welding experiments with parameter combinations A1 + B3 and A2 + B3 (Table 3). Figure 3b,d show the defocusing configurations with focal point position set to 20 mm above the test piece surface for the laser-arc hybrid and laser cold-wire welding experiments, respectively.
Table 3.
Welding parameter combinations in laser-arc hybrid and laser cold wire welding tests and weld identification designation. Abbreviations (A1, A2 and B1–B4) are explained in page 3.
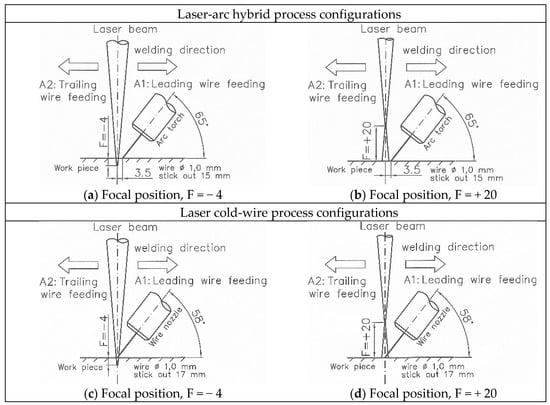
Figure 3.
Set-up of laser beam and filler wire feeding arrangements used in laser-arc hybrid welding (upper row; a,b) and laser cold-wire welding (lower row; c,d). A1 = leading wire feeding. A2 = trailing wire feeding.
The welds produced were cut transversally into specimens for metallographic examination. The cutting locations were in the middle area of the 300 mm long welds in order to ensure that the analysed weld cross-section is from a location where the welding process has already stabilized. During the metallographic preparation, the specimens were ground, polished and electrolytically etched (10% aqueous oxalic acid, 30V/2A/40s) to reveal the macroscopic weld cross-section appearance and weld microstructures. A light microscope was used for metallographic observation of the cross-sectional weld specimens. In addition, EDS analysis of selected weld cross-sections was done using a Hitachi SU3500 scanning electron microscope and a Thermo Scientific Ultradry DSS EDS-detector. Chromium (Cr) was selected as a trace element and its distribution and quantity within the test weld cross-sections were identified using a transverse stepwise characterization and mapping technique. Weld metal Cr-values acquired from the EDS stepwise characterization were compared to known Cr-values of the base metal (17.6 weight-%) and filler metal (22.9 weight-%) to determine the filler metal mixing of each selected test weld (see Equation (1)). For example, if the detected chromium content of a measured point in the weld metal were 17.6 or 22.9 weight-%, the filler metal mixing would be 0 or 100%, respectively. The above relationship is shown in Figure 4, which illustrates how specific chromium weight-% content in the weld metal corresponds to filler metal mixing percent value.
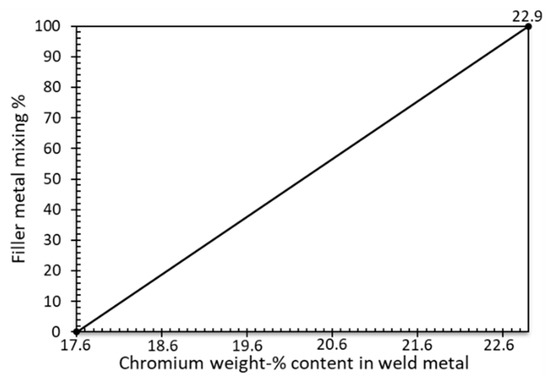
Figure 4.
Relationship between chromium content in the weld metal and corresponding filler metal mixing-%. On the horizontal axis, 17.6 represents chromium weight-% content equal to the base metal and 22.9 is the chromium weight-% content of the filler metal.
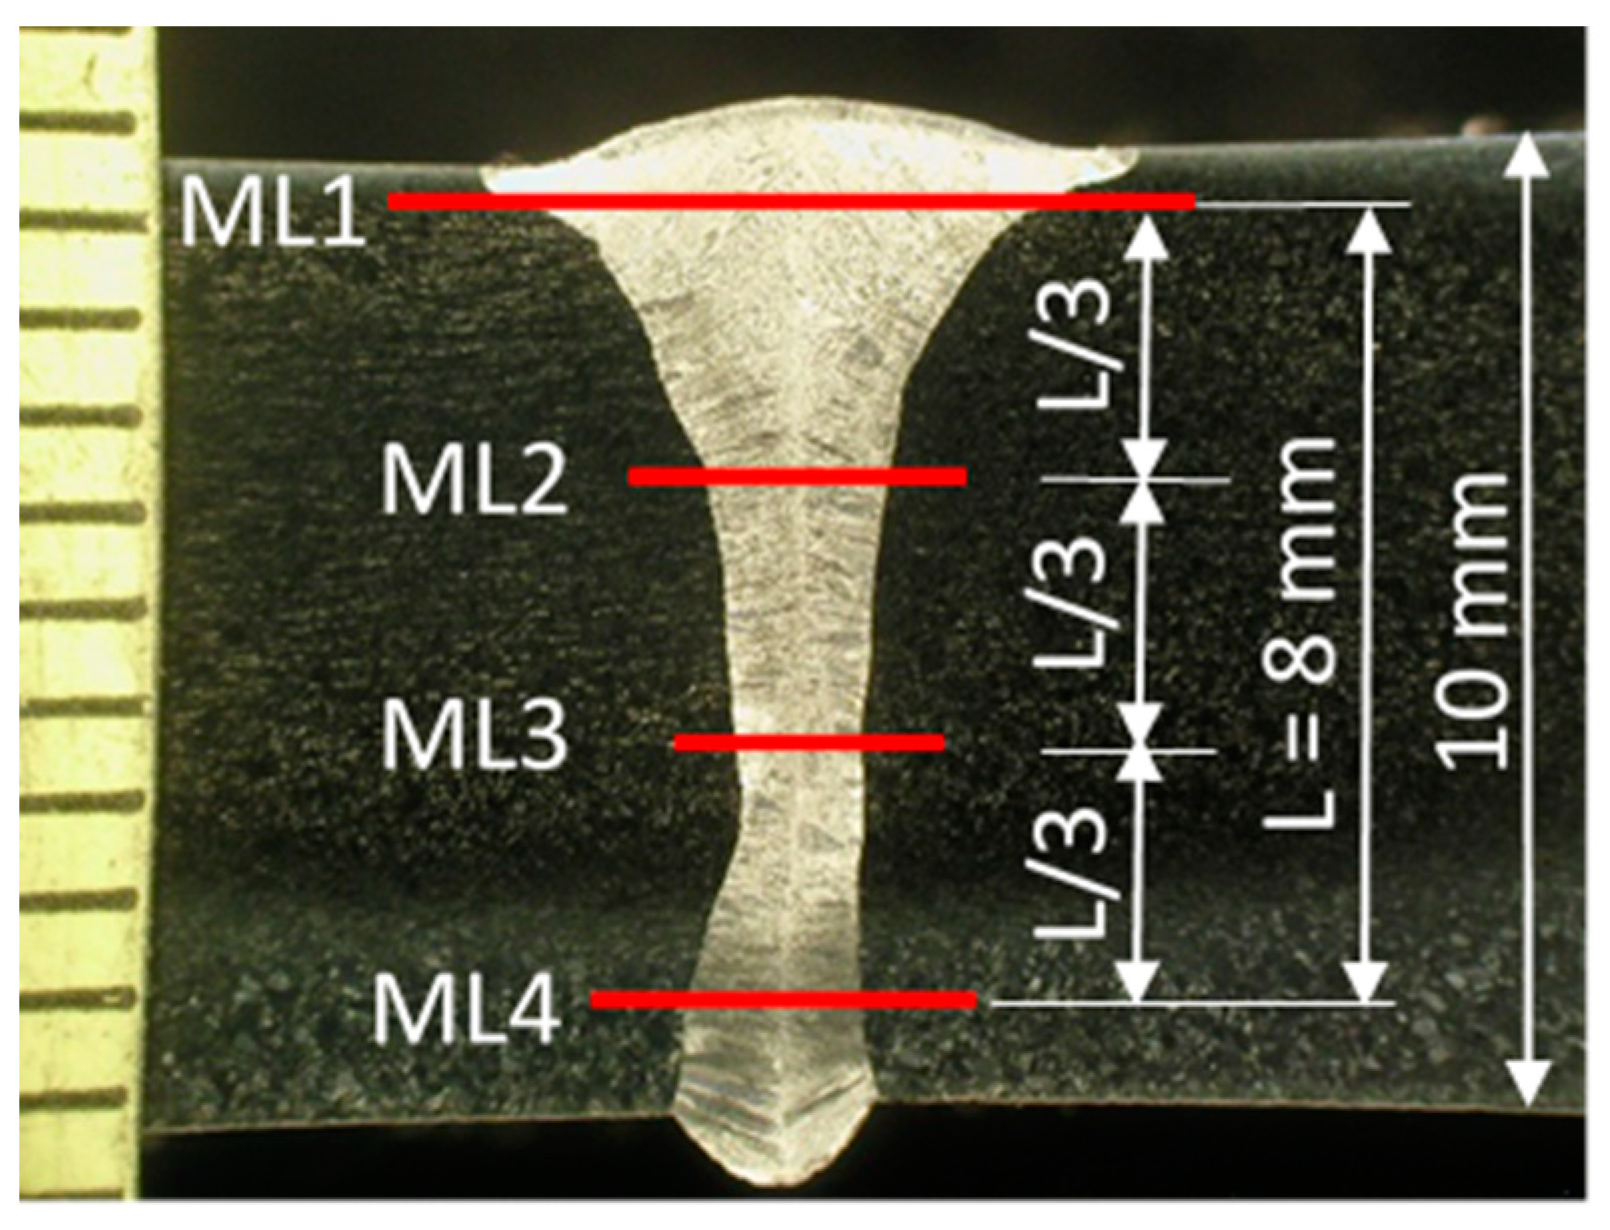
In the EDS stepwise characterization, an acceleration voltage of 20 kV and sampling time of 90 s were used. As the aim was to study weld metal mixing and homogeneity at a macroscopic scale, the measurement “spot” size and step interval within the measurement line were chosen accordingly. Thus, measurement spot size of 40 µm × 60 µm and step interval of 100 µm (distance between individual spots) were used to ensure that an individual measurement spot gave data over several dendrites/dendrite spacing at every step. EDS measurements included four horizontal line segments from each studied weld cross-section sample running transversally across the weld fusion zone. In the vertical direction, the first measurement line segment (ML1) was placed 1 mm below the weld surface while the last measurement line segment (ML4) was near the root portion located 1 mm above the back surface of the test specimen. The other lines (ML2 and ML3) were evenly distributed vertically between lines ML1 and ML4 at intervals approx. 2.7 mm away from each other. Figure 5 presents an example showing the locations of the EDS-measurement lines in the studied weld cross-sections. Line segments had 15–65 measurement points depending on the width of the weld at the measurement location in question. In EDS mapping, the characterizations were done with an acceleration voltage of 20 kV and using a resolution of 256 × 192 pixels. Mapping data was collected until an average 5000 counts per pixel was acquired.
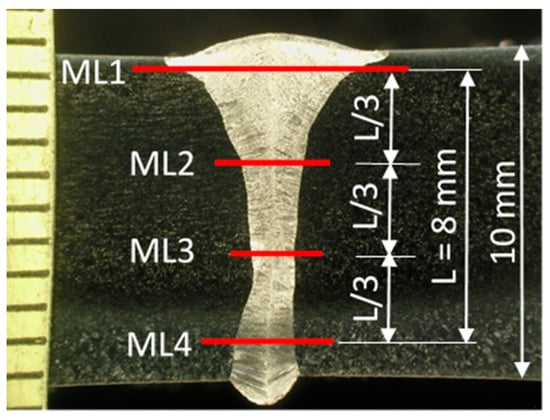
Figure 5.
Example showing transversal EDS-measurement line locations (in red) ML1, ML2, ML3 and ML4 in the studied weld cross-sections.
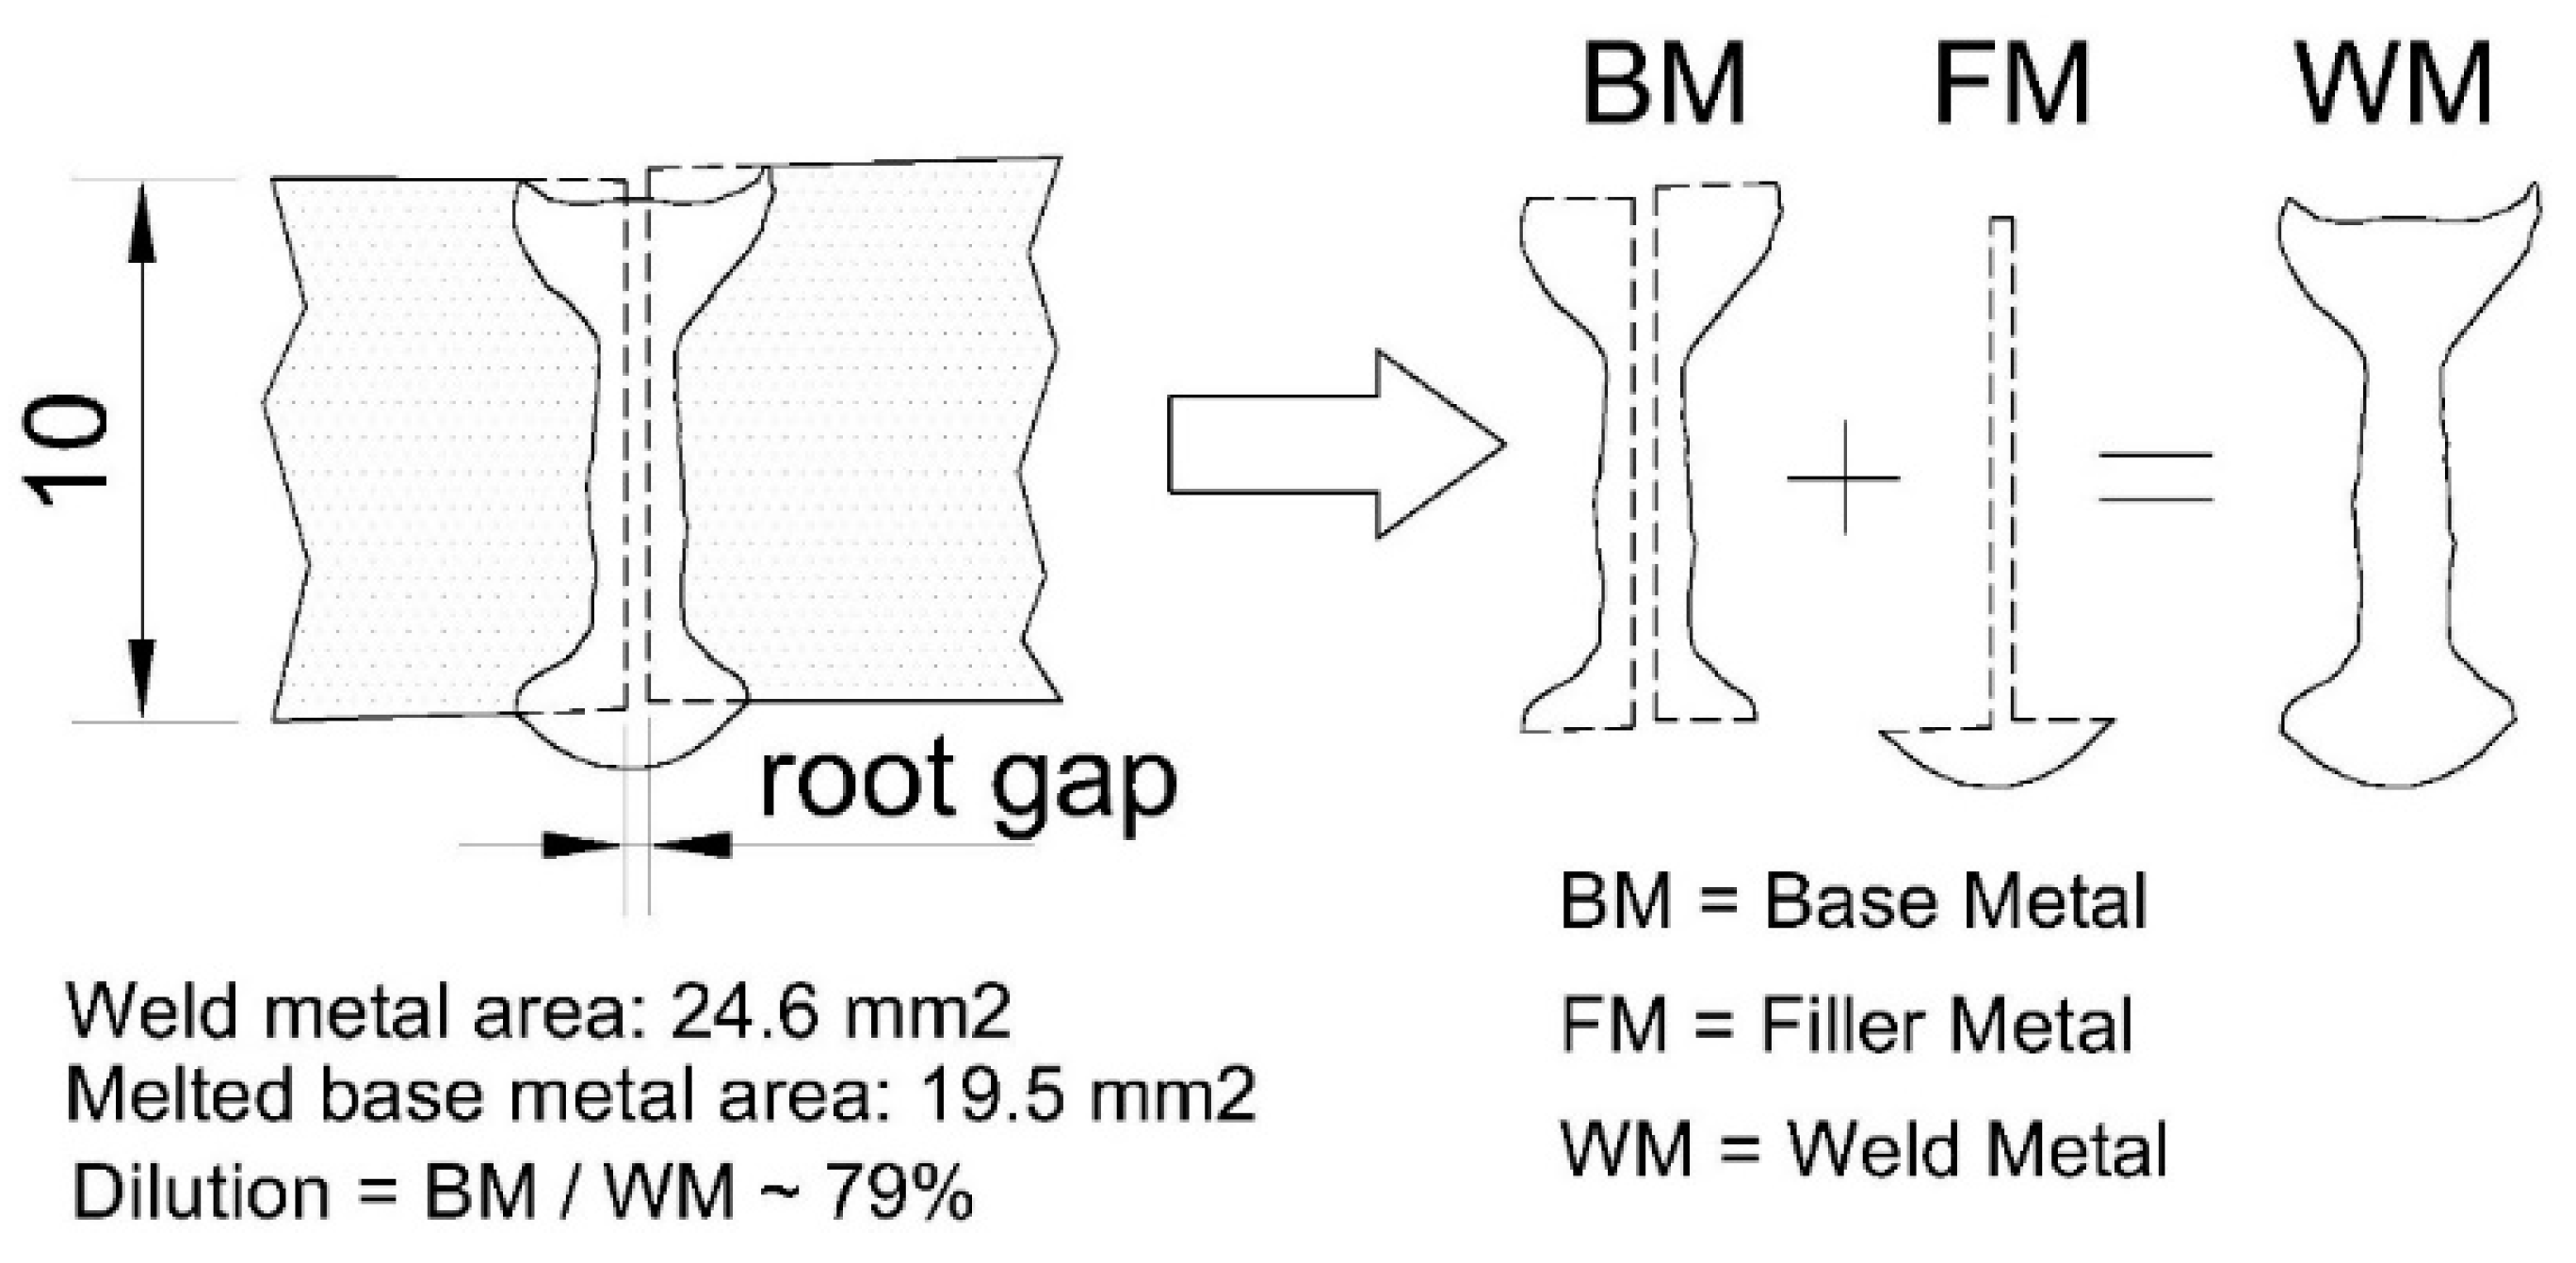
In weldability analysis, dilution is conventionally determined mathematically from the cross-sectional areas of the original joint geometry, melted base metal and weld metal. Dilution ratio is the ratio of the amount of melted base metal to the total amount of fused weld metal [22].
To get a quantitative basis for comparison of the weld cross-sections and to analyse how different groove configurations and wire feeding direction affect the base/filler metal-ratio, the following assessment procedure was used: The weld macrograph cross-sections were converted into CAD-images and the groove geometry superimposed over the original weld cross section. The vertical symmetry axis of the groove was aligned with the centreline of the studied weld cross-section. The cross-sectional areas of the melted base metal, filler metal and weld metal were then defined using area inquiry tools of CAD-software (Autodesk, San Rafael, CA, USA ). An example of the above principle is shown schematically in Figure 6. The figure shows dilution calculation and boundary lines of the defined regions of cross-sectional areas converted from the macrograph of test weld LAH1. Dilution calculation gives a dilution ratio of 79%, which means that the weld metal of test sample LAH1 is estimated to contain 79% base metal and 21% filler metal. Normal practice usually assumes that the proportions of base and filler metal are completely mixed and evenly distributed throughout weld cross-section. In welding of rather thin plate thicknesses in which joint penetration of a single pass weld is around 5 mm or less, this assumption would normally be reasonable but for thick section welding, it may not lead to an appropriate outcome, as will be seen in this work.
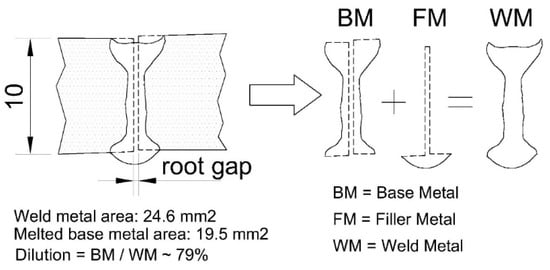
Figure 6.
Example showing the cross-sectional area defined from the macrograph of test weld LAH1.
3. Results and Discussion
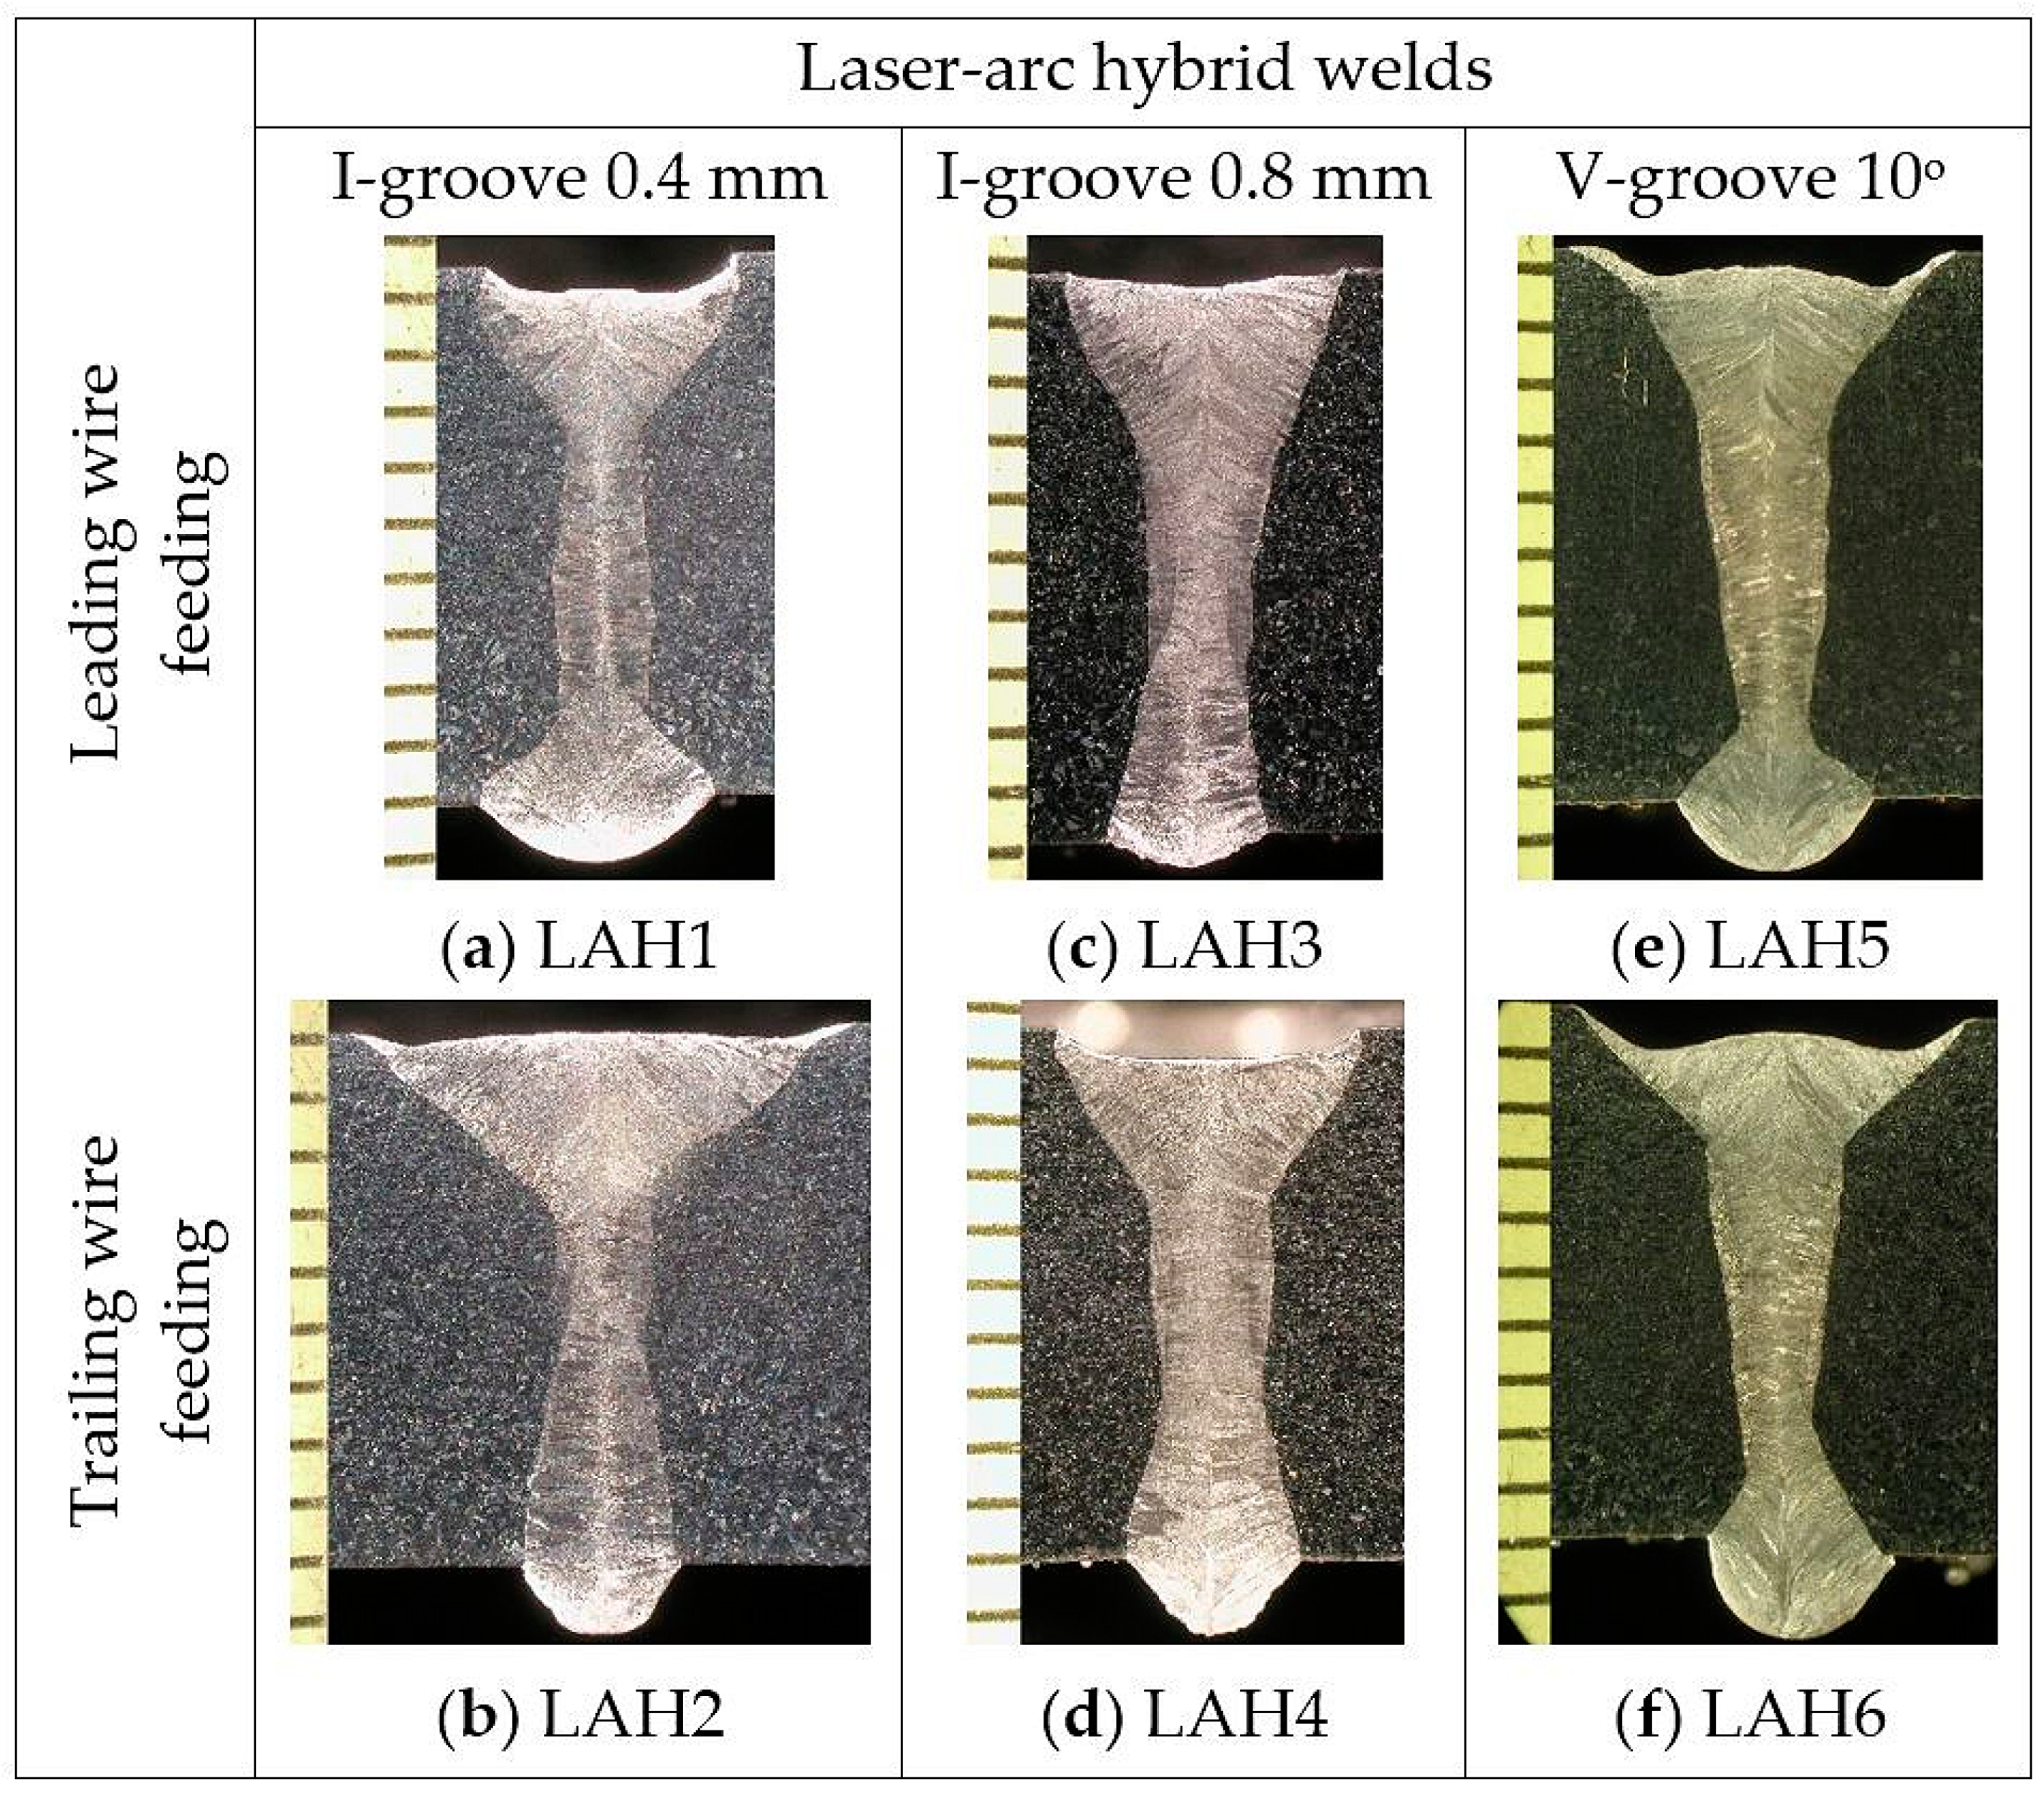
Figure 7 and Figure 8 present weld cross-sections from laser-arc hybrid welding experiments and laser cold-wire experiments, respectively. Table 4 summarizes cross-sectional areas and calculated base/filler metal portions for the laser arc-hybrid and laser cold-wire test welds.
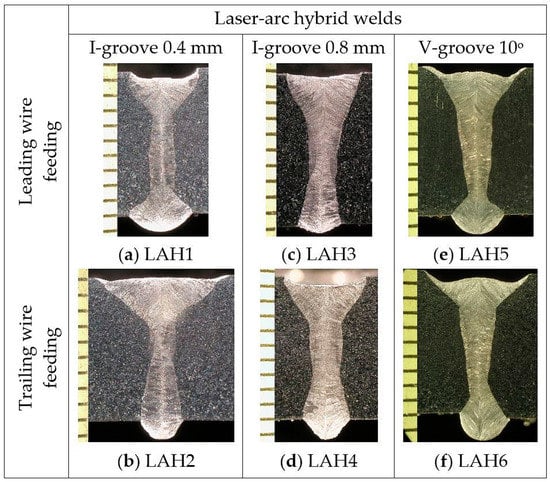
Figure 7.
Weld cross-sections (a–f) from laser-arc hybrid welding tests.
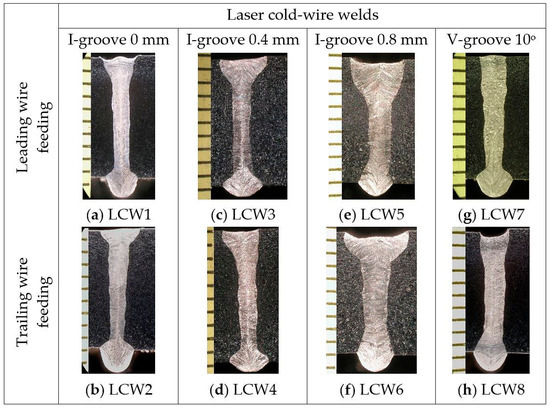
Figure 8.
Weld cross-sections (a–h) from laser cold-wire welding tests.
Table 4.
Summary of cross-sectional areas of laser arc-hybrid (LAH) and laser cold-wire (LCW) test welds. Welding energy input values per weld length [kJ/mm]: LAH1&2 = 0.57; LAH3&4 = 0.77; LAH5&6 = 0.64; LCW1-6 = 0.55; LCW7&8 = 0.46.
When comparing the cross-sectional areas of the weld metal and melted base metal of the test samples made in an I-groove configuration with a 0.4 mm wide root gap and the samples with a V-groove configuration in Table 4, it can be seen that the values are higher for laser arc-hybrid welds than for the corresponding laser cold-wire welds. The higher values result from the higher welding energy and enhanced melting capability of the laser-arc hybrid process. Depending on the wire feeding rate, which was 5, 11.5 and 15 m/min, the gas metal arc process contributes additional welding energy of several kilowatts (2.3/6.7/7.1 kW) compared to laser cold-wire welding process, where the laser beam is the only source of welding energy. It should be noted, however, that there is little difference in the base metal and filler metal proportions in the test welds made in I-groove configuration with 0.8 mm root gap (see LAH3&4 versus LCW5&6 in Table 4). This finding is related to the use of a defocused laser beam for welding the wider root gap of 0.8 mm. Defocusing with a focal point position value of +20 mm produces a Ø~1.2 mm wide laser spot diameter, which is 50% wider than the laser spot diameter used in the other welding trials, where the focal point position value was set to −4 mm (spot Ø 0.8 mm). In the case of the laser cold-wire welding, the use of a wider laser spot diameter results in melting of the base metal over a wider area and consequently there is a broader weld cross-section profile.
3.1. Mixing Behavior in Laser-Arc Hybrid Test Welds
As noted earlier, conventional dilution calculations based on the weld cross-sectional area are not always suitable for thicker weld cross-sections, which motivated more detailed examination of the mixing of the filler metal in the test welds. Mixing in the vertical direction from the weld surface to the root and the uniformity of the mixing, that is, how homogenously the filler metal is distributed across the whole weld cross-section, were of particular interest. EDS mapping and stepwise line characterization were used to reveal possible differences in chromium distribution between the over-alloyed filler metal and base metal.
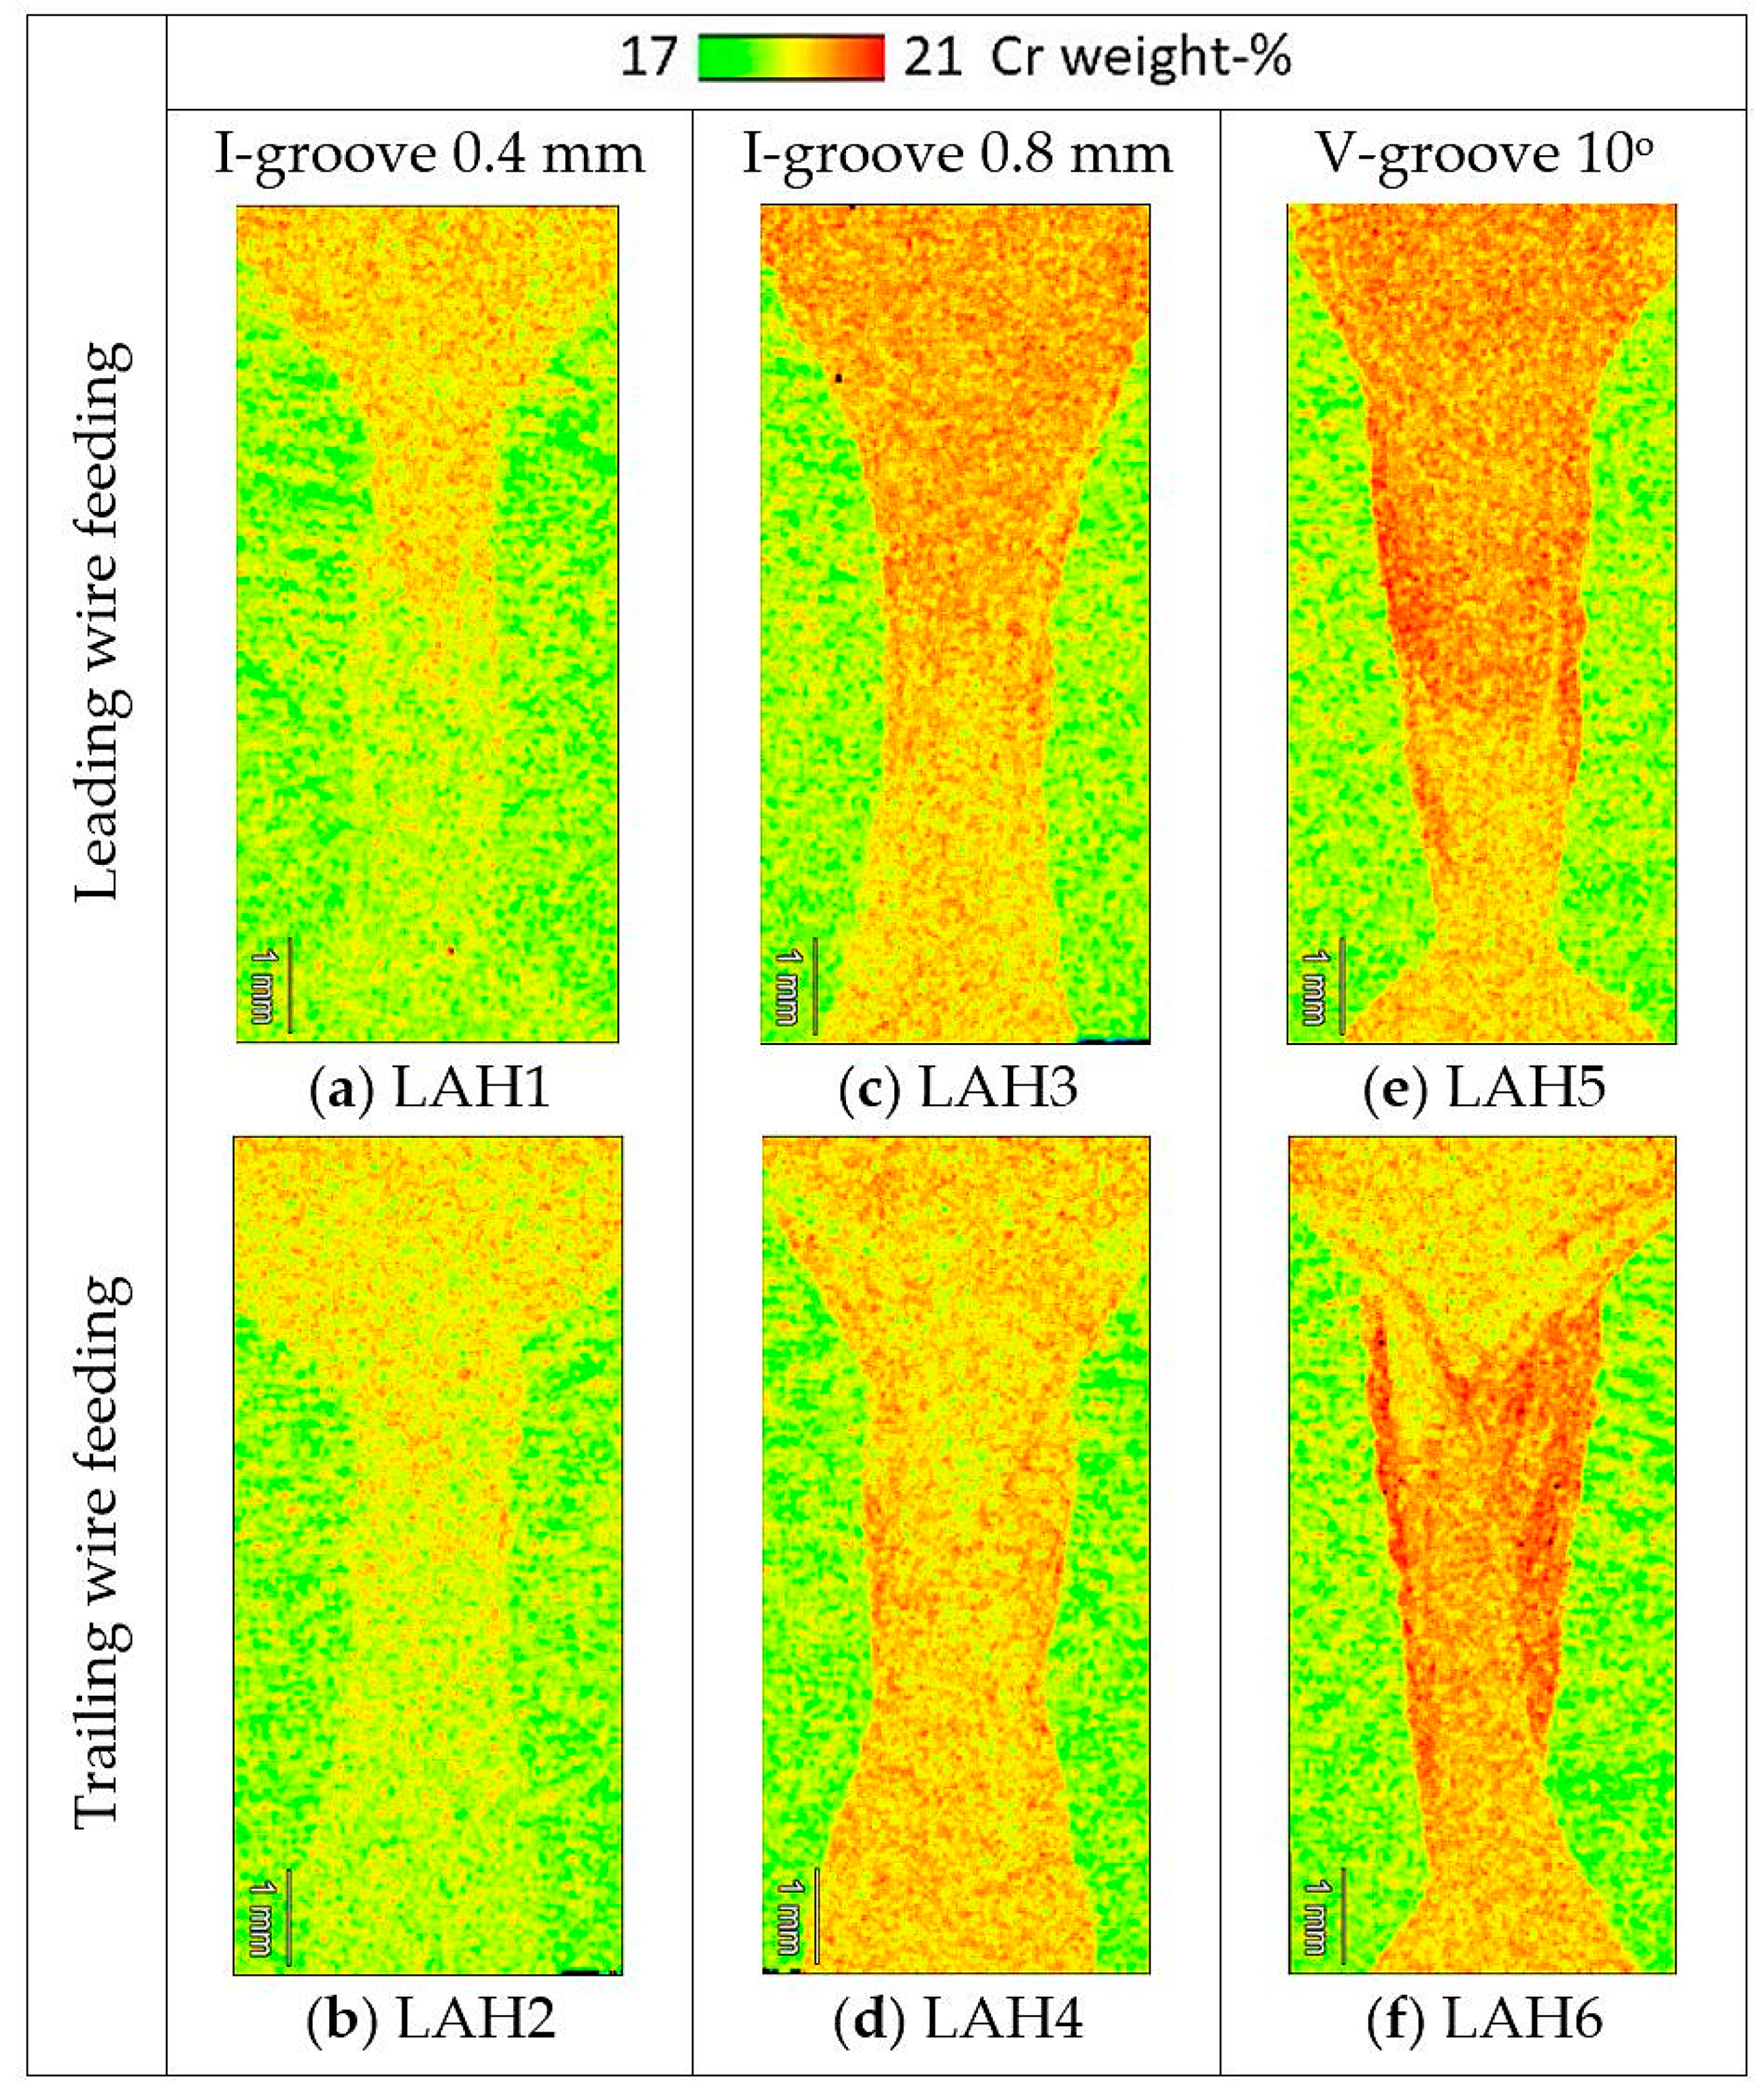
Figure 9 shows EDS mapping results for the laser-arc hybrid test welds. The images show chromium distribution in weight-% for each test weld cross-section. The chromium distribution is visualized using colour contouring. Greenish colours present the chromium weight-% content level of the base metal and dark red shows chromium weight-% content close to that of the filler metal. Yellow and orange colours are chromium weight-% content levels between these extremes. The mixing results from EDS stepwise characterization are presented as transversal filler metal mixing profiles (measurement lines 1 to 4) calculated according to Equation (1). Figure 10 presents tabular data for average values of filler metal mixing determined at the measurement lines ML1–ML4 of the laser-arc hybrid test welds.
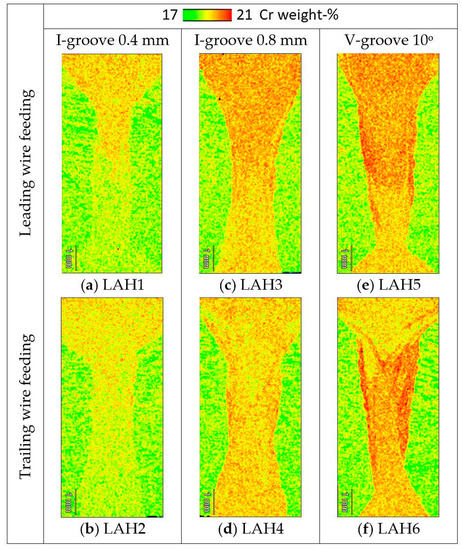
Figure 9.
Energy dispersive spectroscopy (EDS) mapping images (a–f) showing the distribution of chromium in laser arc-hybrid test welds.
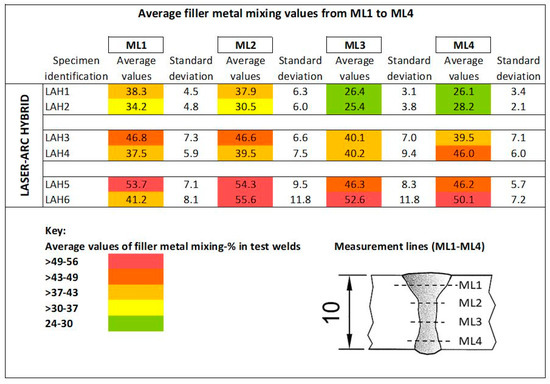
Figure 10.
Average values of filler metal mixing-% from the data of measurement lines ML1–ML4 in laser-arc hybrid test welds.
The images in Figure 9 show a clear difference in filler metal mixing between the weld surface part (upper half) and the weld root part (lower half) of the weld cross-sections of the I-groove weld with 0.4 mm root gap (Figure 9a,b). The same behaviour can be seen for both leading and trailing filler wire feeding. More reddish colour contouring indicates that more intensive mixing has occurred on the weld surface with leading wire feeding; on the other hand, trailing wire feeding seems to have provided slightly better mixing from the weld midsection towards the weld root. Figure 10 shows that the average filler metal mixing-% values of test welds LAH1 and LAH2 are around 38% and 31–34% for the upper half of weld cross-section and ~26% and ~25–28% for the lower half, respectively.
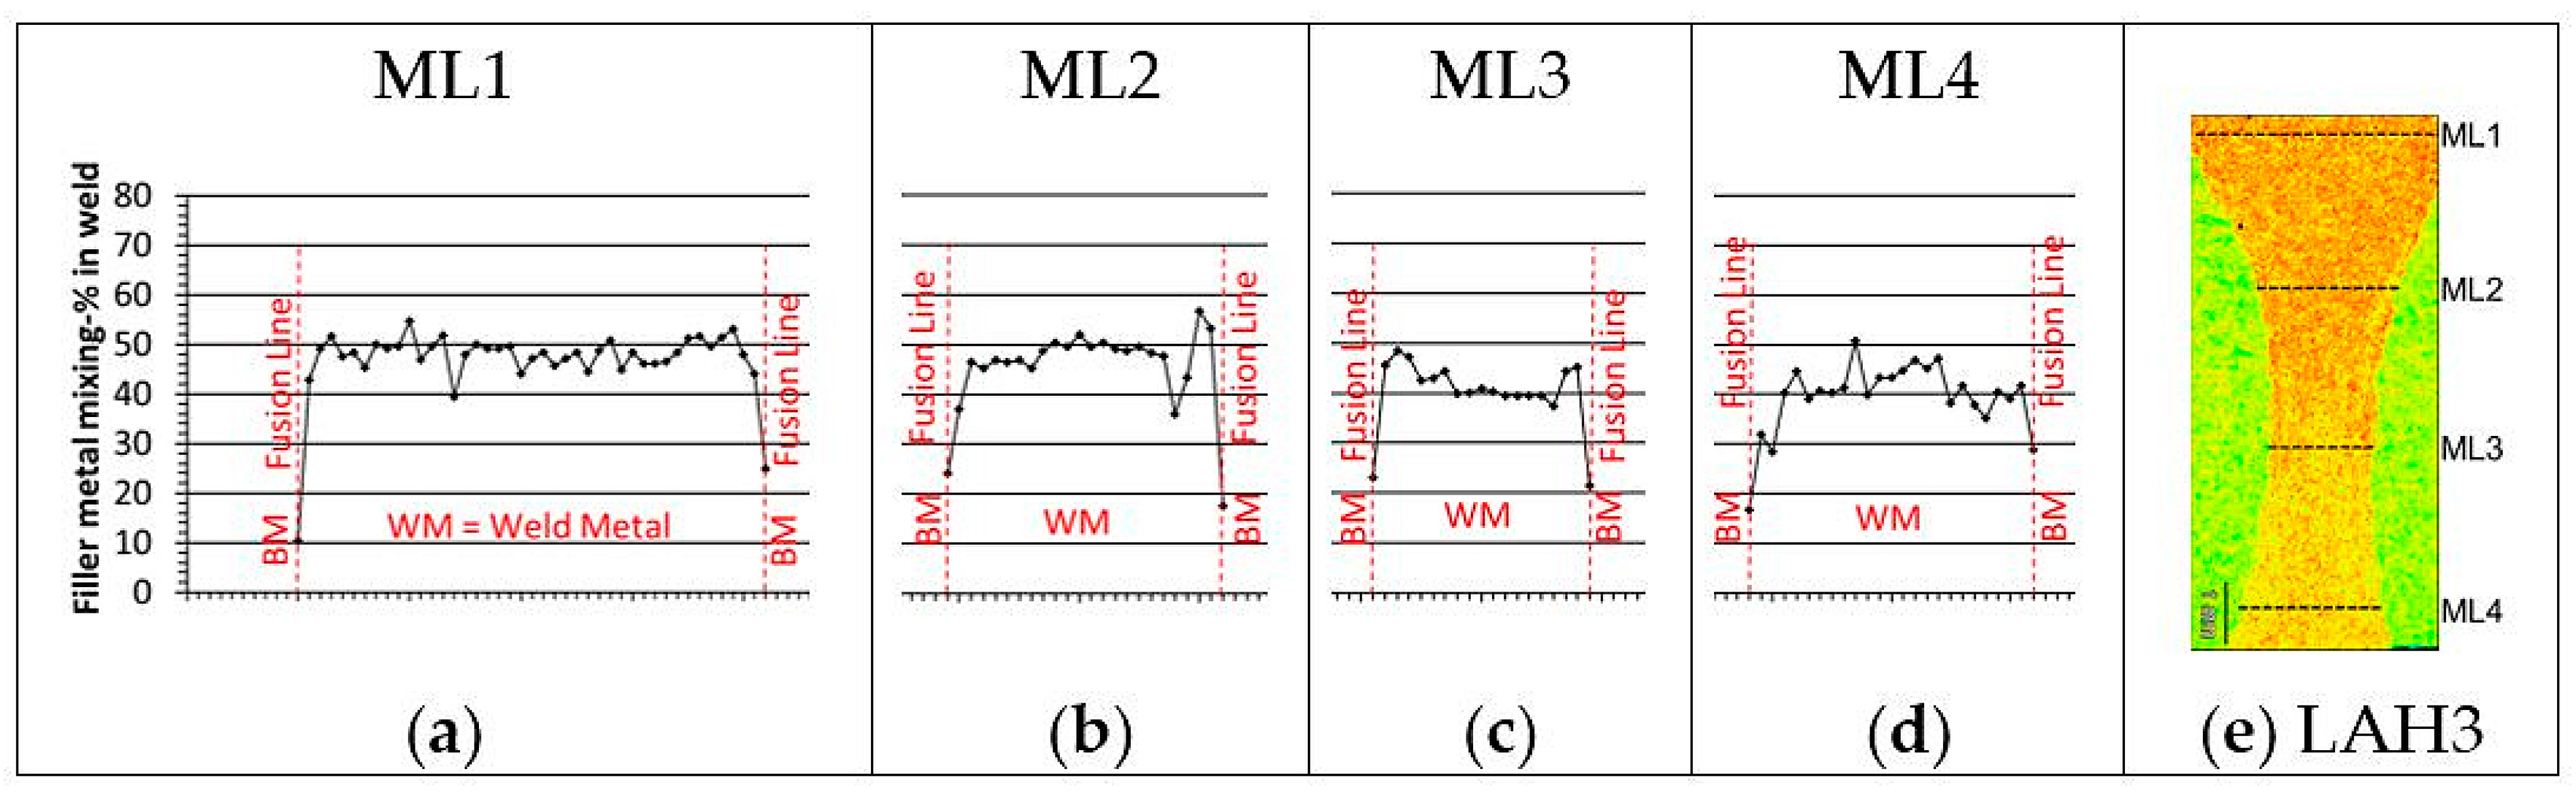
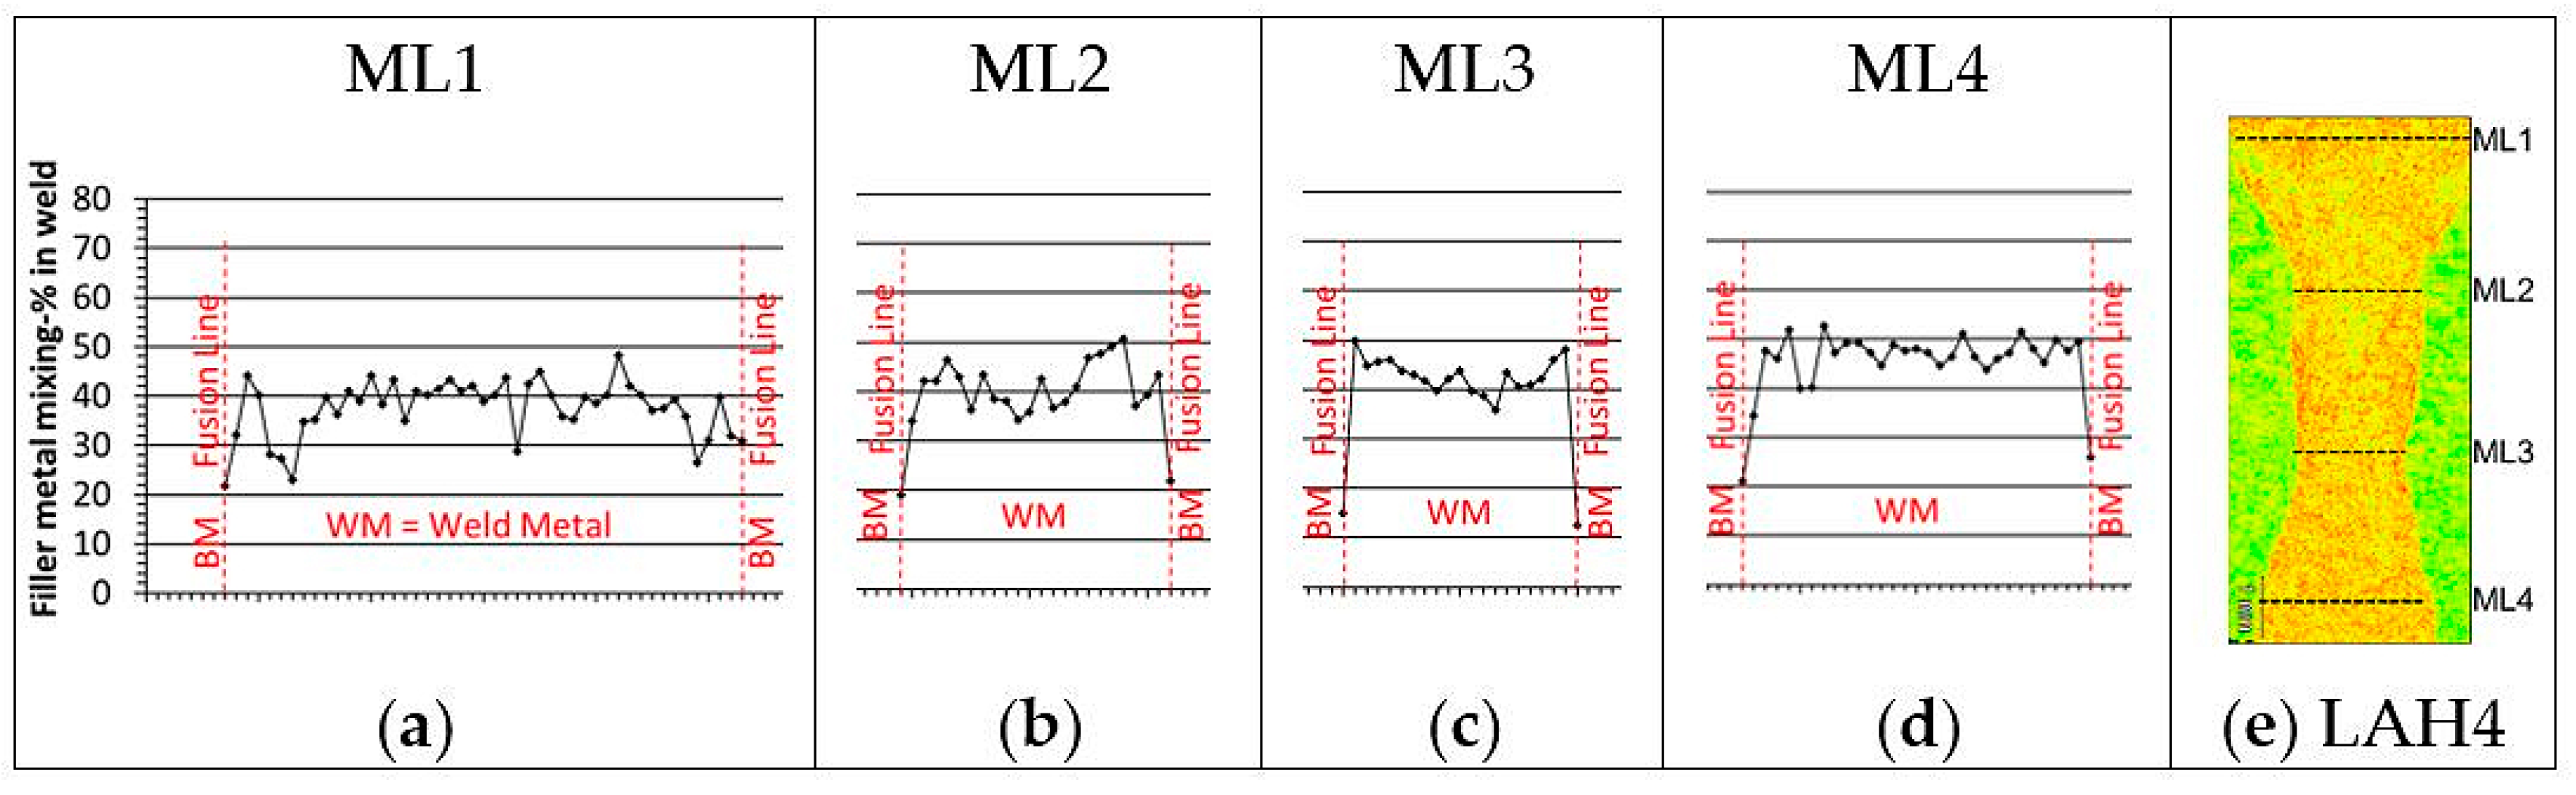
When the root gap is widened from 0.4 mm to 0.8 mm, mixing becomes noticeably better throughout the weld cross-section. The results of both leading and trailing wire feeding with 0.8 mm root gap (Figure 9c,d) show enhanced mixing behaviour across the whole weld cross-section in terms of higher chromium contents and enhanced distribution. The use of trailing wire feeding (Figure 9d) shows slightly better mixing at the weld root portion than leading wire feeding (Figure 9c). Mixing at the weld surface portion of the weld displays the opposite behaviour with slightly better mixing for leading wire feeding. The mixing results from EDS stepwise characterization show the same trend. Average filler metal mixing values in the weld root portion (ML4) of test weld LAH4 (trailing wire feeding) and LAH3 (leading wire feeding) are 46% and 39.5%, respectively (Figure 10). At the weld surface part (ML1), corresponding average values are 37.5% and 46.8%, respectively. If the mixing profiles in Figure 11d and Figure 12d are examined, it can be noticed that the mixing profile at the measurement line 4 (ML4) is smoother in LAH4 than in LAH3. The majority of mixing %-values of ML4 of weld LAH4 are between ~45% and 50%, whereas in weld LAH3 mixing %-values show greater fluctuation and are between ~35% and 45%. The mixing at the weld surface part (upper half) seems, however, to be more homogenous in weld LAH3, which was made with leading wire feeding, than weld LAH4, made with trailing wire feeding. When the mixing profiles of ML2 near the weld surface in Figure 11b and Figure 12b are compared, it can be seen that the mixing profile is smoother and shows less variation in weld LAH3 than weld LAH4. Trailing wire feeding with the laser-arc hybrid process melts more base metal than leading wire feeding (see Table 4) and the observation of less homogenously distributed filler metal in the weld surface part of the weld with trailing wire feeding can be partly attributed to the higher local base metal dilution at the weld surface part of the weld. In Figure 9d, a wedge-shaped fusion area can be seen near the weld surface. The inside area and tip of the wedge contain spots of green and yellowish colours indicating chromium content levels of the base metal.
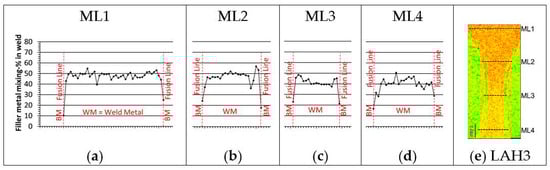
Figure 11.
Filler metal mixing results from EDS stepwise characterization. (a–d) Filler metal mixing-% profiles of measurement lines 1–4 (ML1–ML4) from test weld LAH3 (e). In figures (a–d) one step between adjacent measurement points in the horizontal axis equals 100 micrometres.
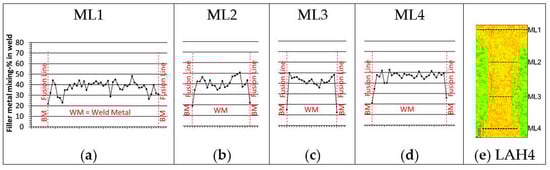
Figure 12.
Filler metal mixing results from EDS stepwise characterization. (a–d) Filler metal mixing-% profiles of measurement lines 1–4 (ML1–ML4) from test weld LAH4 (e). In figures (a–d) one step between adjacent measurement points in the horizontal axis equals 100 micrometres.
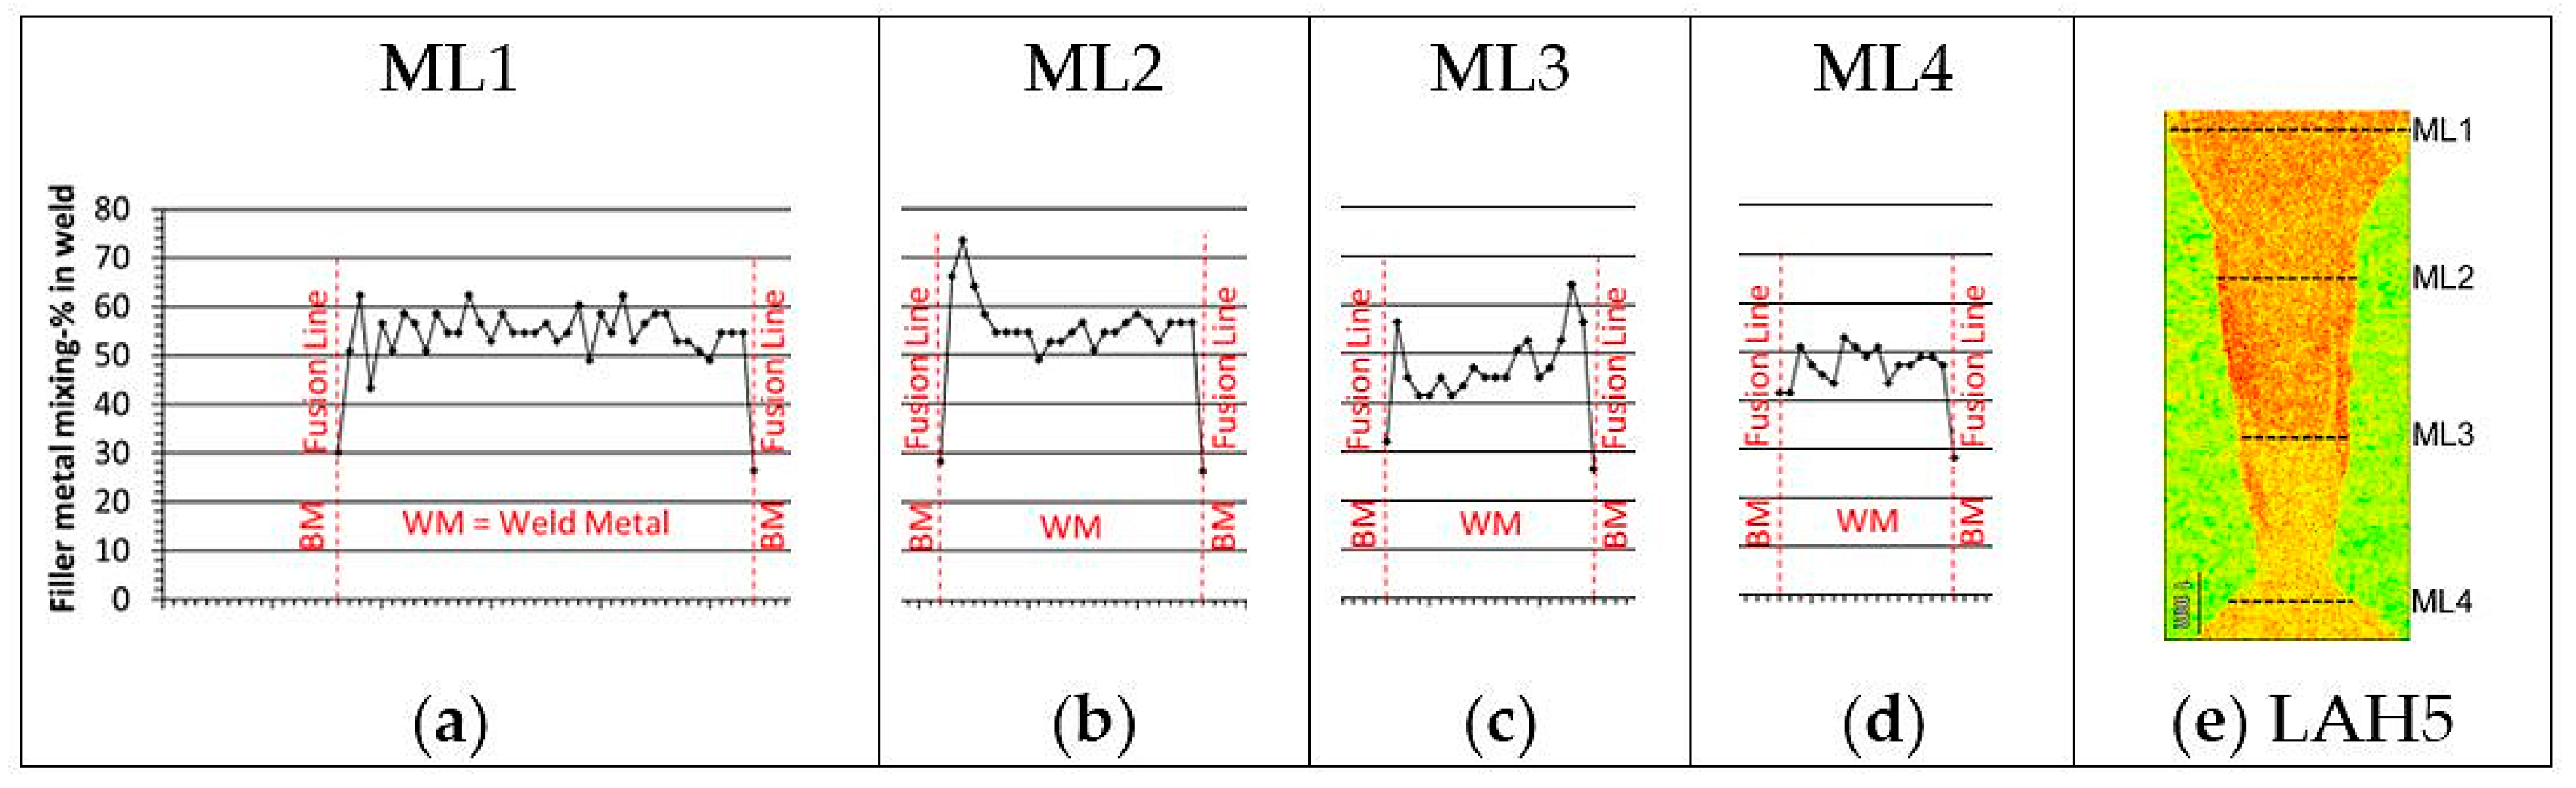
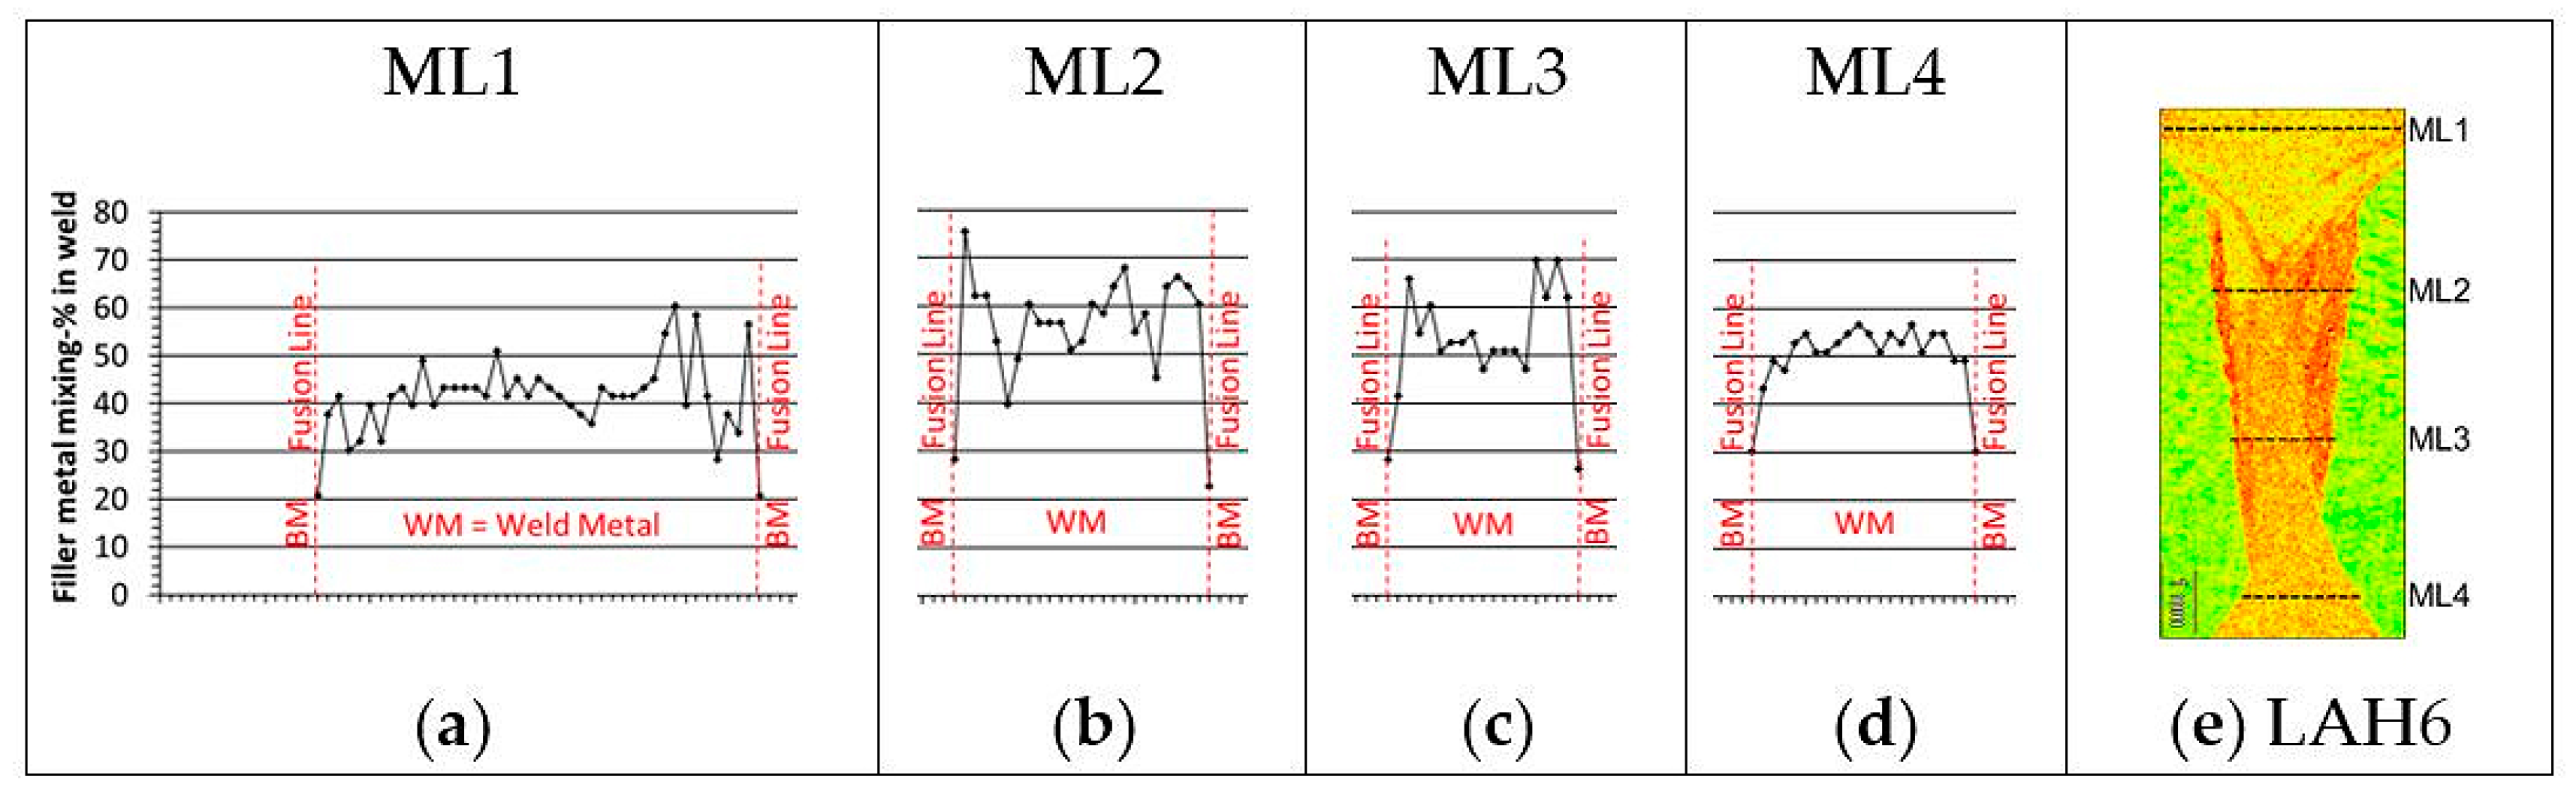
When laser-arc hybrid welds were produced in single-pass V-groove configuration, average filler metal mixing values of measurement lines ML1 to ML4 had the highest mixing values of the laser-arc hybrid test welds. From Figure 10, it can be seen that in weld LAH5, which was made using leading wire feeding, the average filler metal mixing values are ~46% at the bottom part of the groove area (ML3 and ML4) and ~54% at the surface part (ML1 and ML2). The test weld LAH6, which was made using trailing wire feeding, shows ~56% average mixing level values at one third thickness of the joint (ML2) and when measuring deeper in the joint at ML3 and ML4, average values were ~53% and 50%, respectively. When examining Figure 9e and particularly Figure 9f, it can be noticed that chromium as regards weight-% is not homogenously distributed in the mid-section area of both weld LAH5 and LAH6. Red and orange colours indicating high chromium weight-% levels can be clearly seen near the fusion lines at the mid-thickness range of both welds. The filler metal mixing profiles of weld LAH5 and LAH6 in Figure 13 and Figure 14 support the above observation. Large spikes can be seen in the mixing profiles of Figure 13b,c and Figure 14b,c with high local values of 60–75% in the mid-thickness area of weld cross-sections LAH5 and LAH6. In addition, it can be seen that test weld LAH6 has similar mixing behaviour near the weld surface as earlier described in test weld LAH4. Both weld LAH6 and LAH4 were produced using trailing wire feeding.
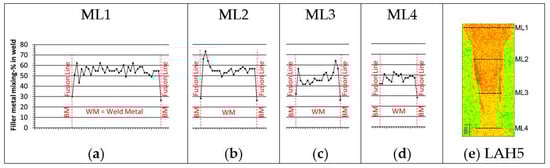
Figure 13.
Filler metal mixing results from EDS stepwise characterization. (a–d) Filler metal mixing-% profiles of measurement lines 1–4 (ML1–ML4) from test weld LAH5 (e). In figures (a–d) one step between adjacent measurement points in the horizontal axis equals 100 micrometres.
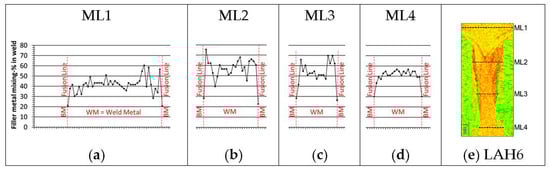
Figure 14.
Filler metal mixing results from EDS stepwise characterization. (a–d) Filler metal mixing-% profiles of measurement lines 1–4 (ML1–ML4) from test weld LAH6 (e). In figures (a–d) one step between adjacent measurement points in the horizontal axis equals 100 micrometres.
As a whole, test welds LAH3 and LAH4 exhibited the best overall results of the laser-arc hybrid test welds, corresponding to homogenous filler metal distribution throughout the whole weld cross-section. If intensive and homogenous mixing in the root portion is preferred, test weld LAH4 with trailing wire feeding showed more even mixing behaviour than test weld LAH3.
Sohail et al. [17] used modelling and simulations in mixing and fluid flow studies for full penetration laser-gas metal arc hybrid welding of 10 mm thick closed butt-joints with leading and trailing torch configuration. In their studies, the longitudinal sections of the simulated weld pool showed different behaviour of flow patterns and temperature contours between the trailing and leading torch. In the leading torch configuration, the modelling results indicated a solidifying peninsula growing horizontally at the mid-thickness range of weld pool, which partly sectioned the melt pool to upper and lower half. The mentioned solidification peninsula may obstruct the circulation of the melt flow between the weld surface and root, which in turn may reduce the mixing of weld metal. This melt pool behaviour with solidification peninsula was not seen in the trailing torch simulations. Consequently, with the trailing torch configuration the mixing at the root portion of weld was observed to be more intensive than with the leading torch. The mentioned observations in the reference [17] may also explain why the trailing wire feeding results of laser-arc hybrid experiments presented in this work showed enhanced mixing behaviour near the weld root portion compared to the corresponding results achieved with the leading wire feeding.
3.2. Mixing Behavior in Laser Cold-Wire Test Welds
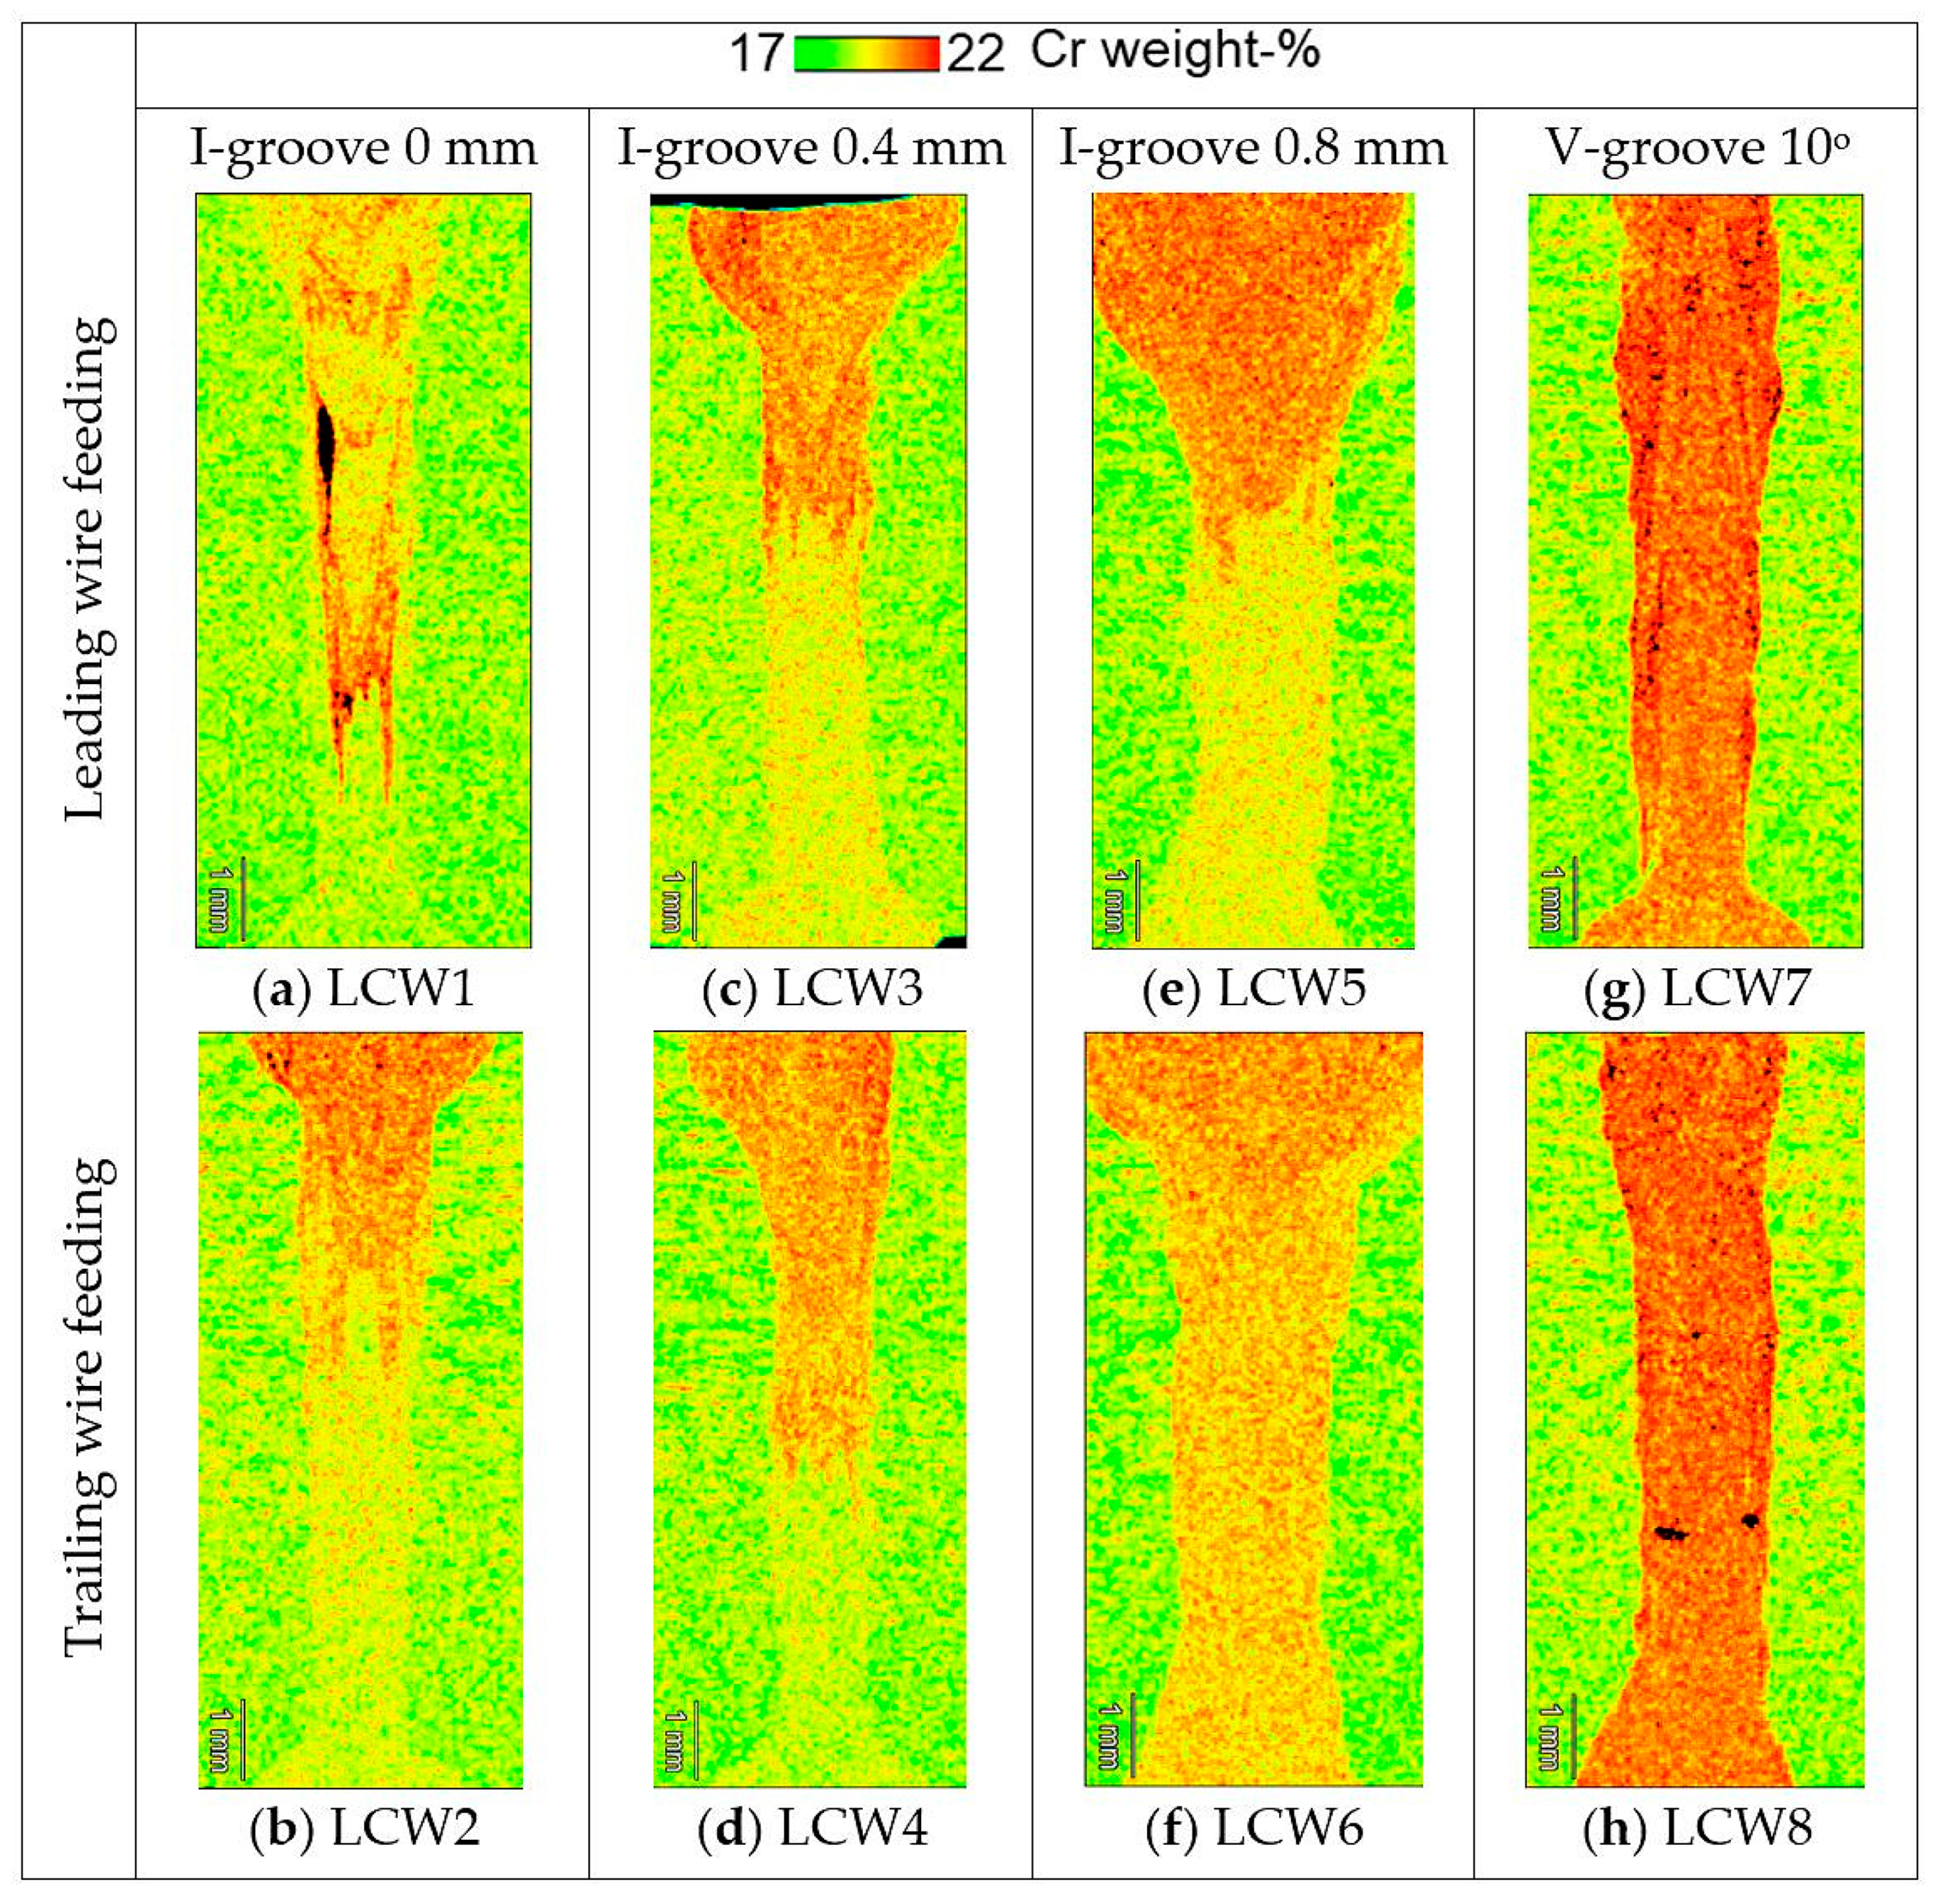
Figure 15 shows EDS mapping results for the laser cold-wire test welds. The images in Figure 15 show chromium distribution in weight-% for each test weld cross-section. Figure 16 presents tabular data for average values of filler metal mixing determined at the measurement lines ML1–ML4 of the laser cold-wire test welds. Examination of Figure 15a–e shows a clear difference in filler metal mixing between the weld surface part (upper half) and the weld root part (lower half) of the weld cross-sections when the root gap of the I-groove was closed or 0.4 mm. In Figure 16, average filler metal mixing values in test welds LCW3 and LCW4 are around ~32–36% in the lower half of the weld cross-sections (ML3–ML4), whereas the level in the upper half of the weld is much higher, ~48–54%. The same mixing behaviour can be seen for both leading and trailing filler wire feeding. Comparison of the EDS-mapping images of welds LCW3 and LCW4 in Figure 15c,d indicates that slightly more intensive mixing occurred in the lower half of the joint in weld LCW3, which was produced with leading wire feeding.
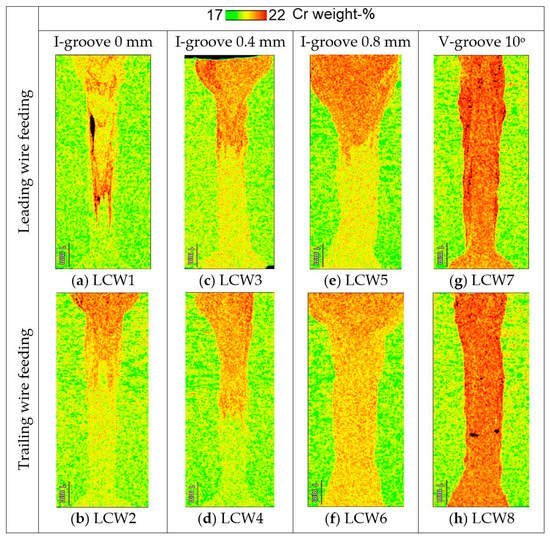
Figure 15.
EDS mapping images (a–h) showing the distribution of chromium in laser cold-wire test welds.
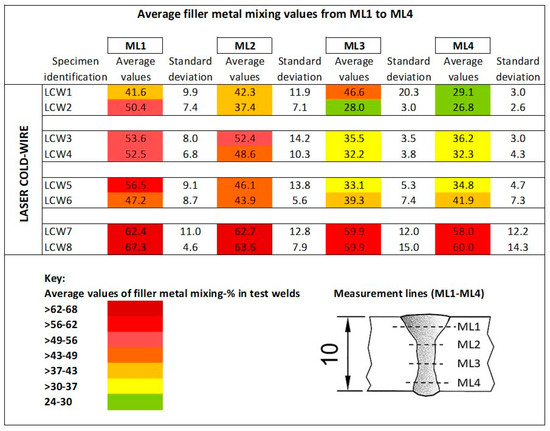
Figure 16.
Tabular data presenting average values of filler metal mixing-% from the data of measurement lines ML1–ML4 in laser cold-wire test welds.
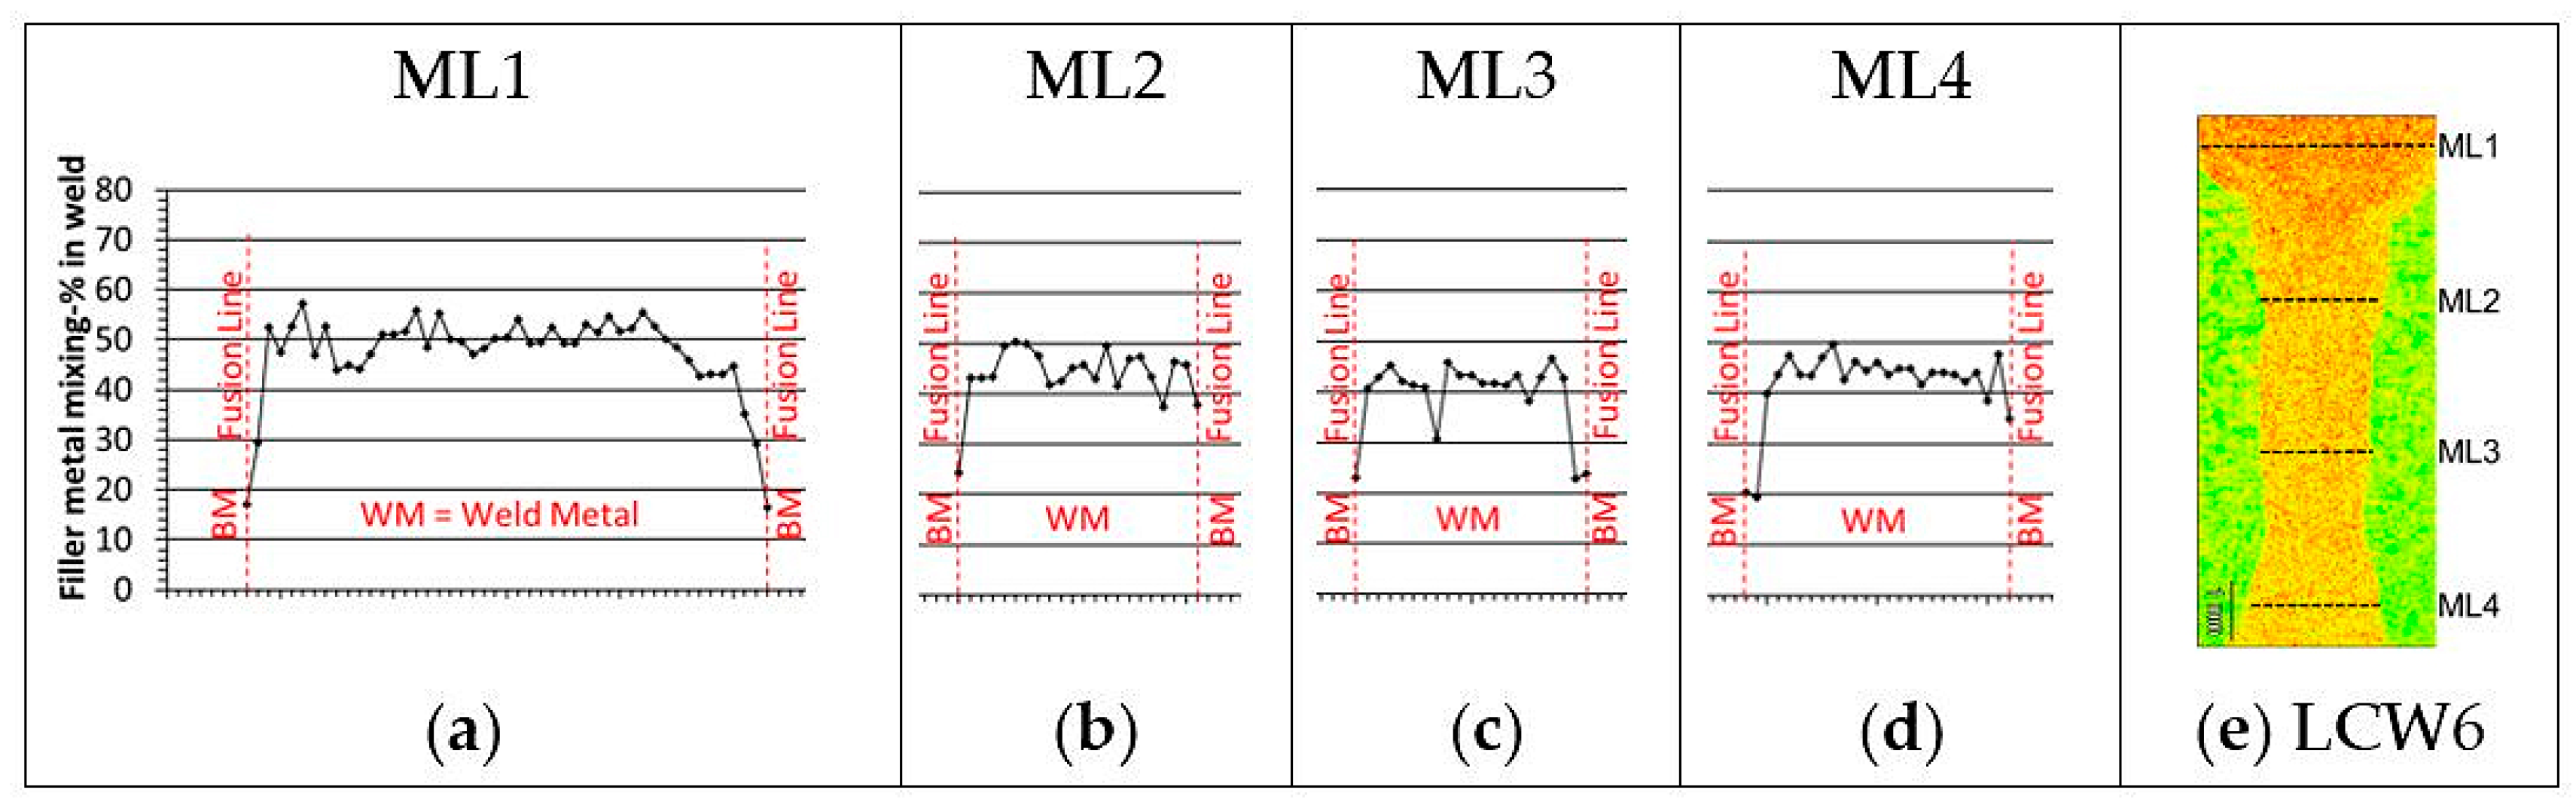
When the root gap was widened to 0.8 mm, leading wire feeding still has a clear difference in mixing between the upper and lower half of the weld cross-section, Figure 15e. However, the results of trailing wire feeding with 0.8 mm root gap show enhanced mixing behaviour across the whole weld cross-section in terms of higher chromium weight-% and more homogenous distribution, Figure 15f. Figure 16 shows average filler metal mixing values between 39% and 42% for test weld LCW6 at measurement lines ML3 and ML4. In addition, Figure 17d, which presents the mixing profile for the weld root portion, shows homogenous mixing at the bottom of the groove.
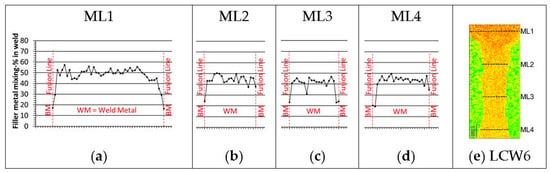
Figure 17.
Filler metal mixing results from EDS stepwise characterization. (a–d) Filler metal mixing-% profiles of measurement lines 1–4 (ML1–ML4) from test weld LCW6 (e). In figures (a–d) one step between adjacent measurement points in the horizontal axis equals 100 micrometres.
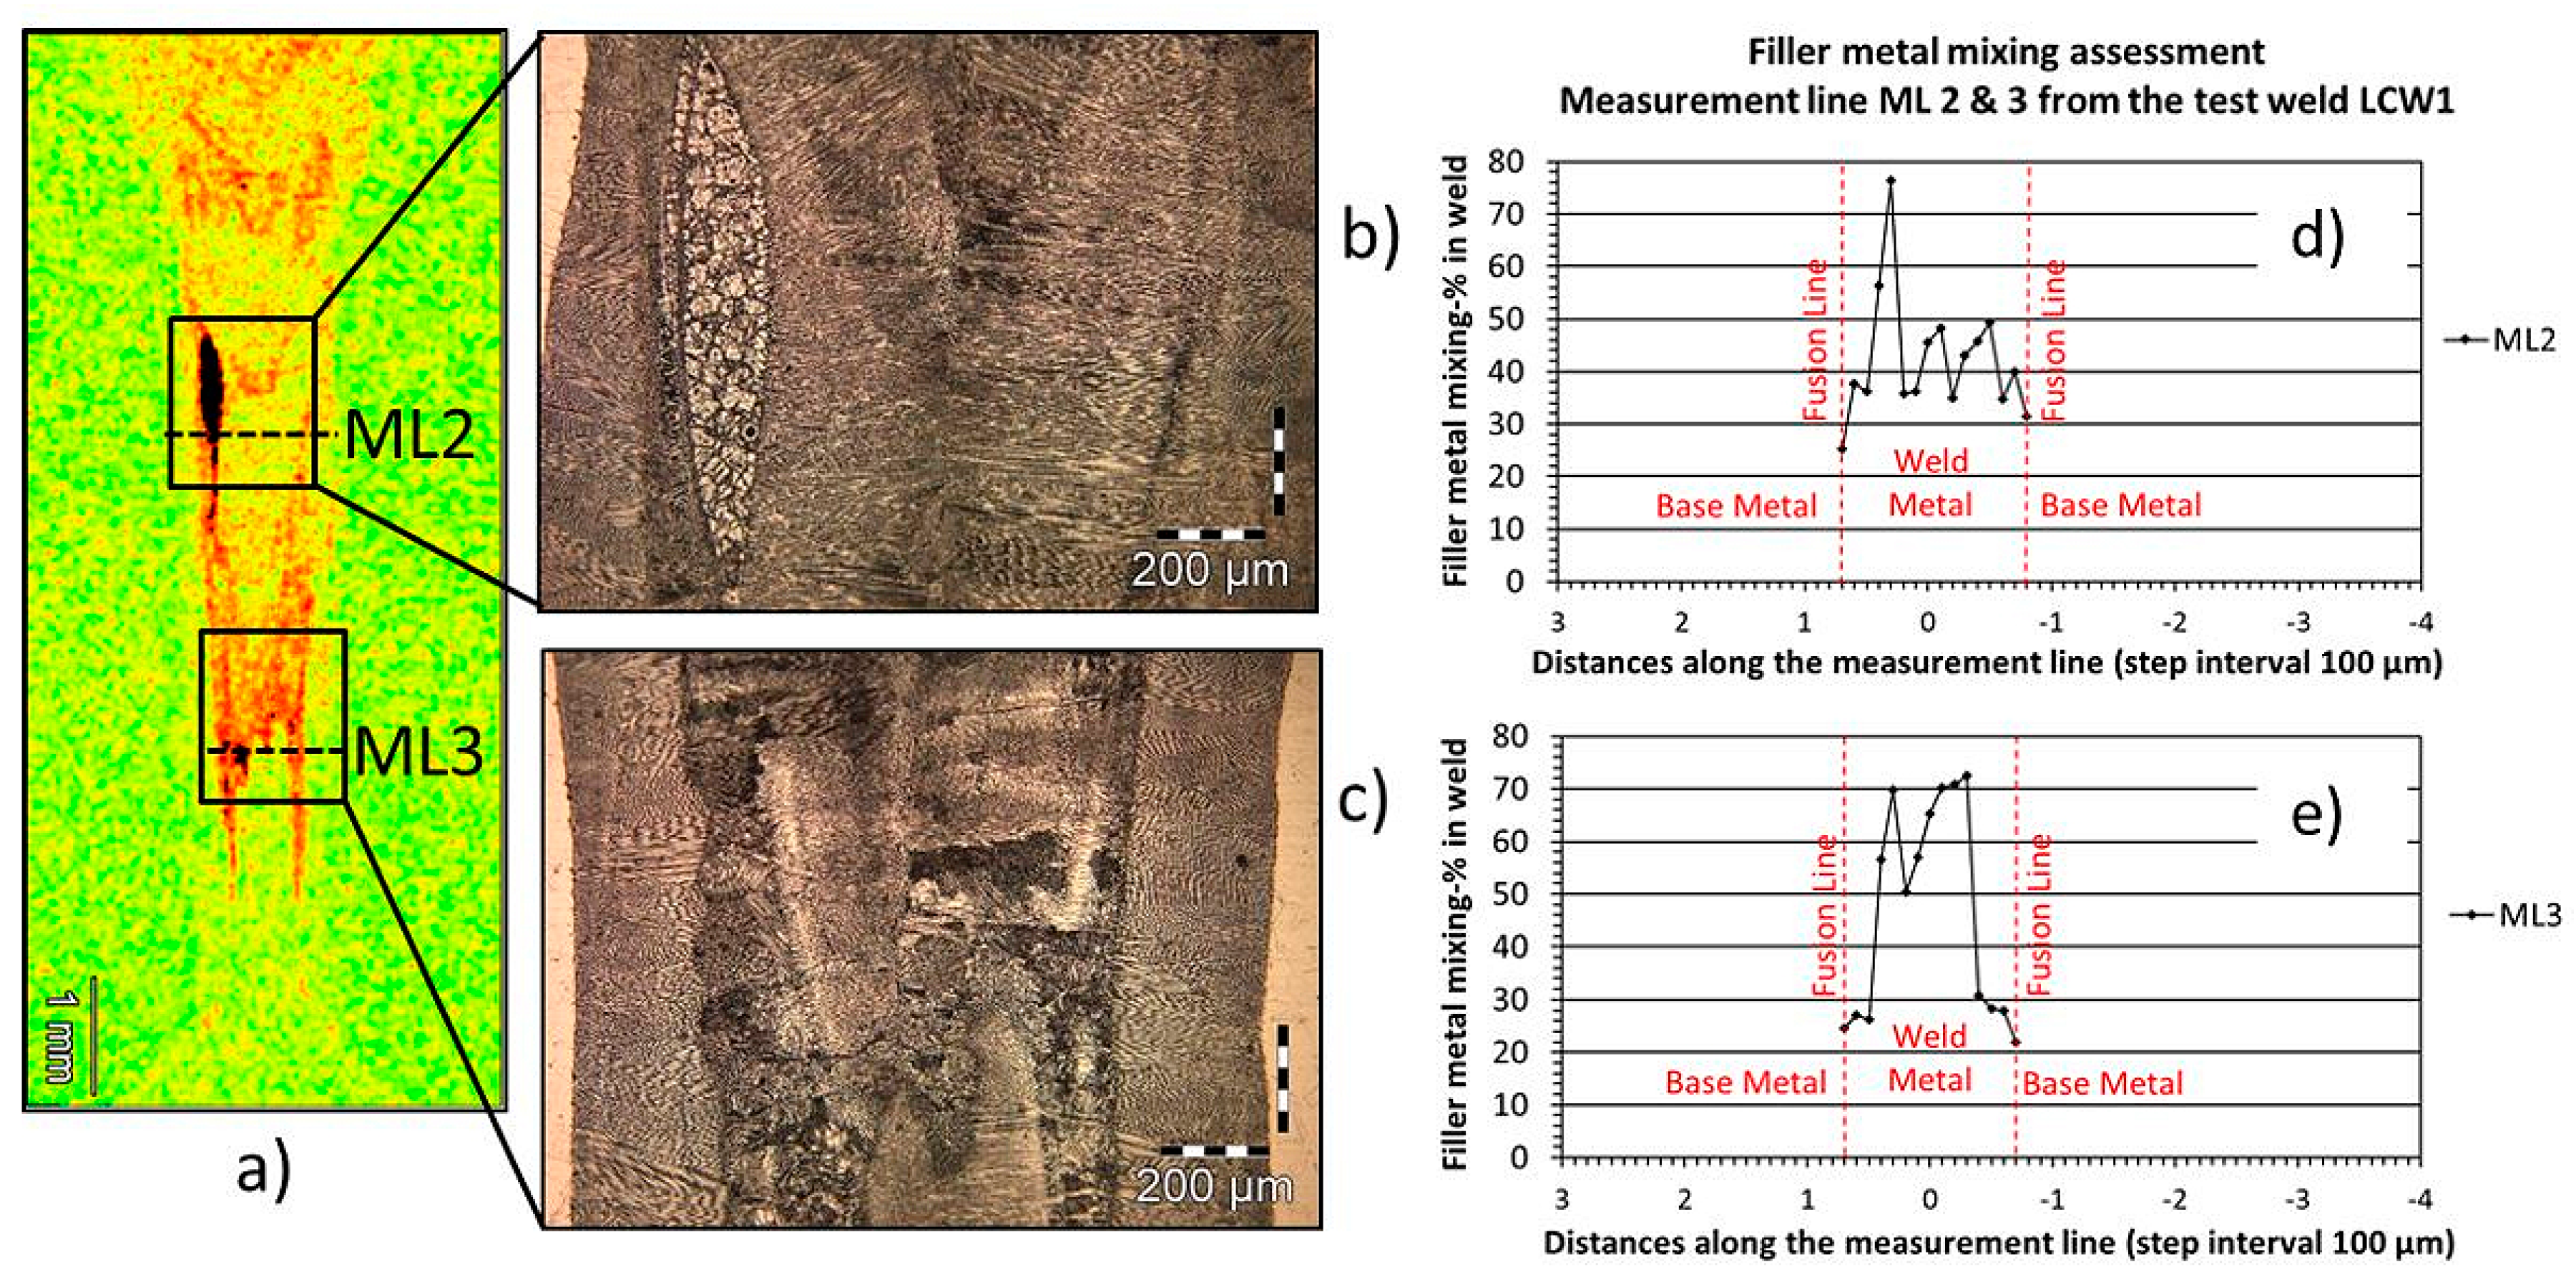
In the closed square butt weld with zero root gap, the filler metal mixing behaviour was remarkably inhomogeneous. In Figure 15a,b, distinctive colour contrast can be seen between high chromium and low chromium weight-% areas. Figure 18 shows mixing profiles derived from the EDS-line scans and micrographs taken at the same locations (Figure 18a). Local inhomogeneous mixing is clearly visible in the EDS chromium mapping image of the zero root gap test weld LCW1. Mixing profiles at the measurement lines 2 and 3 (Figure 18d,e) point out acute local changes in weld metal chemical composition. Micrographs (Figure 18b,c) reveal that composition variations in the weld metal have induced a change in weld solidification mode from primary austenite to primary ferrite solidification. Microstructural solidification features of both modes can be seen side-by-side and solidified islands of primary ferrite are present in locations where the weld metal contains a high amount of filler metal. Large local spikes in the mixing profiles indicate that the difference between the high and low mixing value levels could be almost 45%-units.
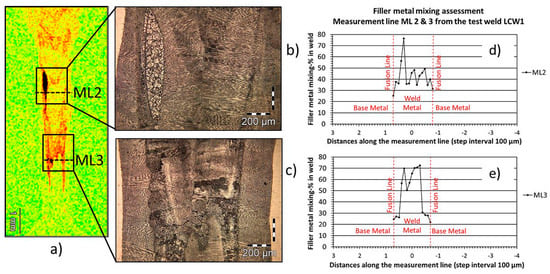
Figure 18.
Example of mixing behaviour in a laser cold-wire weld produced in I-groove configuration with closed gap. Micrographs (b,c) and filler metal mixing profiles (d,e) at corresponding locations (a) showing inhomogeneous mixing occurred in laser cold-wire test weld LCW1.
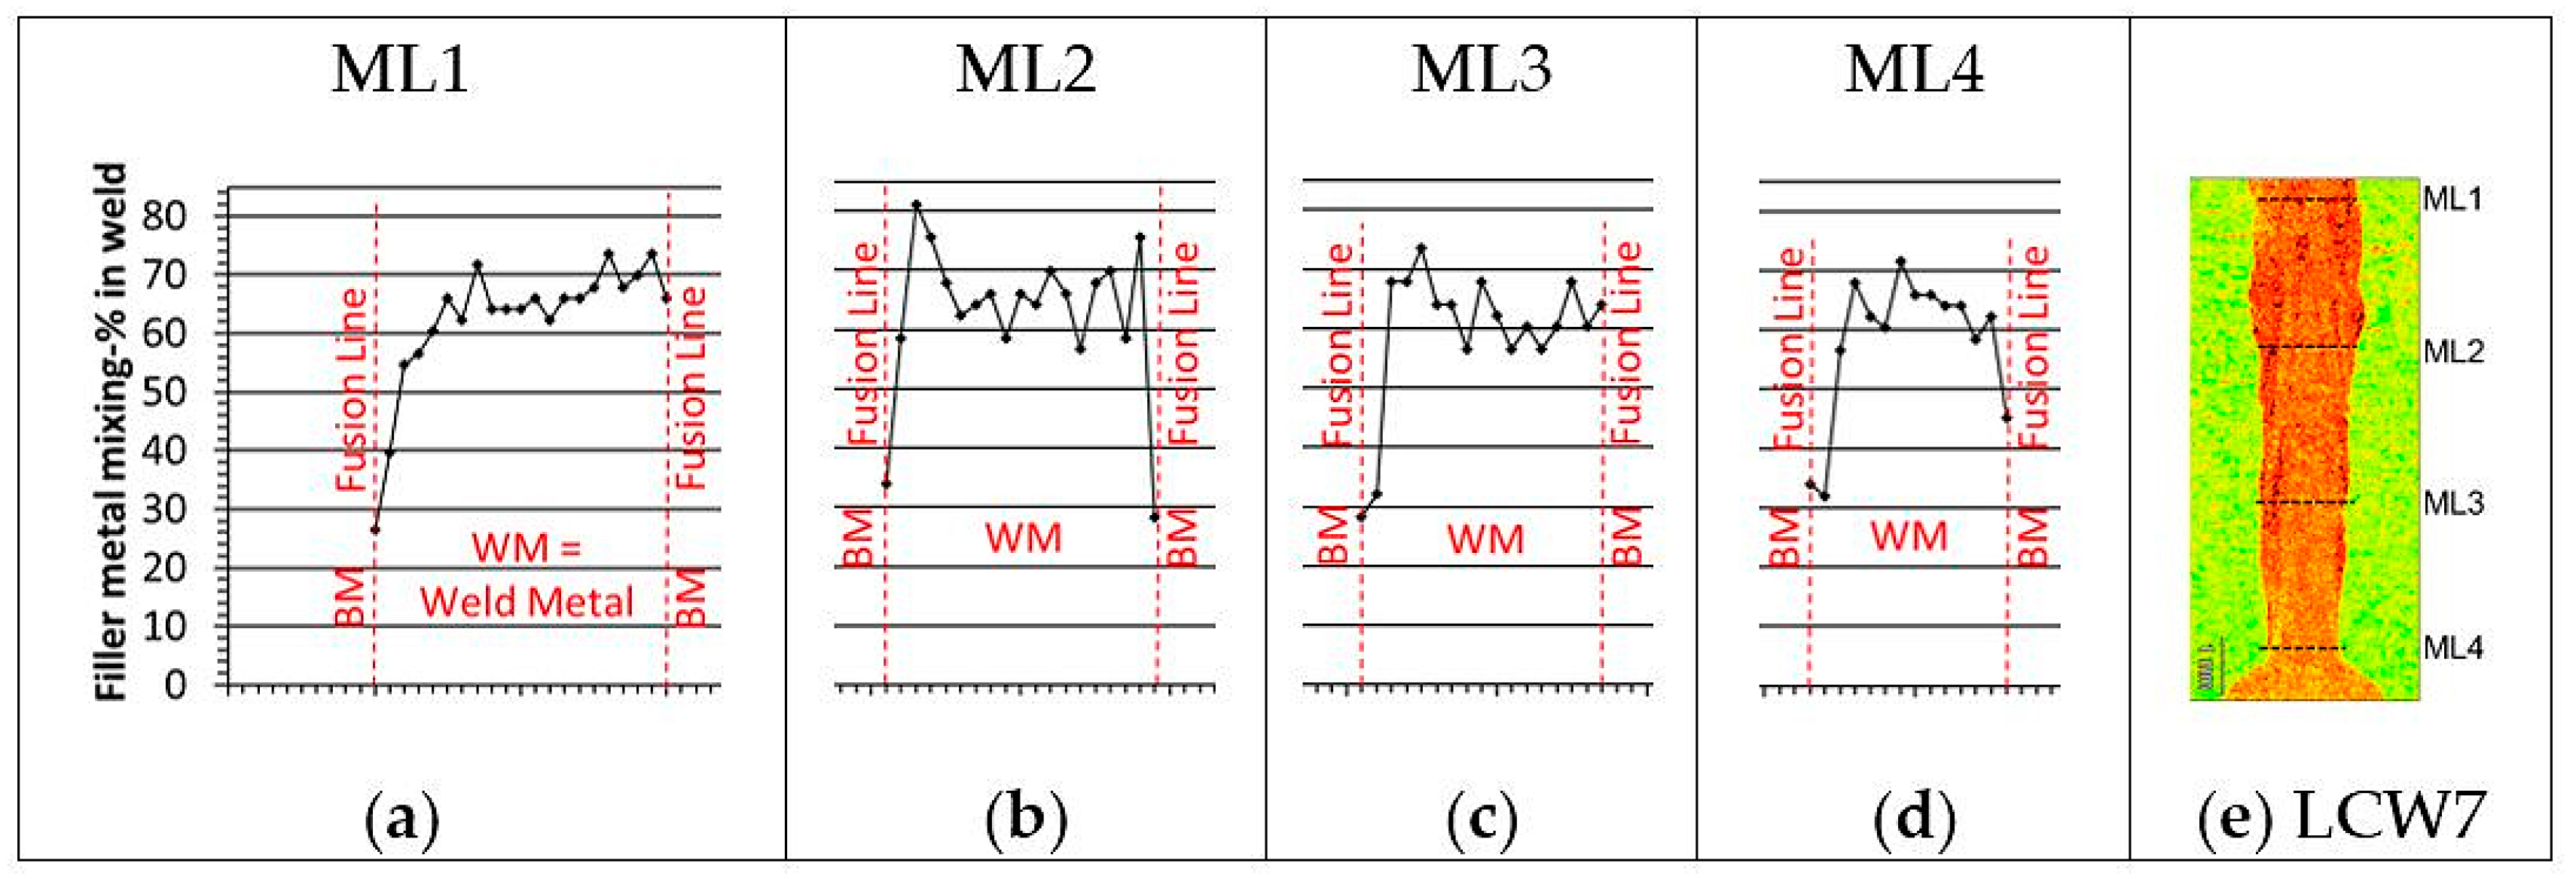
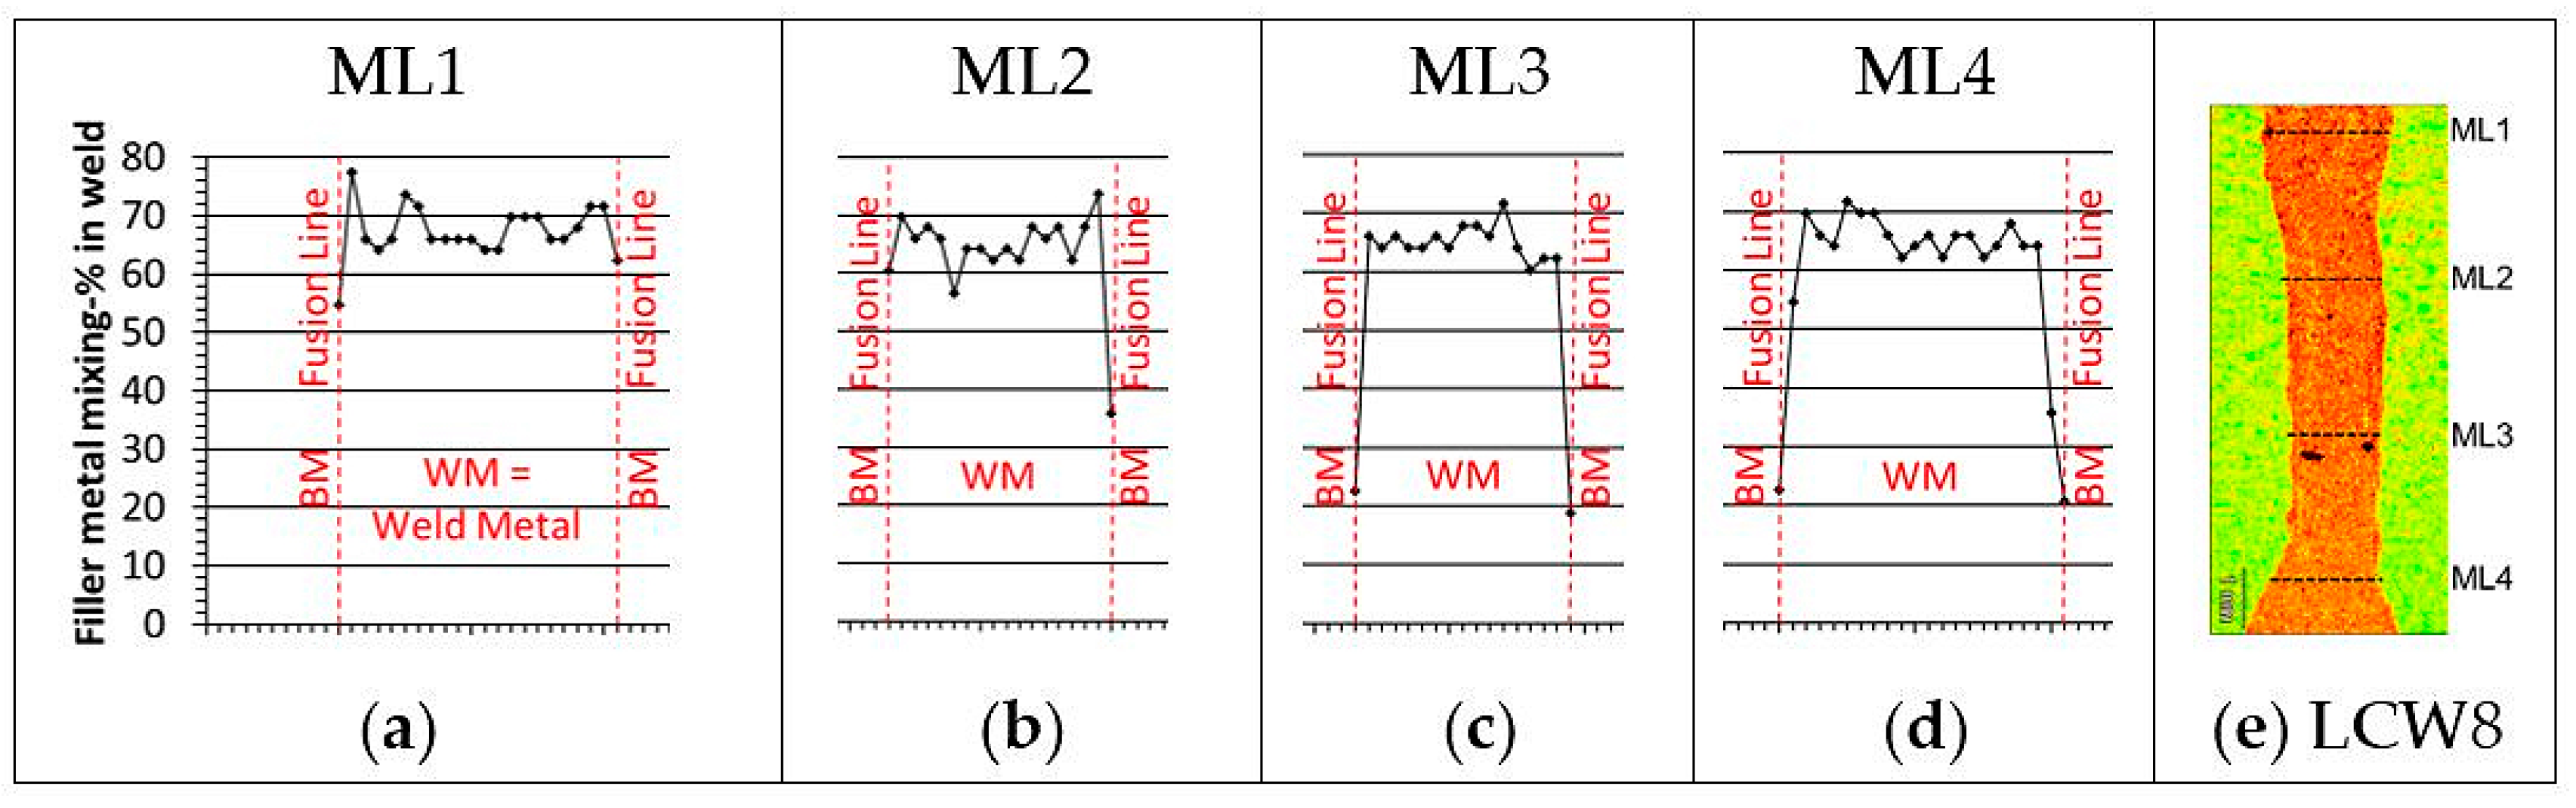
The results given in Figure 16 show that the V-groove weld configuration gave the highest average filler metal mixing values of the laser cold-wire welding trials. Average filler metal mixing values in percent were in the range 58–62% and 60–67% at measurement lines 1 to 4 of the test welds LCW7 and LCW8, respectively. Comparison of leading and trailing wire feeding based on the chromium weight-% mapping images of Figure 15g–h and the filler metal mixing profiles in Figure 19 and Figure 20 indicates that the mixing homogeneity is best in weld LCW8, which was made with trailing wire feeding. Overall, test welds LCW6 and LCW8 gave the best results, corresponding to homogenous filler metal distribution across the whole weld cross-section. Both LCW6 and LCW8 were produced using trailing wire feeding.
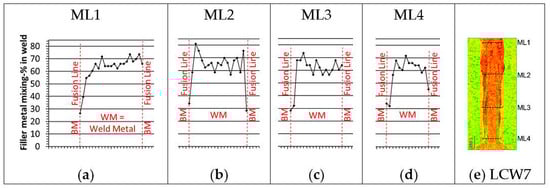
Figure 19.
Filler metal mixing results from EDS stepwise characterization. (a–d) Filler metal mixing-% profiles of measurement lines 1–4 (ML1–ML4) from test weld LCW7 (e). In figures (a–d) one step between adjacent measurement points in the horizontal axis equals 100 micrometres.
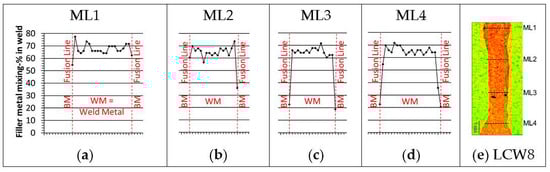
Figure 20.
Filler metal mixing results from EDS stepwise characterization. (a–d) Filler metal mixing-% profiles of measurement lines 1–4 (ML1–ML4) from test weld LCW8 (e). In figures (a–d) one step between adjacent measurement points in the horizontal axis equals 100 micrometres.
3.3. Mixing Behavior Comparison between Laser-Arc Hybrid and Laser Cold-Wire Processes
In square butt welds with narrow root gap (0.4 mm) the difference in mixing between the upper and lower halves of the joint thickness was more discernible in the weld samples produced with laser cold-wire welding than with laser-arc hybrid welding. When the root gap was 0.8 mm, the weld made with laser cold-wire welding and leading wire feeding still showed inhomogeneous mixing between the upper and lower halves of the joint. With trailing wire feeding, on the other hand, more even mixing behaviour was found. Corresponding samples for laser-arc hybrid welding and 0.8 mm root gap showed more even mixing behaviour with leading wire feeding compared to the laser cold-wire process. Trailing wire feeding with 0.8 mm root gap produced the best mixing of the laser-arc hybrid test welds and, especially at the weld root, the average mixing-% was somewhat higher than in corresponding laser cold-wire test welds. With the V-groove welds, the laser cold-wire process with trailing wire feeding exhibited superior mixing behaviour in terms of more homogenous filler metal distribution from the weld surface to the weld root. The V-groove welds with laser-arc hybrid welding, in turn, showed high average mixing-% values in all four measurement lines (ML1–ML4) from the weld surface to root but the overall homogeneity of the fusion zone mixing was only moderate.
In the case of the laser-arc hybrid process, the electromagnetic force, that is, the Lorentz force, is known to act in the weld pool due to the electric current and the magnetic field induced. The Lorentz force is one of the driving forces for fluid flow in the weld pool during arc welding. The Lorentz force pushes liquid metal downward from the surface of the centre axis of the melt pool and liquid metal is circulated along both sides of the weld pool boundaries and rises back to weld surface [23]. In the laser-arc hybrid welds, the Lorentz force could have been augmenting weld metal mixing with convective fluid flow, which would cause a stirring effect in the melt pool.
3.4. Practical Aspects
The mixing studies indicate that both welding processes benefit from the use of larger groove cross-sections. The use of a wider root gap in the I-groove welds, for example, helped to introduce filler metal into the bottom of the groove. In practice, with open square preparation where a wide root gap is used in thick-section welding, the diameter of the laser beam spot needs to be wide enough and the power density of the beam must simultaneously be sufficient to ensure both proper melting of the joint fusion faces and to enable keyhole formation. It should be noted that the mixing results for the thick-section welds described in this work represent one transversal cross-section sample per test weld joint produced. Welding in general and laser-arc/cold wire-based keyhole welding in particular, are dynamic processes. Consequently, some natural variation in mixing and the resulting weld metal composition along the solidified weld joint can be expected even if all the welding experiments are carried out in the proper parameter window and in a robust manner. However, the results presented offer some indication of how mixing can be considered in welding parameter planning for thick section welding with laser-arc or laser cold wire-based processes.
4. Conclusions
Laser-arc hybrid and laser cold-wire welding tests were conducted on 10 mm thick butt-welded joints of AISI 316L austenitic stainless steel base metal using an overmatching type 2205 duplex stainless steel filler metal. The objective of the work was to study filler metal mixing behaviour in laser-arc hybrid welding and laser cold-wire welding. The following variables and their effect on mixing behaviour were of interest: leading and trailing filler wire feeding and butt-joint preparation, namely I-groove and V-groove type welds.
The following conclusions can be drawn from the results of the laser-arc hybrid welding tests:
- Open square preparation (I-groove) with a 0.4 mm root gap in a 10 mm thick butt joint showed a clear difference in filler metal mixing between the upper half and lower half of the weld cross-section. Average filler metal mixing values in percent were within the range ~31–38% in the upper half of the weld cross-section but only ~25–28% in the lower half of the weld.
- Increasing the cross-sectional groove area by using a root gap of 0.8 mm in a square butt weld (I-groove) enhanced filler metal mixing across the whole weld cross-section. This change was particularly evident in the root portion of the test welds, where average mixing values in percent were between ~40–46%.
- With laser-arc hybrid welding, V-groove type welds with trailing and leading wire feeding had the highest filler metal mixing values (averages from 41% to 56%) but the homogeneity of the mixing was not as good as I-groove welds with 0.8 mm wide root gap.
- In all test welds, trailing filler wire feeding produced stronger filler metal mixing in the root portion than leading filler wire feeding.
- Near the weld surface, the average filler metal mixing-% values were smaller when using trailing wire feeding (i.e. trailing torch) than leading wire feeding (i.e. leading torch). This result was probably caused by larger local base metal dilution near the weld surface when a trailing torch configuration was used.
Following conclusions can be drawn from the results of the laser cold-wire welding tests:
- In closed square (zero root gap) welds, filler metal mixing behaviour was observed to be remarkably inhomogeneous with both leading and trailing wire feeding compared to the welds with wider gaps. Large local spikes in mixing profiles were found and the difference between the high and low mixing values could be almost 45%-units. Acute local changes in the chemical composition of the weld metal induced changes in the weld solidification mode, which had separate islands of both primary austenite and primary ferrite solidification microstructures.
- A clear difference was noticed in filler metal mixing between the upper half and lower half of the weld cross-sections in the case of the I-groove weld with 0.4 mm root gap for both leading and trailing filler wire feeding. When the root gap was widened to 0.8 mm, leading wire feeding still showed a noticeable difference in mixing between the upper and lower half of the weld cross-section. Corresponding results with trailing wire feeding, however, showed enhanced mixing behaviour across the whole weld cross-section with greater homogeneity and higher mixing values. Average filler metal mixing values in percent were in the range ~39–47% for the entire weld cross-section.
- Utilization of V-groove preparation with trailing wire feeding gave the best filler metal mixing in terms of both homogeneity and high mixing values. Average filler metal mixing values in percent were in the range ~60–67% for the entire weld cross-section.
Overall, the results of the mixing studies indicate that both welding processes benefit from the use of a larger groove cross-section. The use of trailing wire feeding showed more robust mixing behaviour with V-groove preparation for the laser cold-wire process and with I-groove preparation with a 0.8 mm root gap for the laser-arc hybrid process.
Author Contributions
Methodology, M.K.; Investigation, M.K.; Manuscript writing, MK; Manuscript reviewing, V.K., H.E., A.S.; Supervision, V.K., H.E.
Acknowledgments
The authors would like to thank Pertti Kokko for his assistance with the welding experiments, Antti Heikkinen for help with the metallographic preparations, Toni Väkiparta for carrying out the EDS-measurements and Peter Jones for help with the English language. The authors would also like to acknowledge the DigRob project of Business Finland for financial support.
Conflicts of Interest
The authors declare no conflict of interest.
References
- Kawahito, Y.; Wang, H.; Katayama, S.; Sumimori, D. Ultra high power (100 kW) fibre laser welding of steel. Opt. Lett. 2018. [Google Scholar] [CrossRef] [PubMed]
- Katayama, K.; Kawahito, Y.; Kinoshita, K.; Matsumoto, N.; Mizutani, M. Weld penetration and phenomena in 10 kW fibre laser welding. In Proceedings of the 26th International Congress on Applications of Lasers & Electro-Optics, Orlando, FL, USA, 29 October–10 November 2007; pp. 253–359. [Google Scholar]
- Vollertsen, F.; Grünenwald, S.; Rethmeier, M.; Gumenyuk, A.; Reisgen, U.; Olschok, S. Welding thick steel plates with fibre lasers and GMAW. Weld. World 2010, 54, R61–R70. [Google Scholar] [CrossRef]
- Nielsen, S.E. High power laser hybrid welding—Challenges and perspectives. Phys. Proc. 2015, 78, 24–34. [Google Scholar] [CrossRef]
- Kristensen, J.K. Applications of laser welding in the shipbuilding industry, Part IV Applications of laser welding. In Handbook of Laser Welding Technologies; Katayama, S., Ed.; Woodhead Publishing Limited: Cambridge, UK, 2013; pp. 596–611. [Google Scholar] [CrossRef]
- Dilthey, U.; Keller, H.; Ghandehari, A. Laser beam welding with filler metal. Steel Res. 1999, 70, 199–202. [Google Scholar] [CrossRef]
- Dilthey, U.; Wiesschemann, A. Perspectives offered by combining a laser beam with arc welding procedures. Weld. Int. 2003, 16, 711–719. [Google Scholar] [CrossRef]
- Jokinen, T.; Karhu, M.; Kujanpää, V. Welding of thick austenitic stainless steel using Nd:yttrium–aluminum–garnet laser with filler wire and hybrid process. J. Laser Appl. 2003, 15, 220–224. [Google Scholar] [CrossRef]
- Salminen, A.S.; Kujanpää, V.P. Effect of wire feed position on laser welding with filler wire. J. Laser Appl. 2003, 15, 1–9. [Google Scholar] [CrossRef]
- Ohnishi, T.; Kawahito, Y.; Mizutani, M.; Katayama, S. Butt welding of thick, high strength steel plate with a high power laser and hot wire to improve tolerance to gap variance and control weld metal oxygen content. Sci. Technol. Weld. Join. 2013, 18, 314–322. [Google Scholar] [CrossRef]
- Peng, W.; Jiguo, S.; Shiqing, Z.; Gang, W. Control of wire transfer behaviors in hot wire laser welding. Int. J. Adv. Manuf. Technol. 2016, 83, 2091–2100. [Google Scholar] [CrossRef]
- Kujanpää, V.P.; Helin, J.P.; Moisio, T.J.I.; Bruck, G.J. Composition and Microstructure of Laser Beam Welds Between Dissimilar Metals. J. Laser Appl. 1990, 2, 24–30. [Google Scholar] [CrossRef]
- Westin, E.; Stelling, K.; Gumenyuk, A. Single-pass laser-GMA hybrid welding of 13.5 mm thick duplex stainless steel. Weld. World 2011, 55, 39–49. [Google Scholar] [CrossRef]
- Tsukamoto, S.; Zhao, L.; Sugino, T.; Arakane, G. Distribution of wire feeding elements in laser-arc hybrid welding. In Proceedings of the 26th International Congress on Applications of Lasers & Electro-Optics, Orlando, FL, USA, 29 October–10 November 2007; pp. 498–505. [Google Scholar]
- Karhu, M.; Kujanpää, V.; Gumenyuk, A.; Lammers, M. Study of Filler Metal Mixing and Its Implication on Weld Homogeneity of Laser-Hybrid and Laser Cold-Wire Welded Thick Austenitic Stainless Steel Joints. In Proceedings of the 32nd International Congress on Applications of Lasers & Electro-Optics, Miami, FL, USA, 6–20 October 2013; pp. 252–261. [Google Scholar]
- Zhao, L.; Sugino, T.; Arakane, G.; Tsukamoto, S. Influence of welding parameters on distribution of wire feeding elements in CO2 laser GMA hybrid welding. Sci. Technol. Weld. Join. 2013, 14, 457–467. [Google Scholar] [CrossRef]
- Sohail, M.; Karhu, M.; Na, S.-J.; Han, S.-W.; Kujanpaa, V. Effect of leading and trailing torch configuration on mixing and fluid behaviour of laser-gas metal arc hybrid welding. J. Laser Appl. 2017, 29, 042009. [Google Scholar] [CrossRef]
- Nima, Y.; Masoud, M.; Reza, R.; Radovan, K. Hybrid laser/arc welding of 304L stainless steel tubes, part 2—Effect of filler wires on microstructure and corrosion behaviour. Int. J. Pres. Ves. Pip. 2018, 163, 45–54. [Google Scholar]
- Gook, S.; Gumenyuk, A.; Rethmeier, M. Hybrid laser arc welding of X80 and X120 steel grade. Sci. Technol. Weld. Join. 2014, 19, 15–24. [Google Scholar] [CrossRef]
- Karhu, M.; Kujanpää, V. Solidification Cracking Studies in Multi Pass Laser Hybrid Welding of Thick Section Austenitic Stainless Steel, Part II Steels and Stainless Steels. In Book Hot Cracking Phenomena in Welds III, 1st ed.; Lippold, J., Boellinghaus, T., Cross, C., Eds.; Springer-Verlag: Berlin/Heidelberg, Germany, 2011; pp. 161–182. [Google Scholar] [CrossRef]
- Kadoi, K.; Shinozaki, K. Effect of Chemical Composition on Susceptibility to Weld Solidification Cracking in Austenitic. Met. Mater. Trans. A 2017. [Google Scholar] [CrossRef]
- Lippold, J.C. Book Welding Metallurgy and Weldability, 2nd ed.; John Wiley & Sons, Inc.: Hoboken, NJ, USA, 2015; p. 14. [Google Scholar]
- Kou, S. Book Welding Metallurgy, 2nd ed.; John Wiley & Sons, Inc.: Hoboken, NJ, USA, 2003; pp. 103–107. [Google Scholar]


© 2019 by the authors. Licensee MDPI, Basel, Switzerland. This article is an open access article distributed under the terms and conditions of the Creative Commons Attribution (CC BY) license (http://creativecommons.org/licenses/by/4.0/).