Abstract
Coalbed methane (CBM) mainly adsorb in massive pores of coal. The accurate characterization of pores benefits CBM resource evaluation, exploration and exploitation. In this paper, mercury intrusion porosimetry (MIP) and low temperature nitrogen adsorption (N2GA) combined with low field nuclear magnetic resonance (NMR) experiments were conducted to analyze the advantages and differences among different experimental techniques in pore characterization. The results show that the total porosity has a tendency to decrease first and then rise with the increase of coal rank, which is mainly caused by the compaction in early stage and the thermogenic gas produced in middle and late stages of coalification. The comparison between different techniques shows that NMR is superior to the conventional methods in terms of porosity and pore size distribution, which should be favorable for pore characterization. The N2GA pore size measurement, based on BJH model, is only accurate within 10‒100 nm in diameter. There is a peak misalignment between the NMR and MIP results in the pore size comparison. The reason for this phenomenon is that there is a centrifugal error in NMR experiment, which could cause a differential damage to the coal sample, resulting in partial loss of the nuclear magnetic signal.
1. Introduction
Coal generally has the characteristics of dual pore structure (matrix pore and fracture), low permeability, large pore surface area, and strong adsorption capability [1]. The matrix pore division scheme is diverse. The International Union of Applied Chemistry (IUPAC) [2] proposed a pore size classification: micropores <2 nm in diameter; mesopores 2‒50 nm in diameter; macropores >50 nm in diameter. To better understand the effects of pore structure on both gas adsorption capacity and flow capability, the classification from Hodot [3] for coal pore size is proposed: super micropores (<10 nm), micropores (10‒102 nm), mesopores (102‒103 nm), and macropores (102‒103 nm). In this work, the Hodot’s classification is used. The main super micropores, micropores, and mesopores occur as a part of the coal matrix, providing extremely large internal surface area with a strong affinity to certain gasses, such as CH4 and CO2. About 95% of the total gas may be stored in the coal matrix in the adsorbed form. Hence, pore properties of coals are of great importance to gas storage and flow behavior in coal. Methods for studying the pore structure in coalbed methane (CBM) reservoir mainly include mercury intrusion porosimetry (MIP), low temperature nitrogen adsorption (N2GA), [4] and low field nuclear magnetic resonance (NMR) [5] experiments. The NMR technique has been widely applied due to its nondestructive and simplicity. Especially, the quantitative assessment of pore surface area, PS/VD (pore size/volume distribution) and pore shape plays an important role for understanding gas adsorption capacity and flow behavior.
In this work, our study is focused on the evolution characterization of pores, pore size/volume distribution, and pore structures of 16 coal samples ranging from lignite to anthracite, considering the effect of coalification on pore structure. Furthermore, the comparison of pore characteristics results from different techniques is conducted. Therefore, this study should be helpful for technique optimization for assessing pore structure and the evaluation of CBM resources and reservoir properties.
2. Experiments and Methods
2.1. Coal Basic Information and Experiments
The 16 coal samples were collected from different mining areas in three coalbearing basins of Junggar, Ordos, and Qinshui. The samples range from low-metamorphic lignite to subbituminous coal and bituminous coal, as well as high-metamorphic anthracite. The petrographic and proximate analysis results are shown in Table 1. The MIP, N2GA, and NMR experiments were conducted.

Table 1.
Routine test information of experimental coal samples.
The mercury intrusion porosimetry (MIP) tests were conducted on the 16 selected coal samples using 9420 automatic mercury intrusion porosimeter by Micromeritics as per our previous research [4]. The coal sample were dried to constant weight at 105 °C. The amount of intruded and ejected mercury volume in the range of 0.004~206 MPa were determined. The low temperature nitrogen absorption/desorption experiment (N2GA) were also carried out. The experiments were completed with the experiment device of SASAP-2020 automatic surface analyzer by Micromeritics. The procedure is as follows: Firstly, the coal samples were broken and the coal powder of 60~80 mesh was screened. After the device was degassed, the samples were put in the unit. At the liquid nitrogen temperature (77k), the adsorption amount in the experiment is completely determined by the relative pressure P/P0, where P is the actual pressure of nitrogen, and P0 is the saturated vapor pressure of nitrogen at 77 K. According to the results of low-temperature nitrogen adsorption experiment, the pore specific surface area can be calculated by BET equation when P/P0 is between 0.05 and 0.35. Moreover, the pore volume and pore diameter distribution of coal can be analyzed by BJH equation when P/P0 is greater than or equal to 0.4 [1].
The low field nuclear magnetic resonance (NMR) experiments were also carried out on 16 coal samples. The pretreatment process is as follows: first, cylindrical cores approximately 25mm in diameter and 50mm in length were drilled on fresh coals. Then, coal pillar was dried to constant weight at 105 ℃ and placed in a vacuum pump for 48 h. Following that, the samples were injected into distilled water and then saturated for 72 h under the pressure of 8 MPa. When the coal sample reached the fully saturated water state, the experimental pretreatment was completed. The NMR experiment consists of three steps: 1) The coal sample under saturated water were set in Rec Core 2500 low field nuclear magnetic resonance of 2.38 MHz to obtain the inverse T2 relaxation time spectrum. The experiment parameters were set as follows: 0.240 ms of echo time interval (TE), 6 s of wait time (TW), 8000 of echo number (NECH), 64 of scanning frequency (NS), and the experimental temperature 25 ℃; 2) To detect the best centrifugal force and make the samples reach the ideal state of bound water, the centrifugal rotational rates were set to 3000, 4000, 5000, 6000, 7000 r/min, respectively (corresponding to the centrifugal force of 0.69, 0.92, 1.15, 1.38, 1.61 MPa) within the centrifugal time of 1 h; 3) the coal samples after centrifugation were subjected to NMR experiments under the same test environment. Furthermore, NMR signal calibration experiment is also required. The NMR signal calibration experiments were conducted to determine the NMR nuclear magnetic signal corresponding to the amount of water content in the experiments. This process is as follows: taking eight basic uniform quality difference of distilled water in the magnetization glass bottles, perform the NMR signal test again in the same environment and record the water quality and the corresponding nuclear magnetic semaphore to explore the corresponding relation between them.
2.2. Basic Methodology for NMR
The NMR analysis is based on the NMR relaxation behavior of the spin hydrogen nuclei in rocks in uniform static magnetic field and radio frequency field. According to previous studies, the expression of NMR transverse relaxation time, T2, can be simplified as follows [5]:
where, T2 represents the relaxation time of the pore fluid obtained in the experiment; ρ2 is the transverse surface relaxation, constant; S is the surface relaxation; and V stands for pore volume. Therefore, according to the Equation (1), the T2 value of coal sample is in positive ratio to pore radius, and the longer relaxation time represent the larger the pore radius. Therefore, the NMR signal corresponding to T2 value can be used to directly reflect the pore distribution [6,7].
In order to determine the corresponding relation between T2 value and pore diameter, the movable fluid in pores is removed by means of centrifugation technology. According to Washburn equation, when the pore fluid in coal is water, surface tension is 0.076 N/m, contact angle of 60°, after iterative:
The Equation (2) is satisfied between the centrifugal force and the pore radius. NMR signal from coal samples was re-measured after centrifugation. The amount of signal displayed corresponds to that of the fluid constrained in the pores with diameter smaller than rc. The overall distribution of pore size distribution in coals can be reflected by the corresponding relationship between value rc and T2C.
Through the application of the Equation (2), the water in the pores with diameter greater than 100 nm under the centrifugal force of 200 psi can be centrifuged. The corresponding T2 value is equivalent to T2C. Therefore, the relationship between T2 value and pore size can be established:
where r represents the coal pore radius, in units of nm.
In addition, porosity could be calculated by the calibration of NMR signal of water content in NMR. The results of the nuclear magnetic T2 spectra of saturated and centrifugal coal samples can be used to reflect the pore distribution characteristics of coal reservoirs. There is a good linear relationship between the mass of the water sample and NMR signal amplitude:
where y represents NMR signal amplitude, dimensionless; x represents the water content, in units of g; the slope of the standard equation is in units g−1. The Equation of nuclear magnetic porosity can be established by combining the T2 spectrum of the coal samples saturated with water and the Equation (4):
where ∅ represents the NMR porosity, dimensionless; T(Sw) is the nuclear magnetic resonance signal amplitude of saturated water coal sample, dimensionless; ρ represents water density, and the experiment distilled water is set to 1 g/m3; V is the volume of coal pillar. The cylindrical coal samples with a diameter of 2.5 cm and a length of 5 cm were used uniformly, defining V as a constant of 24.54, unit cm3.
3. Results
3.1. Determination of Pore Structure by Mercury Intrusion
The plotted curves and pore size distribution (PSD) characteristics corresponding to 16 coal samples can be divided into four pore categories as shown in Figure 1. Type I is represented by coal sample BS, shown in Figure 1a. Curve characteristics: This kind of coal has high mercury saturation and the mercury injection process is continuous. The pores are dominated by macropores and mesopores; the micropores are less developed and the mean value of pore diameter is relatively large; and the low efficiency of mercury-ejection represents the poor pore connectivity. Type II is represented by the coal samples TB, SW, TA, FL, and BD, shown in Figure 1b. Curve characteristics: the mercury saturation is not high and the porosity saturated by mercury is between 20% to 50%. Under the pressure less than 100 MPa, the amount of mercury into the interval rises with increasing the pressure. When the pressure is larger than 10 MPa, there is a small platform segment indicating that the pores are mainly microporous, with a small number of macropores and mesopores, in which the content of mesopores is greater than that of macropores, and the content of micropores is greater than or slightly greater than that of transition pores. The efficiency of mercury ejection is relatively high, basically reaching more than 50%, indicating better porosity connectivity. Because of the fracture development of coal samples FL and BD, a large amount of mercury has entered when the pressure is below 0.1MPa, causing the high cumulative mercury saturation. Type III is represented by the coal samples SL,WJY,TL,DEP, and WK, shown in Figure 1c. Curve characteristics: The integrated intrusion mercury saturation is not high, and the porosity saturated by mercury is 20% to 30%. Similar to type II, the interval mercury saturation has increased with increasing pressure, and the difference is that the amount of mercury injection between 0.1 and 1 MPa is very low, indicating that the pore development is dominated by transition pores and mesopores, while the macropores are not very developed or basically not developed. Among the five samples, the final cumulative mercury saturation of samples DEP and WK are slightly higher than that of the others because of fracture development. Type IV is represented by the coal samples QLT,HS,DP,CYH, and SK, shown in Figure 1d. Curve characteristics: the cumulative mercury intrusion is less than 20%. When the pressure is less than 100 MPa, the amount of mercury intrusion is very low, indicating that the pore development is dominated by micropores, while the other pores are basically undeveloped. The mercury ejection curve is closed to the mercury intrusion curve. The efficiency of mercury ejection is low and the porosity connectivity is poor. Among this kind of coal, due to the development of fractures in QLT, a large amount of mercury entered into fractures at the beginning of mercury intrusion, showing the high cumulative mercury saturation.
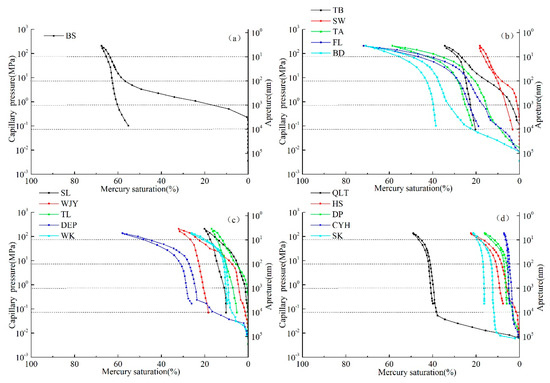
Figure 1.
Type of mercury intrusion curve of coal sample ((a) type I, (b) type II, (c) Type III, (d) Type IV ).
Based on the above four kinds of mercury curve type, the characteristics are substantially as follows: with the increase of Ro, the mercury intrusion curves are gradually transformed from type I to type II, Type III, and Type IV. In addition, the pore connectivity is becoming worse.
3.2. Low Temperature Nitrogen Absorption/Desorption Experiment
BET calculation results show that the values of the specific surface area are between 0.116–5.030 m2/g, with an average of about 1.5 m2/g (data shown in Table 2). Among the samples of different coal ranks, the pore specific surface area of low rank coals in southern Junggar basin and high rank coals in northern Qinshui is relatively low, with the average value below 1.0 m2/g. While in the eastern Ordos basin, the specific surface area is generally higher, with average value of 2.5 m2/g or more. BJH pore volumes are ranged from 0.47 × 10⁻³ to 13.46 × 10⁻³ mL/g, which vary greatly between different coal samples. However, overall, the pore volume of the coals in northern Qinshui is the smallest, which is mainly determined by the characteristics of low porosity and pore size in high rank coals. The PSD characteristics show that the content of pores in the eastern Ordos basin is the highest, ranging from 83.7% to 92.4%, with an average content of 90.0%, while the average pore diameter is the lowest of 4.82 nm and the specific surface area is the highest, which is favorable for CBM storage.
Table 2.
Experiment porosity test results by nitrogen adsorption (N2GA).
The pore type can be classified into three categories based on IUPAC classification (Figure 2): type I, type II, and type III represent closed pore, open pore, and pore with thin neck bottle, respectively. In the figure of the relationship between relative pressure and adsorption capacity, there are great differences in adsorption capacity because of the difference in porosities and PSD. In order to compare the types of adsorption loop, the adsorption capacity is normalized and the maximum adsorption capacity is set at 1 mL/g STP. The characteristics of the adsorption loop are shown in Figure 3. The normalized treatment does not change the type of adsorption loop, which is helpful to compare the pore structure between different coal samples.
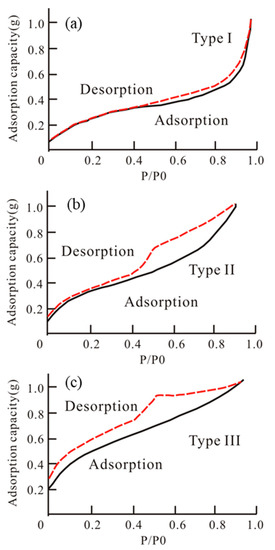
Figure 2.
Typical low temperature N2 adsorption loop type based on International Union of Applied Chemistry (IUPAC) classification ((a) type I, (b) type II, (c) type III).
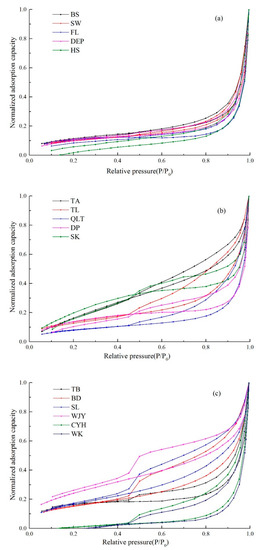
Figure 3.
Low temperature nitrogen (N2) adsorption loop type of selected coal samples ((a) type I, (b) type II, (c) type III).
The pore morphology of the coal samples BS, SW, FL, DEP, and HS is mostly the type I, which is airtight at one end, including cylinder, parallel plate, and pointed split pores. When liquid nitrogen condenses or evaporates in this kind of pores, there is the same kind of the gas–liquid interface hemispherical meniscus. Therefore, the pressure required for condensation and evaporation for the same pore size is equal, and the adsorption return line will appear as an adsorption–desorption branch coincidence. As a result, there is no hysteresis loop.
The pore structure shown in Figure 3b is similar to that in Figure 2b. The representatives are samples TA, TL, QLT, DP, and SK. According to the Kelven equation, when the relative pressure is calculated to be around 0.5, the corresponding pore radius is 1.38 nm. As the hysteretic loop only appears in the adsorption loop when the relative pressure is greater than 0.5, the pore characteristics are as follows: pores with radius less than 1.38 nm are mainly type I which are closed at one end. Open type II pores exist in pores larger than 1.38nm in diameter, mainly including cylinder pores or parallel plate pores. When fluid condensation occurs in these pores, gas–liquid interface is cylindrical surface, while the interface turns to be semi-spherical surface when evaporation occurs. The relative pressure when condensation occurs is greater than that when evaporation occurs. There may also be type I pores.
The pore types of samples TB, BD, SL, WJY, CYH, and WK belonging to type III “ink bottle” pores. This kind of pore–throat structure has a small radius and takes the throat as the channel which contains a larger pore size inside. When condensation occurs, the interface is cylindrical, and condensation could go on normally. However, when evaporation occurs, the fluid in the big pore inside taking throat as the channel cannot be discharged normally, which could be completed only when the relative pressure reduces to allow the fluid discharge at the throat. Therefore, the liquid nitrogen adsorption quantity reduces less in this range of relative pressure. Once the relative pressure drops to allow the throat in fluid flow, the adsorption quantity will decline rapidly, so that the adsorption loop will present a sharp decline in a turning point. Thus, this kind of pore has obvious difference from type II, with characteristics shown as: pores with radius less than 1.38 nm are type I pore which is closed at one end; and pores larger than 1.38 nm are type III “ink bottle” pores which might also contain type I and type II pores.
3.3. The Porosity and Pore Size Distribution by Nuclear Magnetic Resonance (NMR)
3.3.1. Determination of Optimum Centrifugal Force
In NMR experiment, the determination of the optimal centrifugal force is helpful for the accurate calculation of NMR T2C value that reflects the accuracy of pore size distribution (PSD). The NMR signal of the saturated water coals under different centrifugal forces are used to calculate and compare the change of water saturation to acquire the optimal centrifugal force. The changes of water saturation of the 16 coal samples are shown in Figure 4. The results show that the water saturation of coals keep decreasing when the centrifugal force increases, and the decrease range of water saturation is 13.85%~42.10% when the centrifugal force increases to 1.61MPa, with an average of 27.08%, which indicate that the pores mainly contain bound water. When the centrifugal force increases from 1.38 MPa to 1.61 MPa, the decrease range of water saturation is between 0.51% and 1.01% with an average of 0.71%, which is basically negligible. Therefore, it can be determined that 1.38 MPa (200psi) can be considered as the optimal centrifugal force to make saturated coal samples of different coal rank to reach the state of bound water.
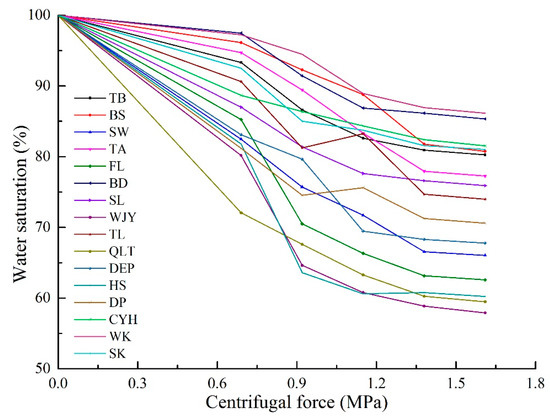
Figure 4.
Variation diagram of water saturation after centrifugation of different coal samples.
The water in pores is subjected to capillary pressure under the effect of centrifugal force, which is similar to the process of mercury withdrawal in MIP experiment. Therefore, the development characteristics of the pore in coals can also be studied by centrifugation [8]. However, the centrifugal pressure points selected in this experiment are scarce to characterize the pore development in detail.
3.3.2. Nuclear Magnetic Resonance (NMR) Porosity Characteristics of Coal Reservoirs
In the NMR signal calibration experiment, the detection of the quality and the nuclear magnetic signal of water sample are shown in Table 3. As shown in Figure 5, there is a good linear relationship between the quality of water sample and the nuclear magnetic signal amplitude. The nuclear magnetic porosity of coal sample can be calculated by using Equation (5).
Table 3.
Nuclear magnetic resonance (NMR) signal quantitatively calibrates the experimental data.
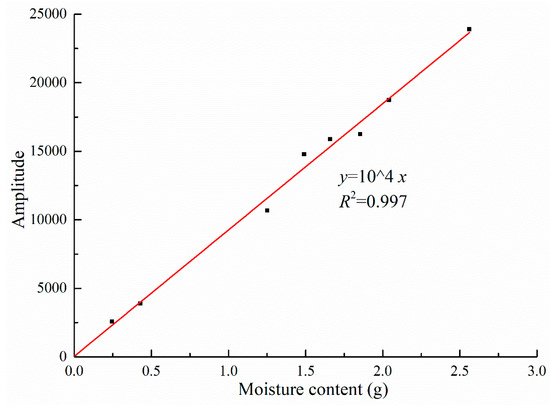
Figure 5.
Test results of water sample calibration.
As shown in Table 4, the results show that the nuclear magnetic porosity range of coal samples is 0.91%-20.43%, with an average of 5.74%, among which the porosity of low-rank coals is the highest, with an average of 9.80%, followed by that of medium–high rank coals, with an average of about 3.30%. As shown in Figure 6, most of the results of the experiment measurements of gas porosity are slightly higher than that of NMR measurement, which might because the helium molecule is 0.26 nm in diameter, far less than water molecule with diameter of 0.40 nm. Therefore, some water molecules cannot enter the super micropores using NMR, but this method can also basically reflect the characteristics of the porosity of coal samples.
Table 4.
Analysis of pore characteristics of experimental coal samples by Nuclear magnetic resonance (NMR).
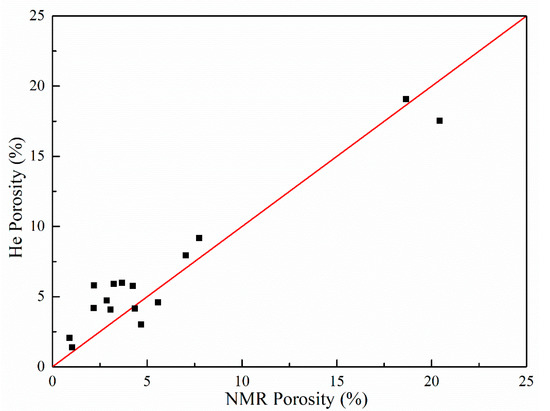
Figure 6.
Nuclear magnetic porosity versus gas porosity.
3.3.3. Pore Size Distribution by Nuclear Magnetic Resonance (NMR)
The NMR technology characterizing the pore structure of coals needs to calculate the T2 cutoff value (T2C) to perform the T2C and size conversion. As shown in Figure 7, the cumulative amplitude curve of NMR signal is respectively applied to the T2 spectrum before and after centrifugation, and the line parallel to X-axis is made from the maximum cumulative amplitude curve after centrifugation until it intersects the cumulative amplitude curve of saturated water. From the intersection point, the perpendicular line is introduced to the X-axis and then the value of T2C can be obtained. As shown in Table 4, the T2C value of coal samples ranges from 0.70 to 37.25 ms, with an average of 10.0 ms. The pore size of the coals can be calculated based on Equation (5) and the results of the corresponding pore volume are shown in Table 4. According to the PSD characteristics of coal samples in Figure 8, the experimental coal samples are mainly developed with micropores and transition pores, accounting for 59.09%~86.79% of the total pore volume, with an average of 73.42%, which is basically similar to the results of N2GA experiment. Moreover, the proportion of micropores gradually rises with the increase of coal rank, from 23.30% of low-rank coals to 25.55% of medium-rank coals and finally to 55.08% of high-rank coals.
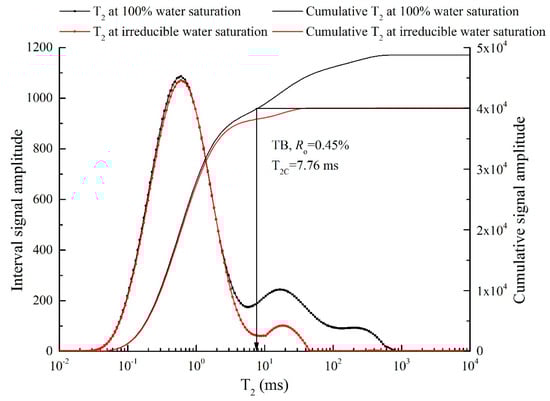
Figure 7.
Nuclear Magnetic Resonance (NMR) T2 distribution of experimental coal samples and calculation of T2C.
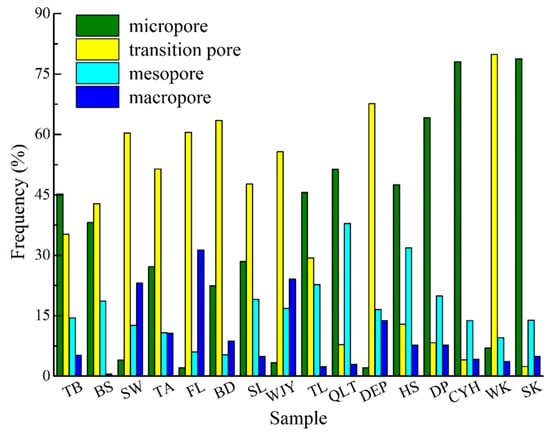
Figure 8.
Nuclear Magnetic Resonance (NMR) pore size distribution characteristics.
4. Discussion
4.1. The Total Pore Volume from Different Techniques
The calculated porosity and pore volume are shown in Table 5 and Figure 9. Comparison results show that the porosity is the largest, followed by , , and . The main reason for the results lies in the different experimental determination of pore size range. But can be completely used for laboratory test as an alternative within a certain error range. In addition, and display similar trend as with the change of coal rank. Previous research shows that the porosity changes with the coal facies and the influence of coal metamorphism degree [9]. In addition to the coal samples TA and FL, the porosity totally decreases and then rises with the increase of coal rank, and the value of Ro corresponding to the lowest point is about 2.0%. The main reason lies in that the coal seam compaction gradually strengthens with the higher metamorphic grade. The water in the pores and fractures is gradually discharged, which causes the increase the coal porosity. After the coal rank becomes semi-anthracite or anthracite, the internal fractures in the coal seam gradually increase and the total pore volume increases [10]. results are significantly smaller for the reason that the proportion of pores with diameter between 1.7 and 200 nm of total pore volume (including fracture) is too small, but the trend along with the coal rank is also similar to the results from other technologies.
Table 5.
Determination of different porosities and pore volume characterization of the porosity results.
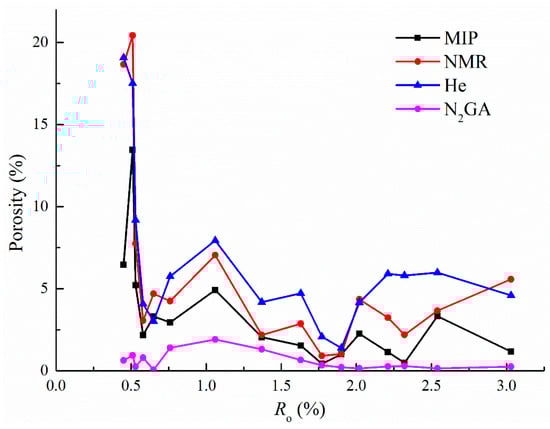
Figure 9.
Contrast of porosity with different pore characterization methods.
4.2. The Pore Size Distribution from Different Techniques
In order to compare the difference of PSD from three technologies, the porosity characteristics of coal were compared, combined with their individual test range of the pore size. As shown in Figure 10, the results of three experiments show that the PSD and porosity from NMR experiment are the largest, with the characterization range between 1 and 10000 nm, which basically covers the micropore to macropore segments required for the experiment. In the measurement range of MIP experiment, the characteristic PSD is basically consistent with NMR results, but there is peak dislocation. In addition to this, the results based on MIP are obvious or slightly higher than that from NMR when the pore size is less than 10 nm, which is mainly caused by two reasons: Firstly, excessive pressure during mercury injection could lead to the fracturing of some smaller micropores [11]. Secondly, large pores connected by throat can only be measured in the MIP experiment, resulting in the overestimation of pore size [12]. The variation of pore size from N2GA based on BJH method is similar to that of NMR, however N2GA value is obviously smaller and the curve compliance degree is not high. In general, the smaller the total pore volume is, the closer the characterization result is to the NMR result and the more accurate the pore characterization range is in the range of 10-100 nm. The characterization results of the pores with diameter less than 10 nm is significantly smaller, while that with diameter larger than 100 nm is larger. The possible reason is that the pore diameter of the adsorption layer is less than 10 nm, and the pore diameter calculated by the Kelvin Equation has a greater influence on the radius of the backfill layer, resulting in the smaller pore volume calculated by BJH method [13,14]. However, when the pores are larger than 100 nm in diameter, the relative pressure is close to 1, indicating that the condensation and evaporation rate is close to liquid nitrogen molecules, and the measuring range cut-off. However, at this time a layer of liquid nitrogen molecule film will be adsorbed on the wall of some large and medium-sized pores. This part of volume will also be added in the calculation using BJH method, resulting in the overestimation of pore volume. Therefore, an appropriate calculation model needs to be selected. In terms of applicability, NMR experiment is simple to operate and the pore range measured is wide, as a result, it is not bound by the theoretical model and has good applicability.
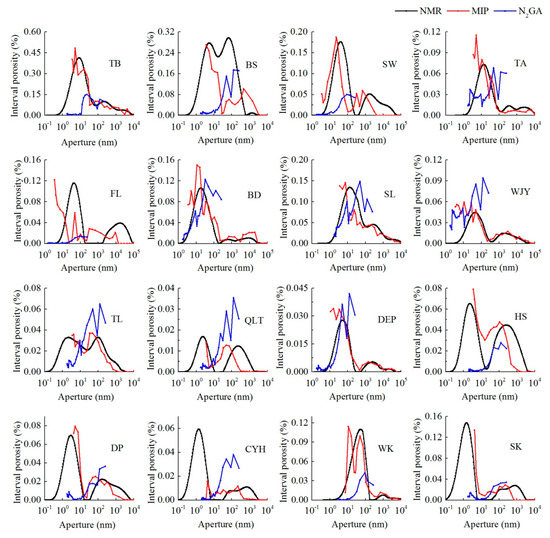
Figure 10.
Pore size distribution (PSD) comparison of coal samples from nuclear magnetic resonance (NMR), mercury intrusion porosimetry (MIP) and nitrogen adsorption (N2GA) techniques.
4.3. Error Analysis
The comparison of the PSDs calculated based on the three experiments shows that the NMR experiment is the most efficient means to characterize the pore structure. However, there are still some errors in NMR porosity compared with gas porosity. The main reason lies in the objective problems of the experimental instruments. Second, in terms of experimental design, the use of saturated water coal samples may have an impact on experimental authenticity and instrument sensitivity compared to actual formation groundwater condition, although it is simple to operate. Third, in experimental operation aspect, coal structure may be of different damage during the centrifugal operation of saturated water coal sample, which could cause the nuclear magnetic signal loss. Therefore, the PSDs from the three experimental methods is different and the compensation of the loss of nuclear magnetic signal and a method to determine T2C instead of centrifugation need to be explored.
4.4. The Impacts of Pore Structure on Fluid Transport
The microscopic pore structure has an important influence on the macroscopic physical properties of coal reservoir [15,16]. Although all pore structure results obtained in this study were measured at ambient pressure which is different to the condition in the subsurface, the data should provide valid comparison all pore structure is measured at accurate conditions. Coals with higher microporosity at high coal rank are commonly less permeable for fluid [4], and such a relationship is apparent for coals with high carbon content due to the larger amount of super micropores, micropores and mesopores. The establishment of the pore structure model can further help to understand the microscopic pore development characteristics of reservoir heterogeneity more simply and systematically, which can effectively reflect the mechanism of fluid diffusion and seepage [17], evaluate the fluid permeability of reservoir, and prevent the occurrence of gas burst accidents in “suffocating” coal seam.
5. Conclusions
In this paper, three kinds of experimental technologies, supplemented by gas porosity and permeability experiments, are applied to evaluate the coal pore characteristics and compare the results of pore size distribution characterized by different experiments. The following conclusions are drawn:
- (1)
- The porosity results indicate that the total pore volume of coal samples in different coal rank is significantly different, and the overall performance is that the total porosity decreases first and then increases with the increase of coal rank.
- (2)
- The N2GA experiment can effectively determine the types of pores and the development degree of specific surface area. The results show that the specific surface area of coals increases first and then decreases with the increase of coal rank. BJH calculation model can be used to effectively identify the pores within the diameter of 10-100 nm. For the calculation of pore diameter less than 10 nm, other models should be adopted for judgment.
- (3)
- NMR experiment in the characterization of pore structure has strong applicability and simple sample preparation. The test process is convenient, fast, and will not affect the pore structure of the sample. However, because of the differential damage of the centrifugal force in the centrifugal experiment on the development of coal samples with different structures, it is necessary to take some measures to compensate for the loss portion of NMR signal.
- (4)
- Coals at high coal rank are commonly having higher microporosity, and therefore a less permeable property could establish when no fractures existed. Such a relationship is apparent for coals with high carbon content due to the larger amount of super micropores and micropores.
Author Contributions
Funding acquisition, D.L.; Supervision, Y.C.; Validation, Y.Y., X.L. (Xiuqin Lu), X.L. (Xiawei Li), Q.Z. (Qingzhong Zhu); Writing—original draft, Q.Z. (Qianqian Zhang).
Funding
This research was funded by the National Natural Science Fund of China (grant nos. 41830427, 41602170 and 41772160), National Major Science and Technology Project (grant no. 2017ZX05064), Major Special Projects of PetroChina (grant no. 1617KZ14002), and the Fundamental Research Funds for Central Universities (grant no. 2652018002).
Conflicts of Interest
The authors declare no conflict of interest.
References
- Cai, Y.; Liu, D.; Pan, Z.; Yao, Y.; Li, J.; Qiu, Y. Pore structure and its impact on CH4 adsorption capacity and flow capability of bituminous and subbituminous coals from Northeast China. Fuel 2013, 103, 258–268. [Google Scholar] [CrossRef]
- IUPAC. Reporting physisorption data for gas/solid systems with special reference to the determination of surface area and porosity. Pure Appl. Chem. 1982, 54, 2201–2218. [Google Scholar] [CrossRef]
- Hodot, B.B. Outburst of Coal and Coalbed Gas (Chinese Translation); China Industry Press: Beijing, China, 1966; p. 318. [Google Scholar]
- Cai, Y.; Li, Q.; Liu, D.; Zhou, Y.; Lv, D. Insights into matrix compressibility of coals by mercury intrusion porosimetry and N2 adsorption. Int. J. Coal Geol. 2018, 200, 199–212. [Google Scholar] [CrossRef]
- Zheng, S.; Yao, Y.; Liu, D.; Cai, Y.; Liu, Y.; Li, X. Nuclear magnetic resonance T2 cutoffs of coals: A novel method by multifractal analysis theory. Fuel 2019, 241, 715–724. [Google Scholar] [CrossRef]
- Yao, Y.B.; Liu, D.M.; Cai, Y.D.; Li, J.Q. Coal pore-fracture characterized based on quantitative X-CT and NMR. Sci. China Earth Sci. 2010, 40, 1598–1607. [Google Scholar]
- Cai, Y.D.; Liu, D.M.; Yao, Y.B.; Li, J.Q.; Zheng, G.Q. The evolution of petrophysical properties of coalbed methane reservoirs under the heat treatment. Earth Sci. Front. 2014, 21, 240–248. [Google Scholar]
- Wu, S.; Tang, D.Z.; Li, S.; Meng, Y.J.; Lin, W.J. Evaluation of pore development in different coal reservoirs based on centrifugation experiment. J. Pet. Sci. Eng. 2017, 157, 1095–1105. [Google Scholar] [CrossRef]
- Zhang, S.; Tang, S.; Tang, D.; Pan, Z.; Yang, F. The characteristics of coal reservoir pores and coal facies in Liulin district, Hedong coal field of China. Int. J. Coal Geol. 2010, 81, 117–127. [Google Scholar] [CrossRef]
- Cai, Y.; Liu, D.; Pan, Z.; Che, Y.; Liu, Z. Investigating the effects of seepage-pores and fractures on coal permeability by fractal analysis. Transp. Porous Media 2016, 111, 479–497. [Google Scholar] [CrossRef]
- Li, X.; Kang, Y.; Haghighi, M. Investigation of pore size distributions of coals with different structures by nuclear magnetic resonance (NMR) and mercury intrusion porosimetry (MIP). Measurement 2018, 116, 122–128. [Google Scholar] [CrossRef]
- Zhang, L.; Lu, S.; Xiao, D.; Li, B. Pore structure characteristics of tight sandstones in the northern Songliao Basin, China. Mar. Pet. Geol. 2017, 88, 170–180. [Google Scholar] [CrossRef]
- Xiong, J.; Liu, X.; Liang, L. Experimental study on the pore structure characteristics of the Upper Ordovician Wufeng Formation shale in the southwest portion of the Sichuan Basin, China. J. Nat. Gas Sci. Eng. 2015, 22, 530–539. [Google Scholar] [CrossRef]
- Groen, J.; Peffer, L.; Pérez-Ramírez, J. Pore size determination in modified micro- and mesoporous materials. Pitfalls and limitations in gas adsorption data analysis. Microporous Mesoporous Mat. 2003, 60, 1387–1811. [Google Scholar] [CrossRef]
- Pan, J.; Wang, K.; Hou, Q.; Niu, Q.; Wang, H.; Ji, Z. Micro-pores and fractures of coals analysed by field emission scanning electron microscopy and fractal theory. Fuel 2016, 164, 277–285. [Google Scholar] [CrossRef]
- Nie, B.; Liu, X.; Yang, L.; Meng, J.; Li, X. Pore structure characterization of different rank coals using gas adsorption and scanning electron microscopy. Fuel 2015, 158, 908–917. [Google Scholar] [CrossRef]
- Fang, X.; Cai, Y.; Liu, D.; Zhou, Y. A mercury intrusion porosimetry method for methane diffusivity and permeability evaluation in coals: A comparative analysis. Appl. Sci. 2018, 8, 860. [Google Scholar] [CrossRef]
© 2019 by the authors. Licensee MDPI, Basel, Switzerland. This article is an open access article distributed under the terms and conditions of the Creative Commons Attribution (CC BY) license (http://creativecommons.org/licenses/by/4.0/).