Article

Evaluation of the Undrained Shear Strength in Preconsolidated Cohesive Soils Based on the Seismic Dilatometer Test

by
Paweł Galas
1,
Zbigniew Lechowicz
1,* and
Maria Jolanta Sulewska
2
1
Faculty of Civil and Environmental Engineering, Warsaw University of Life Sciences–SGGW, Nowoursynowska 159 St., 02-776 Warsaw, Poland
2
Faculty of Civil and Environmental Engineering, Bialystok University of Technology, Wiejska 45E St., 15-351 Bialystok, Poland
*
Author to whom correspondence should be addressed.
Appl. Sci. 2019, 9(8), 1660; https://doi.org/10.3390/app9081660
Submission received: 20 March 2019 / Revised: 15 April 2019 / Accepted: 18 April 2019 / Published: 22 April 2019
(This article belongs to the Section Materials Science and Engineering)

Abstract

:
The undrained shear strength in cohesive soils can be evaluated based on measurements obtained from the standard dilatometer test (DMT) using single- and multi-factor empirical relationships. However, the empirical relationships presented in the literature may sometimes show relatively high values of the maximum relative error. The add-on seismic module to the seismic dilatometer test (SDMT) extends parameters measurable in a standard dilatometer test by the shear wave velocity Vs as an independent variable. Therefore, a method for evaluating the undrained shear strength in cohesive soils based on data obtained from the seismic dilatometer test is presented in this study. In the method proposed, the two-factor empirical relationship for evaluating the normalized undrained shear strength τfu/σ’v is used based on independent variables: The normalized difference between the corrected second pressure reading and the corrected first pressure reading (p1po)/σv and the normalized shear wave velocity Vs/100. The proposed two-factor empirical relationship provides a more reliable evaluation of the undrained shear strength in the tested Pleistocene and Pliocene clays in comparison to the empirical relationships presented in the literature, with a maximum relative error max RE at about ±20% and the mean relative error RE at about 8%.

1. Introduction

In order to determine the geotechnical parameters the cone penetration tests and the standard penetration test (SPT) have wide applications. From in situ tests the cone penetration tests (cone penetration test CPT, cone penetration test with pore pressure measurement CPTU, seismic cone penetration test SCPT) have the widest use for estimating geotechnical parameters over a wide range of materials from very soft soils to weak rock. The flat dilatometer tests (DMT, SDMT) have become popular in many countries for estimating geotechnical parameters in non-cohesive and cohesive soils, however, their application is low in gravels and soft rocks [1,2].
The flat dilatometer was developed by Marchetti [3,4]. The detailed procedure for conducting the standard dilatometer test (DMT) and methodology of its interpretation were presented by Marchetti [5,6] and Marchetti et al. [7]. Comprehensive studies have been performed to improve some of the original correlations proposed by Marchetti. Numerous investigations have been made to expand the application of DMT in geotechnical engineering [8,9,10,11,12,13,14,15,16,17]. In most cases, the relationships used to evaluate geotechnical parameters from the dilatometer test such as the corrected first pressure reading po or the corrected second pressure reading p1, or index parameters such as the material index ID, horizontal stress index KD, and dilatometer modulus ED, are commonly applied.
Supplementing the instrumentation used to perform the dilatometer test with two geophones in the seismic dilatometer test (SDMT) has expanded possibilities of interpreting the test results [18,19]. The use of geophones enabled making measurements of an additional parameter in the form of shear wave velocity Vs. In this way, the SDMT, similarly to the SCPT, provides an additional measurement enabling the seismic assessment of the studied area and a more precise determination of many geotechnical parameters. Although the seismic dilatometer is used just for slightly more than twenty years, there is already extensive literature discussing the use of SDMT in soil characterization [20,21,22,23,24,25], assessment of geotechnical parameters [26,27,28,29,30,31], and design of geotechnical structures [32,33]. The shear wave velocity Vs with dilatometer measurements have been used so far to evaluate the initial shear modulus G0 [19,26,28], decay of the shear modulus G with the shear strain γ [19,29], interrelationship between G0 and operative modulus [27], detecting the presence of cementation [5], and cyclic resistance ratio CRR [30].
Undrained shear strength τfu is the basic parameter in the geotechnical design of different structures [34,35,36,37,38,39,40,41,42,43,44,45,46,47]. Evaluation of this parameter using dilatometer tests is usually based on empirical relationships. In single-factor relationship proposed by Marchetti [3] the horizontal stress index KD is used as the independent variable. Roque et al. [38] proposed an approach for estimating undrained shear strength using the corrected second pressure reading p1. A different relationship was proposed by Smith and Houlsby [39], in which undrained shear strength was a function of the corrected first pressure reading po. For normally consolidated marine clays, Iwasaki and Kamei [40] proposed a relationship, in which the dilatometer modulus ED is as independent variable.
A multi-factor relationship was proposed by Rabarijoely [41] to evaluate undrained shear strength τfu, in which as independent variables were the in situ effective vertical stress σ’v, as well as the net value of the corrected first pressure reading (pouo) and the net value of a corrected second pressure reading (p1uo). Galas [42] proposed a multi-factor relationship, in which the normalized net value of the corrected first pressure reading (pouo)/σ’v and the normalized net value of the corrected second pressure reading (p1uo)/σ’v were used as independent variables.
It should be noted that the regional geotechnical conditions could have substantial influence on the empirical relationships and the values of empirical coefficients [43,44,45,46,47,48]. It is important to point out, that the shear wave velocity Vs as an independent variable was not used so far to evaluate the undrained shear strength from the dilatometer test.
This paper presents the results of seismic dilatometer tests SDMT and laboratory tests of preconsolidated cohesive soils (Pleistocene clays and Pliocene clays). The undrained shear strength in cohesive soils is evaluated based on measurements obtained from the dilatometer test using single- and multi-factor empirical relationships presented in the literature. However, the empirical relationships sometimes show relatively high values of the maximum relative error max RE. In this study a method for evaluating the undrained shear strength of preconsolidated cohesive soils using statistical analysis based on data obtained from a seismic dilatometer test is presented. The presented multi-factor empirical relationship predicts the normalized undrained shear strength based on two independent variables: The normalized difference between the corrected second pressure reading and the corrected first pressure reading (p1po)/σv and the normalized shear wave velocity Vs/100. The proposed multi-factor empirical relationship provides a more reliable prediction of the undrained shear strength in comparison to the empirical relationships presented in the literature, with a max RE at about ±20% and the mean relative error RE at about 8%.

2. Methods and Materials

2.1. Dilatometer Test Procedure

Standard DMT test procedure involves pushing the blade vertically into the ground with readings at selected test depths. The readings are generally made at every 0.2 m of depth. The first A-reading pressure occurs at membrane “lift-off” and the second B-reading pressure after 1.1 mm movement [5,6,7,49,50].
After appropriate corrections described by Marchetti, the values of A and B pressures yield the values of the corrected first pressure reading po (0.00 mm expansion) and the corrected second pressure reading p1 [4]. Based on the corrected pressure readings po and p1, as well as in situ hydrostatic pore pressure uo and in situ effective vertical stress σ’v, the following index parameters were proposed by Marchetti [3]:
Material index
I D = ( p 1 p o ) / ( p o u o )
Horizontal stress index
K D = ( p o u o ) / σ v
Dilatometer modulus
E D = 34.7 · ( p 1 p o )
The use of a seismic dilatometer SDMT with two geophones enabled making additional measurements of shear wave velocity Vs every 0.5 m of depth (Figure 1).

2.2. Evaluation of Undrained Shear Strength From the Dilatometer Test

2.2.1. Single-Factor Relationships

Marchetti [3] proposed the following basic correlation between the normalized undrained shear strength and the horizontal stress index KD for cohesive soils (for material index ID < 1.2):
τ f u σ v = 0.22 · ( 0.5 · K D ) 1.25
Analysis of the DMT results presented in the literature [10,43,44,45,47] indicates that for particular soils, the relationship between the overconsolidation ratio (OCR) and the horizontal stress index KD, as well as the normalized undrained shear strength and the horizontal stress index KD differ from that proposed by Marchetti [3] and can be modified as follows:
τ f u σ v = S · ( n · K D ) m
where S = (τfu/σv)nc is the normalized undrained shear strength for normally consolidated soil, and n and m are empirical coefficients. It has long been recognized that normalized undrained shear strength in normally consolidated soil depends on the mode of testing, boundary conditions, strain rate, and other variables [34,35,37,44]. The different values of the S, n, and m parameters are shown in Table 1.
Roque et al. [38] proposed a relationship for estimating the undrained shear strength based on the corrected second pressure reading p1:
τ f u = ( p 1 σ h o ) / N C
where σho is the in situ horizontal total stress, and NC is the dilatometer factor for clays that varies from about 5 to 9. The research carried out by Roque et al. [38] and Galas [42] indicates the values of NC factor as shown in Table 1.
A different relationship has been proposed by Smith and Houlsby [39], in which the undrained shear strength was a function of the corrected first pressure reading po:
τ f u = ( p o σ h o ) / N D
where ND is the dilatometer bearing capacity factor, whose values are shown in Table 1.
For normally consolidated marine clays Iwasaki and Kamei [40] proposed a relationship, in which the dilatometer modulus ED is the independent variable:
τ f u = 0.018 · E D

2.2.2. Multi-Factor Relationships

A multi-factor relationship was proposed by Rabarijoely [41] to evaluate the undrained shear strength τfu of organic soils (organic mud, gyttja, and peat):
τ f u = α o · σ v α 1 · ( p o u o ) α 2 · ( p 1 u o ) α 3
where αo, α1, α2, α3 are the empirical coefficients. In this relationship, three factors are taken into account: The in situ effective vertical stress σ’v, the net value of the corrected first pressure reading (pouo) and the net value of the corrected second pressure reading (p1uo). The net values of the corrected first and second pressure readings were obtained by subtracting the in situ hydrostatic pore pressure uo from po and p1. The empirical coefficients to Equation (9) for Pleistocene clays and Pliocene clays evaluated by Lechowicz et al. [51] are shown in Table 1.
A two-factor relationship was proposed by Galas [42] to evaluate the normalized undrained shear strength τfu/σ’v of preconsolidated cohesive soils:
τ f u σ v = a o · ( p o u o σ v ) a 1 · ( p 1 u o σ v ) a 2
where ao, a1, a2 are the empirical coefficients. In this relationship, two factors are taken into account: The net value of the corrected first pressure reading normalized by in situ effective vertical stress σ’v and the net value of the corrected second pressure reading normalized by in situ effective vertical stress σ’v. The empirical coefficients to Equation (10) for Pleistocene clays and Pliocene clays evaluated by Galas [42] are shown in Table 1.

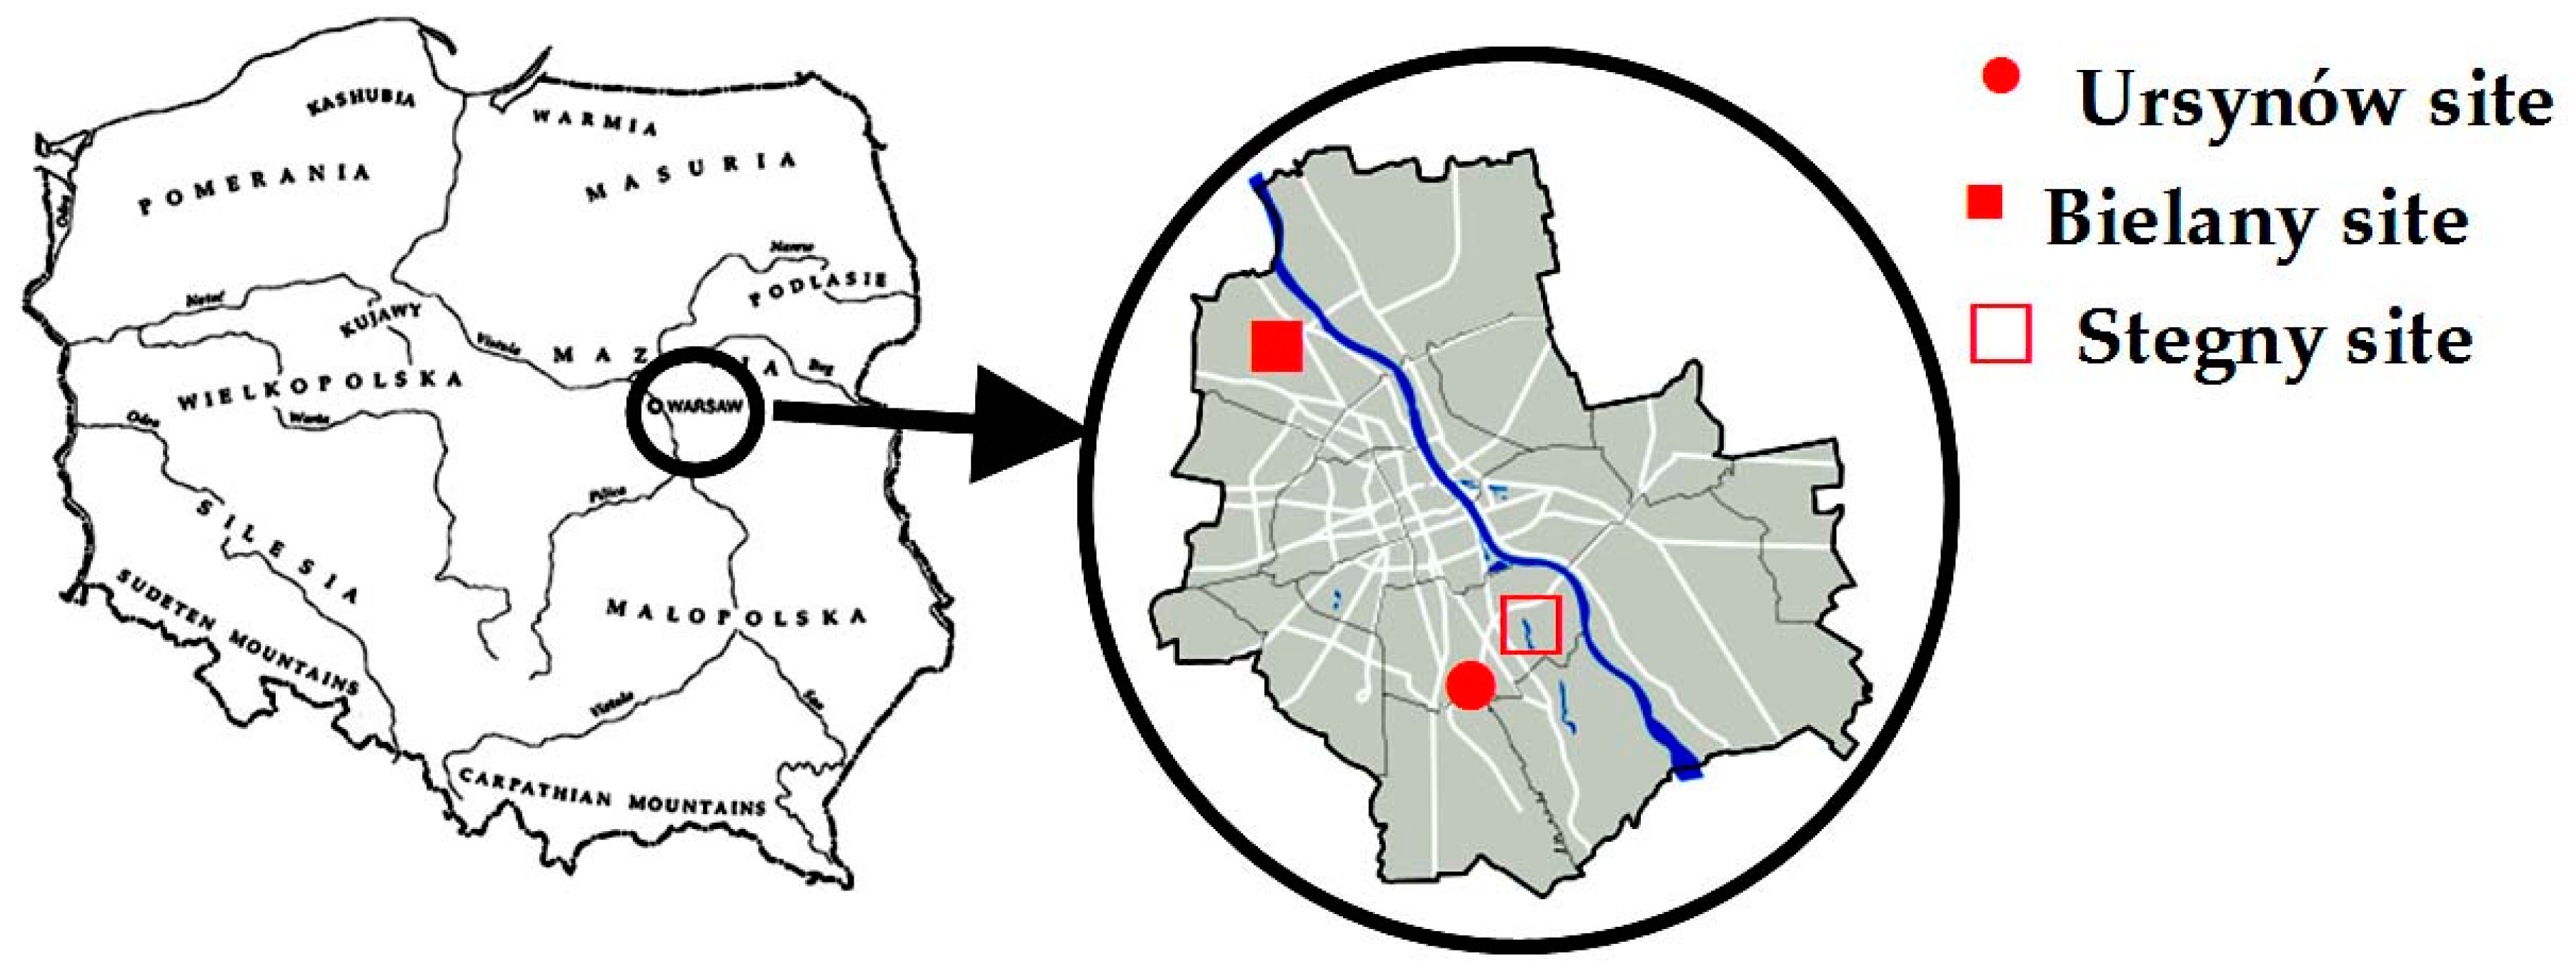
2.3. Characteristics of the Tested Cohesive Soils

Field tests coupled with laboratory tests were performed on three test sites located in Warsaw, Poland (Figure 2). The tested cohesive soils are Pleistocene moraine and lacustrine clays and Pliocene clays.

2.3.1. Ursynów Site

The Ursynów site is located on the Warsaw University of Life Sciences—SGGW campus in the southern part of Warsaw. Three locations were selected here: The Conference Auditorium, Building No. 37, and Building No. 34. The tested subsoil consists of anthropogenic fill with thickness 3.5–4.0 m below Pleistocene moraine deposits of the Riss Glaciation classified as stiff brown moraine clays of the Warta Glaciation with thickness from 2 m to 4 m and grey moraine clays of the Odra Glaciation with a thickness of 2.5–3.0 m.
The cohesive soils are underlain by Quaternary sands of the Mazovian Interglacial whose top lies at 9.5 m to 10.0 m below ground level. There is one aquifer on the Ursynów site; a free groundwater table is found in sands at a depth of 10 m to 12 m below ground level.
Glacial moraine deposits of the Warta and Odra Glaciations are classified as low plasticity clays. Grain size distribution of the tested soils (Figure 3) shows that according to EN ISO 14688-1 and 2 Standards [52,53], the glacial moraine clays are classified as silty sandy clays (sasiCl) and clayey sands (clSa). The index properties of the tested soils for nine undisturbed soil samples (No. 1–9) are shown in Table 2. The glacial moraine clays are preconsolidated with an overconsolidation ratio OCR determined from SDMT decreasing with depth from 20 to 12 for brown moraine clays of the Warta Glaciation and from 15 to 8 for grey moraine clays of the Odra Glaciation.

2.3.2. Bielany Site

The Bielany site is located in the northern part of Warsaw. The cohesive soils studied are Pleistocene moraine and lacustrine deposits of the Warta Glaciation with a thickness of about 10–12 m and the top occurring at 5.5 m below ground level. The groundwater table was found at the depth of 5.4 m, or in the form of sifting in sandy interbeddings of cohesive soils. The main aquifer is drilled at the depth of 15.5–17.5 m; it is tight and stabilizes at the depth of about 5 m below ground level.
Moraine and lacustrine deposits of the Warta Glaciation are low plasticity clays. Grain size distribution of the tested soils (Figure 3) shows that according to EN ISO 14688-1 and 2 Standards [52,53], the cohesive soils are classified as silty sandy clays (sasiCl) and silty clays (siCl). The index properties of the tested soils for four undisturbed soil samples (No. 10–13) are shown in Table 2. The moraine and lacustrine clays are preconsolidated with overconsolidation ratio, OCR, increasing with depth from 3 to 7.

2.3.3. Stegny Site

The Stegny test site is located in the Vistula valley, on a floodplain terrace in the southern part of Warsaw. The cohesive soils tested occur in a glaciotectonically disturbed area and represent stiff Pliocene clays covered with fine and medium sands from the Würm-Vistula Glaciation period, with a thickness of 4.0–5.0 m. Pliocene clays are classified as high plasticity clays. The groundwater table was found at the depth of 3 m. Grain size distribution of the tested soils (Figure 3) shows that according to EN ISO 14688-1 and 2 Standards [52,53], the cohesive soils are classified as silty clays (siCl) and clays (Cl). The index properties of the tested soils for three undisturbed soil samples (No. 14–16) are shown in Table 2. The glacitectonically disturbed Pliocene clays are preconsolidated with the overconsolidation ratio, OCR, increasing with depth from 5 to 8.

3. Results

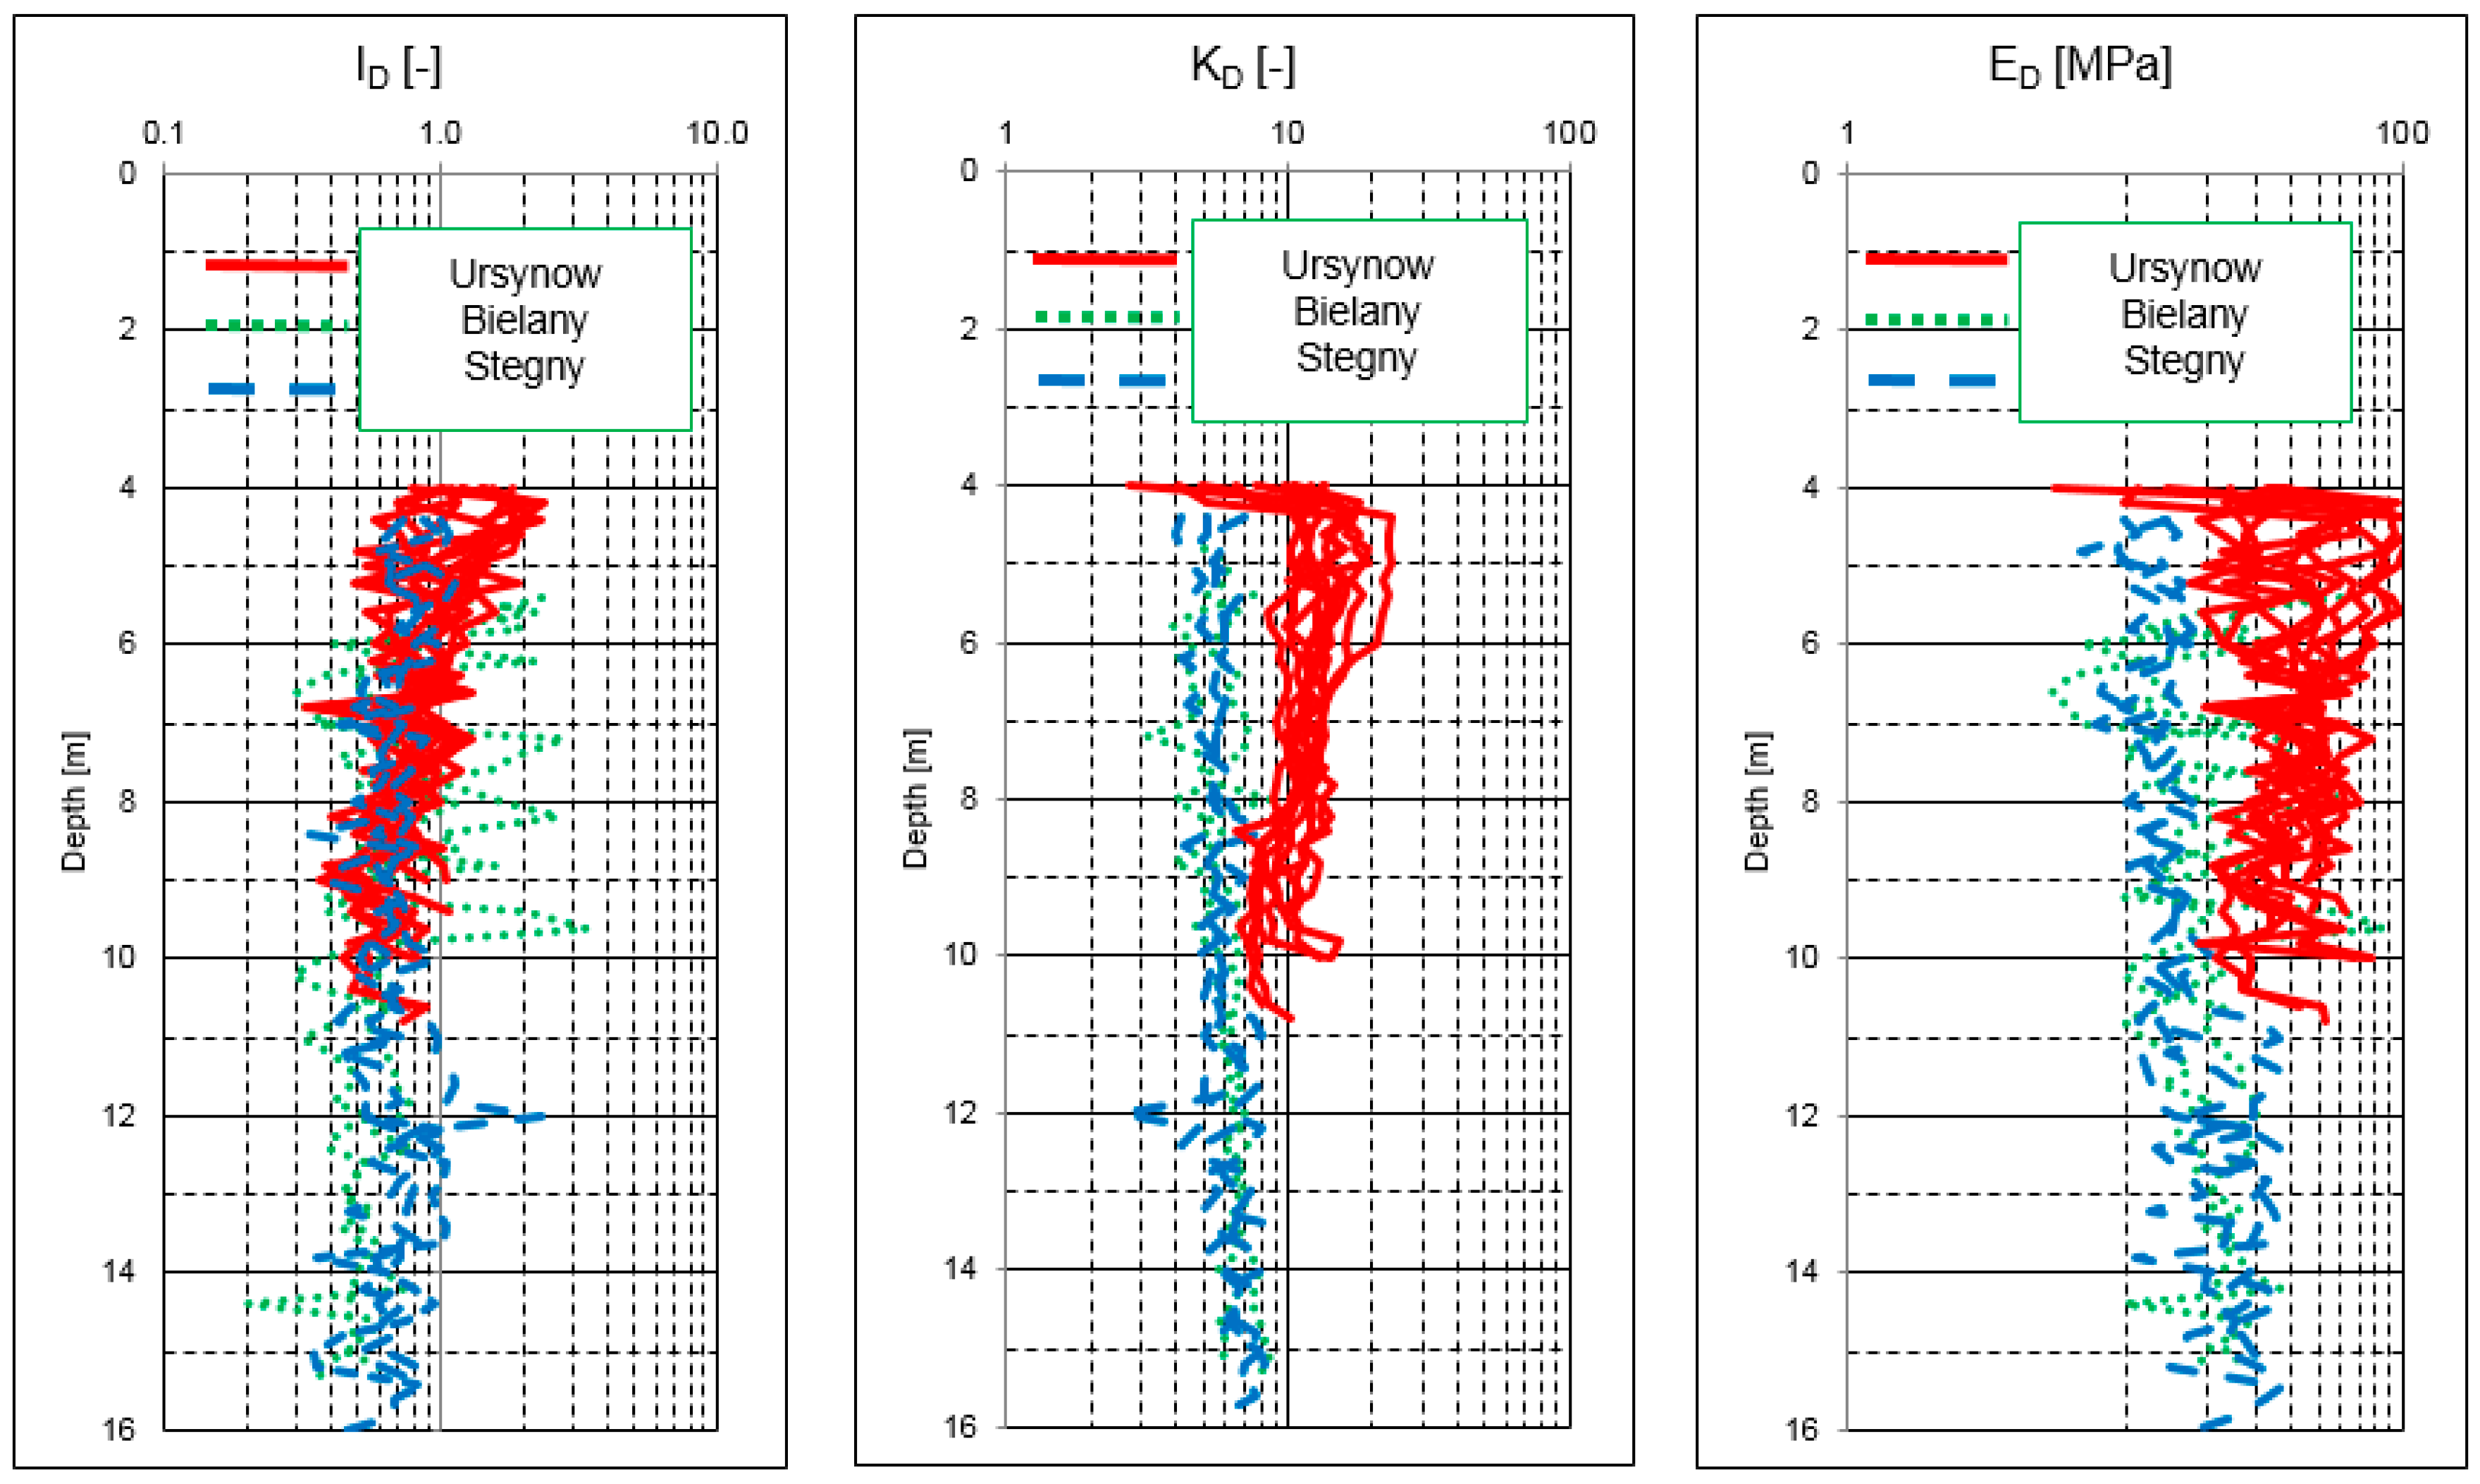
3.1. Results of Seismic Dilatometer Tests

Field investigations on test sites included seismic dilatometer tests and drillings with collecting of undisturbed soil samples by a Shelby sampler with an inner diameter of 89 mm. As part of the research work, 16 seismic dilatometer tests were made up to a depth of 9.5–16.0 m below ground level. The tests were carried out in nodes consisting of three to four SDMT, located in the vicinity of the borehole. The exceptions included studies carried out at the Bielany site, where the two drillings were completed with two SDMT. The seismic dilatometer test was performed in accordance with Marchetti’s guidelines [7,8,19]. In order to generate the shear wave, a steel beam with a hammer construction that allows the hammer head to be easily hit against the beam’s forehead was used. A hammer with a weight of approx. 15 kg and a beam with dimensions of 0.2 m × 0.7 m × 0.1 m were used. The instrument used to generate the waves in a ground was pressed by means of the probe’s foot (Figure 4).
SDMT data profiles including the corrected pressure readings po and p1, shear wave velocity Vs as well as the index parameters ID, KD, and ED from dilatometer tests obtained at the Ursynów, Bielany and Stegny sites, respectively, are presented in Figure 5 and Figure 6. The cohesive soils from the Ursynów site showed that the values of the index parameters KD and ED decreased with depth. A greater variation of KD and ED values was obtained in brown moraine clays of the Warta Glaciation than in grey moraine clays of the Odra Glaciation. In the brown moraine clays of the Warta Glaciation the presence of cementation was detected. The index parameters KD and ED were increasing with depth in the moraine and lacustrine deposits of Warta Glaciation from the Bielany site and Pliocene clays from the Stegny site. The mean values, standard deviations and coefficients of variation of these readings and indexes are presented in Table 3. The average coefficients of variation for Vs, ID, KD, and ED were 0.13, 0.43, 0.20, and 0.41, respectively. The dilatometer modulus ED showed quite a high coefficient of variation. As an independent variable the shear wave velocity Vs showed quite a small coefficient of variation.

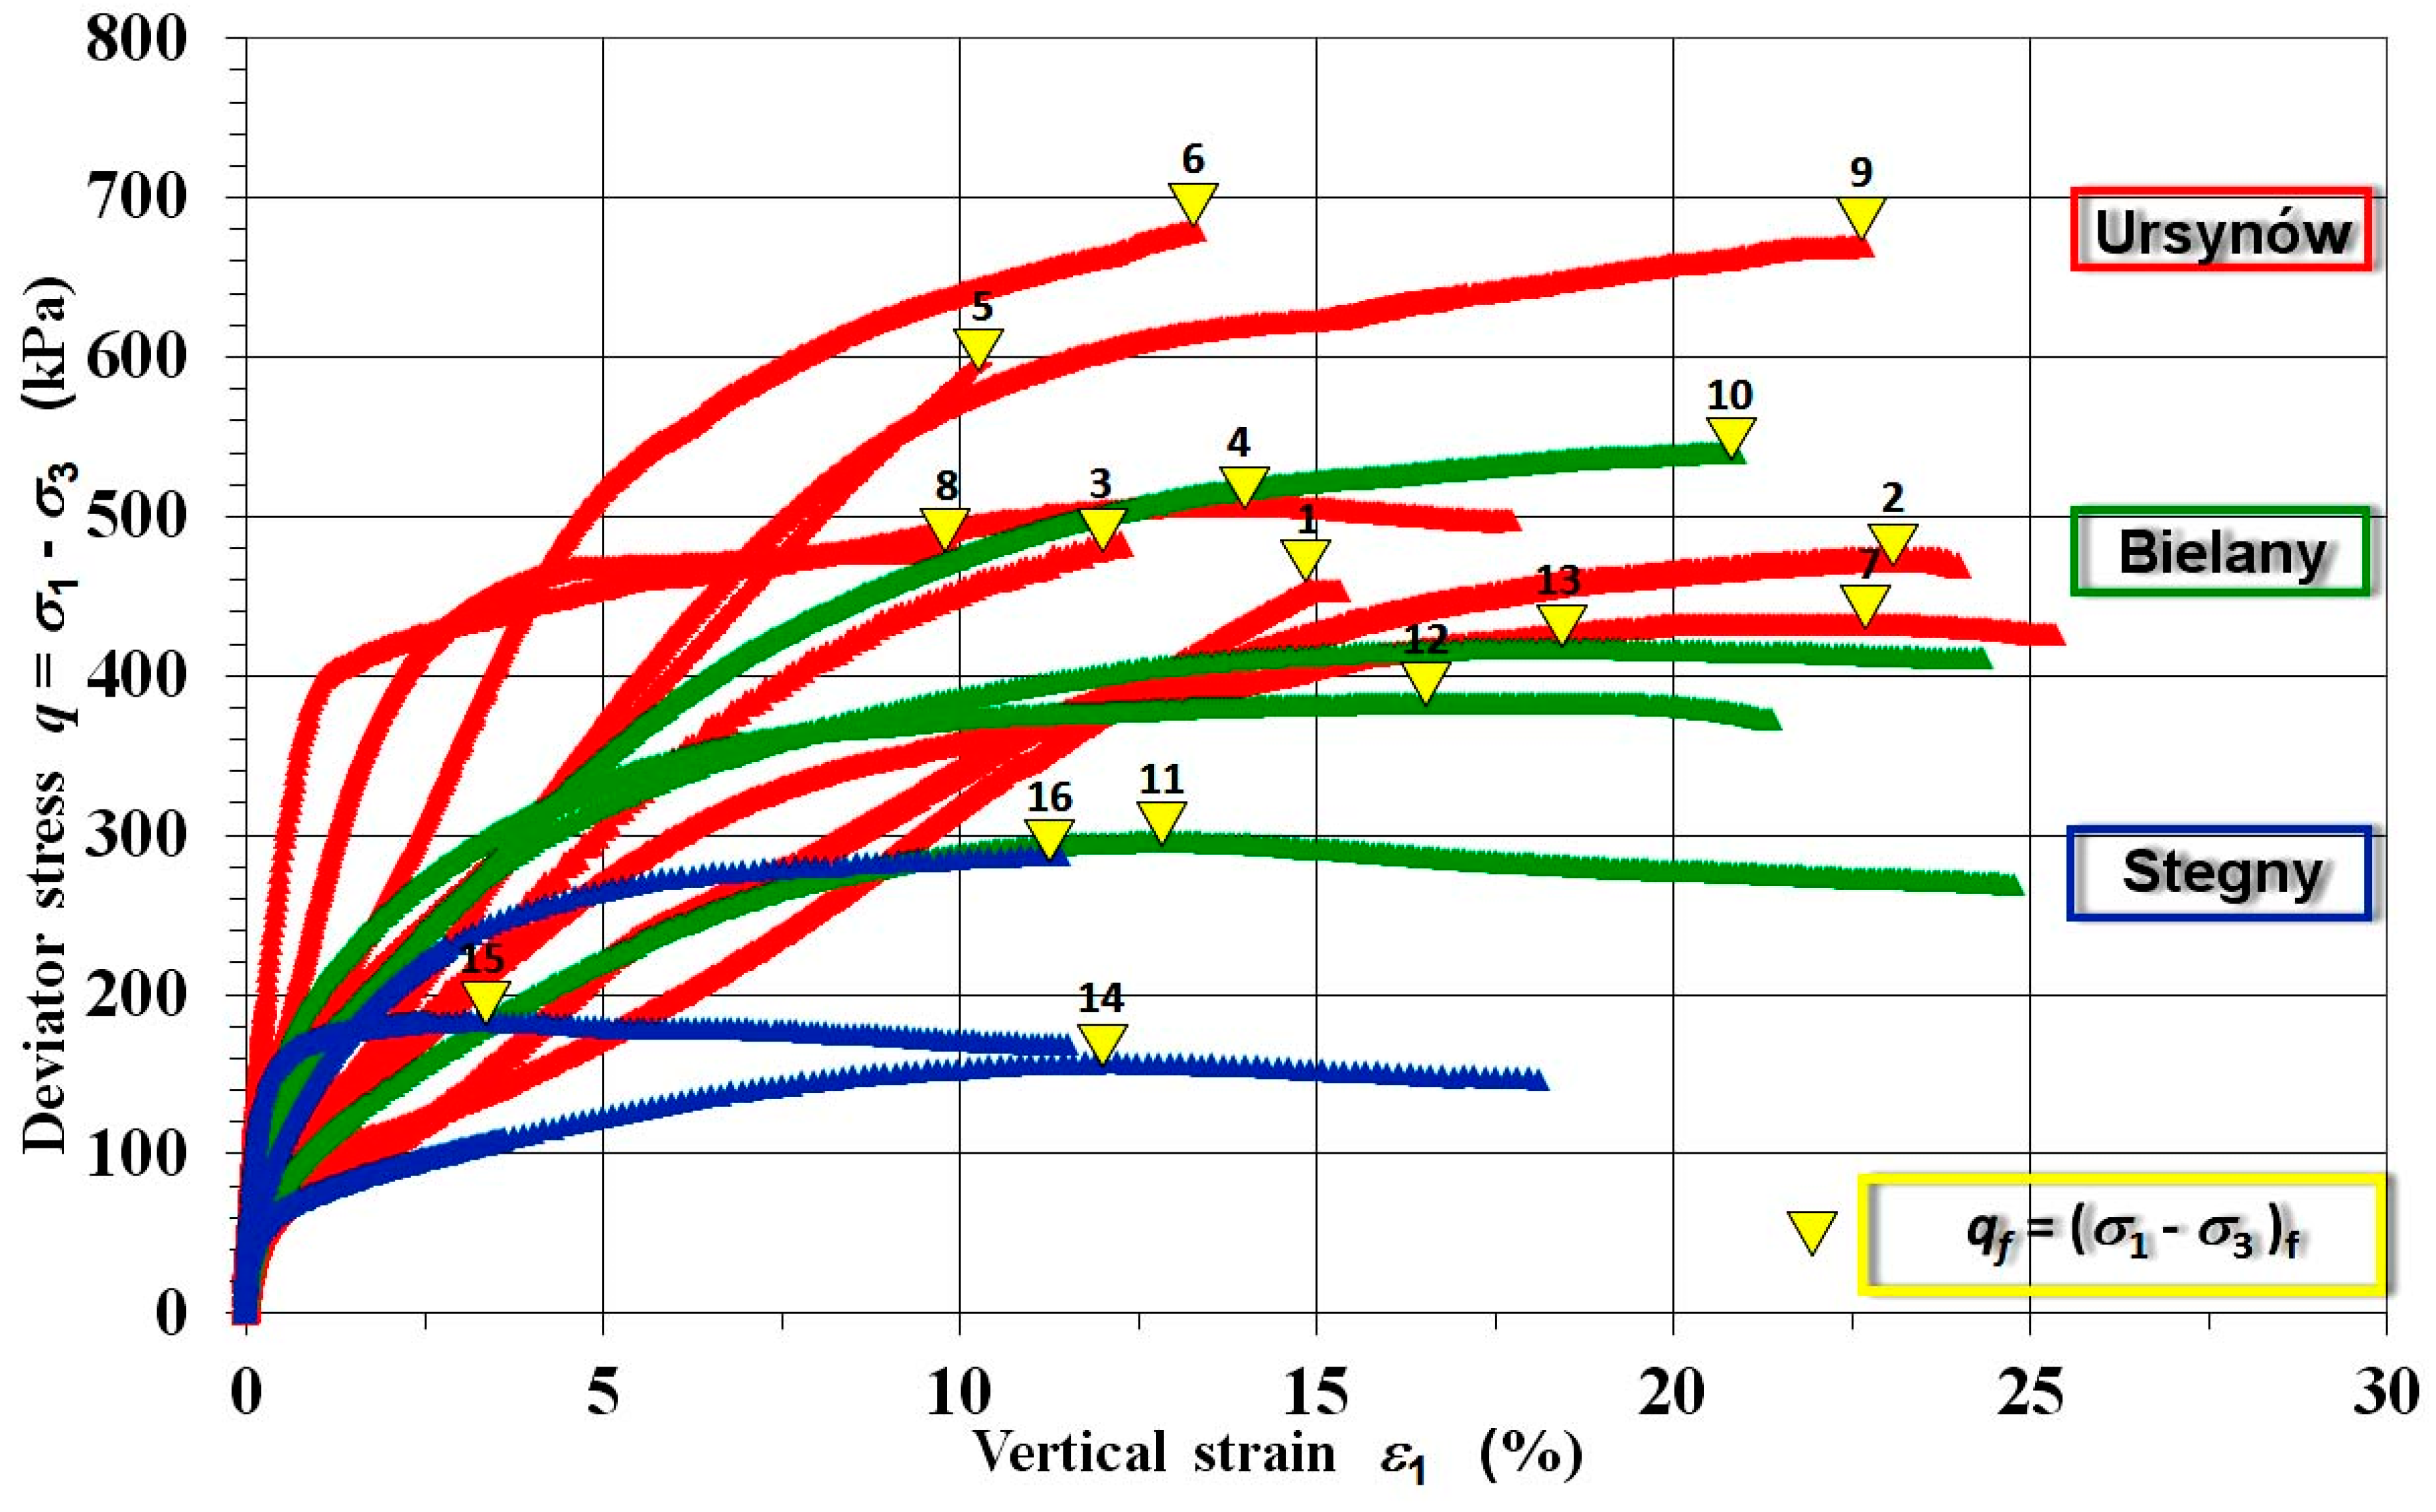
3.2. Results of Triaxial Tests

The undrained shear strength τfu in cohesive soils from the Ursynów, Bielany, and Stegny sites was determined in CIU triaxial tests on isotropically consolidated samples with shearing in undrained conditions. The CIU triaxial tests were performed in four consecutive stages: Flushing, saturation, consolidation, and shearing in undrained conditions. Saturation of soil samples was performed using the back pressure method. Figure 7 presents the characteristics of the deviator stress q depending on the vertical strain ε1 from CIU triaxial tests for the tested cohesive soils. Based on the deviator stress at failure qf the undrained shear strength was determined as τfu = qf/2 which is shown in Table 4 and was used in statistical analysis.

4. Evaluation of the Undrained Shear Strength Based on Empirical Relationships

The variables from seismic dilatometer tests used in the evaluation of the undrained shear strength τfu are presented in Table 4.
In order to compare the undrained shear strength evaluated on the basis of empirical relationships with undrained shear strength from CIU triaxial tests obtained for a given depth, the measurements from seismic dilatometer tests were subjected to the averaging procedure. The applied procedure consisted of calculating the mean value of pressures po and p1, shear wave velocity Vs, and index parameter KD. The mean value for each selected depth came from three to four dilatometer tests (Bielany site is an exception) located in a given test node. Because CIU triaxial tests were made by using core samples of about 0.4 m in length, the mean was taken from three, nine, or twelve readings at a given depth and ±0.20 m.
Evaluation of the undrained shear strength τfu in preconsolidated cohesive soils from seismic dilatometer tests was performed using single- and multi-factor empirical relationships proposed by: Marchetti (4) [3], Roque et al. (6) [38], and Smith and Houlsby (7) [39], as well as the three-factor relationship of Rabarijoely [41] using Equation (9), the empirical coefficients determined by Lechowicz et al. [48] and the two-factor relationship of Galas [42] using Equation (10).
For each relationship, the maximum relative error max RE (Table 5) for the particular test site was selected from the values of relative errors RE calculated according to the formula:
R E = | ( d ( p ) y ( p ) ) / d ( p ) | · 100 %
where p is the case number, p ∈ {1, …, P}, P is the number of cases, d(p) is the measured value, and y(p) is the calculated value.
Using the max RE obtained for five locations the mean value of max RE was calculated for each relationship. Based on all test sites the mean value of the RE was also calculated for a particular relationship (Table 5).
Analysis of the calculation results indicated quite high values of max RE obtained for the undrained shear strength evaluated on the basis of the single-factor empirical relationship of Marchetti ranging between 21.3–43.9%. The max RE values calculated for τfu evaluated from the Roque et al. relationship with the bearing capacity factor NC determined for Pleistocene and Pliocene clays ranged between 6.0–47.6%. The max RE values calculated for undrained shear strength evaluated from the Smith and Houlsby relationship with the bearing capacity factor ND determined for Pleistocene and Pliocene clays were in the range of 2.8–43.2%. The mean values of the max RE for the Marchetti, Roque et al., and Smith and Houlsby relationships were 31.8, 21.2, and 20.6%, respectively. The mean values of the relative error RE (from 16 tests) for the Marchetti, Roque et al., and Smith and Houlsby relationships were 20.4, 14.1, and 12.0%, respectively.
The comparison carried out for the three-factor relationship of Rabarijoely, for which the empirical coefficients were determined for Pleistocene and Pliocene clays, indicated quite high max RE values of the τfu in the range of 30.9–47.7%. The mean value of max RE was 39.5% and the mean values of relative error RE (from 16 tests) was 30.6%. Using the two-factor relationship of Galas, the max RE values of the τfu ranged between 8.6–33.9%, the mean value of max RE was 21.7% with the mean value of relative error equal to 12.9%. This showed that the two-factor relationship of Galas gives a better accuracy compared to the Rabarijoely relationship.
This evidences that the evaluation of the undrained shear strength from dilatometer tests for the Pleistocene and Pliocene clays from the analyzed relationships resulted in quite high max RE values exceeding 34%. However, in the case of the Roque et al., Smith and Houlsby, and Galas relationships, the mean values of the max RE showed better accuracy and were at about 21%. From among the single-factor empirical relationships the Smith and Houlsby relationship and from among the multi-factor relationships the Galas relationship gave better accuracy with the mean value of the relative error RE at about 12% and 13%, respectively.

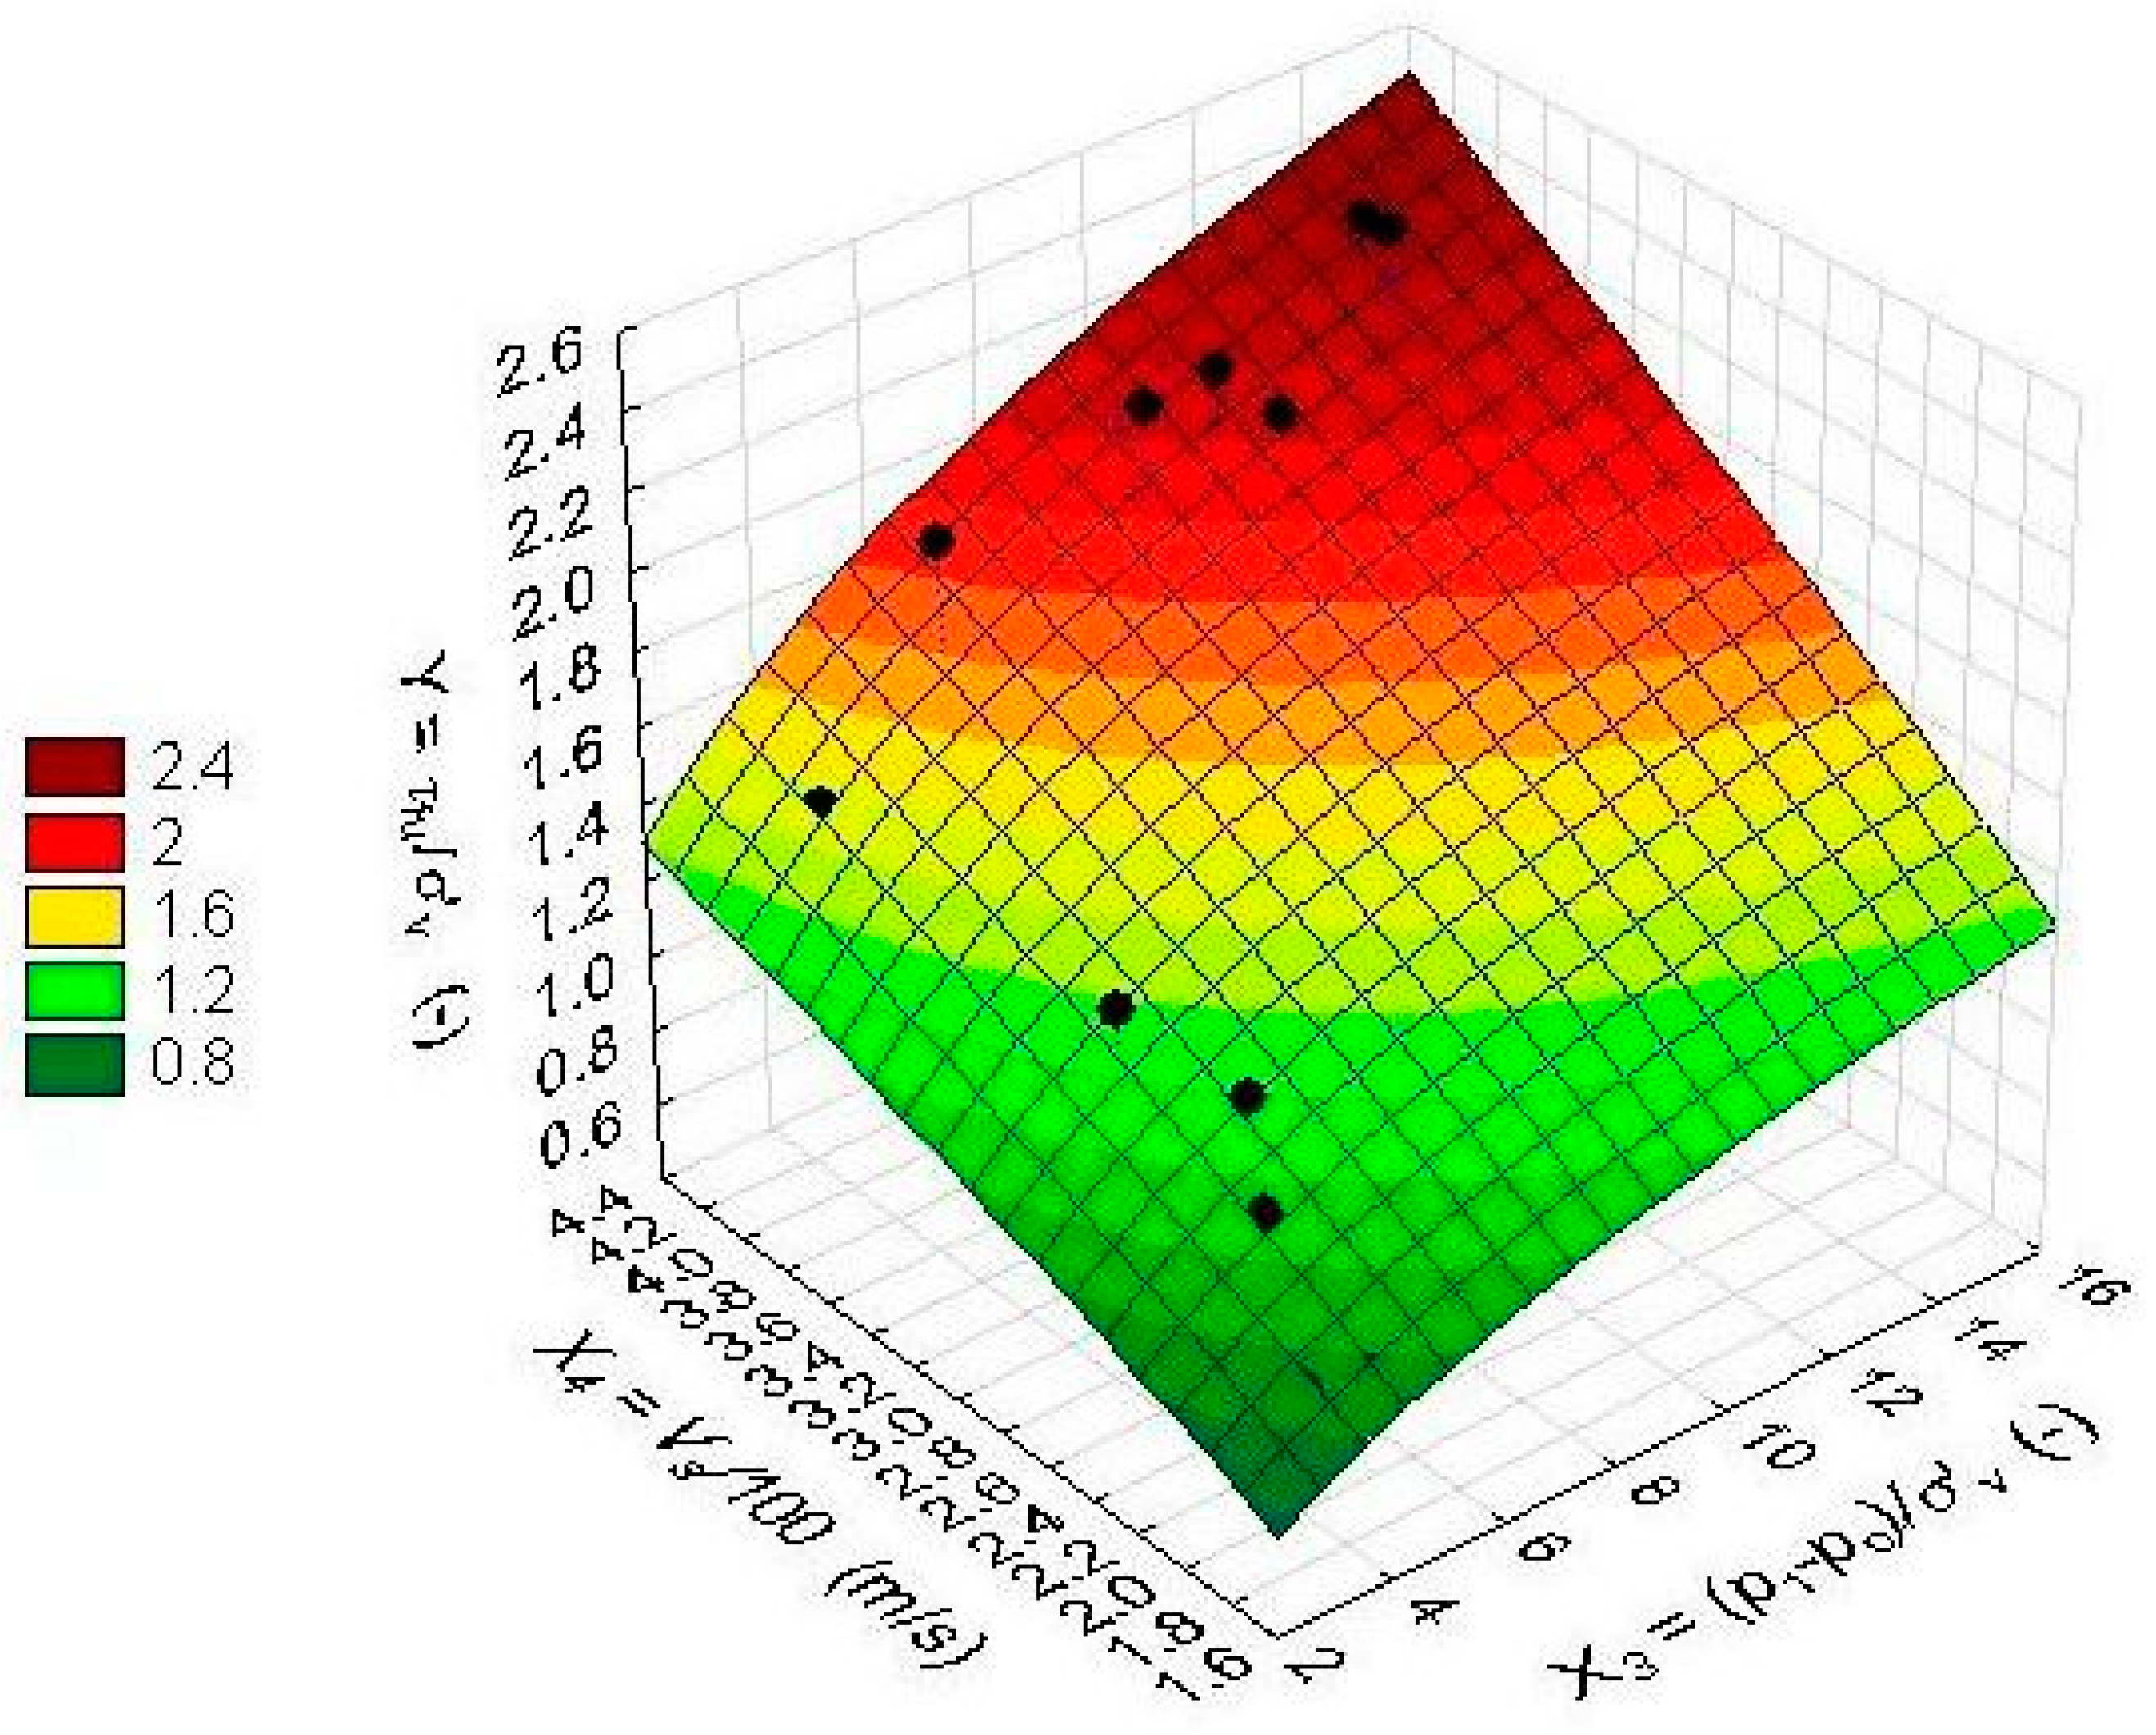
5. Statistical Analysis

Statistical analysis of the SDMT results was carried out using the Statistica software version 12 [54,55,56]. Models of linear and nonlinear regression were analyzed [57]. The analyzed data set comprised the P = 16 pattern described by one dependent variable the normalized undrained shear strength Y = τfu/σ’v ∈ {0.803–2.382}, and four independent variables: The normalized net value of the corrected first pressure reading X1 = (pouo)/σ’v ∈ {4.301–13.743}; the normalized net value of the corrected second pressure reading X2 = (p1uo)/σ’v ∈ {9.222–27.525}; the normalized difference between corrected second pressure reading and the corrected first pressure reading X3 = (p1po)/σ’v ∈ {3.559–13.782}; and the normalized shear wave velocity X4 = Vs/100 ∈ {1.750–4.240}, selected from the variables presented in Table 4.
Simple regression models were considered:
y = a + b x ± S E E
where a is intercept of line, b is slope of line, and SEE is the standard error of estimation.
In the case when measurement of the shear wave velocity Vs was not carried out, the τfu/σ’v can be evaluated using simple linear regressions shown as Equation (13) or Equation (14), which explain 85.5% and 83.1% of the variability of Y = τfu/σ’v, respectively (Table 6). Plots of regression lines (13) and (14) with 95% confidence intervals are given in Figure 8. The simple linear regression models (15) and (16) shown in Table 6 gave worse accuracy.
The linear two-factor regression model was in the form of:
y = a o + a 1 x 1 + a 2 x 2 ± S E E
where a 0, a1, and a2 are regression coefficients.
The non-linear two-factor regression model was adopted based on the analysis of the curve shape and scatterplots of variables. Among the linearized models, i.e., those that can be reduced to a linear form by appropriate transformation of variables or parameters, the power function of the form was selected:
y = β o · x 1 β 1 · x 2 β 2
Logarithmic transformation was applied and a transformed regression model was obtained:
l o g   y = l o g   β o + β 1 · l o g   x 1 + β 2 · l o g x 2
The non-linear two-factor regression was considered as the best model. The fulfilment of statistical assumptions (e.g., normality of residual distribution and residuals analysis) was checked.
A non-linear two-factor relationship to evaluate the normalized undrained shear strength τfu/σ’v of preconsolidated cohesive soils based on seismic dilatometer test in a general form is proposed as follows:
τ f u σ v = β o · ( p 1 p o σ v ) β 1 · ( V s 100 ) β 2
where βo, β1, and β2 are the empirical coefficients. The empirical coefficients to Equation (20) for Pleistocene clays and Pliocene clays were evaluated by statistical analysis using the input and output data shown in Table 4. The empirical coefficients of the linear two-factor relationship (Equation (21)) and non-linear two-factor relationship (Equation (22)) are presented in Table 7. Graphic presentation of the proposed relationship is shown in Figure 9.
The proposed non-linear two-factor relationship (Equation (22), Table 7) was considered the best of all analyzed relationships. The accuracy of the prediction using the proposed relationship (Equation (22)) is illustrated by a graph of the dependence of the measured τfu/σ’v values and τfu/σ’v values predicted by the proposed relationship (Equation (22), Figure 10). The maximum relative prediction error max RE of the proposed relationship for τfu/σ’v based on all the data was ±20.4%. A comparison between measured values of τfu/σ’v obtained from the CIU triaxial tests and values of τfu/σ’v evaluated using the proposed relationship (Equation (22)) are shown in Table 8. The mean value of the max RE was about 13.2% and the mean value of the relative error RE for all data was about 8.5%.

6. Conclusions

The analysis carried out for Pleistocene and Pliocene clays indicates that the evaluated undrained shear strength τfu from the dilatometer test on the basis of single-factor empirical relationships: Marchetti, Roque et al., and Smith and Houlsby gives quite high values of the maximum relative error max RE from 43% up to 48%. The two-factor relationship of Galas presented somewhat smaller values of the max RE up to 34%. From the single-factor empirical relationships the Smith and Houlsby relationship and from the multi-factor relationships the Galas relationship gave better accuracy with the mean value of relative error RE at about 12% and 13%, respectively. So far the shear wave velocity Vs as an independent variable was not used to evaluate the undrained shear strength from the dilatometer test.
The normalized undrained shear strength τfu/σ’v in Pleistocene and Pliocene clays from the seismic dilatometer test (SDMT) can be evaluated using the proposed two-factor relationship based on the normalized difference between the corrected second pressure reading and the corrected first pressure reading (p1po)/σ’v, and the normalized shear wave velocity Vs/100. The proposed relationship provides the evaluation of the normalized undrained shear strength τfu/σ’v in Pleistocene and Pliocene clays from the seismic dilatometer test with a maximum relative error at about ±20% and with the mean value of relative error RE at about 8%. Further research is needed for different types of cohesive soils with a higher variability of the plasticity index IP, consistency index IC, and stress history to verify empirical coefficients determined in this study.

Author Contributions

P.G. prepared the research program, performed the SDMT tests, analyzed the test results, and prepared the manuscript. Z.L. prepared the research program, analyzed the test results and prepared the manuscript. M.J.S. performed the statistical analysis and prepared the manuscript.

Funding

This research was funded by the Polish Ministry of Science and Higher Education.

Acknowledgments

This work was carried out in cooperation with the partners from the Warsaw University of Life Sciences, Warsaw, Poland and the Bialystok University of Technology, Bialystok, Poland and was supported by the Polish Ministry of Science and Higher Education. A seismic dilatometer was used in the research purchased as part of the project “Water Center” of the Faculty of Civil and Environmental Engineering at the Warsaw University of Life Sciences implemented under the Operational Program Infrastructure and Environment, Measure 13.1, priority XII in 2010.

Conflicts of Interest

The authors declare no conflict of interest.

References

  1. Mayne, P.W.; Coop, M.R.; Springman, S.M.; Huang, A.B.; Zornberg, J.G. Geomaterial behaviour and testing. State of the Art (SOA) paper. In Proceedings of the 17th International Conference on Soil Mechanics and Geotechnical Engineering, Alexandria, Egypt, 18–21 October 2009; Volume IV, pp. 2777–2872. [Google Scholar]
  2. Robertson, P.K. The James K. Mitchell Lecture: Interpretation of in-situ tests—Some insights. In Proceedings of the Fourth International Conference on Geotechnical and Geophysical Site Characterization, Porto de Galinhas, Brazil, 18–21 September 2012; Volume I, pp. 3–24. [Google Scholar]
  3. Marchetti, S. A new in situ test for the measurement of horizontal soil deformability. In Proceedings of the Conference on In Situ Measurement of Soil Properties, ASCE, Raleigh, NC, USA, 1–4 June 1975; Volume 2, pp. 255–259. [Google Scholar]
  4. Marchetti, S. In Situ Tests by Flat Dilatometer. J. Geotech. Geoenviron. Eng. 1980, 106, 299–321. [Google Scholar]
  5. Marchetti, S. Some 2015 Updates to the TC16 DMT Report 2001. In Proceedings of the 3rd International Conference on the Flat Dilatometer (DMT’15), Roma, Italy, 14–16 June 2015; pp. 43–65. [Google Scholar]
  6. Marchetti, S. Flat dilatometer (DMT). Applications and recent developments. In Proceedings of the Indian Geotechnical Conference, Pune, India, 16–19 December 2015. [Google Scholar]
  7. Marchetti, S.; Monaco, P.; Totani, G.; Calabrese, M. The flat dilatometer test (DMT) in soil investigations—A report by the ISSMGE Committee TC16. In Proceedings of the International Conference on Insitu Measurement of Soil Properties and Case Histories, Bali, Indonesia, 21–24 May 2001; p. 41. [Google Scholar]
  8. Marchetti, S.; Crapps, D.K. Flat Dilatometer Manual; Internal Report of GPE; GPE: Princeton, NJ, USA, 1981. [Google Scholar]
  9. Lutenegger, A.J. Current status of the Marchetti dilatometer test. In Proceedings of the 1st International Symposium on Penetration Testing (ISOPT-1), Orlando, FL, USA, 20–24 March 1988; Volume 1, pp. 137–155. [Google Scholar]
  10. Briaud, J.L.; Miran, J. The Flat Dilatometer Test; Publ. FHWA-SA-91-044; Civil Engineering Department, Texas A&M, for Federal Highway Administration: College Station, TX, USA, 1991.
  11. Ozer, A.T.; Bartlett, S.F.; Lawton, E.C. DMT testing for consolidation properties of the Lake Bonneville Clay. In Proceedings of the 2nd International Flat Dilatometer Conference, Washington, DC, USA, 2–5 April 2006; pp. 154–161. [Google Scholar]
  12. Schnaid, F. In Situ Testing in Geomechanics—The Main Tests; Taylor & Francis Group: London, UK, 2009; p. 327. [Google Scholar]
  13. Lechowicz, Z.; Rabarijoely, S.; Galas, P.; Kiziewicz, D. Settlement evaluation of spread foundations on heavily preconsolidated cohesive soils. Ann. Warsaw Univ. Life Sci. SGGW Land Reclam. 2011, 43, 111–118. [Google Scholar] [CrossRef]
  14. Robertson, P.K. Soil behavior type using the DMT. In Proceedings of the 3rd International Flat Dilatometer Conference, Roma, Italy, 14–16 June 2015; pp. 243–250. [Google Scholar]
  15. Cao, L.; Chang, M.F.; Teh, C.I. Analysis of dilatometer test in clay. In Proceedings of the 3rd International Conference on the Flat Dilatometer (DMT’15), Roma, Italy, 14–16 June 2015; pp. 385–392. [Google Scholar]
  16. Młynarek, Z.; Wierzbicki, J.; Lunne, T. On the influence of overconsolidation effect on the compressibility assessment of subsoil by means of CPTU and DMT. Ann. Warsaw Univ. Life Sci. SGGW Land Reclam. 2016, 48, 189–200. [Google Scholar] [CrossRef] [Green Version]
  17. Schnaid, F.; Odebrecht, E.; Sosnoski, J.; Robertson, P.K. Effects of the procedure on flat dilatometer test (DMT) results in intermediate soils. Can. Geotech. J. 2016, 53, 1270–1280. [Google Scholar] [CrossRef]
  18. Marchetti, S.; Monaco, P.; Totani, G.; Marchetti, D. In situ tests by Seismic Dilatometer (SDMT). In From Research to Practice in Geotechnical Engineering, Proceedings of the GeoCongress 2008, New Orleans, LA, USA, 9–12 March 2008; ASCE Library: Reston, VA, USA, 2008; pp. 292–311. [Google Scholar]
  19. Marchetti, S. The seismic dilatometer for in situ soil investigations. In Proceedings of the Indian Geotechnical Conference IGC-2014, Kakinada, India, 18–20 December 2014; pp. 1–9. [Google Scholar]
  20. Martin, G.K.; Mayne, P.W. Seismic Flat Dilatometer tests in Connecticut Valley varved clay. ASTM Geotech. Testing J. 1997, 20, 357–361. [Google Scholar] [CrossRef]
  21. Martin, G.K.; Mayne, P.W. Seismic Flat Dilatometer in Piedmont residual soils. In Proceedings of the 1st International Conference on Site Characterization, Atlanta, GA, USA, 19–22 April 1998; Robertson, P.K., Mayne, P.W., Eds.; 1998; Volume 2, pp. 837–843. [Google Scholar]
  22. Cavallaro, A.; Grasso, S.; Maugeri, M. Clay soil characterization by the New Seismic Dilatometer Marchetti Test (SDMT). In Proceedings of the Second International Flat Dilatometer Conference, Washington, DC, USA, 2–5 April 2006; pp. 261–268. [Google Scholar]
  23. Cavallaro, A.; Ferraro, A.; Grasso, S.; Maugeri, M. Site Response Analysis of the Monte Po Hill in the City of Catania. In Proceedings of the 2008 Seismic Engineering International Conference Commemorating the 1908 Messina and Reggio Calabria Earthquake MERCEA’08, Reggio Calabria and Messina, Italy, 8–11 July 2008; pp. 240–251. [Google Scholar]
  24. Carroll, R.; Long, M.; Ward, D. Use of CPTU and SDMT to characterise silty soil. In Proceedings of the Fourth International Conference on Geotechnical and Geophysical Site Characterization, Porto de Galinhas, Brazil, 18–21 September 2012; Volume I, pp. 214–249. [Google Scholar]
  25. Rivera-Cruz, I.; Howie, J.; Vargas-Herrera, L.A.; Coto-Loria, M.; Luna-Gonzales, O. A new approach for identification of soil behaviour type from seismic dilatometer (SDMT) data. In Proceedings of the Fourth International Conference on Geotechnical and Geophysical Site Characterization, Porto de Galinhas, Brazil, 18–21 September 2012; Volume II, pp. 947–954. [Google Scholar]
  26. Totani, G.; Monaco, P.; Marchetti, S.; Marchetti, D. Vs measurements by seismic dilatometer (SDMT) in non-penetrable soils. In Proceedings of the 17th International Conference on Soil Mechanics and Geotechnical Engineering, Alexandria, Egypt, 18–21 October 2009; Volume II, pp. 977–980. [Google Scholar]
  27. Monaco, P.; Marchetti, S.; Totani, G.; Marchetti, D. Interrelationship between small strain modulus Go and operative modulus. In Proceedings of the International Conference on Performance-Based Design in Earthquake Geotechnical Engineering (IS-Tokyo 2009), Tsukuba, Japan, 15–17 June 2009; Tsukamoto, K., Yoshimine, Eds.; 2009; pp. 1315–1323. [Google Scholar]
  28. Młynarek, Z.; Wierzbicki, J.; Stefaniak, K. Deformation characteristics of overconsolidated subsoil from CPTU and SDMT tests. In Proceedings of the Fourth International Conference on Geotechnical and Geophysical Site Characterization, Porto de Galinhas, Brazil, 18–21 September 2012; Volume II, pp. 1189–1193. [Google Scholar]
  29. Amoroso, S.; Monaco, P.; Marchetti, D. Use of the Seismic Dilatometer (SDMT) to estimate in situ G-γ decay curves in various soil types. In Proceedings of the Fourth International Conference on Geotechnical and Geophysical Site Characterization, Porto de Galinhas, Brazil, 18–21 September 2012; Volume I, pp. 489–497. [Google Scholar]
  30. Vargas, L.A.; Coto, M. Experiences in the use of DMT-SDMT in Costa Rica, Central America. In Proceedings of the Fourth International Conference on Geotechnical and Geophysical Site Characterization, Porto de Galinhas, Brazil, 18–21 September 2012; Volume I, pp. 375–382. [Google Scholar]
  31. Cavallaro, A.; Capilleri, P.; Grasso, S. Site Characterization by in Situ and Laboratory Tests for Liquefaction Potential Evaluation during Emilia Romagna Earthquake. Geosciences 2018, 8, 242. [Google Scholar] [CrossRef]
  32. Arroyo, M.; Di Mariano, A.; Monaco, P.; Devincenzi, M.; Perez, N. SDMT—based deep excavation design. In Proceedings of the Third International Conference on Geotechnical and Geophysical Site Characterization, Taipei, Taiwan, 1–4 April 2008; pp. 967–973. [Google Scholar]
  33. Młynarek, Z.; Gogolik, S.; Gryczmański, M.; Ulniarz, R. Settlement analysis of a cylindrical tank based on CPTU and SDMT results. In Proceedings of the Fourth International Conference on Geotechnical and Geophysical Site Characterization, Porto de Galinhas, Brazil, 18–21 September 2012; Volume II, pp. 1585–1590. [Google Scholar]
  34. Kulhawy, F.H.; Mayne, P.W. Manual on Estimating Soil Properties for Foundation Design; Report EK-6800; Electric Power Research Institute: Palo Alto, CA, USA, 1990. [Google Scholar]
  35. Burland, J.B. On the compressibility and shear strength of natural soils. Géotechnique 1990, 40, 329–378. [Google Scholar] [CrossRef]
  36. Houlsby, N.M.T.; Houlsby, G.T. Statistical fitting of undrained strength data. Géotechnique 2013, 63, 1253–1263. [Google Scholar] [CrossRef]
  37. Ching, J.; Phoon, K.-K. Multivariate distribution for undrained shear strengths under various test procedures. Can. Geotech. J. 2013, 50, 907–923. [Google Scholar] [CrossRef]
  38. Roque, R.; Janbu, N.; Senneset, K. Basic interpretation procedures of flat dilatometer tests. In Proceedings of the 1st International Symposium on Penetration Testing, Orlando, FL, USA, 20–24 March 1988; Volume 1, pp. 577–587. [Google Scholar]
  39. Smith, M.G.; Houlsby, G.T. Interpretation of the Marchetti Dilatometer in Clay. In Proceedings of the 11th European Conference on Soil Mechanics and Foundation Engineering, Kopenhaga, Denmark, 28 May–1 June 1995; Volume 1, pp. 1.247–1.253. [Google Scholar]
  40. Iwasaki, K.; Kamei, I. Evaluation of in situ strength and deformation characteristics of soils using a Flat Dilatometer. J. Geotech. Eng. 1994, 499, 167–176. [Google Scholar]
  41. Rabarijoely, S. The Use of Dilatometer Test for Evaluation of Organic Soil Parameters. Ph.D. Thesis, Warsaw Agricultural University—SGGW, Land Reclamation, Warszawa, Poland, 2000. (In Polish). [Google Scholar]
  42. Galas, P. Determination of Undrained Shear Strength Based on Seismic Dilatometer Test SDMT. Ph.D. Thesis, Warsaw University of Life Sciences—SGGW, Warsaw, Poland, 2013. (In Polish). [Google Scholar]
  43. Yu, H.S.; Carter, J.P.; Booker, J.R. Analysis of the dilatometer test in undrained clay. In Predictive Soil Mechanics, Proceedings of the Wroth Memorial Symposium, Oxford, UK, 27–29 July 1993; ICE Virtual Library: London, UK, 1993; pp. 783–795. [Google Scholar]
  44. Kamei, I.; Iwasaki, K. Evaluation of undrained shear strength of cohesive soils using a flat dilatometer. Soils Found. 1995, 35, 111–116. [Google Scholar] [CrossRef]
  45. Lutenegger, A.J. Cavity expansion model to estimate undrained shear strength in soft clay from dilatometer. In Proceedings of the Second International Flat Dilatometer Conference, Washington, DC, USA, 2–5 April 2006; pp. 319–326. [Google Scholar]
  46. Hong, S.J.; Shin, D.H.; Yoon, H.K.; Lee, C.; Lee, W.; Kim, Y.U. Strength and modulus of Busan clay by DMT. In Proceedings of the Third International Conference on Geotechnical and Geophysical Site Characterization, Taipei, Taiwan, 1–4 April 2008; pp. 377–382. [Google Scholar]
  47. Silvestri, V.; Tabib, C. Application of the MCC model for the estimation of undrained geotechnical parameters of clays from dilatometer tests. In Proceedings of the 3rd International Conference on the Flat Dilatometer (DMT’15), Roma, Italy, 14–16 June 2015; pp. 431–438. [Google Scholar]
  48. Lechowicz, Z.; Fukue, M.; Rabarijoely, S.; Sulewska, M.J. Evaluation of the undrained shear strength of organic soils from a dilatometer test using artificial neural networks. Appl. Sci. 2018, 8, 1395. [Google Scholar] [CrossRef]
  49. ISO 22476-11:2017 Geotechnical Investigation and Testing—Field Testing—Part 11: Flat Dilatometer Test; International Organization for Standardization: Geneva, Switzerland, 2017.
  50. ASTM D6635—15 Standard Test Method for Performing the Flat Plate Dilatometer; ASTM International: West Conshohocken, PA, USA, 2015.
  51. Lechowicz, Z.; Rabarijoely, S.; Kutia, T. Determination of undrained shear strength and constrained modulus from DMT for stiff overconsolidated clays. Ann. Warsaw Univ. Life Sci. SGGW Land Reclam. 2017, 49, 107–116. [Google Scholar] [CrossRef] [Green Version]
  52. EN ISO 14688-1:2002. Geotechnical Investigation and Testing—Identification and Classification of Soil—Part 1: Identification and Description; International Organization for Standardization: Geneva, Switzerland, 2002. [Google Scholar]
  53. EN ISO 14688-2:2004. Geotechnical Investigation and Testing—Identification and Classification of Soil—Part 2: Principles for a Classification; International Organization for Standardization: Geneva, Switzerland, 2004. [Google Scholar]
  54. STATISTICA—Package Documentation; StatSoft Polska Ltd.: Cracow, Poland, 2002. (In Polish)
  55. Stanisz, A. Accessible Statistics Course Using STATISTICA PL on the Examples of Medicine; StatSoft Polska Ltd.: Cracow, Poland, 2006; Volume 1. (In Polish) [Google Scholar]
  56. Stanisz, A. Accessible Statistics Course Using STATISTICA PL on the Examples of Medicine; StatSoft Polska Ltd.: Cracow, Poland, 2007; Volume 3. (In Polish) [Google Scholar]
  57. Draper, N.R.; Smith, H. Applied Regression Analysis, 3rd ed.; Wiley: New York, NY, USA, 1998. [Google Scholar]
Figure 1. Dilatometer blade, measuring unit and seismic module of the seismic dilatometer test (SDMT).
Applsci 09 01660 g001
Figure 2. Location of test sites in Warsaw, Poland.
Applsci 09 01660 g002
Figure 3. Grain size distribution of the tested cohesive soils.
Applsci 09 01660 g003
Figure 4. Steel beam with a hammer used to generate shear waves in SDMT.
Applsci 09 01660 g004
Figure 5. Profiles of the corrected pressure readings po and p1, and shear wave velocity Vs from seismic dilatometer tests obtained at the Ursynów, Bielany, and Stegny sites.
Applsci 09 01660 g005
Figure 6. Profiles of the index parameters ID, KD, and ED from seismic dilatometer tests obtained at the Ursynów, Bielany, and Stegny sites.
Applsci 09 01660 g006
Figure 7. Characteristics of the deviator stress q depending on the vertical strain ε1 from CIU triaxial tests for sixteen tested cohesive soils.
Applsci 09 01660 g007
Figure 8. Linear simple regression models with 95% confidence intervals: (a) Y = f(X1), (b) Y = f(X2).
Applsci 09 01660 g008
Figure 9. Graphic presentation of the proposed relationship (Equation (22)).
Applsci 09 01660 g009
Figure 10. Comparison between measured values of the normalized undrained shear strength τfu/σ’v and values predicted by the proposed relationship (Equation (22)).
Applsci 09 01660 g010
Table 1. Empirical coefficients in single- and multi-factor relationships to evaluate undrained shear strength τfu from the dilatometer test.
AuthorEquationIndependent VariableEmpirical Coefficients
Single-Factor Empirical Relationships
Marchetti [3](4)KDMarchetti [3]
cohesive soils
for ID < 1.2
S = 0.22, n = 0.5, m = 1.25
Modified Marchetti(5)KDKamei and Iwasaki [44]
marine clays
S = 0.35, n = 0.47, m = 1.14
Roque et al. [38](6)(p1σho)Roque et al. [38]
clays NC = 5−9
Galas [42]
Pleistocene and Pliocene clays
NC = 9.9
Smith and Houlsby [39](7)(poσho)Smith and Houlsby [39]
clays ND = 4−7
Galas [42]
Pleistocene and Pliocene clays
ND = 4.9
Multi-Factor Empirical Relationships
Rabarijoely [41](9)σ’v
(poσho)
(p1σho)
Lechowicz et al. [51]
Pleistocene and Pliocene clays
αo = 0.18, α1 = 0.14, α2 = 0.20, α3 = 0.15
Galas [42](10)(poσho)/σ’v
(p1σho)/σ’v
Galas [42]
Pleistocene and Pliocene clays
ao = 0.164, a1 = 0.345, a2 = 0.544
Table 2. Index properties of the tested cohesive soils.
No.Soil Type
[53]
Depthwn
(%)
wL
(%)
wP
(%)
IP
(%)
IC
(-)
Fraction [52]
(%)
Activity
A (-)
(m) GrSaSiCl
Ursynów site–Auditorium
1clSa/sasiCl5.0–5.310.325.212.812.41.2015927130.95
2clSa5.3–5.78.624.111.912.21.2716325111.11
3clSa7.0–7.410.424.911.913.01.1106128111.18
Ursynów site–Building No. 37
4clSa6.5–6.99.025.111.713.41.2016820111.22
5sasiCl7.0–7.410.424.611.912.71.1215830111.15
6sasiCl8.5–8.99.926.512.414.11.1825829111.28
Ursynów site–Building No. 34
7clSa6.5–6.910.324.912.912.01.2116623101.20
8clSa/sasiCl7.0–7.410.523.112.011.11.1316028111.01
9sasiCl8.0–8.49.426.613.113.51.2715928121.12
Bielany site
10sasiCl15.0–15.410.430.913.117.81.1515231161.11
11siCl7.1–7.619.238.018.819.20.980773200.96
12siCl8.5–8.921.134.617.517.10.790773200.86
13sasiCl12.0–12.511.427.712.315.41.0515729141.10
Stegny site
14Cl6.0–6.426.078.425.952.51.000250481.09
15Cl/siCl9.0–9.428.588.131.256.91.050657371.54
16Cl/siCl12.0–12.419.867.625.542.11.130359381.11
Notes: wn—water content, wL—liquid limit, wP—plastic limit, IP = wLwP—plasticity index, IC = (wLwP)/IP—consistency index, Gr—gravel, Sa—sand, Si—silt, Cl—clay, A = IP/fCl—activity, fCl—percent of clay fraction, 1–16—number of tested cohesive soil.
Table 3. Mean value, standard deviation, and coefficient of variation of: The corrected first pressure reading po or the corrected second pressure reading p1, shear wave velocity Vs, material index ID, horizontal stress index KD, and dilatometer modulus ED.
SiteValuespo
(MPa)
p1
(MPa)
Vs
(m/s)
ID
(-)
KD
(-)
ED
(MPa)
UrsynówMean value1.3632.5693950.9311.142
AuditoriumStandard Deviation0.2630.50947.20.382.6414.0
Coefficient of Variation0.190.200.120.410.240.33
UrsynówMean value1.6173.1603770.9912.954
BuildingStandard Deviation0.4200.92440.50.464.0423.7
No. 37Coefficient of Variation0.260.290.110.460.310.44
UrsynówMean value1.3702.5033970.8411.339
BuildingStandard Deviation0.3970.71641.90.211.4113.2
No. 34Coefficient of Variation0.290.290.100.240.120.33
BielanyMean value0.9721.6103200.786.122
Standard Deviation0.3430.50957.00.621.0412.8
Coefficient of Variation0.350.320.190.780.170.58
StegnyMean value0.8101.3371960.715.918
Standard Deviation0.2860.47323.90.190.967.2
Coefficient of Variation0.360.360.120.280.160.38
Table 4. Input and output values for the statistical analysis.
SiteSoil Typeσ’v
(MPa)
uo
(MPa)
po
(MPa)
(pouo)
(MPa)
(pouo)/σ’v
(-)
X1
p1
(MPa)
(p1uo)
(MPa)
(p1uo)/σ’v
(-)
X2
(p1po)/σ’v
(-)
X3
Vs
(m/s)
Vs/100
(-)
X4
τfu*
(MPa)
τfu/σ’v *
(-)
Y
UrsynówclSa/sasiCl0.0940.01.2861.28613.7392.5442.54427.17913.4403883.8800.2232.382
AuditoriumclSa0.1020.01.3991.39913.7432.8022.80227.52513.7824074.0700.2372.323
clSa0.1350.01.5451.54511.4612.9992.99922.24810.7864244.2400.2401.780
UrsynówclSa0.1240.01.6621.66213.3613.0743.07424.70711.3463843.8400.2542.038
Building sasiCl0.1370.01.5831.58311.5802.8292.82920.6959.1153903.9000.2982.176
No. 37sasiCl0.1700.01.6311.6319.5942.6042.60415.3185.7243983.9800.3401.997
UrsynówclSa0.1200.01.3221.32211.0172.5012.50120.8429.8254214.2100.2161.800
BuildingclSa/sasiCl0.1340.01.4091.40910.5462.6862.68620.1059.5584204.2000.2391.789
No. 34sasiCl0.1550.01.9451.94512.5483.5923.59223.17410.6263953.9500.3352.158
BielanysasiCl0.1850.0971.6101.5138.19602.2672.17011.7553.5593983.9800.2701.463
siCl0.1220.0200.5460.5264.3011.1661.1469.3705.0702472.4700.1481.209
siCl0.1430.0340.7460.7124.9891.3501.3169.2224.2332832.8300.1921.342
sasiCl0.1890.0681.2671.1996.3412.0752.00710.6134.2732772.7730.2091.103
StegnyCl0.0920.0200.5360.5165.6090.9300.9109.8914.2831751.7500.0790.853
Cl/siCl0.1170.0500.7240.6745.7611.1471.0979.3813.6151881.8800.0940.803
Cl/siCl0.1420.0800.8730.7935.5851.5281.44810.1974.6132292.2900.1441.011
Notes: * CIU TT—Triaxial Test on sample consolidated isotropically with shearing in undrained conditions.
Table 5. The calculated maximum relative error max RE of the evaluated undrained shear strength τfu in cohesive soils from the Ursynów, Bielany, and Stegny sites.
Single-Factor Relationships by:Multi-Factor Relationship by:
Marchetti [3]
Equation (4)
Roque et al.
[38]
Equation (6)
Smith and Houlsby [39]
Equation (7)
Rabarijoely [41,51]
Equation (9)
Galas [42]
Equation (10)
max RE
(%)
max RE
(%)
max RE
(%)
max RE
(%)
max RE
(%)
UrsynówA34.314.711.730.916.4
3736.730.321.047.721.1
3422.86.02.842.58.6
Bielany 43.947.643.235.933.9
Stegny 21.37.424.540.528.7
Mean
max RE
31.821.220.639.521.7
Mean RE (from 16 tests)
20.414.112.030.612.9
Table 6. Comparison of the analyzed simple linear regression models.
ModelEquation Formula/No.Determination Coefficient
R2 (-)
SEE (MPa)Max RE (%)Mean RE (%)
Simple linear
regressions
τfu/σ’v = 0.3023 + 0.1442((pouo)/σ’v) (13)*0.855±0.208941.012.4
τfu/σ’v = 0.4513 + 0.0698((p1uo)/σ’v) (14)**0.831±0.226237.713.0
τfu/σ’v = 0.6652 + 0.1258((p1po)/σ’v) (15)**0.751±0.274739.415.0
τfu/σ’v = −0.1159 + 0.5178(Vs/100) (16)*0.757±0.271433.012.0
Notes: *—coefficient a is statistically non-significant, **—all coefficients are statistically significant.
Table 7. Comparison of the analyzed two-factor regression models.
ModelEquation Formula/No.Determination Coefficient
R2 (-)
SEE (MPa)Max RE (%)Mean RE (%)
Linear multiple two-factor regressionτfu/σ’v = 0.0403 + 0.0728((p1po)/σ’v) + + 0.3055(Vs/100) (21)*0.881±0.197219.18.5
Non-linear multiple two-factor regressionτfu/σ’v = 0.3676 · ((p1po)/σ’v)0.2846 · · (Vs/100)0.7525 (22)**0.919±0.048020.48.5
Notes: *—coefficient a is statistically non-significant, **—all coefficients are statistically significant.
Table 8. Comparison between measured values of τfu/σ’v obtained from the CIU triaxial tests and values of τfu/σ’v predicted using the proposed relationship (Equation (22)). Bold number shows the maximum value of RE for given site
SitesMeasured Values τfu/σ’v from CIU TT (-)Predicted Values τfu/σ’v Using Equation (22) (-)Relative Errors of Individual Case REp (%)
UrsynówA2.3822.13410.4
2.3232.2284.1
1.7802.14320.4
372.0382.0181.0
2.1761.91811.9
1.9971.70614.6
341.8002.07615.3
1.7892.05614.9
2.1582.0236.2
Bielany 1.4631.4901.9
1.2091.1494.9
1.3421.2109.8
1.1031.1968.5
Stegny 0.8530.8470.8
0.8030.8516.0
1.0111.0594.7
Max REp = 20.4%
The mean of the marked valuesMean Value of Max RE = 13.2%
Mean Value of RE = 8.5%

