Abstract
Walking is classified as the oldest transport mode with the least impact on the environment. It is frequently one of the intermediate transport modes. Generally, while designing exclusive walking transit areas or structures with high human traffic volumes and considering different scenarios, it is advantageous to be able to foresee the congestion conditions and the relative problems. The study of pedestrian trajectories, which are strictly related to the characteristics of the walkers, is necessary and preliminary for the purposes of an in-depth analysis linked to the habits of populations and cultures. Often areas crowded by tourists run, of limited size such as bridges, must be considered in advance for emergencies. This article focuses on an old footbridge of Mostar located in a confined area with an increasing tourist flow. The peculiarity of the bridge lies in the double-flight geometry with elements that generate discontinuity in the trajectory as well as the steps. This analysis was carried out obtaining the traffic data from video cameras and analyzing different scenarios on holidays and weekdays. Also, the possible presence of obstacles on the bridge was taken into account, such as some areas not walkable for temporary work or the presence of obstacles. These scenarios have been calibrated and simulated through the definition of O/D matrices, arcs and nodes (or areas) through the pedestrian simulation tool Viswalk. This comparison is useful for understanding the variation of LOS (Level of Service) during the daily or emergency situations and the results can provide help to local authorities to plan and design an appropriate action plan. Therefore, this research work aims to compare scenarios under critical flow conditions in the order to define preventively possible actions that can guarantee an optimal LOS value during the bridge crossing and the surrounding areas.
1. Introduction
Quantitative models of vehicular traffic have been part of the process of planning traffic systems, from the international and national level network down to individual intersections, for a long time. For road traffic, the need to have a system as efficient as possible is obvious, since each wasted second does not only waste a second for the driver, but also contributes to our destruction of the environment through the emissions of the vehicles, and the massive amount of infrastructure needed.
The need to plan a globally efficient traffic scenario often does not correlate with pedestrian traffic, as it is not classified as a threat to the infrastructure and the surrounding environment. The existing literature does not present many studies on the models and the observations of non-motorized traffic as it happens with vehicular traffic. Only in the last decade does research in the literature address the issues of pedestrian delay and congestion of non-motorized traffic, studying the pedestrian not as an isolated entity but as a group of entities attracted to each other through social forces.
The social force model, inspired by the Newtonian model, allows pedestrians to be studied in an environmental context, such as a closed or open space [1].
The physical result obtained from the application of the theory of social forces is described through vector mathematics, therefore the pedestrian and its movement are characterized by intensity, a direction and a verse subject to the force of attraction or repulsion due to the presence in the same environment of other pedestrians.
The social force model has been extensively studied and demonstrated to reproduce several well-known traits of traffic, such as the dynamic form lanes in opposing streams and the oscillations at bottlenecks and the formation of dynamic stripes in the presence of crossing sections [2]. It has also been successfully calibrated for different scenarios and application [3], and adopted for simulation of evacuation phenomenon, where the effects of panic are incorporated into the model [4,5,6].
The micro-simulation is suitable for several reasons, but mainly because each walker is different from the other: generally they have different cultural features and a different approach to traffic scenarios. The variability of human behavior linked to traffic conditions is due to motorized and non-motorized components. The study of the human reactions provides useful information about the violations committed by both the foot traveler and the driver and caused by the stress due to the long waiting time.
Refs. [7,8] argue that a force-based approach to microscopic simulation is convenient since people are used to walk in crowded environments and have developed good subconscious, or automatic, strategies for avoiding collisions and keeping comfortable distances from surrounding pedestrians [9].
These automatic strategies should be possible to encode as simple behavioral rules based on the objectives of the pedestrians and the surrounding conditions.
Understanding the effects caused by the passage of flows generally aims to identify congestion points and to predict the likely effects of the growth in demand. The study can also understand the effects of congestion on the phases of construction or maintenance and allows in advance to establish possible scenarios of fire evacuation/attacks. The following paragraphs provide more details on the choice of the case study and evaluate different scenarios applicable in it taking into account the above-mentioned theory and considering the use of the micro-simulation tools of the pedestrian flow.
2. State of the Art
The analysis through the pedestrian models has developed considerably in recent years. In general, the microscopic approach offers a more detailed manners evaluation and can be classified into two categories: discrete and continuous models.
The first type includes the discrete selection model, the reticular gas model, the cellular automaton model in which space is discretized to approximate the real people movement. Different models are described in literature, considering discrete selection model [10], reticular gas model [11] and cellular automaton model [12].
Instead, continuous models are based on differential equations that describe dynamic movement in space. In the initial phase, a magnetic force model describes the pedestrian modes in an area and it was developed by borrowing an equation of motion used for magnetic fields [13]. In this way, the social force model applied to the evacuation analysis has been developed [14]. The force-based model makes it possible not only to accurately describe the dynamic movement in space but also to reproduce the phenomenon relate to the global results such as lane formations [15]. Although many studies focus on the general mechanism of human actions, few studies are focused on the application of the social force model to the pedestrian action in restricted spaces.
The characteristics of the human operation must be evaluated considering the small size of the bridge on which each person must move and in cases of evacuation or in cases of maintenance must also consider the variability of operations and therefore the speed and precedence assumed compared to nearby people during the phases of movement. The main contribution of this study is the development of a microscopic model based on the theory of social force, which allows considering the characteristics of pedestrian ways of motion on an ancient footbridge. Moreover, an estimation approach is proposed to calibrate the model of social force based on real trajectory data. Model validation is conducted to confirm pedestrian performance.
The model of social strength, like all models, is only a simplified representation of reality. In accordance with the calibration step, the parameters are tuned in such a way that the intended pedestrian manners match the actual action as close as possible to the scenario of interest. The first studies considered only the properties of the infrastructure (such as the width of the sidewalk) to characterize the level of service in the structures for walking. More recently, not only did the research consider the infrastructure characteristics, but they also took into account the properties of the vulnerable users movement (such as pedestrian density, travel time, queue length, etc.) to get a better idea of the quality of the offered service. Therefore pedestrian Level of Service LOS is defined as a general measure of the operating conditions on a given itinerary.
2.1. Level of Service LOS Definition
Numerous studies are found in the literature that highlight the importance of the evaluation of LOS both for infrastructures crossed by only vehicles and/or vehicles and pedestrians. In accordance with [16], LOS values are very important especially on unprotected areas such as pedestrian crossings or footbridges. In addition, the need to consider people with disabilities has been identified for the evaluation of the specific LOS on the sidewalk and the crosswalk in mixed traffic conditions.
The research highlights the importance of correlating the geometric conditions of the infrastructure with the type of users and their behavior in presence of other individuals. Many studies have been addressed on this topic and the increasingly comprehensive definition of the LOS parameters, as described in Table 1 below.

Table 1.
Evaluation of LOS during the period 1971–2018.
The value of the pedestrian LOS changes in accordance with the infrastructural details or spatial geometry. In fact, its value depends on the number of lanes or possible intersections that allow in both cases different trajectories [33] and presence of pedestrians on more rows or opposite directions [34].
Considering a network connection, the worst value predominates and the score is strongly influenced by the width of the walking area and its separation from the vehicles.
Traffic volumes can also play an important role.
On the other hand, if an intersection is considered, it is necessary to evaluate the level of service as a polynomial combination of the LOS due to the functionality and a LOS due to the connection.
The final result also incorporates a delay factor of the road intersection.
Finally, considering a pedestrian infrastructure, it is necessary to evaluate the correlation between vehicular and pedestrian space. Generally, the worst value predominates.
The definition of the quality of an area for walking may depend on several different parameters such as the level of accessibility to the destination, the connectivity and the quality of the pedestrian network paths, safety etc. Various definitions of service level have been developed by different researchers as far as possible to find LOS A defined as “best”, “safer”, “very satisfied” or “excellent” in several studies.
According to [35,36] six levels of services were considered for pedestrian structures (walkways, stairwells and tails) based on the occupation of the middle area (density) and flow.
The Fruin standard was determined on the basis of walking speed, pedestrian spacing and the likelihood of conflict at various traffic concentrations. It was corrected by the National Cooperative Highway Research Program in 2008 and was reported on the [37]. In this standard, the breakpoints between the levels are set to lower values than the Fruin standard such as that described in Table 2.

Table 2.
Level of Service value comparison.
Pedestrians travel time after time in the spaces, not only is linked to a single way condition, but also to the over cross action in different space type. The platooning configuration often occurs when people move in a group forming a queue. This scenario is also analyzed by the HCM manual classifying it as an event in general of a lower level than that determined by the average pedestrian flow.
The pedestrian unit flow rate (ped/min/m) is obtained by taking the pedestrian 15-min flow rate (ped/15-min) and dividing by the effective walkway width.
The HCM suggests collecting pedestrian opposing flow volumes at 15-min intervals.
The sum of the two directional flows is used as the 15-min flow rate. The obstacle widths can be measured from the field. The additional buffer width is based on an estimation provided by the HCM. A speed reduction of 0.1 m/s is used on grades greater than 10 per cent (1:10 slopes) and on stairs. In the accumulation areas (defined in the present study, simply Wed E areas), especially in the historical center, it often appears that people and visitors are intolerant to LOS E and F because of the queuing areas. The queuing areas should be designed with a value of LOS D as the minimum area per pedestrian. These levels should be confirmed through on-site perception studies according to [38]. Unfortunately, in the literature there are no indications on the number of pedestrians that should be accommodated.
These numbers can be determined through on-site observations during peak traffic periods or through simulation using specific simulation software. In the case of the ramps, where the stairs have access to the views, as in the ramps of the Stari Most bridge, the LOS range must be set to allow space pedestrians stop to look at the view while allowing others to pass. The FHWA with the “Pedestrian Facilities Users Guide” in accordance with [39] recommends a walkway width of 1.5 m will comfortably allow two people to walk side by side. If space is provided for two walkers using the LOS D that means each person will have a walking buffer of 1.8 m by 0.75 m (1.4 m2) up to 2.93 m by 0.75 m (2.2 m2) for LOS D.
This allows adequate room for stopping along the side of pedestrians pass single, the path to take pictures or enjoy the view action. Viswalk [40] was chosen as the most suitable tool for this comparison because well-developed specific algorithms derived from Social Force Model, Fruin Level of Service reporting based on density and analyzed data as described in Table 3 below.

Table 3.
Fruin Walkaway LOS.
In accordance with [41] a pedestrian crosswalk walking speed was recommended considering a value of 1.2 m/s but a lower value is better if it is necessary to considering elderly pedestrians with a walking speed of 1.0 m/s [42]. Queuing areas are designed to allow walkers to comfortably wait for access to the use of a structure. Table 4 below shows the LOS FHWA criteria for queuing areas and stairs.

Table 4.
LOS values considering stairs and waiting area.
From a geometrical point of view, the criticalities linked to the evaluation of the LOS of Mostar bridge, derive from the difficulties measuring the widths of the two waiting areas and of the two ramps.
The major geometric criticality is related to the usable width of the bridge. In general, the minimum width of 1.5 m allows two people to walk comfortably side by side. The sizing of the decks must also take into account the traveling speed. Moreover, for the design of ramps or stairs, more attention should be paid to the role of human characteristics due to the greater risks to safety and energy expenditure required by crossing them.
The graph below linked to Figure 1, in accordance with [17] defines the value of LOS in ramps and stairs by comparing volume (P) defined as the volume in pedestrians per minute per foot of the stairway, with the module (M) in square feet area for pedestrian.
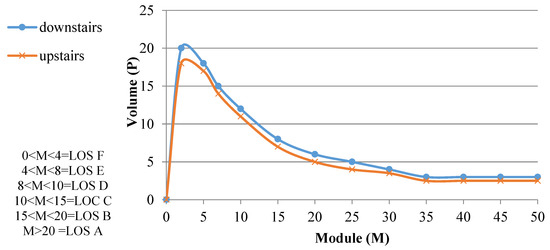
Figure 1.
LOS for stairways (volume versus module) in accordance with Fruin theory.
2.2. Case Study Details
Stari Most (literally “Old Bridge”) is a reconstructed Ottoman bridge from the 16th century located in Mostar (Bosnia and Herzegovina). It crosses the Neretva River and connects the two parts of the city. It is defined as an international symbol of reconciliation in Mostar, Bosnia-Herzegovina: in fact this bridge were destroyed in 1993 during the Bosnian war; the rebuilding activities began five years later, and the bridge alongside Stari Grad (Old Town) was re-opened as a United Nations Educational, Scientific and Cultural Organization (UNESCO) heritage site in 2004 [43].
The Stari Most are 4 m wide and 30 m long and it dominates the river from a height of 24 m. At the end of the bridge, there is two fortified tower titled Halebija to the northeast and the Tara tower to the southwest. They are called “the guardians of the bridge”. The investigated geometry has been defined following the characteristic features and assuming a flow distribution along the two east and west directions.
The bridge is illustrated in Figure 2 below.

Figure 2.
Images of Stari Most-Mostar in Bosnia-E. (Source: Google Earth).
The functional geometrical evaluation of the bridge was based on the definition of areas and ramps and on the comparison of different scenarios, some of which are characterized by the prohibition of transit in some parts or the presence of a single mono-directional way.
The investigated bridge has two ramps with an opposite slope. There are similar steps characterized by a slippery coating due to the type of materials and wear of the surface on which you walk. Although small pieces of raised concrete have been added to help reduce the risk, there is always some danger of moving around the bridge at a fast pace, especially when the ramp is coming down.
These concrete elements form steps that create a break in gait. At the edges, the paving of the bridge is in pebbles and allows tourists to stop in order to admire the landscape (about 0.50 m for both sides). The central part is paved in stone different from that of the side areas to the ramps and is characterized by a kind of steps.
Monitored geometry is particularly difficult to travel for people with reduced mobility or with motor problems like the elderly. The monitored area is configured as adjacent to the road called Kujundžiluk, characterized by restaurants and shops, which connects to the urban road called Marsala Tita on East direction while in the West direction to the road called Onescukova characterized also by the small shops up to the double-lane extra-urban road called Bulevar.
The analyzed flow was assessed considering the conditions of greater tourist transit during the summer period (seven days were monitored).
The evaluated flow is linked to the daily peak hour and all activities located to the bridge are linked to touristic aspects. Different scenarios were implemented not only along the 30 m of bridge length, but considering also an area of about 30 m was evaluated before and after it corresponding to the area characterized by a further reduction of the width of the lane towards both west and east characterized by the continuation of the pedestrian area surrounded by tourist markets and restaurants. Table 5 shows details about the investigated scenarios: in fact, it is, therefore, possible to focus on the simulated areas by considering the different scenarios in order to maintain and evacuate as the flows change. They have been chosen considering possible maintenance activities without the closure to the transit of the bridge and also of possible evacuation in the terrorism event. Each scenario analyzed involved the simulation of the ramps that make up the bridge named W and E corresponding to East and West part. In the case of the maintenance scenario, a third interdicted area has been inserted; a representation of the monitored ramps is shown in Table 5:

Table 5.
Scenarios related to Stari Most bridge simulation.
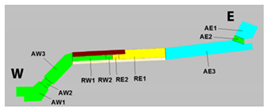
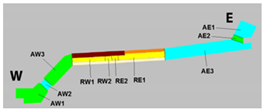
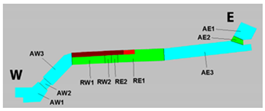
To exemplify the evaluation of the level of service, the total investigated area was divided into four main ramps (titled respectively RE1, RE2, RW1 and RW2), one initial and one final for each slope of the opposite slope of the bridge and into six areas (titled AE1, AE2 and AE3 and in the opposite side AW1, AW2 and AW3) corresponding to all that precedes and follows the bridge itself.
Each scenario is characterized by a specific flow and by a partial or total use of the ramps and areas. In particular, the first scenario is characterized by the presence of 1500 ped/h randomly arranged but ordered along the two directions considering the whole width of the infrastructure free from obstacles.
The second scenario is based on the same geometrical hypotheses of the infrastructure with respect to the first scenario but with a doubling of the pedestrian flow that leads to saturation and therefore to an inefficient service level of the infrastructure.
The third scenario, on the other hand, provides for an increase in the speed of travel of the bridge by imagining a possible phenomenon of evacuation uniformly distributed along the two directions. This scenario was assessed in critical flow conditions of 3000 ped/h.
Finally, the fourth scenario foresees, in critical flow conditions, the partial practicability of the infrastructure and therefore a reduced width of the pedestrian lane for maintenance purposes. According to [44], the walking speed of a people without disabilities follows a normal distribution with an estimated mean of 1.34 m/s and a standard deviation of 0.37.
This value was used to investigate the calibration process and therefore, to change manually the pedestrian speed parameters related to Viswalk tool [40] and Vissim software [45].
Any automatic calibration routine was not implemented, so that the speed results can be adapted as closely as possible to the aforementioned normal distribution.
In literature several studies are based on Vissim micro-simulation in order to evaluate LOS values and also the impacts related to safety [46,47] and or environmental aspect [48,49].
The micro simulation of vehicular traffic follows the theory of car following through which it is possible to determine, for example, the travel time or the length of the queues in accordance with [50] instead the pedestrians follow the social force model that allows to obtain similar parameters. analyze vehicular and pedestrian mixed traffic and obtain the global service levels of the analyzed infrastructure.
Other studies focus on indoor evacuation phenomena [51] or analyze pedestrian behavior related to the traffic mix [52].
This study, on the other hand, wants to evaluate the LOS in a limited area (but not closed spaces like the terminals or the civil buildings) where the flow component is exclusively pedestrian.
3. Methodology
The chosen area was examined starting from the survey of the pedestrian flows and the geometrical—constructive characteristics of the bridge, considering the social force model approach and processing by micro–simulation. Comparison of different scenarios was possible through micro-simulation tools that allow comparing different variables such as speed or pedestrian density or level of service LOS again. In the following paragraphs we describe how the calibration of the model, the scenarios choices, the data processing and results have been achieved.
3.1. Social Force Model Development
The social force model related of pedestrian dynamics describes the movement of each walker and is the basis of different software related to the evaluation of pedestrian flows. The model presents psychological forces that push pedestrians to move and maintain adequate distance to others. In this model the movement of an individual is motivated by a self-guided force while the resistances come from the environment surrounding individuals and structures such as a wall. Above all, the model describes the socio-psychological tendency of two individuals to maintain the right interpersonal distance (called social force) in the collective movement and if people have physical contact with each other, even physical forces are taken into consideration. Instantaneous speed vi (t) of the individual i is given by Newton’s second law. The general equation is:
where the mass of the individual i is, respectively, and ξi is a small fluctuation force.
Instead the fself force is equal to:
This force describes an individual trying to move with a desired speed vi0 (t) and expects to adapt the actual speed vi (t) to the desired speed vi0 (t) within a certain time interval τi.
The social force model was introduced for the first time in 1995 [1] with an elliptical view of the pedestrian’s area of action while a second variant with a circular area was proposed in 2000 [4] and finally a third variant with different elliptical area in 2007 [53]. The difference between the three variants is mainly in the way in which the speeds of two interacting pedestrians are considered in the calculation of the force between them. The 1995 variant considers only the speed of the pedestrian who exercises strength.
The 2000 variant does not consider speed at all (only the distance between pedestrians) and the 2007 variant considers the relative speed between both pedestrians (the pedestrian who exerts force and the pawn on which the force acts).
In agreement with [54], it is shown that the oscillations relative to the different geometry of the pedestrian movement area can be excluded if the model parameters satisfy certain relationships. The 2000 variant considers the repulsive interaction force.
The model can also include a force of attraction in its original version [1,51,55].
The interaction of a pedestrian with obstacles such as walls is denoted by fiw and is treated in a similar way, ie F= fisoc + fiphy where the value of “fisoc” characterizes the socio-psychological tendency of two pedestrians to stay away from each other, instead the physical interaction “fiphy” describes the physical interaction when pedestrians have physical contact and is composed of an elastic force that counteracts the compression of the body and a sliding friction force that prevents the relative tangential movement of two pedestrians.
3.2. Microsimulation Approach
This area has been chosen as the object of analysis as it presents some very important critical issues when examining a possible evacuation and emergency plan in pedestrian areas with a tourist vocation and limited geometrical details.
In fact, the shrinkage present on both sides of the areas before and after the bridge means that congestion phenomena can occur, especially in the most critical cases that we will discuss later. The present work starts from an inspection of the preselected area in order to investigate the areas of narrowing and the possible obstacles present along the trajectory of crossing by pedestrians and subsequently with the aid of micro-simulation tools of the traffic they are implemented of possible critical scenarios that compromise and/or could change the pedestrian density and the relative LOS.
The scenarios implemented have taken into account the walking variability that can transit along the route, emphasizing the fact that children and the elderly both standard and emergency incidents need help to move away from the area and with their reduced mobility speed can become an obstacle for pedestrians moving around them.
The area examined for the presence of irregular pavement and for the steps along the bridge does not allow people to be transported with mobility difficulties or with a wheelchair.
Therefore the walkers consist of people of different ages and sex without serious problems walking or use of motor-driven devices being an area of the city with a strong tourist vocation. The presence of a good number of restaurants and shops means that this area is used both during the day and at night with particular crowding during the holidays.
Often the flow on the bridge is divided along the two extreme parts of the right and left for viewing the landscapes and the river below. Due to problems of safety and security, in recent years a high-grade fence has been placed to prevent pedestrians from falling down, leaning over it.
3.3. Calibration Procedures
The micro-simulation has allowed the evaluation and comparison of some parameters such as pedestrian density, speed and travel time. These values are conditioned by the characteristics of the infrastructure in terms of each scenario and are conditioned by the behavior of the user related to gender, age, etc.
Furthermore, the delay was assessed as the difference between the travel time of the walker “expert” and the travel time of the same walker that would have experienced if he travelled the shortest route to his preferred speed.
In fact, in order to calibrate Viswalk tool, different parameters are considered such us the anisotropy forces or the desired speed, considering the Helbing model.
These parameters allow setting the specific ways in not isolated flow condition. In particular, the parameter tau (τ) in Viswalk associated with the Social Force model defines the relaxation time in seconds. It can be interpreted as the reaction time of the pedestrians. By decreasing tau, the acceleration and driving force increases.
In general, a low tau value implies a high acceleration [40].
Generally the pedestrians are more influenced by events and objects in their fields of view facing them than by events and objects behind them.
The lambda (λ) parameter is used to adjust how the strength of other people and objects would affect the pawn. A greater value implies that the forces of other people behind the pedestrian have less influence on the pedestrian than the strength of other people in front of the pedestrian.
The A_soc_isotropic and B_soc_isotropic parameters are related to the repulsive force between two pedestrians and govern the direction-dependent force between pedestrians. Asoc Mean and Bsoc Mean represent the strength and are linked to the interval speed with regard to the social force between two pedestrians.
These parameters in terms of mean value together with the parameter VD influence the other of the two forces that form the repulsive force.
When VD is greater than zero, it depends on the relative speed between walkers. By increasing VD, opposing pedestrians will evade earlier when passing or meeting the parameter “noise” is used to model randomness in Viswalk, which refers to the random force that is added to the calculated social force if the actual walking speed of pedestrians for a certain time is still lower than the desired speed.
The random force term is added to the force after all other forces have been calculated only if a pedestrian is slower than his or her desired speed for a certain time).
The “react_to_n parameter” is used to adjust the number of other people (n) in the nearest surrounding environment that affect a particular pawn, e.g., how many people should be included in the calculations of the total social force.
In this case, the values between 0.0–0.1 and higher values can be used to provide more organized queues. Another parameter that influences the actions is titled PrefLato. It defines if the pedestrian prefers to pass the other people on the right side or on the left side. If the pedestrian prefers the right or left side, the parameter will be set to −1 or 1 instead it will have a value of 0 for uncontrolled response. Table 6 shows the Viswalk behavior parameters linked to the Helbing model considering the following settings:

Table 6.
Specific pedestrian parameters of Viswalk tool.
- “default” setting used in the 2nd scenario;
- “normal” setting, assigned to the 1st-3rd-5th-6th scenarios respectively;
- “evacuation” setting applied in the 4th scenario.
A sensitivity analysis was performed in order to investigate the simulated walking speed and also to set some parameters of the social force model.
The sensitivity analysis primarily aims to improve the decision-making process, especially through an evaluation of the robustness of the decision taken. It also highlights the factors whose value is worthwhile better to estimate, and those that are appropriate to keep under strict control in the study phase.
In particular, the values of the table above were reached by varying the parameters one by one and trying to obtain reliable results comparable with the real ones. Therefore, the parameters studied can influence the simulated walking speeds of pedestrians in the model and have therefore been chosen.
For each parameter, various adjustments have been made. The parameter values were analyzed around the chosen values used for the speed calibration and the pedestrian type survey.
The comparison between the real value and the simulated one was carried out considering microscopically data and validated using Root Mean Square Error (RMSE) procedure to calibrate the model parameters and optimize the model like described in Equation (3).
with variables observed over T times. Simulated data were obtained from the optimized model and compared with the real field data. In accordance with [56] a difference in observed and simulated data is less than 10%. Observing variation between two sets of data it can be concluded that Viswalk simulated data is applicable to the real field data in the evaluated context.
It was found that higher values of tau reduce pedestrian acceleration towards the desired speed. However, this is not desirable in cases of maintenance or evacuation as it is necessary to quickly clear the area for which smaller tau values have been entered for these scenarios. It is also estimated that for small values of tau, the average simulated walking speed is a little more sensitive for parameter settings. The sensitivity analysis shows that the adjustments of the parameters investigated differently affected the average simulated walking speed.
The parameters titled tau, B_soc_isotropic and A_soc_mean have a greater influence on average walking speed.
Parameters that do not affect the the simulated average walking speed was A_soc_isotropic and VD. The investigation of the parameter value for B_soc_mean does not show significant static differences in the average simulated walking speed.
The human mix investigated is heterogeneous where, however, disabled people with wheelchairs were not taken into account because the geometry of the bridge does not allow them to be crossed due to repeated steps in both directions. The people considered globally on each scenario is characterized by 50% man, 40%female and 10% female with children in accordance with real-time monitoring results; 20% of mentioned adults (10% man and 10% female) were evaluated as elderly people because in this infrastructure, many under 65 s were observed.
The study of density allows establishing the level of congestion that can be created in certain areas inside the terminal. People are used to move individually, but if they move with the same characteristics due to external factors, such as congestion or regulation and flow control factors, groups, called platoons, are formed involuntarily out-flow variables.
The main outflow variables implemented in the micro-simulation model derive from previous real studies through cameras in the investigated area. In particular, a cross-over study on the collection of video data and micro-simulation techniques to estimate the level of pedestrian safety in a confined space was carried out by placing two Gopro—type video cameras close to the monitored area for the selected period, thus obtaining the registration of video of the flows to be analyzed and the subsequent automatic counting through a dedicated software based on automatic pedestrian counting systems based on video recognition technology of moving objects.
The obtained parameters allow the fundamental equation of the outflow to be calculated as a function of speed and as a function of the area module as shown below by Equations (4) and (5) described below:
Vped = Sped × Dped
Vped = Sped/M
The main outflow variables implemented in the micro-simulation model derive from previous real studies through cameras in the investigated area. In particular, a cross-over study on the collection of video data and micro-simulation techniques to estimate the level of pedestrian service in a confined space was carried out by placing two Gopro—type video cameras close to the monitored area for the selected period, thus obtaining the registration of video of the pedestrian flows. The analysis of the videos allowed understanding in the first place which was the main direction of the pedestrians and in which part of the bridge the points of meeting of the trajectories took place. Through the targets it was possible to define in an exemplified way the initial, final and middle part of the bridge and to view with more videos in different directions and to study through a video analysis system based on the tracing of a rectangular shape on each pedestrian. In agreement with [34] the discretization of the area within the bridge was considered with cells of a square mesh of 0.50 × 0.50 m, considering the grid on the video images. In particular, the grid was designed using Adobe Photoshop CS5. Data analysis was performed manually using VLC support, thanks to the possibility of reproducing the images frame by frame.
The video images made it possible to understand that the central part of the bridge and the steps before the “bridge peak” are those most characterized by the presence of intersecting trajectories coming from opposite directions.
Several studies in the literature show that from the video acquisition through algorithms or tools it is possible to derive the pedestrian trajectories. The trajectories are in fact useful for considering the areas of greatest conflict and therefore those potentially most harmful.
Hoogendoorn et al. [57] conducted an experimental research in Delft University of Technology using video to extrapolate pedestrian trajectories and considering uni-directional, bidirectional flows, crossing and bottleneck flows. Considering this approach the algorithm implemented focuses on the conversion of digital video into image sequences and distortion correction and image normalization.
In accordance with [58] a study was conducted considering the collection of pedestrian traffic area automatically with a cluster technique using histograms in an environment of a traffic-controlled signal crossing. Boltes et al. [59] have analyzed scenarios of corridors and bottlenecks. In the study, the software PeTrack was used to extract individual trajectories [60]. Through video recordings from one or more cameras located around the traffic area, digital videos were received. Thus, digital videos have been processed in order to detect road users and extract trajectories and other parameters. In accordance with [61] the system based on the T-analyst includes the following steps, namely the detection of pedestrians considering a certain direction and area and then the automatic detection and tracking of road users to provide trajectories.
The approach pursued in the following research work made it possible to analyze the trajectories of pedestrians through a first analysis of the videos recorded by Gopro and subsequently through the output files generated by the Viswalk tool.
In fact, the Viswalk tool used (starting from version 9) allows to generate not only trj files between the output files for the potential assessment of vehicle conflicts but also other useful extensions for the evaluation of exclusively pedestrian trajectories. The Figure 3 below, by way of example, allows us to understand how the coordinates in X along the entire bridge extend as the seconds change and how there are possible intersections of trajectories among pedestrians that come from opposite directions as in the figure with pedestrians called ped 1, ped 2 (from West to East) and ped 3 (opposite directions).
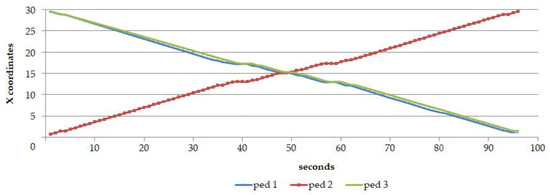
Figure 3.
Trajectories of pedestrians considering Viswalk trajectories output.
The zero of the X coordinate axis corresponds to the centerline of the bridge. In particular, the letter A is the initial part (0 m) and B (30 m) is the final part of the valuated infrastructure from West to East direction.
It is possible to observe that ped 1 and ped 3 pedestrians meet at different points in the first moments of the simulation and then in the two points at about 40 and 60 s of simulation instead ped 2 meets ped 1 and ped 3 at 50 s.
The evaluation of the trajectories has allowed us to understand the most critical points in the bridge and therefore hypothesize the points with greater congestion. For the evaluation of the Service Level we have resorted to simulation.
The most widespread study to date in the pedestrian area is the evaluation of the LOS Service Level focused on concepts such as pedestrian speed or density but some studies are in place by several researchers to evaluate also surrogate safety.
LOS value in accordance with HCMare already loaded into the Viswalk software therefore the analyzed and graphed Service Levels are corresponding to the simulated speed and density variations, just as described in the next paragraph.
4. Results and Discussion
To compare the values of LOS related to the scenarios of the examined bridge, the evaluation is focused on the estimation of the travel time which can be a good measure of estimation to compare the scenarios. In fact, the travel times are extracted for the destination of origin that has the highest number of requests in each scenario.
The evaluation of the density and relative average speed is strictly connected to the service level of the bridge and its various parts (ramps and areas).
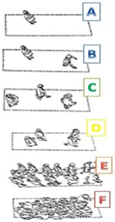
The flow and capacity are highlighted by the LOS value from A to F values in accordance with the Fruin model as described in Table 7 below.

Table 7.
LOS values in accordance with Fruin model.
In accordance with the LOS definition of Table 7, the pedestrian speed in the different scenarios can be inserted within the range 0.15–1.1 m/s as defined by the graph in Figure 4.

Figure 4.
Speed results in accordance with different monitored scenarios.
In particular there is a reduced speed variation in normal scenario conditions with 1.500 ped/h all areas and ramps instead an incisive difference denotes maintenance and maintenance with evacuation as the areas of possible transit are covered.
The density value according to the HCM standard, as shown in Table 5, is also estimated. Once the model has been calibrated it has been shown that the results obtained by micro-simulation reflect the realistic results for the basic scenario (daily situation) with 1.500 ped/h and maximum daily scenario with 3.000 ped/h. The other scenarios have been defined and simulated in order to prevent congestion and related problems. Considering the data obtained through the calibration and validation of the model, the micro-simulation results are defined in terms of the density (number of pedestrian/m2) as shown in Figure 5. It is possible to see that the scenario titled “4th” relating to the partial maintenance activities increases the density to a value double compared to the flow conditions in daily conditions with 3.000 ped/h.
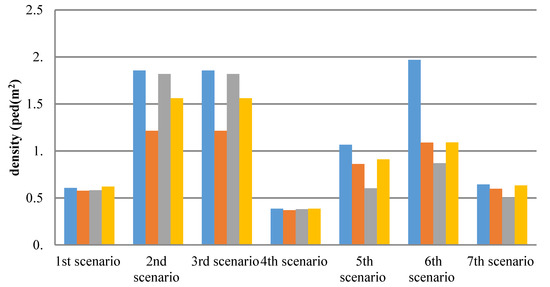
Figure 5.
Density evaluation in accordance with different monitored scenarios.
An increase of 10–15% of the density value compared to standard conditions is obtained in the case of evacuation.
In literature it is found that the average speed of the elderly is 0.92 m/s [62] similar to that of a child accompanied by the mother or dragging the baby stroller. Generally and but adult has an average speed of about 1.6 m/s with a fast pace while the speed of a normal step is 1.2 m/s.
These speeds are assumed in an unconfined space. In the case study it is necessary to consider the presence of the slope, the presence of steps and the presence of a geometry that limits the movements decreasing these values by about 20–25%. This reduction is justified by the evacuation scenario allowing escaping only in one direction along the bridge and therefore the accumulation of people does not allow moving faster than other cases in which there is the presence of more space for the movement of each walker. In the graph, it is possible to see a speed value between 0.4 and 0.6 m/s during the evacuation and maintenance phase with 3.000 ped/h. This value depends on the first case from the univocal escape direction and the accumulation effect of the people blocking the path by reducing speed. In the case of maintenance with 3.000 ped/h, the obstruction caused by the area without access generates a reduction in speed due to the high density. Instead, in the cases of standard/normal (daily) conditions with 1.500 and 3.000 ped/h, there are speeds between 0.9 and 1.1 m/s as well as in the case of handling with 1.500 ped/h.
The scenario with 3.000 ped/h represents standard conditions with constant value along the entire bridge. This value owes to the massing of people during the exit from the area subject to some problem or disaster. In terms of density, there is an increase in the value in the case of a scenario with 3.000 ped/h with maintenance activity scenario as the space of possible movement is halved and the flow is at a maximum especially along the two ramps as described in Figure 5.
The images below allow visualization of the cases analyzed considering the superimposition of an orthophoto with the areas implemented for the pedestrian simulation.
It also shows how the geometry is taken into analysis considers an extension of about 30 m with two bays with a slope of about 10–12% characterized by a surface with steps. Each scenario is characterized by the presence or lack of an inaccessible area linked to maintenance activities. Appropriate ranges of values have been selected to be able to chart the variability of the ramp service level and in the previous and subsequent areas.
In particular, the results produced by the results made by the simulations mean that the LOS results of the investigated area are equal to the values shown in Table 8.

Table 8.
LOS range related to RAMP and AREA.
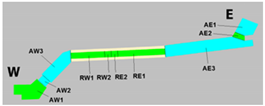
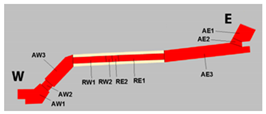
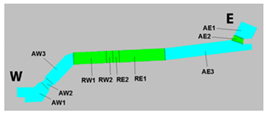
In the areas and ramps characterizing the monitored track, a range of speeds of 0.308 m/s was evaluated, characterized by cold blue tones in the images to follow up to 2.7 m/s characterized by warm red tones. Therefore, in Table 8, it is denoted that a fluid and constant flow is characterized by high speeds and warm colors and that this concept becomes critical in some scenario conditions where speeds are reduced almost to block the flow.
In the first scenario, there is a variability of the speeds both in the access areas and in the ramps between 1.07 m/s and the maximum admissible speed value >2.1 m/s. This value increases by 10–15% in the ramps compared to the areas. Scenario 1 is linked to a daily good fluidity of the pedestrian outflow. In scenario 2, the doubling of the flow leads to a reduction of the speed in the ascending west ramp compared to the east descent ramp, instead, the access and exit speeds to the terminal areas are reduced by 5–7% with respect to the first scenario. The evacuation scenario 3 with 1.650 ped/h shows a velocity <1.1 m/s in the west area where people are destined to take shelter while in the area of the East to which the motion is inhibited, it is characterized by a faster speed. The high values of an entering and exiting flow in the first area drastically reduce the speed of the area W. The ramp W also has a speed half of the ramp E as long as there is a chaotic massing of people evacuating from the first of the two. They performed to identify differences between the average walking speeds of single walker (1.00 m/s, ±0.07) and groups (0.89 m/s, ±0.01). To compare the results obtained in the various scenarios, the pedestrian and done speed range of LOS were modulated both in the areas and in the ramps as shown in Table 8 below.
To better understand the value of LOS related to the monitored infrastructure, it has been hypothesized to divide the ramps and the n areas, in both directions as shown in Figure 6. Likewise, the simulation and evaluation of service levels have been carried out for each defined section.
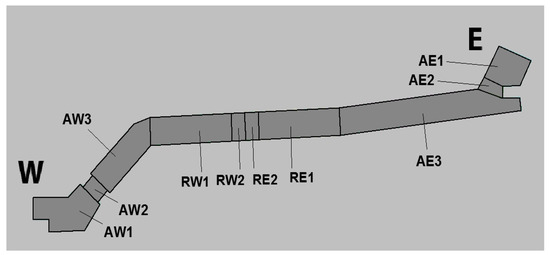
Figure 6.
Subdivision of areas and ramps by direction and relative to the Mostar bridge.
The results obtained are shown below on Table 9.

Table 9.
LOS comparison considering ramp W and E for each scenario.
The present study highlights the need to evaluate the LOS value of pedestrian infrastructures considering a confined space such as the Stari Most footbridge.
Many works in the literature were dedicated to pedestrian crossings or sidewalks with evaluations made using micro simulation tools.
The evaluation of the Mostar bridge area is due to the lack of micro simulation studies applied to pedestrian bridges in literature and also it is useful to examine a bridge with the typical geometry of the Ottoman infrastructures constituted by the areas and the steep slopes with a high walking flows.
Considering the position and the geometry, this bridge allows only the pedestrian transit and connects the areas with a strong tourist and commercial vocation.
Through the data acquisition, using cameras, it was possible to monitor the run during the summer both on weekdays and holidays.
Through the traffic simulation it was possible to evaluate and compare different scenarios, considering also the worst conditions such as the partial maintenance of the infrastructure or the evacuation due to terrorism or similar events.
Through the characterization of the human run components and through the recorded video and the definition of some targets along the bridge it was possible to obtain the speed of movement on the ramps and in the areas. The current scenario has been compared with other hypotheses in order to evaluate the service level through the LOS index estimated through the micro-simulation. The prior knowledge of LOS values allows local authorities to assess in advance the possibility of partial or closed use of the area. In this way it is possible that the maintenance activities of historical and architectural assets are planned taking into account also the peak flow. The assessment of the scenarios with the greater pedestrian traffic that occurs during the summer period leads to a critical judgment on the maintenance activities in those months, if not of particular necessity or timeliness.
The calibration of the Helbing model through the use of a range of default or set values allows a rather realistic evaluation of the human behavior defined by the social force models that characterize the movement of non-isolated individuals. This work is the first step in evaluating pedestrian behavior on a bridge with ramps which will be followed by further monitoring and scenario evaluations.
Author Contributions
T.C. and G.T. designed the experiments; A.C. and B.C. performed the experiments; all of the authors analyzed the data; T.C. and A.C. wrote the paper; G.T. and I.L. provided oversight for the safety analysis methodology and high level editorial review of the paper.
Funding
This research received no external funding.
Conflicts of Interest
The authors declare no conflict of interest.
References
- Helbing, D.; Molnar, P. Social force model for pedestrian dynamics. Phys. Rev. E 1995, 51, 4282. [Google Scholar] [CrossRef]
- Helbing, D.; Buzna, L.; Johansson, A.; Werner, T. Self-organized pedestrian crowd dynamics: Experiments, simulations, and design solutions. Transp. Sci. 2005, 39, 1–24. [Google Scholar] [CrossRef]
- Zanlungo, F.; Ikeda, T.; Kanda, T. Social force model with explicit collision prediction. Europhys. Lett. 2011, 93, 68005. [Google Scholar] [CrossRef]
- Helbing, D.; Farkas, I.; Vicsek, T. Simulating dynamical features of escape panic. Nature 2000, 407, 487. [Google Scholar] [CrossRef]
- Carroll, P.S.; Owen, S.J.; Hussein, F.M.M. Modelling crowd–bridge dynamic interaction with a discretely defined crowd. J. Sound Vib. 2012, 331, 2685–2709. [Google Scholar] [CrossRef]
- Jiménez-Alonso, F.J.; Sáez, A.; Caetano, E.; Magalhães, F. Vertical crowd–structure interaction model to analyze the change of the modal properties of a footbridge. J. Bridg. Eng. 2016, 21, C4015004. [Google Scholar] [CrossRef]
- Basbas, S.; Nikiforiadis, A.; Sarafianou, E.; Kolonas, N. Behavior and Perceptions of University Students at Pedestrian Crossings. In Proceedings of the 4th Conference on Sustainable Urban Mobility, Skiathos Island, Greece, 24–25 May 2018; pp. 280–287. [Google Scholar]
- Collotta, M.; Pau, G.; Scatà, G.; Campisi, T. A dynamic traffic light management system based on wireless sensor networks for the reduction of the red-light running phenomenon. Transp. Telecommun. 2014, 15, 1–11. [Google Scholar] [CrossRef]
- Zakaria, J.; Ujang, N. Comfort of walking in the city center of Kuala Lumpur. Procedia Soc. Behav. Sci. 2015, 170, 642–652. [Google Scholar] [CrossRef]
- Antonini, G.; Bierlaire, M.; Weber, M. Discrete choice models of pedestrian walking behavior. Transp. Res. Part B Methodol. 2006, 40, 667–687. [Google Scholar] [CrossRef]
- Kormanová, A. A review on macroscopic pedestrian flow modelling. Acta Inf. Pragensia 2014, 2, 39–50. [Google Scholar] [CrossRef]
- Varas, A.; Cornejo, M.D.; Mainemer, D.; Toledo, B.; Rogan, J.; Munoz, V.; Valdivia, J.A. Cellular automaton model for evacuation process with obstacles. Phys. A Stat. Mech. Appl. 2007, 382, 631–642. [Google Scholar] [CrossRef]
- Okazaki, S. A study of pedestrian movement in architectural space, part 1: Pedestrian movement by the application on of magnetic models. Trans. AIJ 1979, 283, 111–119. [Google Scholar]
- Kretz, T.; Mayer, G.; Mühlberger, A. Behaviour and perception-based pedestrian evacuation simulation. In Pedestrian and Evacuation Dynamics; Springer: Boston, MA, USA, 2011; pp. 827–831. [Google Scholar]
- Helbing, D.; Molnár, P.; Farkas, J.I.; Bolay, K. Self-organizing pedestrian movement. Environ. Plan. B Plan. Des. 2001, 28, 361–383. [Google Scholar] [CrossRef]
- Kadali, R.B.; Vedagiri, P. Review of the pedestrian level of service: Perspective in developing countries. Transp. Res. Rec. J. Transp. Res. Board 2016, 2581, 37–47. [Google Scholar] [CrossRef]
- Fruin, J.J. Designing for Pedestrians: A Level-of-Service Concept; Public Transportation United States: Washington, DC, USA, 1992. [Google Scholar]
- Môri, M.; Tsukaguchi, H. A New Method for Evaluation of Level of Service in Pedestrian Facilities. Transp. Res. Part A 1987, 21, 223–234. [Google Scholar] [CrossRef]
- Sarkar, S. Determination of Service Levels for Pedestrians, with European Examples. Transp. Res. Rec. 1993, 1405, 35–42. [Google Scholar]
- Khisty, J.C. Evaluation of Pedestrian Facilities: Beyond the Levelof- Service Concept. Transp. Res. Rec. 1994, 1438, 45–50. [Google Scholar]
- Manual, H.C. Highway Capacity Manual; Transportation Research Board: Washington, DC, USA, 2000. [Google Scholar]
- Landis, B.; Vattikuti, V.; Ottenberg, R.; McLeod, D.; Guttenplan, M. Modeling the Roadside Walking Environment: Pedestrian LOS. Transp. Res. Rec. 2001, 1773, 82–88. [Google Scholar] [CrossRef]
- Muraleetharan, T.; Adachi, T.; Hagiwara, T.; Kagaya, S. Method to Determine Pedestrian Level-of-Service for Crosswalks at Urban Intersections. J. East. Asia Soc. Transp. Stud. 2005, 6, 127–136. [Google Scholar]
- Hummer, J.; Rouphail, N.; Hughes, R.G.; Fain, S.J.; Toole, J.L.; Patten, R.S.; Schneider, R.J.; Monahan, J.F.; Do, A. User Perceptions of the Quality of Service on Shared Paths. Transp. Res. Rec. 2005, 1939, 28–36. [Google Scholar] [CrossRef]
- Petritsch, A.T.; Landis, B.W.; McLeod, P.S.; Huang, H.F.; Challa, S.; Guttenplan, M. Level-of-Service Model for Pedestrians at Signalized Intersections. Transp. Res. Rec. J. Transp. Res. Board 2005, 1939, 55–62. [Google Scholar] [CrossRef]
- Bian, Y.; Wang, W.; Lu, J.; Junlai, M.; Dandan, T. Pedestrian Level of Service for Sidewalks in China. In Proceedings of the 86th Annual Meeting of Transportation Research Board, Washington, DC, USA, 21–25 January 2007. [Google Scholar]
- Dandan, T.; Wei, W.; Jian, L.; Yang, B. Research on Methods of Assessing Pedestrian Level of Service for Sidewalks. J. Transp. Syst. Eng. Inf. Technol. 2007, 7, 74–79. [Google Scholar]
- Parida, P.; Parida, M. Modelling Qualitative Level of Service for Sidewalks in Delhi. In Proceedings of the International Conference on the Best Practices to Relieve Congestion on Mixed-Traffic Urban Streets in Developing Countries, Chennai, India, 12–14 September 2008; pp. 295–304. [Google Scholar]
- Jayaprakash, P.O.; Gunasekaran, K. Application of TRB model for evaluation of pedestrian LOS under Indian conditions. In Proceedings of the International Conference on the Best Practices to Relieve Congestion on Mixed-Traffic Urban Streets in Developing Countries, Chennai, India, 12–14 September 2008; pp. 287–293. [Google Scholar]
- Kotkar, L.K.; Rastogi, R.; Chandra, S. Pedestrian flow characteristics in mixed flow conditions. J. Urban Plan. Dev. 2010, 136, 23–33. [Google Scholar]
- Rastogi, R.; Chandra, S.; Mohan, M. Development of level of service criteria for pedestrians. J. Indian Roads Congr. 2014, 75, 61–70. [Google Scholar]
- Cepolina, M.E.; Menichini, F.; Rojas, G.P. Level of service of pedestrian facilities: Modelling human comfort perception in the evaluation of pedestrian behaviour patterns. Transp. Res. Part F Traffic Psychol. 2018, 58, 365–381. [Google Scholar] [CrossRef]
- Gorrini, A.; Vizzari, G.; Bandini, S. Age and group-driven pedestrian behaviour: From observations to simulations. Collect. Dyn. 2016, 1, 1–16. [Google Scholar] [CrossRef]
- Gorrini, A.; Bandini, S.; Vizzari, G. Empirical investigation on pedestrian crowd dynamics and grouping. Traffic Granul. Flow 2015, 13, 83–91. [Google Scholar]
- Fruin, J.J. Pedestrian Planning and Design; Metropolitan Association of Urban Designers and Environmental Planners: New York, NY, USA, 1971. [Google Scholar]
- Seneviratne, N.P.; Morrall, F.J. Level of service on pedestrian facilities. Transp. Q. 1985, 39, 109–123. [Google Scholar]
- National Research Council. Highway Capacity Manual (HCM 2010); Transportation Research Board: Washington, DC, USA, 2010. [Google Scholar]
- Itami, M.R. Estimating Capacities for Pedestrian Walkways and Viewing Platforms; A Report to Parks Victoria; Parks Victoria: Melbourne, Australia, 13 June 2002. [Google Scholar]
- Zegeer, V.C. Pedestrian Facilities Users Guide: Providing Safety and Mobility; US Department of Transportation, Federal Highway Administration (FHWA): McLean, VA, USA, 2002.
- PTV Group. PTV Viswalk; PTV Group: Karlsruhe, Germany, 2011. [Google Scholar]
- Allen, P.D.; Rouphail, N.; Hummer, J.; Milazzo, J. Operational analysis of uninterrupted bicycle facilities. Transp. Res. Rec. J. Transp. Res. Board 1998, 1636, 29–36. [Google Scholar] [CrossRef]
- Milazzo, J.S., II; Rouphail, N.M.; Hummer, J.E.; Allen, D.P. Quality of service for interrupted-flow pedestrian facilities in highway capacity manual 2000. Transp. Res. Rec. J. Transp. Res. Board 1999, 1678, 25–31. [Google Scholar] [CrossRef]
- Forde, S. The bridge on the Neretva: Stari Most as a stage of memory in post-conflict Mostar, Bosnia–Herzegovina. Coop. Confl. 2016, 51, 467–483. [Google Scholar] [CrossRef]
- Buchmueller, S.; Weidmann, U. Parameters of Pedestrians, Pedestrian Traffic and Walking Facilities. IVT Schriftenreihe 2006, 132. [Google Scholar] [CrossRef]
- PTV Group. PTV Vissim 9.0 User Manual; PTV Group: Karlsruhe, Germany, 2014. [Google Scholar]
- Giuffrè, O.; Granà, A.; Giuffrè, T.; Marino, R.; Campisi, T. An Italian experience on crash modelling for roundabouts. J. Eng. Appl. Sci. 2015, 10, 2471–2478. [Google Scholar]
- Pau, G.; Campisi, T.; Canale, A.; Severino, A.; Collotta, M.; Tesoriere, G. Smart Pedestrian Crossing Management at Traffic Light Junctions through a Fuzzy-Based Approach. Future Internet 2018, 10, 15. [Google Scholar]
- Campisi, T.; Tesoriere, G.; Canale, A. Microsimulation approach for BRT system: The case study of urban turbo-roundabout. AIP Conf. Proc. 2017, 1906, 190005. [Google Scholar]
- Tollazzi, T.; Tesoriere, G.; Guerrieri, M.; Campisi, T. Environmental, functional and economic criteria for comparing “target roundabouts” with one-or two-level roundabout intersections. Transp. Res. Part D Transp. Environ. 2015, 34, 330–344. [Google Scholar] [CrossRef]
- Otković, I.I.; Tollazzi, T.; Šraml, M. Analysis of the influence of car-following input parameters on the modelled travelling time. Tehničkivjesnik Znanstveno-Stručničasopistehničkih Fakulteta Sveučilišta u Osijeku 2013, 20, 919–925. [Google Scholar]
- Helbing, D.; Farkas, J.I.; Molnar, P.; Vicsek, T. Simulation of pedestrian crowds in normal and evacuation situations. Pedestr. Evac. Dyn. 2002, 21, 21–58. [Google Scholar]
- Kadali, B.R.; Vedagiri, P. Modelling pedestrian road crossing behaviour under mixed traffic condition. Eur. Transp. 2013, 55, 1–17. [Google Scholar]
- Johansson, A.; Helbing, D.; Shukla, P. Specification of the Social Force Pedestrian Model by Evolutionary Adjustment to Video Tracking Data. Adv. Complex Syst. 2007, 10, 271–288. [Google Scholar] [CrossRef]
- Kretz, T. On oscillations in the social force model. Phys. A Stat. Mech. Appl. 2015, 438, 272–285. [Google Scholar] [CrossRef]
- Korhonen, T. Technical Reference and User’s Guide for Fire Dynamics Simulator with Evacuation; VTT Technical Research Center of Finland: Espoo, Finland, 2017. [Google Scholar]
- Jobanputra, R.; Vanderschuren, M. The Development and Calibration of an Agent-Based Microsimulation Model for Vehicle-Pedestrian Interaction. In Pedestrian and Evacuation Dynamics; Springer: Cham, Switzerland, 2014; pp. 1001–1011. [Google Scholar]
- Hoogendoorn, P.S.; Daamen, W.; Bovy, H.P. Extracting microscopic pedestrian characteristics from video data. In Proceedings of the Transportation Research Board Annual Meeting, Washington, DC, USA, 12–16 January 2003; Volume 9, pp. 1–15. [Google Scholar]
- Li, S.; Sayed, T.; Zaki, M.H.; Mori, G.; Stefanus, F.; Khanloo, B.; Saunier, N. Automated collection of pedestrian data through computer vision techniques. Transp. Res. Rec. 2012, 2299, 121–127. [Google Scholar] [CrossRef]
- Boltes, M.; Seyfried, A.; Steffen, B.; Schadschneider, A. Automatic Extraction of Pedestrian Trajectories from Video Recordings. Pedestr. Evac. Dyn. 2008, 2010, 43–54. [Google Scholar]
- Laureshyn, A. Application of Automated Video Analysis to Road User Behavior; Departmentof Technology and Society, Faculty of Engineering, LTH, Lund University: Lund, Sweden, 2010. [Google Scholar]
- Laureshyn, A. T-Analyst Software. 2013. Available online: http://www.tft.lth.se/video/cooperation/software (accessed on 1 January 2019).
- Studenski, S.; Perera, S.; Patel, K.; Rosano, C.; Faulkner, K.; Inzitari, M.; Brach, J.; Chandler, J.; Cawthon, P.; Connor, E.B.; et al. Gait speed and survival in older adults. JAMA 2011, 305, 50–58. [Google Scholar] [CrossRef]
© 2019 by the authors. Licensee MDPI, Basel, Switzerland. This article is an open access article distributed under the terms and conditions of the Creative Commons Attribution (CC BY) license (http://creativecommons.org/licenses/by/4.0/).
