Article

Experimental Investigation of Structural Response of Corrugated Steel Sheet Subjected to Repeated Impact Loading: Performance of LNG Cargo Containment System

Department of Naval Architecture and Ocean Engineering, Pusan National University, Busan 46241, Korea
*
Author to whom correspondence should be addressed.
Appl. Sci. 2019, 9(8), 1558; https://doi.org/10.3390/app9081558
Submission received: 20 March 2019 / Revised: 1 April 2019 / Accepted: 9 April 2019 / Published: 15 April 2019
(This article belongs to the Section Mechanical Engineering)

Abstract

:
The primary barrier in contact with LNG (Liquefied natural gas) cargo is manufactured from stainless steel, and has a corrugated membrane structure due to thermal deformation caused by extreme temperature differences. Because the primary barrier is tailored to be LNG watertight, the structural integrity of the primary barrier must be maintained despite the increase in LNG sloshing load. Among the various types of fluid impacts in a cargo hold, jet flow runs up along the wall of the cargo hold and extreme impact load is exerted on the side of the corrugation of the primary barrier. However, the impact behavior of the primary barrier under the prevailing environment has not been investigated due to the limitation of test methods. Thus, in the present study, the inelastic structural behavior of thin-walled and curved-shaped structures for liquefied natural gas cargo containment systems under repeated impact loading was investigated experimentally. Custom-built structural impact test equipment with large-scale weight drop test facilities was fabricated, and a series of structural impact tests were carried out. The impact energy and the number of repetitions were taken into account in order to investigate the characteristics of the inelastic structural behavior, such as plastic deformation and reaction force time history according to impact energy.

1. Introduction

The liquefied natural gas cargo containment system (LNG CCS) can be exposed to harsh environments, such as cryogenic temperatures and, particularly, sloshing loads. Sloshing results from the relative motion of the free surface of the fluid in a cargo hold and ship motion, for example standing waves in partially filled cargo tanks on board an LNG carrier [1]. Severe and violent sloshing typically occurs when the vessel moves with motion periods similar to the highest sloshing resonance period of the liquid in the cargo tank. Violent sloshing may produce breaking waves and a high-velocity fluid surface. In such cases, the fluid can lead to impact loads on the containment system, and if an impact load exceeds the structural strength of the CCS, it can cause structural failure. There has been a real accident of primary barrier damage caused by a sloshing load [2,3,4]. The failure of an LNG CCS can lead to tremendous loss of human and material resources. Therefore, robust design and fabrication of LNG CCS is essential.
The LNG wave inside the CCS is the form of crest, trough, and breaking wave, which interacts with the inner wall of the CCS and physically affects it, as shown in Figure 1. It takes three steps for a wave to load a wall: approaching, impact, and jet formation. The jet appears both upward and downward against the wall after impact [5]. As a result, the loading direction of the sloshing wave relative to the insulation panels is vertical or horizontal. When a violent sloshing acts on the insulation system with a vertical load, a sloshing load is applied to all components of the CCS, which can cause structural failure. Several studies have been conducted to evaluate the behavior and damage of materials and structures applied to CCS [6,7,8,9,10,11]. In these studies, the material nonlinear behavior and failure/fracture features of the primary barrier (austenitic stainless steel), secondary barrier (multi-laminated adhesively bonded joints), and thermal insulation barrier (glass fiber-reinforced polyurethane foam) were experimentally estimated, and a computational analysis method as well as a numerical material model were proposed. Dynamic modeling has been proposed to precisely predict the impact behavior of structures [12,13]. However, the LNG CCS structure is composed of various composite materials and the primary barrier has complex geometry, so it is very difficult to apply the dynamic modeling method. Moreover, a full-scale test, small-scale tank test, and a wet drop test were performed to analyze the fluid behavior due to the interaction of the wall and wave [5,14,15,16,17,18,19]. Due to the interaction of the LNG and the wall, the jet flow impact runs up along the wall of CCS [19,20,21] and the acceleration of the jet increases momentarily to 1500 times gravitational acceleration [22]. This impact load can affect the CCS (especially the primary barrier) much more than an ordinary LNG wave load. Thus, jet flow impact should be considered in the structural strength assessment.
Several studies have been conducted to evaluate the effect of external loading on the behavior of corrugated membranes [9,23,24]. Kim et al. (2011) performed a pressure test on the primary barrier for the Mark-III type CCS, and defined the critical pressure point at which buckling collapse occurred in the corrugation [9]. Kim et al. (2014) conducted a cryogenic tensile test of primary barriers to simulate the hull bending moment environment, thus investigating the tensile behavior of the knot part [23]. They proposed a numerical model to simulate material nonlinear behavior. However, these studies have focused on the plastic behavior of the primary barrier under quasi-static loading or pressure. Kim et al. (2008) performed a wet-drop test, which is the closest to actual conditions, by installing a real part of the primary barrier [24]. In this experiment, however, a jet is not formed because of the experimental restriction of air entrapment. The large and small corrugation of the primary barrier is mainly affected by jet flow impact. Therefore, the load history and deformation characteristics for corrugations under horizontal impact loading should be investigated to evaluate the impact behavior of the primary barrier. However, it was not possible to simulate jet impact loads through the existing test method. In particular, the lateral load history of the corrugation could not be measured. Furthermore, given that the impact load repeatedly acts on the LNG CCS over the ship’s life [25], it is necessary to consider the effect of repetitive impact loading. However, no study has investigated the behavior of the primary barrier under repeated impact.
In this study, a custom-built structural impact test equipment was fabricated to quantitatively evaluate the impact characteristics of the corrugations of the primary barrier. The impact test machine was designed to simulate the jet flow impact on the corrugations in terms of the reaction force profile and deformation in accordance with the impact energy and number of repetitions of the impact. The results of this study can be used as fundamental data for the robust design of LNG CCS by evaluating the structural performance, taking into consideration the jet flow impact based on the fluid behavior in the LNG cargo tank.

2. Experiments

2.1. Test Specimen

The primary barrier is there to prevent leakage of LNG. It is composed of 304L stainless steel (1.2 mm thickness), which is subject to thermal shrinkage in a cryogenic environment. A corrugation structure is adopted to solve the thermal shrinkage problem caused by large temperature differences. The jet flow runs up horizontally along the wall of the CCS. Therefore, the corrugation is arranged in a lattice structure on the wall, which is mainly influenced by the jet flow impact. Thus, a corrugation specimen is prepared to investigate the effect of jet flow on the primary barrier. The chemical composition of 304L stainless steel is listed in Table 1.
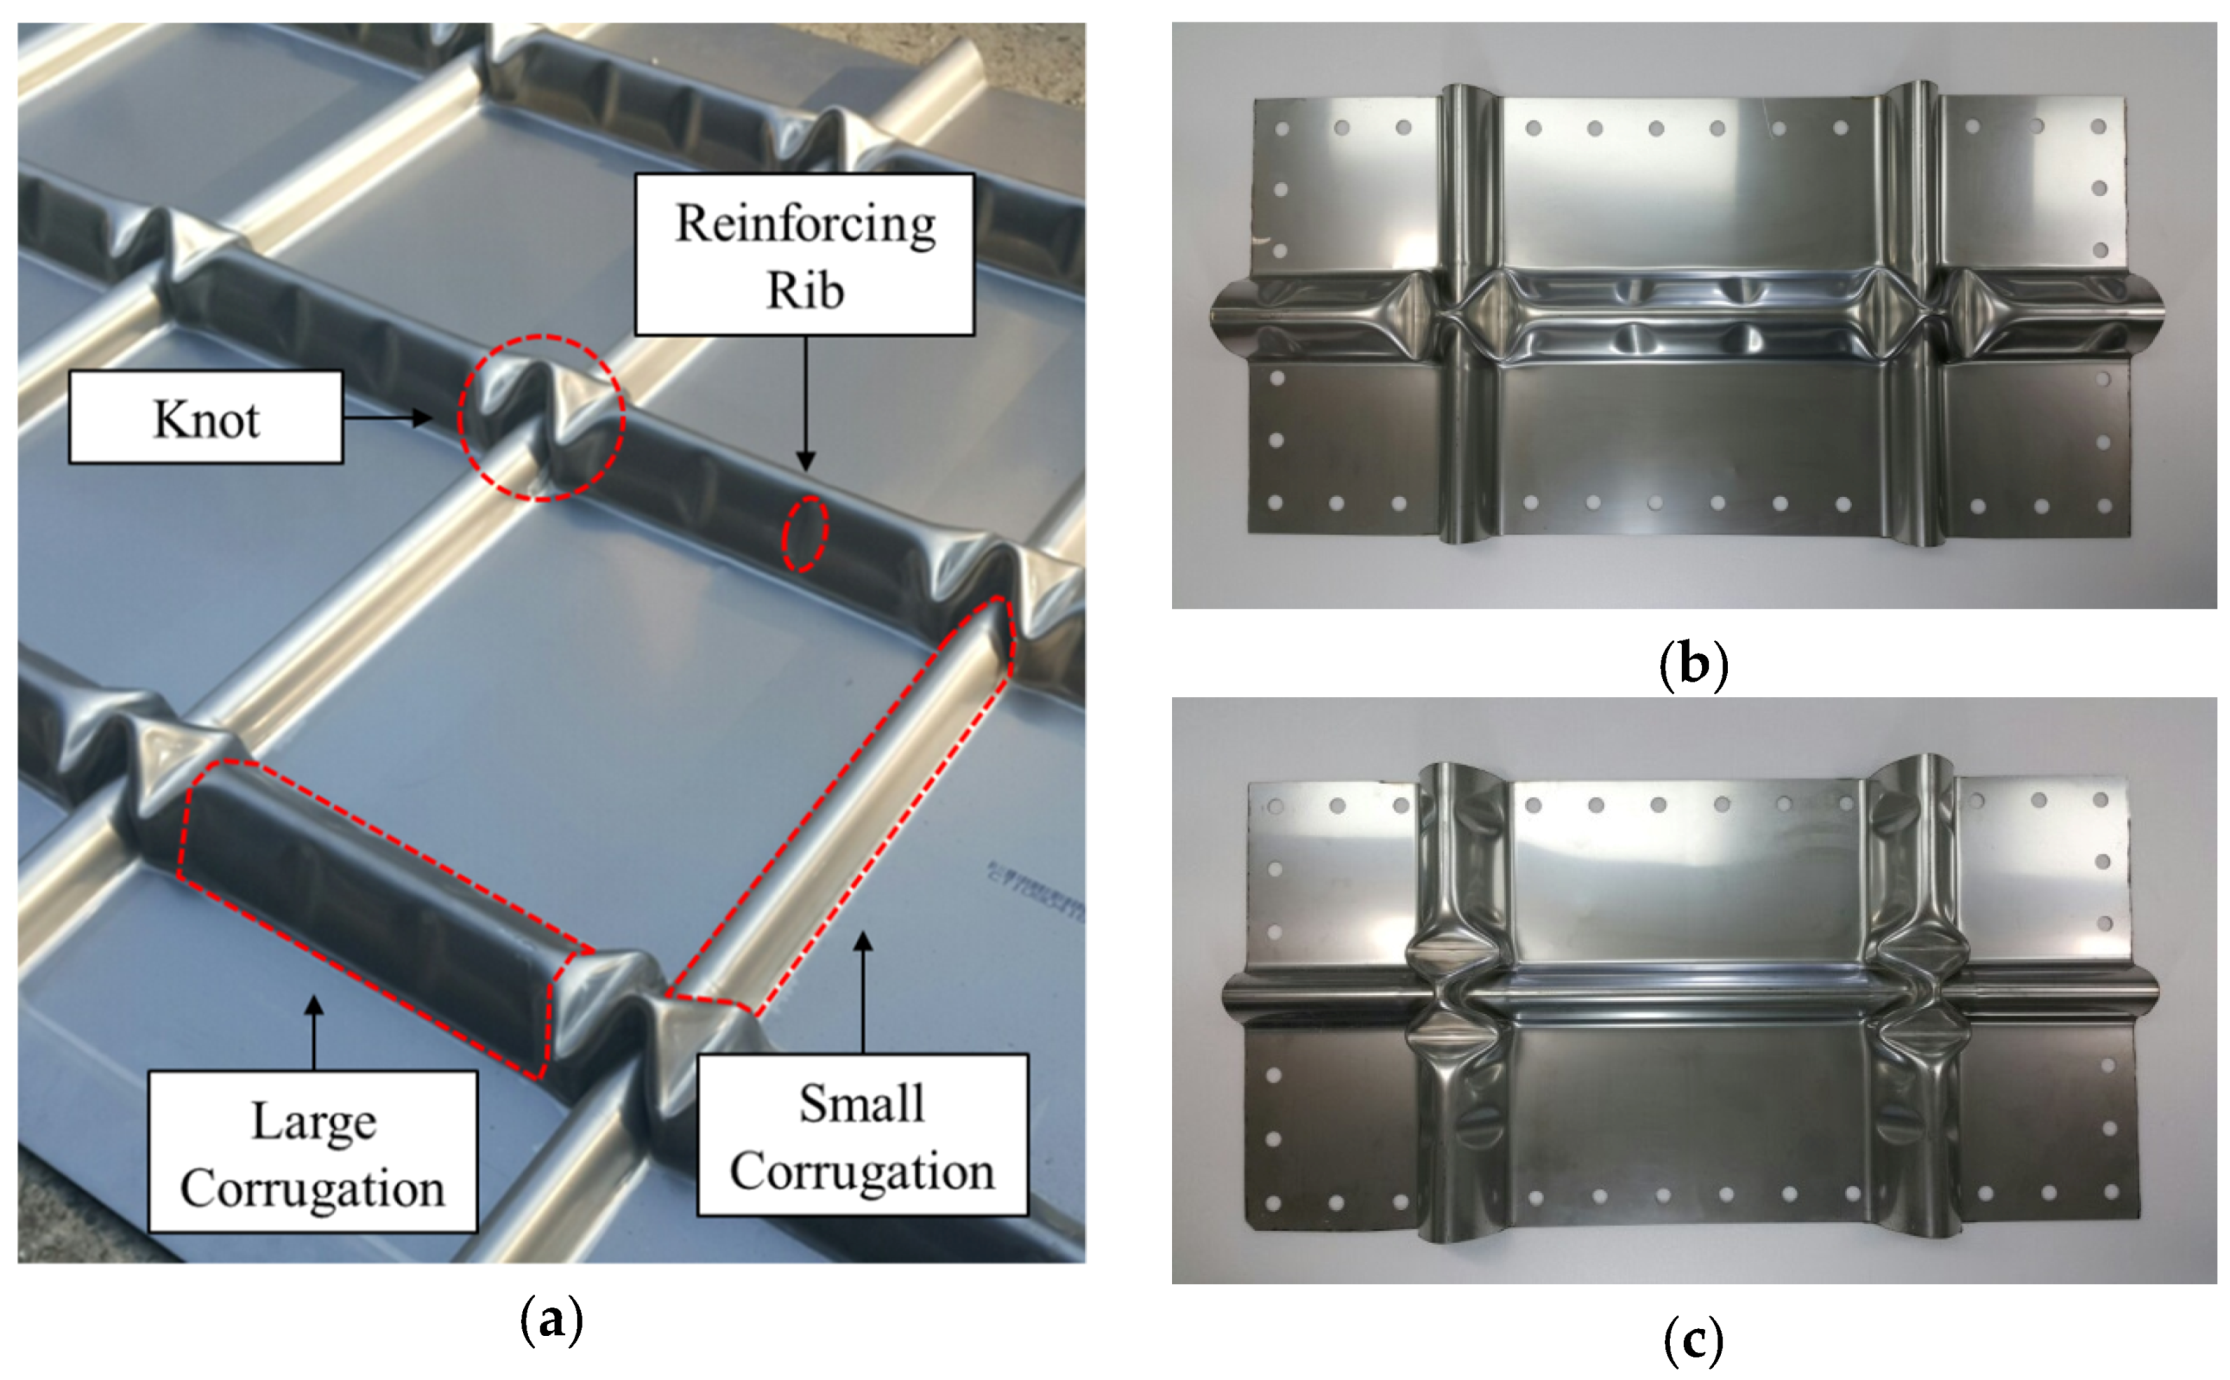
To investigate the impact behavior of corrugation under jet flow impact, a drop impact method for corrugation was adopted. To apply impact on the corrugations, the corrugated membrane sheet was cut into two types of specimen, as shown in Figure 2. This is because the corrugated membrane sheet has both large and small corrugation arranged at intervals of 340 mm. To minimize the effect of the surrounding geometry on a targeted corrugation, test specimens were 680 mm long and 340 mm wide. The test specimens were installed in a vertically erected shape to facilitate gravity-induced drop impacts. The holes made to fix the specimens onto the experimental apparatus were spaced 10–15 mm from the edges to avoid tearing during the testing.

2.2. Experimental Apparatus

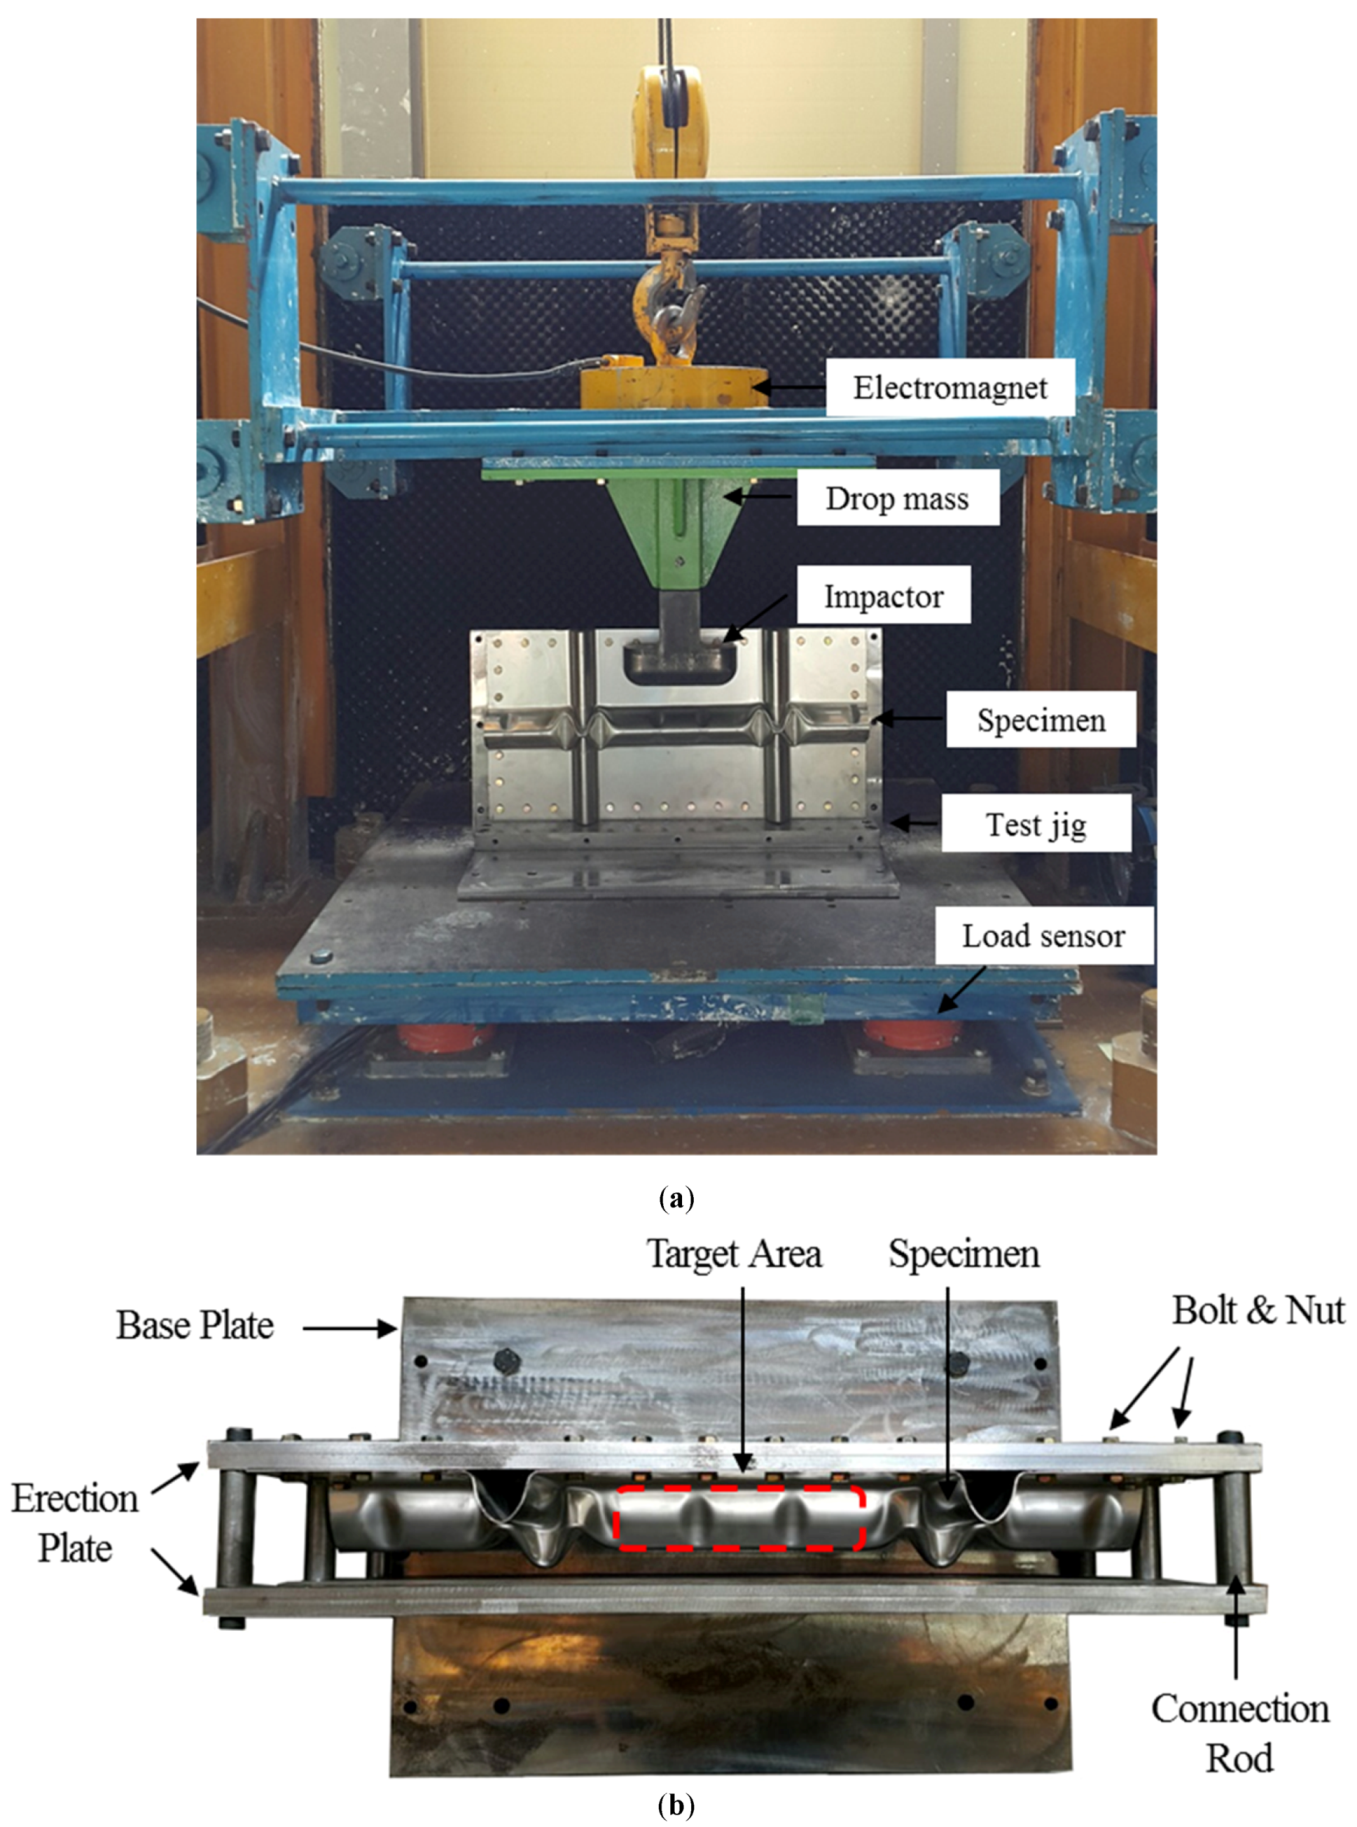
The test equipment was designed to simulate the environment where the jet flow impact is applied to the primary barrier, as shown in Figure 3a. The impact test machine was designed to apply horizontal impact load by free fall of a dropped object onto the specimen at a certain height controlled by an electromagnet. This equipment consists of three parts: impactor, fixing jig, and measuring equipment. The impact energy applied to the test specimen is estimated through the drop height and speed of the impactor, which is designed to apply an impact load on large and small corrugation specimens. The total width of the impactor was 220 mm, and the radius of curvature was 35 mm to avoid an unwanted tearing phenomenon. The weight of the impactor alone could not generate sufficient loads; therefore, the drop object was added to specifically apply impact loads in the downward direction. The total weight of the drop object with the impactor was 340 kg. The drop object was fabricated to constrain the rotation of the impactor during the impact tests.
Figure 3b displays the impact test jig with a large corrugation specimen that was erected and fixed during the impact testing. The two erection plates maintained the distance from the corrugation knot of the primary barrier. One of the erection plates held the specimen with bolts and nuts, whereas the other prevented the impactor from escaping the path to the specimen. Owing to the presence of the erection plates holding the primary barrier, it was not possible to observe the deformed shape of the primary barrier using a high-speed camera. Six connection rods were installed at both sides between the erection plates to prevent the erection plates from moving. The bottom plate fixed both the erection plates and the entire experimental apparatus on the impact test machine. Four load sensors under the fixing jig measured the real time impact load generated by the impactor. The deformation or behavior of a specific object can be measured by photographing with a high-speed camera. In the present study, however, as the structure of the impact test jig hindered capturing photographs of the deformed shape of the specimen during the impact test, only the displacement of the impactor was measured to calculate its acceleration.

2.3. Experimental Scenario

To investigate the impact behavior of a primary barrier, the reasonable drop height of the impactor with the drop object was first investigated. A reasonable range was set for the load using wet-drop testing to determine the impact loading on the primary barrier, because excessive impact energy in a drop test may damage the experimental apparatus. To determine the reasonable load to be applied on the primary barrier, an equivalent relationship was assumed between the impact energy and potential energy in the wet drop test.
In the wet drop test, the dynamic pressure was measured using a pressure gauge attached to the lower surface of the specimen to investigate the impact loads acting on the specimen. In this process, the impact energy was applied to both the large and small corrugations in contact with the water surface. The potential energy of the impactor at a certain height, which would then be applied to a corrugation, is equivalent to the impact energy acting on the corrugation during a wet drop test, so that the relationship was used to calculate the drop height used in this study. By applying the method for the drop height selection to the four cases of the wet drop test [24], the drop heights of the four cases were calculated in accordance with the peak pressure. Table 2 lists the impact energy during the wet drop testing, drop velocity, and drop height during the drop testing, based on the experimental results of the wet drop testing.
The experimental scenarios according to the impact energy, number of iterations, and types of specimen are listed in Table 3. L and S points in the scenarios in Table 3 represent the specimens with large and small corrugations, respectively. Numbers 123, 230, 282, and 412 represent the impact energy in joules at each drop height. The impact loading was repeatedly applied up to 10 times. However, when the corrugation was completely collapsed, the repeated impact test was terminated. To capture the photograph of the test specimen, after the first, fifth, and tenth repeated impact tests, the test specimen was detached from the impact test jig. In addition, the time interval between successive impacts was set to be within 5 min.
Owing to the limitation of the experimental facility for establishing a cryogenic environment, all the experiments were performed at room temperature. According to Park et al. (2010) [26], yield and tensile strength of stainless steel increased by 9% and 71% at cryogenic temperatures, respectively. Thus, the room temperature test condition in this study is more conservative than the cryogenic test condition.

3. Results and Discussions

As the behavior of the structure depends on the load profile, it is important to identify how the load profile of this study relates to the actual sloshing load. Thus, the statistical analysis results of the sloshing profiles in the LNG cargo hold [25] were compared to the reaction force time history performed in this study. The load profile can be defined primarily in terms of pressure magnitude, duration, and rise time. To identify the relationship between the actual sloshing load and the result of this study, a comparative analysis of the temporal patterns such as duration and rise time is required, which are important factors in determining the sloshing pressure profile. For all the scenarios considered in this study, the mean and standard deviation of the duration and rise time from the reaction force time history were compared with the reference literature. The results are listed in Table 4.
The results of this study show that the measured duration and rise time are longer than those reported in literature. The ratios of the rise time and duration, which determine the triangular shape of the pressure time history, are similar. Thus, the rationality of the lateral impact methodology was secured through similarity with the sloshing pressure profile.

3.1. Effect of Impact Energy

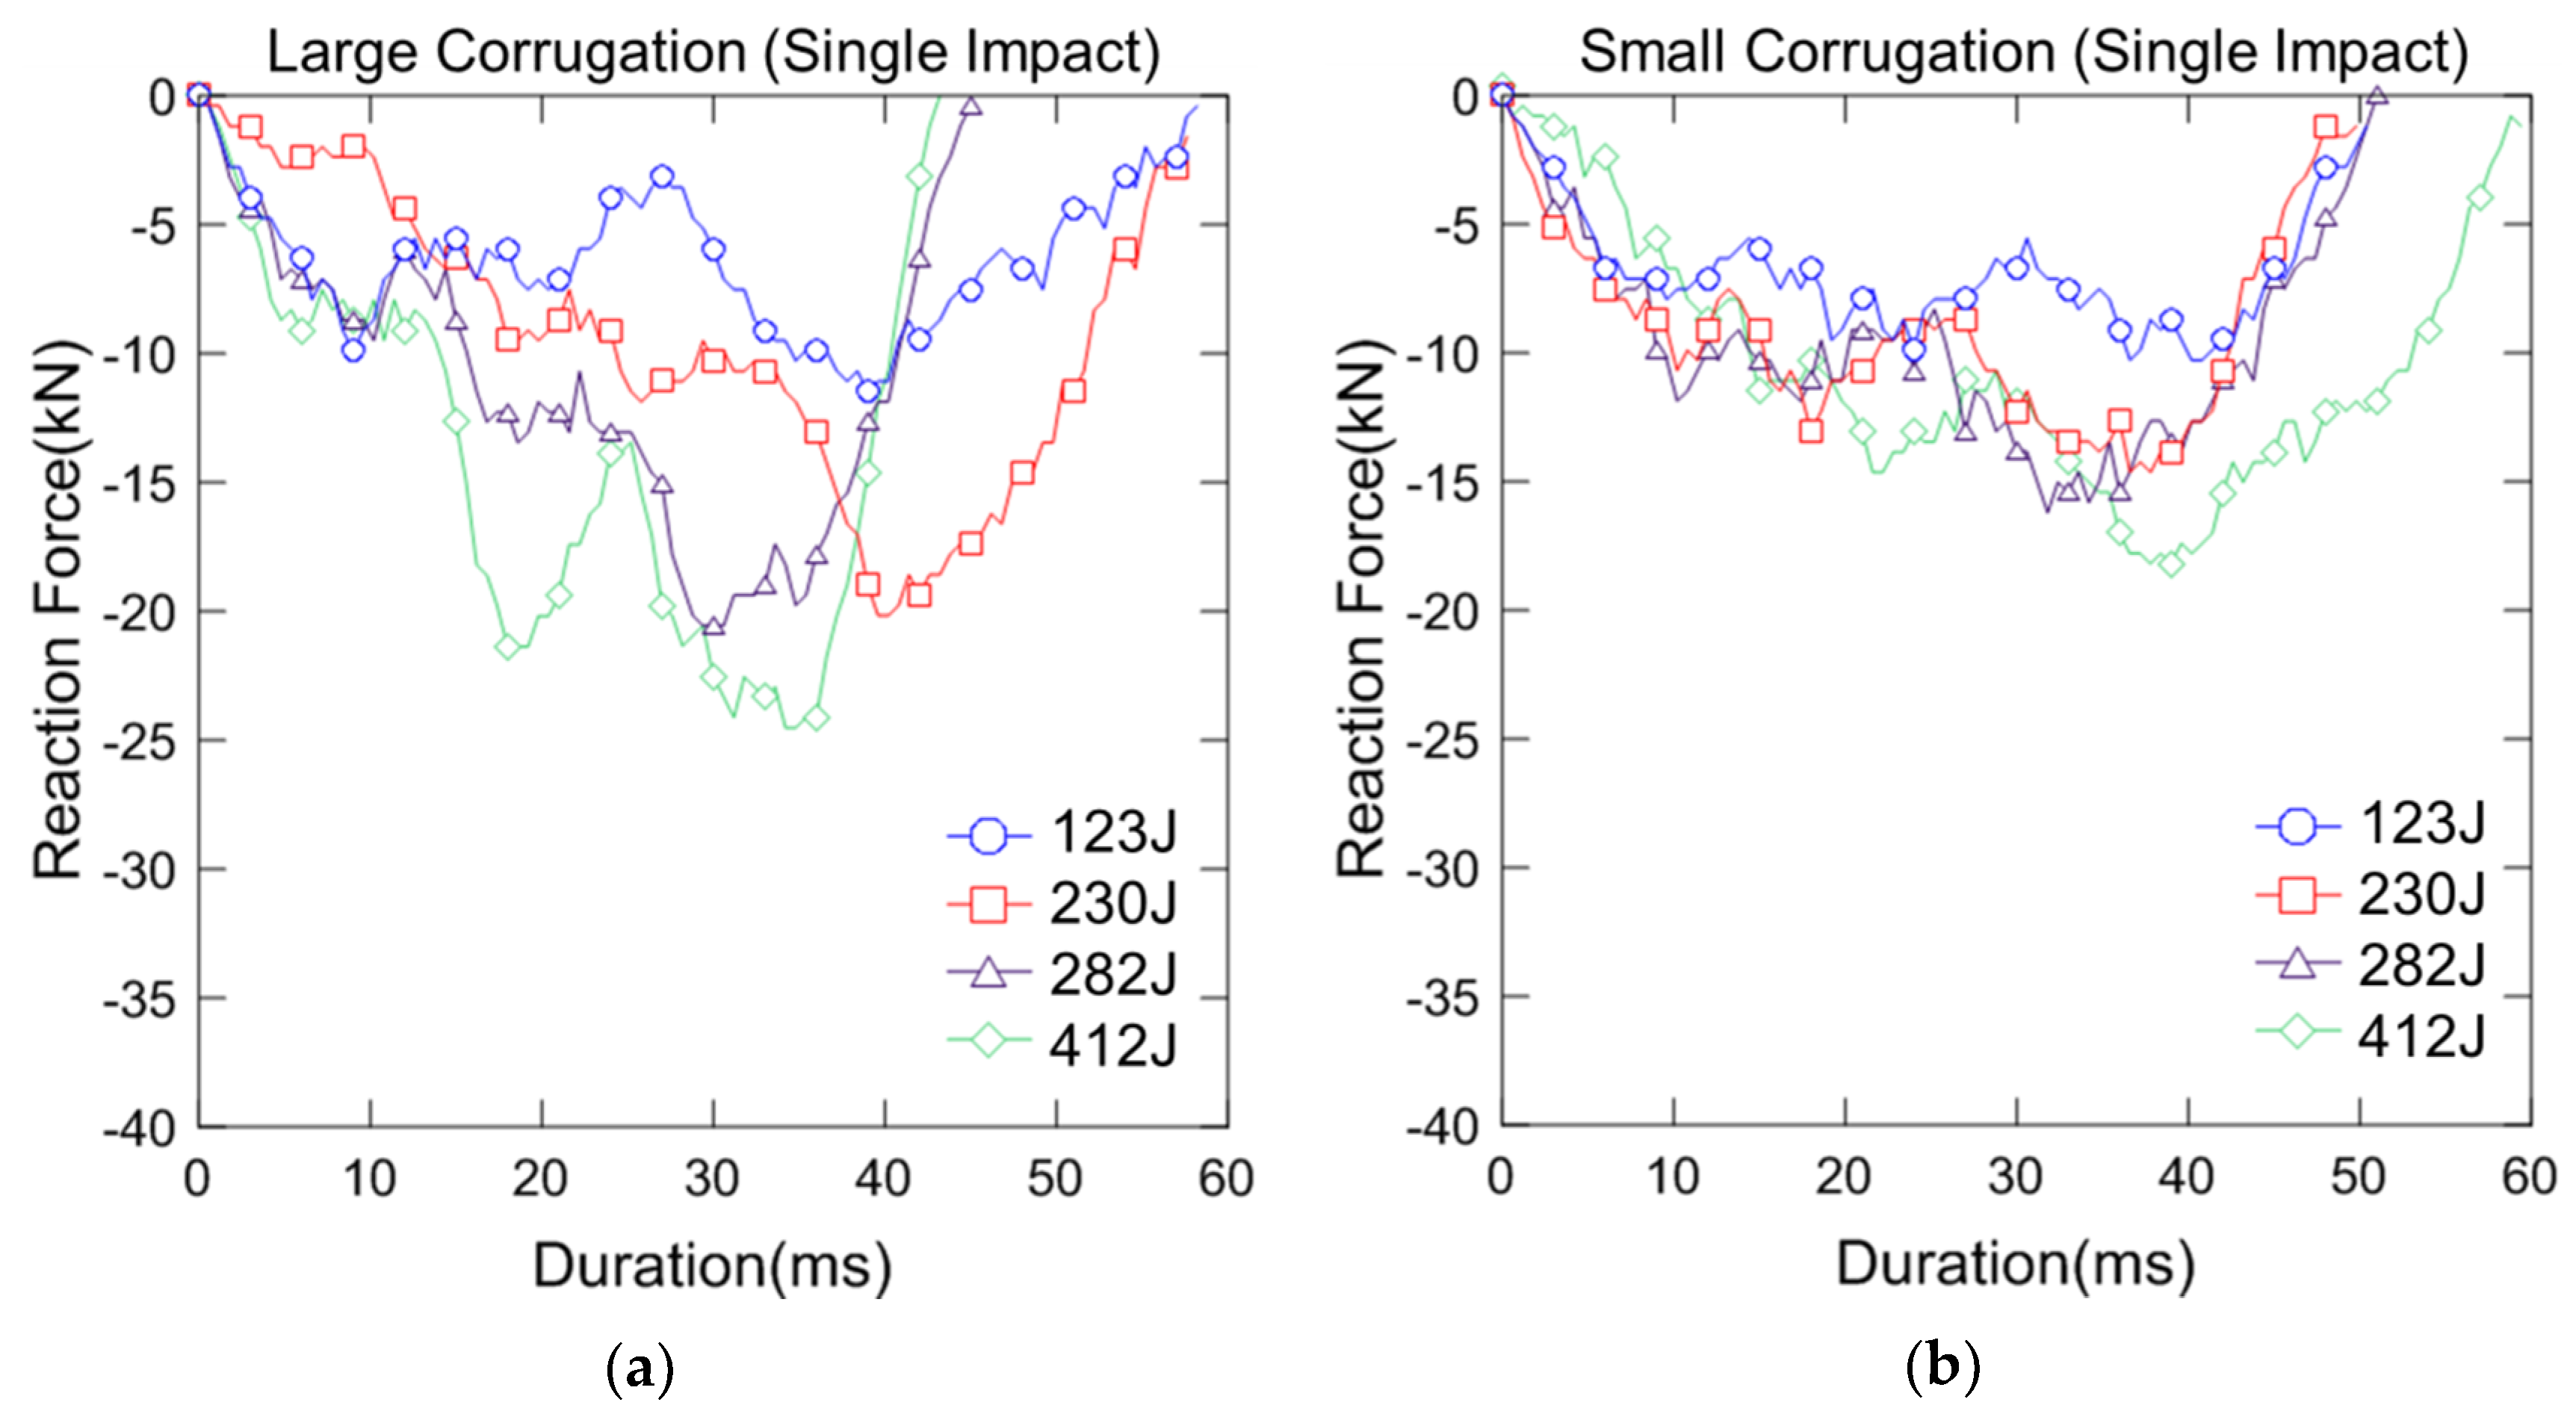
The effect of the impact energy on a primary barrier was evaluated in terms of the reaction force profile and deformation. The drop object, together with the impactor, was released from 0.038 m, 0.071 m, 0.087 m, and 0.127 m onto the specimens with large and small corrugations. Figure 4 illustrates the reaction force profile under the first impact in relation to the impact energy. Figure 4 illustrates the reaction force profile under the first impact in relation to the impact energy. In the case of large corrugation specimen, the reaction force profile does not show similar shape in accordance with impact energy. This is because large corrugation has complex geometry such as four reinforcing ribs. Commonly, the peak reaction force tended to be generated later. However, in the case of small corrugation specimen, both duration and peak reaction forces increased as the impact energy increases. After reaching the peak point in the reaction force–time history, the rate of decrease in the reaction force for the large corrugation specimen increases with the increasing impact energy. However, all the small corrugation specimens show a steadily decreasing rate of the reaction force with the increasing impact energy.
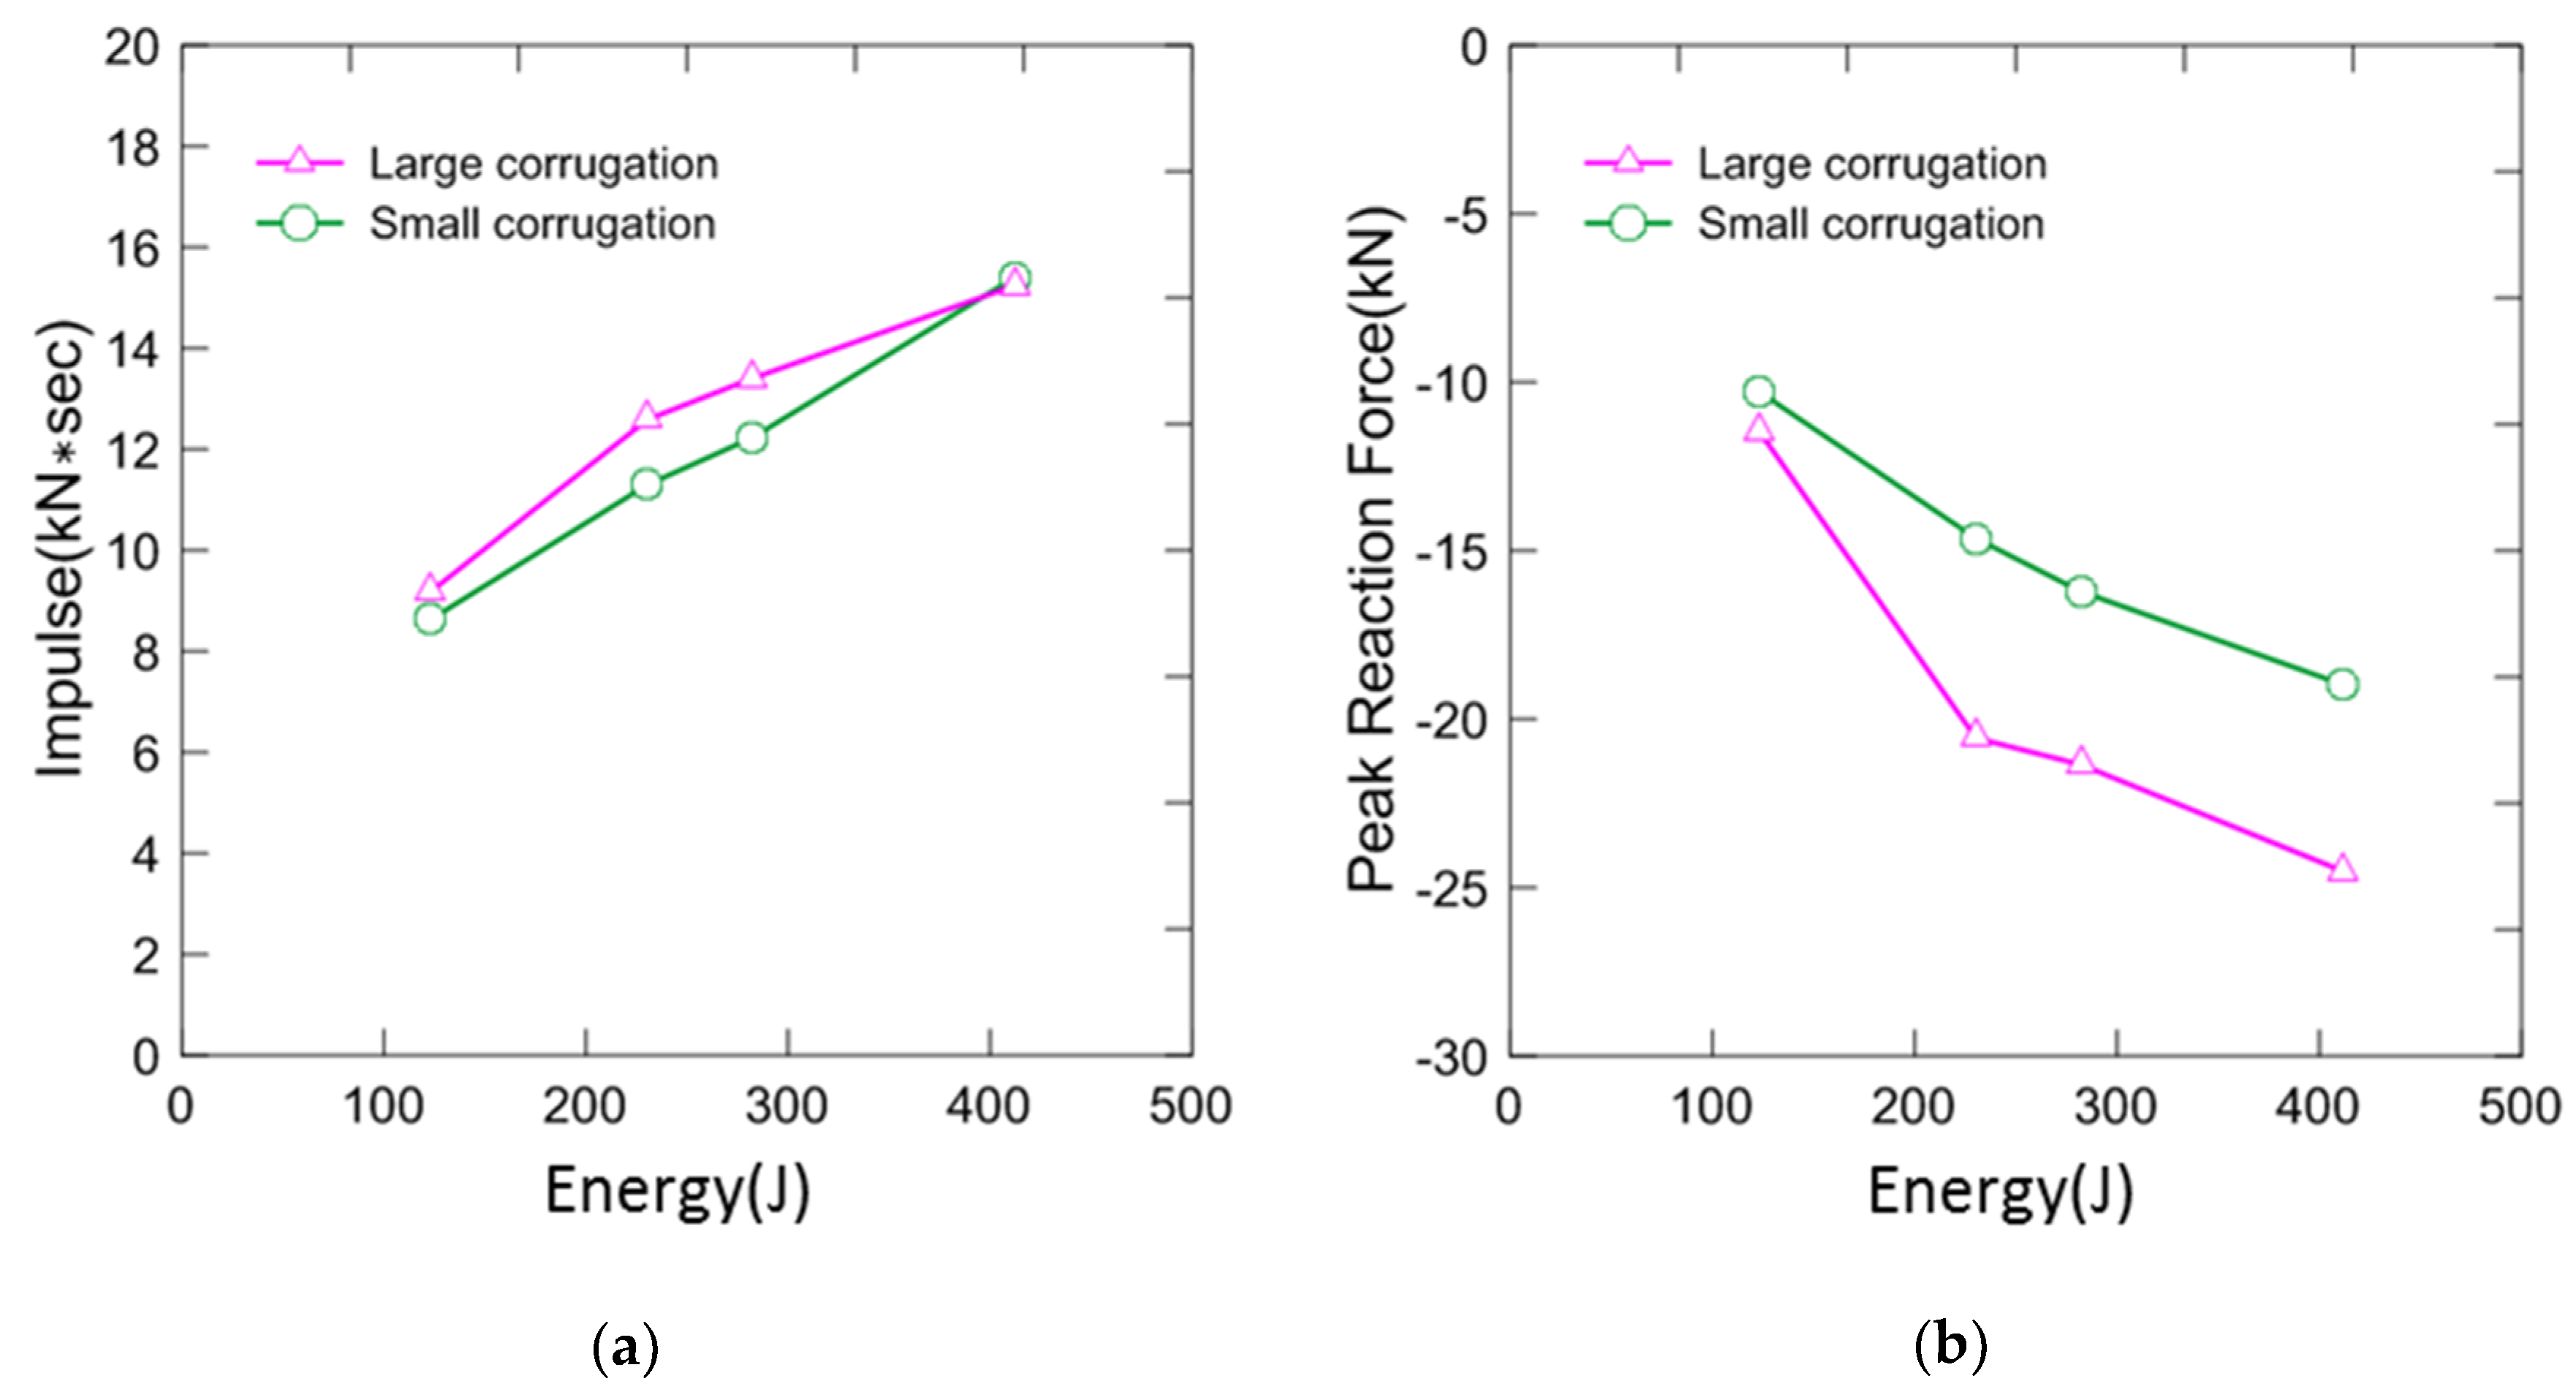
Figure 5 shows the increase in the impulse and maximum reaction force with increasing potential energy. As illustrated in Figure 5a, although the same drop object falls onto the specimens with the same impact energy, a somewhat larger impulse is measured for the large corrugation specimens than the small corrugation specimens. In addition, the impulse that is measured for both the specimen types is linearly proportional to the increase in the potential energy caused by the fall of the drop object. In fact, Figure 5b displays significant differences in the maximum reaction forces between the large and small corrugation specimens. The maximum reaction force is found to be larger for the large corrugation specimens than for the small corrugation specimens. The gap varies from 11.5% to 40.5%. Thus, the impulse measurements of both the specimens, represented by the integral of the reaction force–time history, are nearly similar, but the reduction in the duration has a decisive effect on the increase in the maximum reaction force.
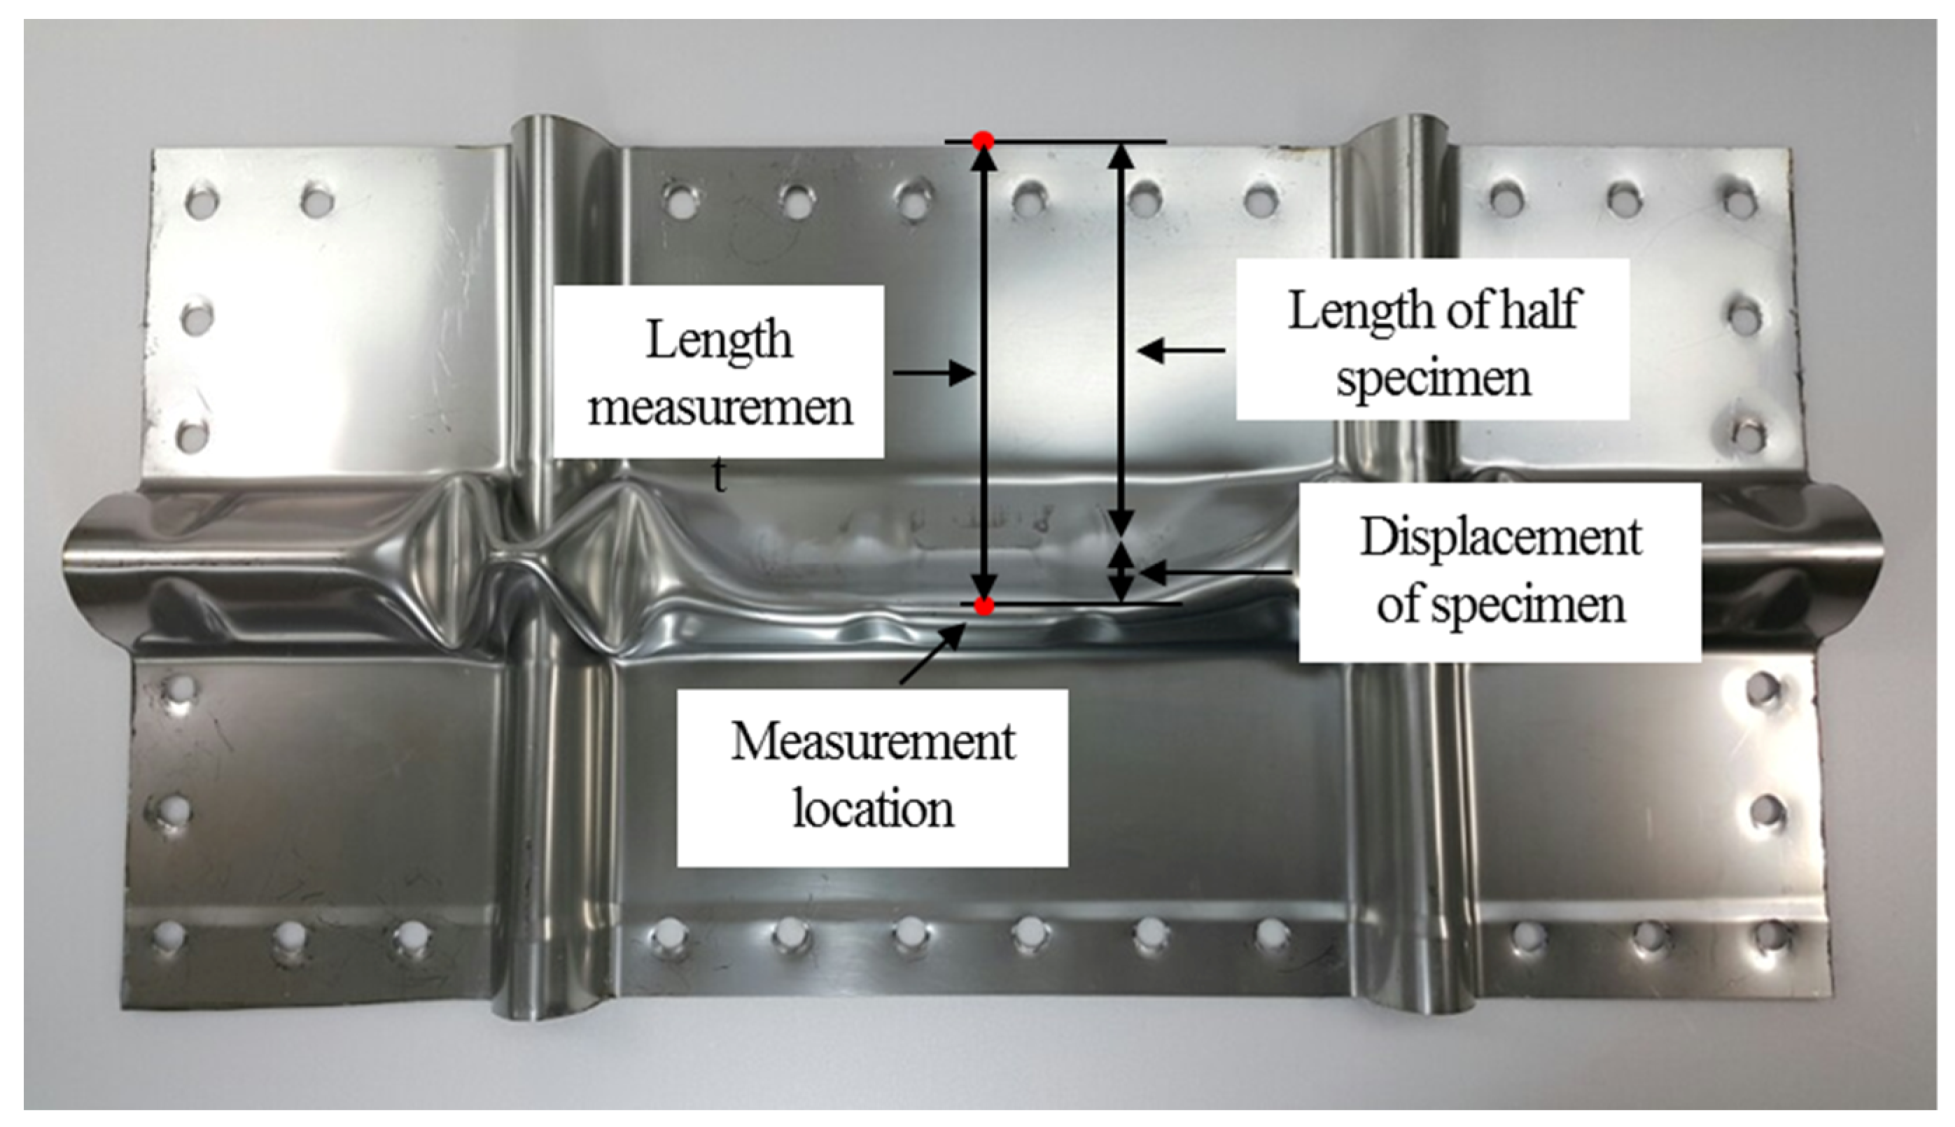
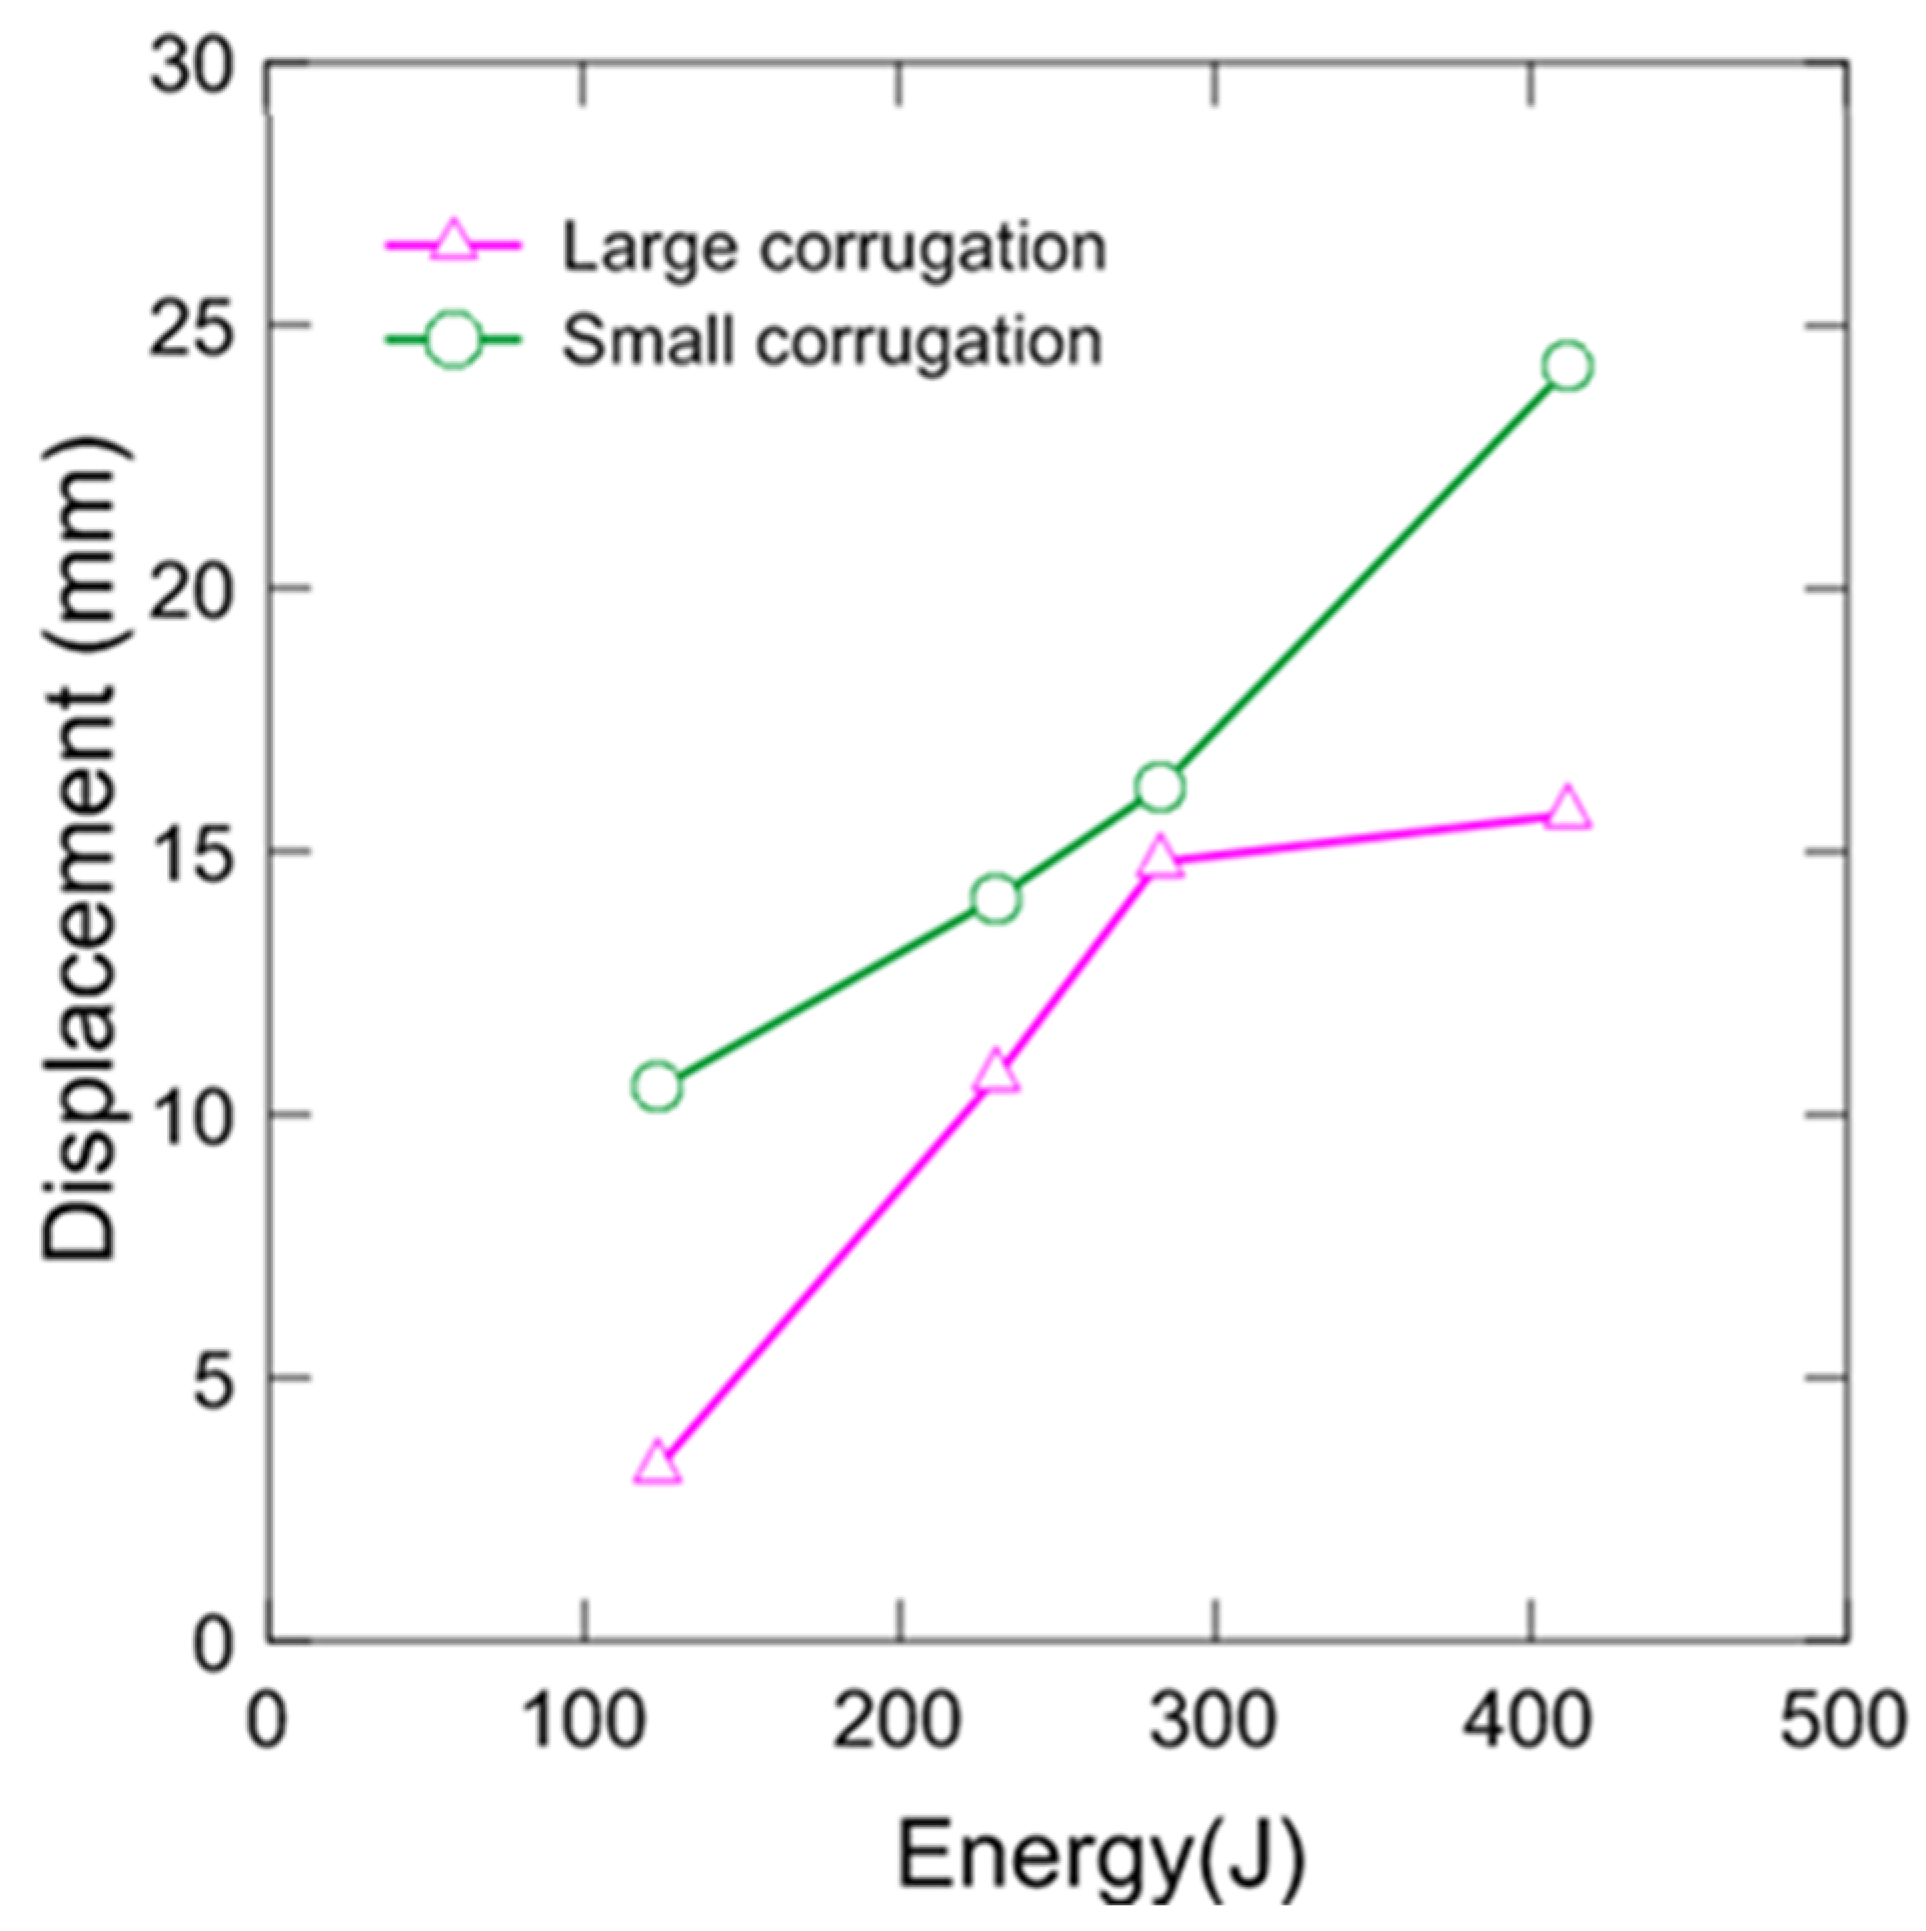
The effect of the impact energy of the impactor on the deformation of the primary barrier was investigated. Owing to the difficulty in measuring at a specific point, in the present study, the displacement of the upper and middle parts of a deformed corrugation was considered as representative. Figure 6 illustrates the method used to measure the displacements of the deformed specimens with large and small corrugations. Figure 7 presents the measured displacement between the large and small corrugations in accordance with the potential energy.
Analysis of the displacement at the first impact as in accordance with the impact energy shows that a small corrugation is more deformed than a large corrugation; this is understood in terms of the displacement of the upper and middle parts of the corrugation. Small corrugations have a less complex structure and smaller impact-affected area than the large corrugations that have four ribs to reinforce the buckling strength. Therefore, a specimen with a large corrugation exhibits more impact resistance under the same impact load. Moreover, the displacements of the small corrugation specimens linearly increase over the entire impact energy, but the displacement of the specimens from L123 to L282, except L412, linearly increase. Under the impacts, small corrugations exhibit the characteristics of a localized plastic deformation only for the impacted area rather than the globalized plastic deformation. For a large corrugation to be deformed, it is necessary for the broad area to be deformed; thus, the increase in the displacement of a large corrugation slows down.

3.2. Effect of the Number of Impacts

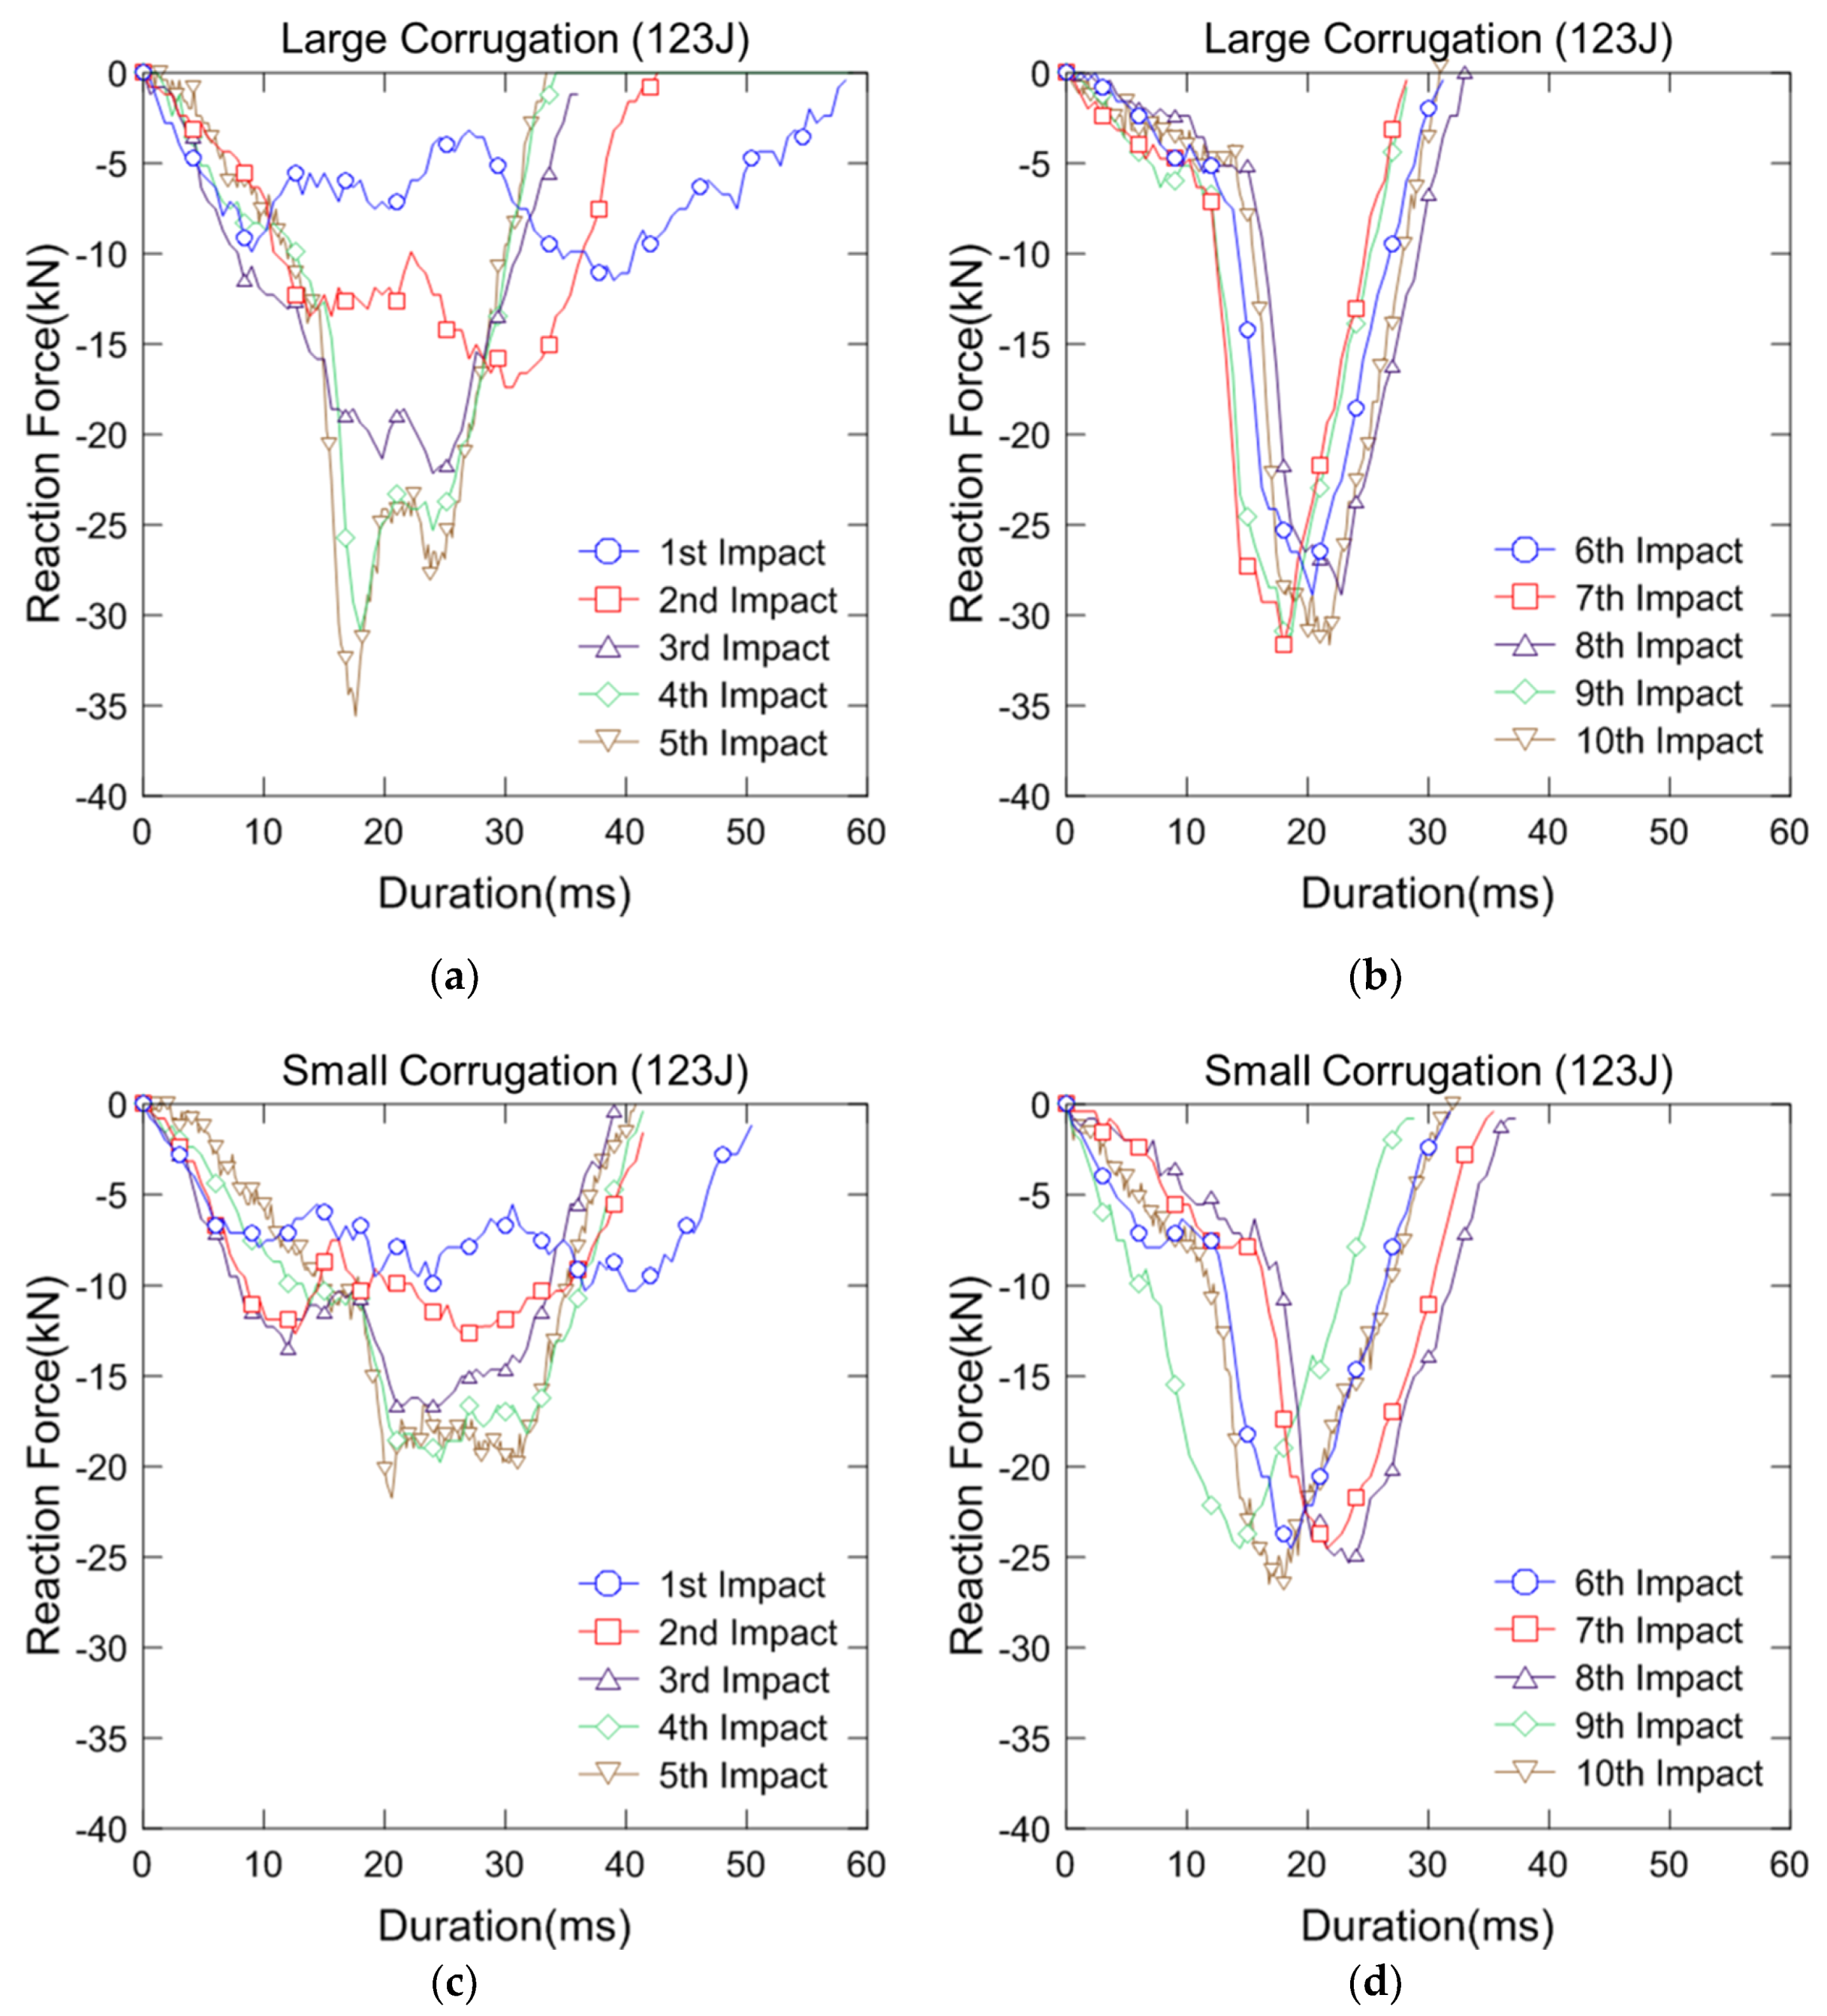
The effect of repeated impacts on the primary barrier was investigated by applying up to ten impacts on each specimen. The reaction force was measured each time, and the deformed shape of the primary barrier was evaluated at the first, fifth, and tenth impacts. Figure 8 displays the reaction force profiles of the large and small corrugation specimen in the 123 scenario. As the drop object falls freely, the impactor hits the specimen and an impact load is transferred to the specimen that is measured by the load sensor located at the bottom of the impact test jig. The reaction force exhibits a negative profile because the impactor acts in the downward vertical direction.
In the reaction force–time history of the first impact, the longest duration and lowest peak reaction force are observed. A long duration suggests that the contact time between the impactor and corrugation was long. As shown in the deformed configuration of the above specimens, the middle part of the convex corrugation is deformed inward under the first impact. When the impact is repeated five times, the duration decreases and peak reaction force increases. In the case of a large corrugation, after the sixth impact, the peak reaction force decreases once and then converges to a particular value, which may be affected by the release process of the primary barrier from the impact test jig to capture photographs of the deformed specimens. In addition, the release process also affects the characteristic of the reaction force profile. Similar reaction force profiles are observed from the fourth to fifth impact on both the large and small corrugation specimens. After the release process, however, the shape of the reaction force profile from the fifth to tenth impact is different from the profile from the fourth to fifth impact.
In the case of a small corrugation specimen, a slight increase in the reaction force is observed. This is a different result from that of a large corrugation specimen for which the reaction force did not show any further increase. It appears that the contrasting tendencies of the peak reaction forces of the large corrugation and small corrugation specimens result from the differences in the structural complexity. A large corrugation has reinforcing ribs to increase the buckling strength and connect with the butterfly wing shape part of the knot so that under repeated impacts a large corrugation becomes increasingly less deformed. An extensively deformed large corrugation undergoes strain hardening, leading to a dominant elastic behavior. However, in the case of small corrugation specimens, only the smallest corrugations gradually deform. This can be explained as a pseudo-shakedown phenomenon. The extent of permanent deformation of the steel-plate structure exhibiting plastic behavior under repeated impact loads of the same amount decreases, and the elastic behavior of the structure becomes dominant. This is because the amount of elastic strain energy absorbed by the structure increases as the structure exhibits a plastic behavior [27,28,29]. Thus, the additional permanent deformation decreases, and the peak reaction force continues to increase as the duration of the reaction force–time history decreases owing to the impulse conservation. Such results were also obtained in previous research studies [29,30].
Figure 9 illustrates the deformation configuration of the specimens with large and small corrugations under the first, fifth, and tenth impacts of L123 and S123 scenarios. As shown in Figure 9, the large corrugation specimen with an outward concave shape is deformed into an inner recess under the first impact. A small amount of displacement is measured for the middle and upper parts of the large corrugation. As the number of impacts increases from five to ten, the radius of curvature decreases in the middle part of the large corrugation, with the corrugation deforming internally. After the fifth impact, the distortion of the butterfly wing shape at the knot part is clearly visible. As the number of impacts further increases, the butterfly wing shape becomes more distorted. Owing to the difficulty in measurement, any displacement of the knot part is not evaluated. The deformation of a large corrugation under the repeated impact in the lateral direction, however, can affect the deformation of the knot part; therefore, it is necessary to investigate the relationship between the two effects.
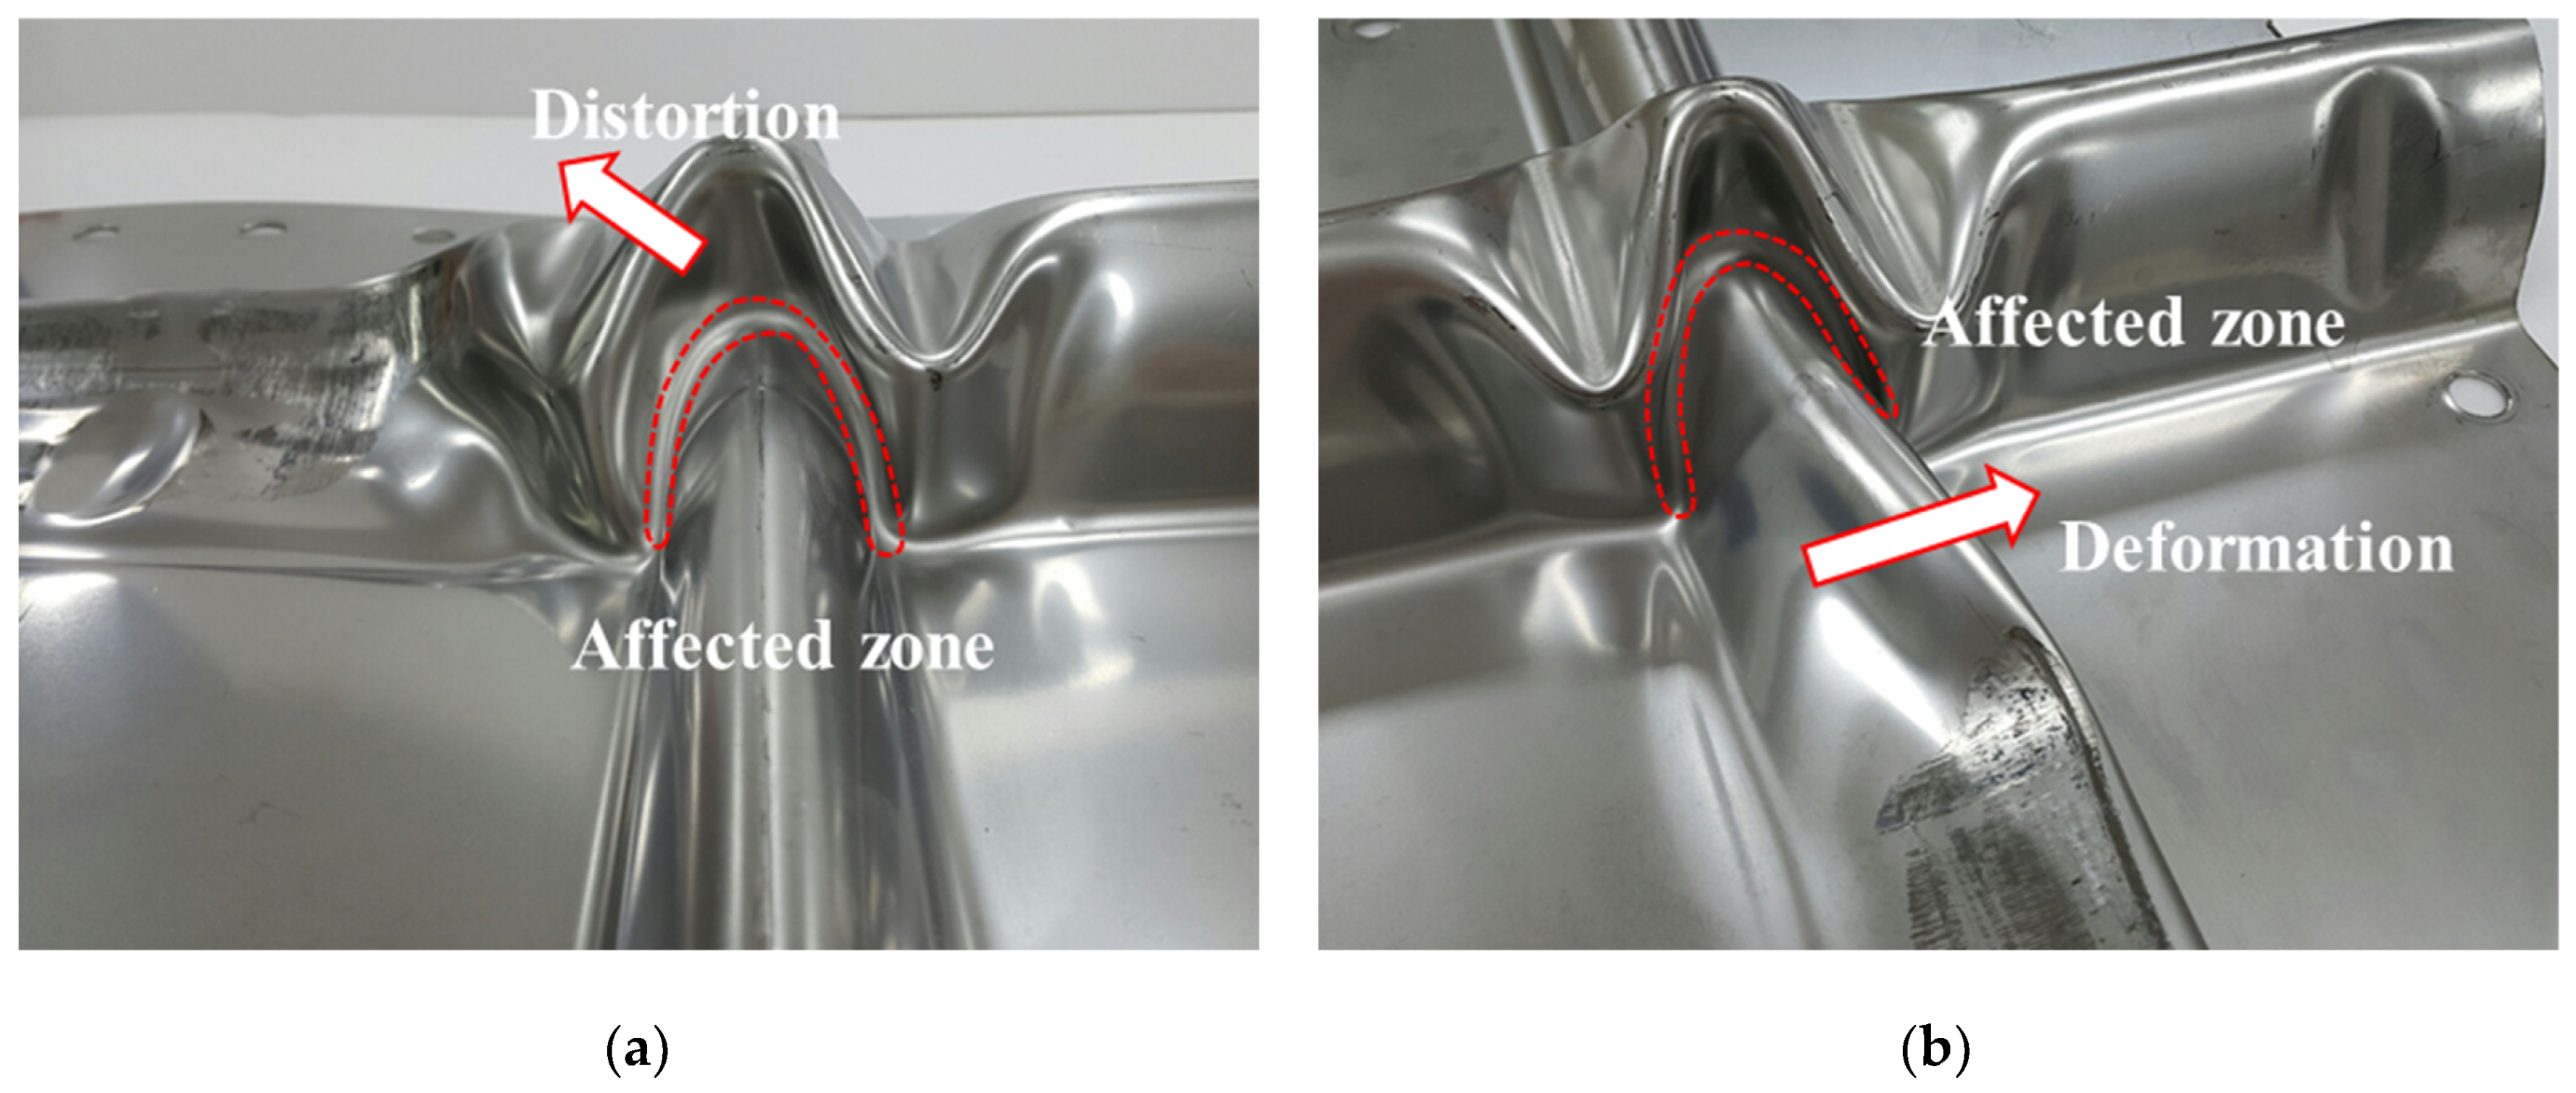
Although the deformation of a large corrugation is accompanied by a distortion of the knot part, the deformation of a small corrugation did not distort the butterfly wing shape of the knot. However, as a small corrugation is deformed with repeated impacts, the affected zone caused by the deformation of the small corrugation is identical to the affected zone caused by the distorted butterfly wing shape of the knot of a large corrugation, which is illustrated in Figure 10.
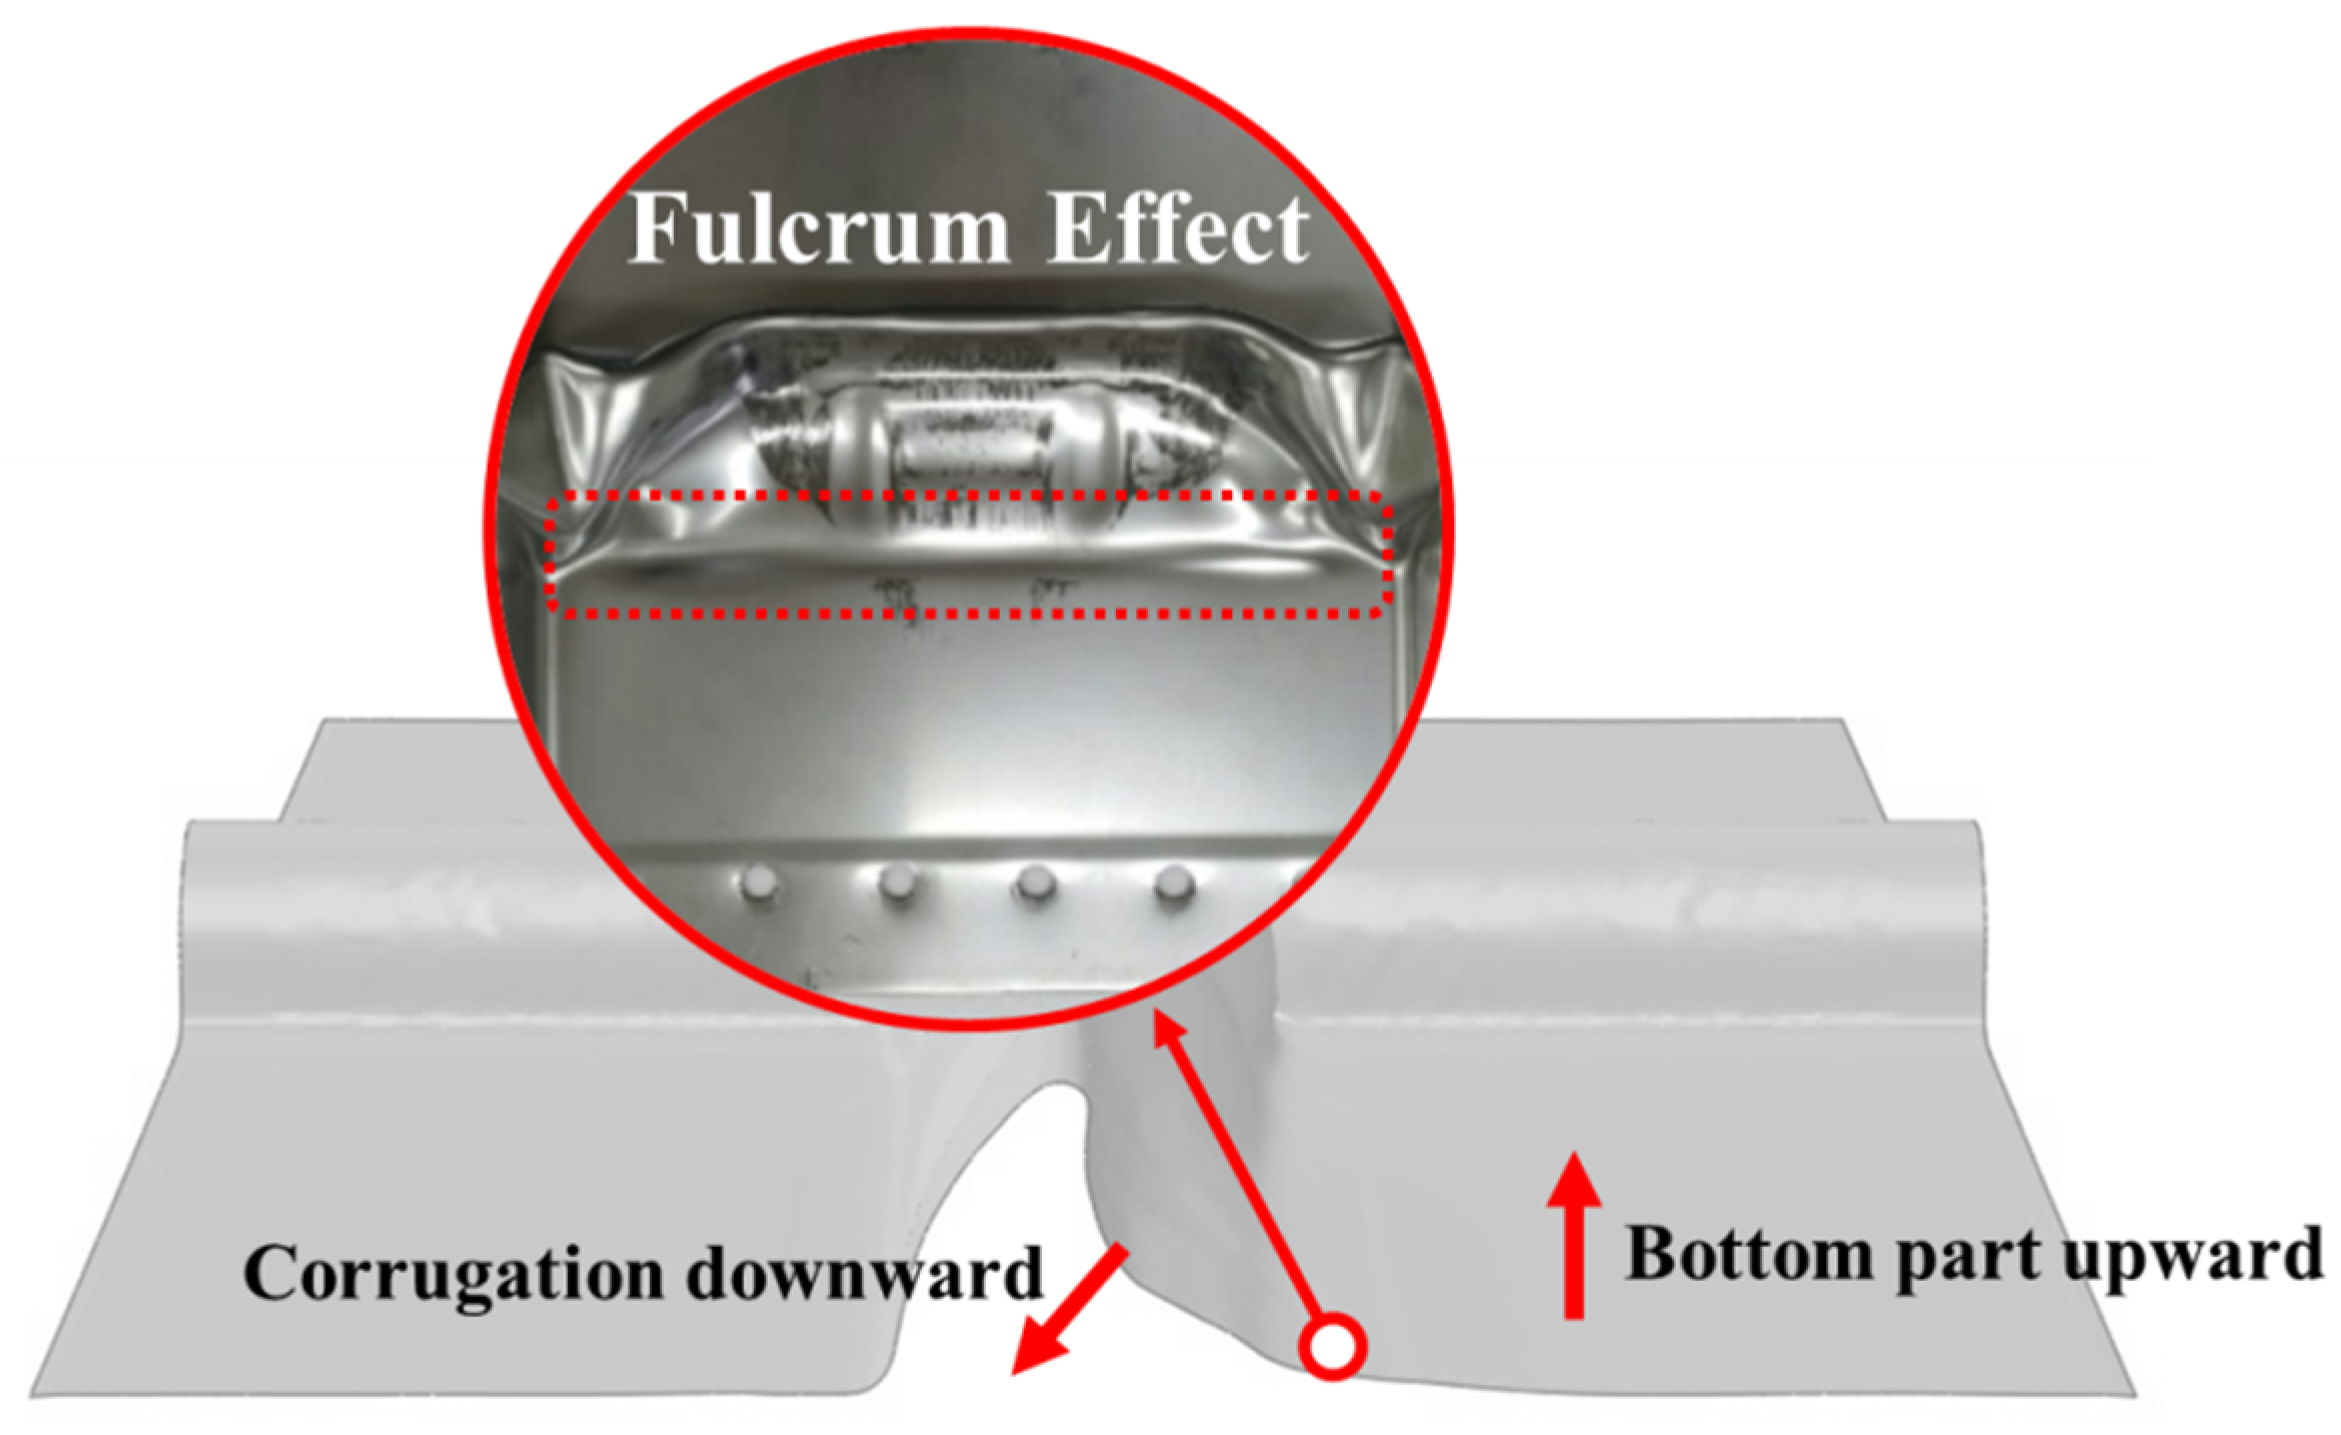
As an impact is repeatedly applied to the large and small corrugation specimens, the hinge-shaped part connecting the large corrugation part and bottom sheet acts as a fulcrum and can generate leverage. Therefore, it is expected that the deformation of a large corrugation will affect the bottom part of the primary barrier, as shown in Figure 11. However, in the present study, no deformation is observed at the erection plate under the primary barrier, owing to the thickness of the steel plate.
This phenomenon is noticeably observed in the case of specimens with large and small corrugations that have been flattened by impact. Though a corrugation lies horizontally, the lifted shape of the upper part of the bottom sheet in the primary barrier clearly shows that the hinge-shaped part plays the role of a fulcrum connecting the large corrugation and bottom sheet. The vertical displacement of the bottom sheet is not measured owing to its complexity.
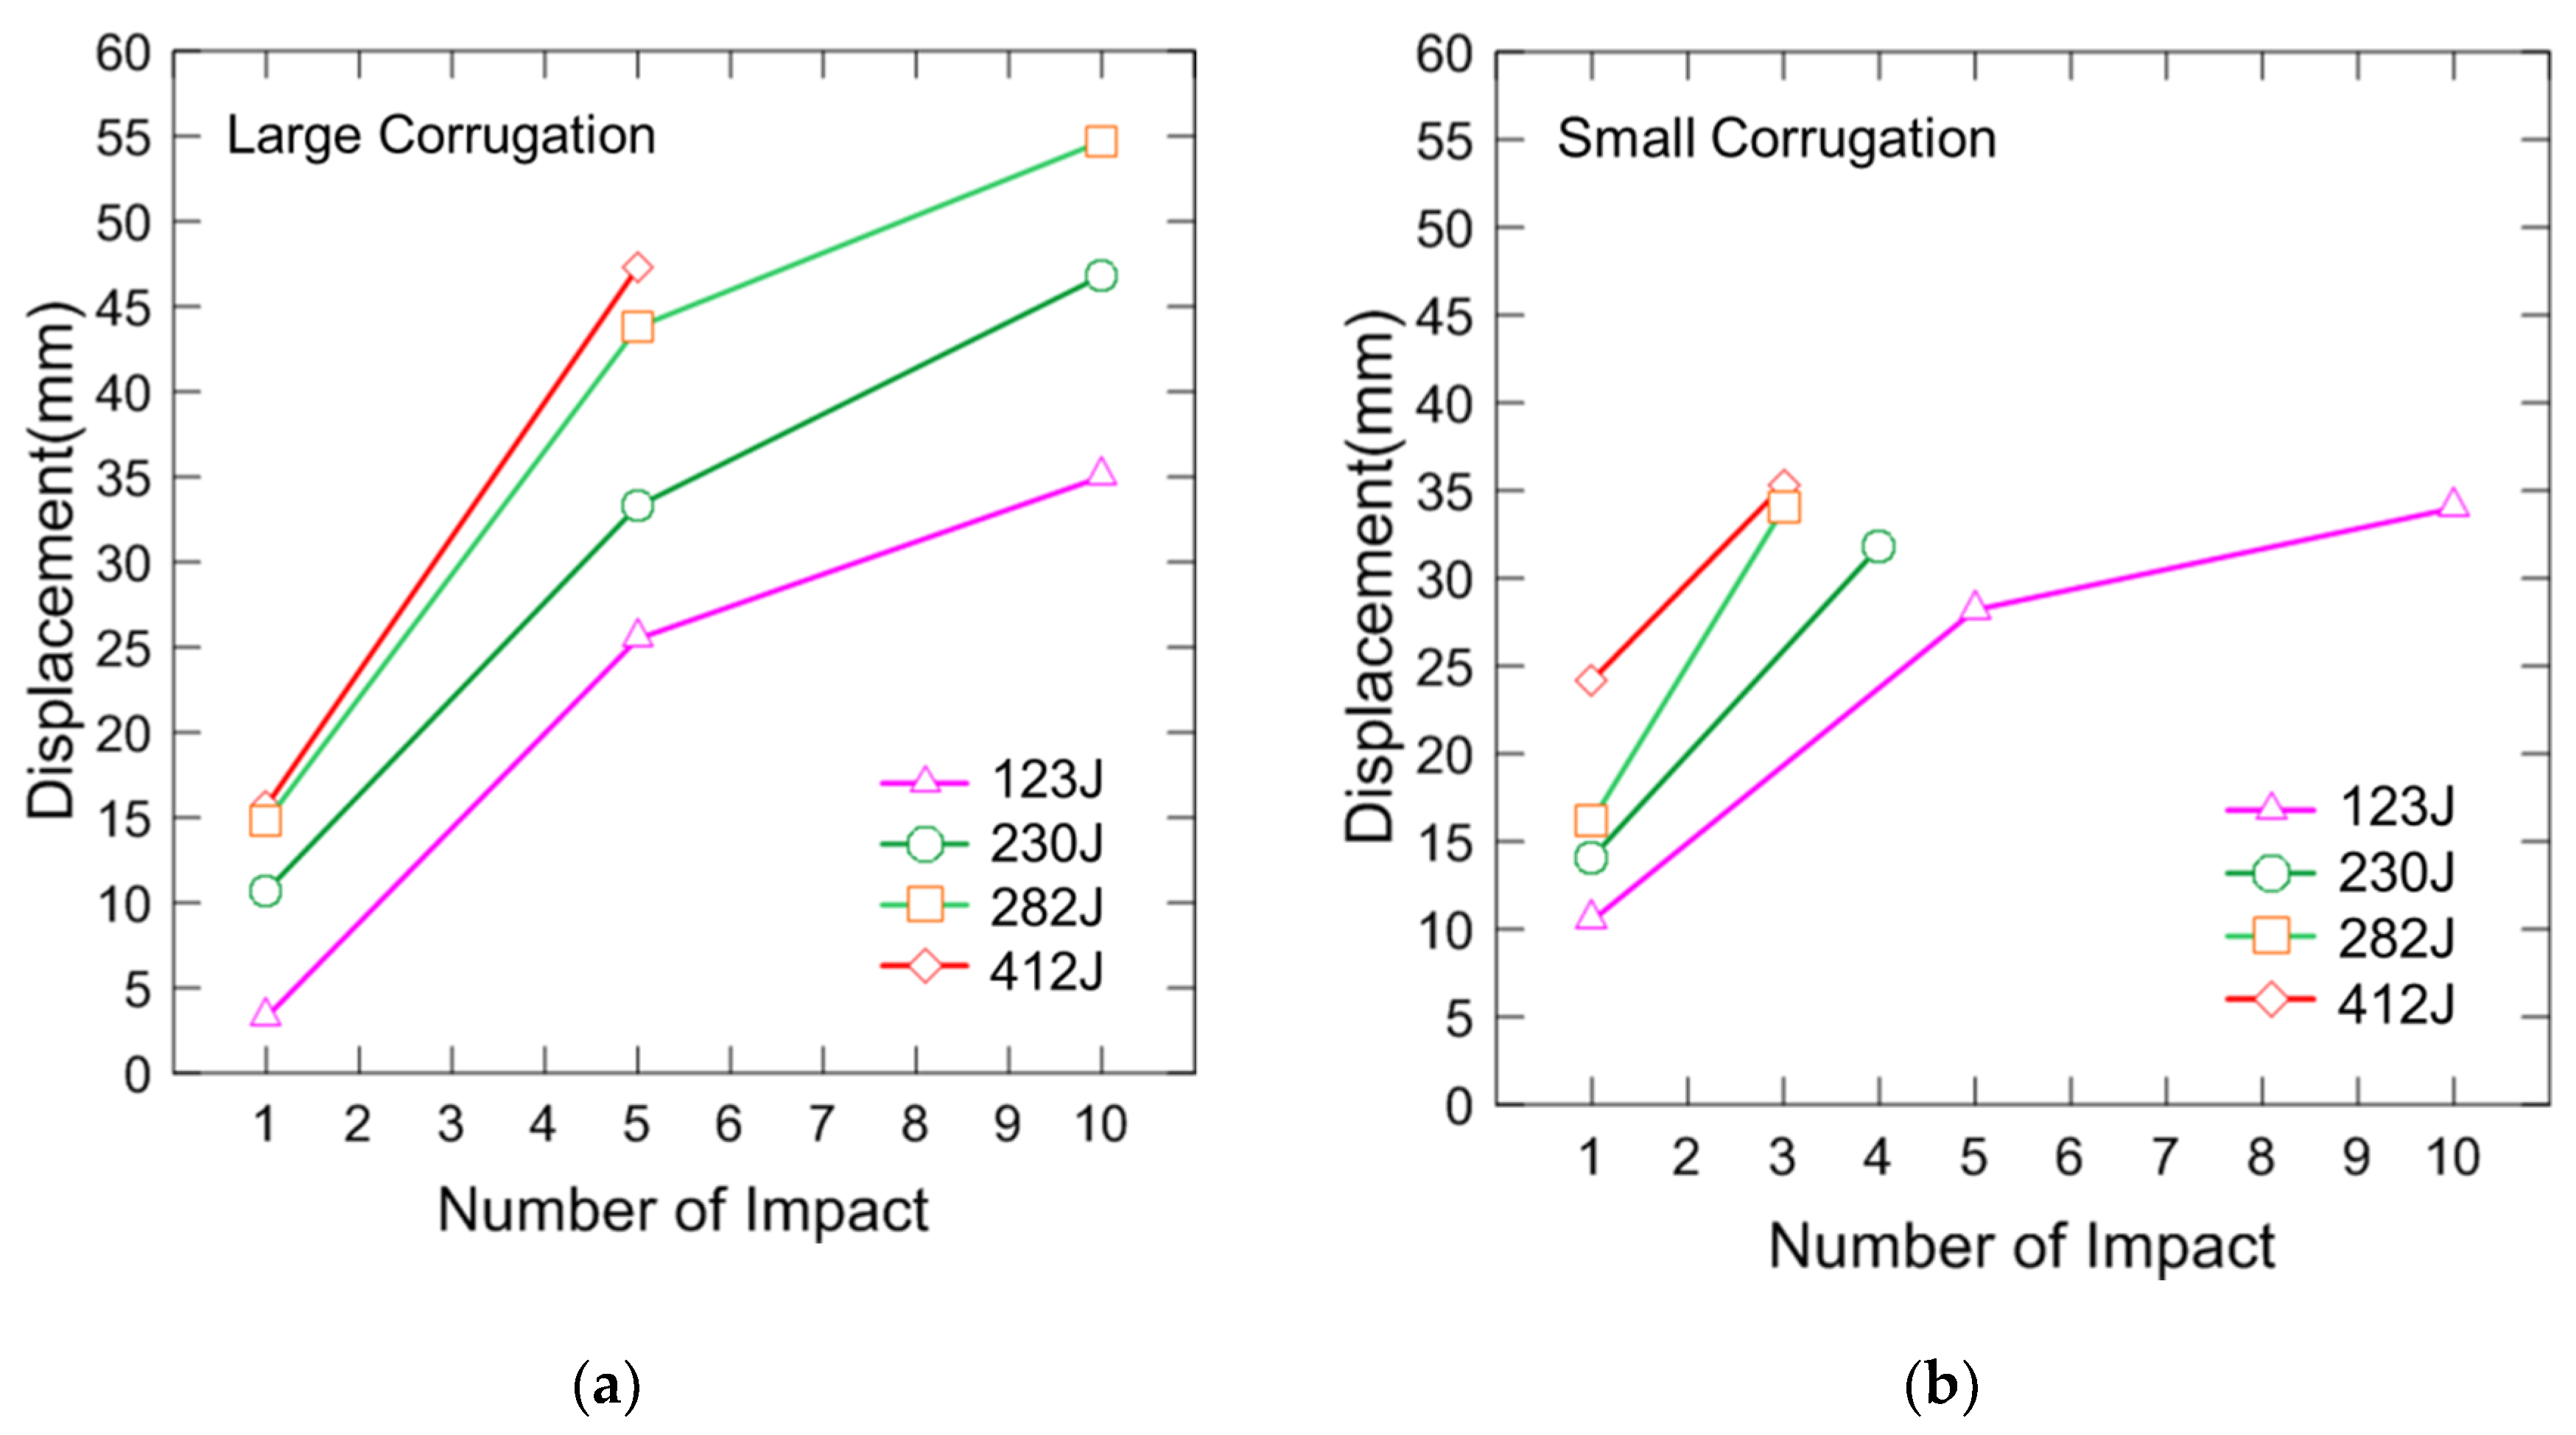
Figure 12a,b display the displacements of the large and small corrugation specimens in terms of the number of impacts. In Figure 12a, the effect of the number of impacts on the displacement of the large corrugations is evaluated. The displacements of the small corrugations under the repeated impacts between 3 to 10 times are analyzed as shown in Figure 12b. In the S230, S282, and S412 scenarios, the additional impact tests terminate at the fourth, third, and third impacts, respectively, owing to the decrease in the impact-effective area. The repeated impacts are applied up to ten times in the L123 and S123 scenarios. In the case of a large corrugation specimen, the displacement increment from the first to the fifth impact is more than from the sixth to the tenth for all the scenarios. Thus, the corrugation becomes less deformed under repeated impacts. According to previous research on the effects of a repeated impact [27] when the same amount of impact is repeatedly applied, the amount of deformation decreases.
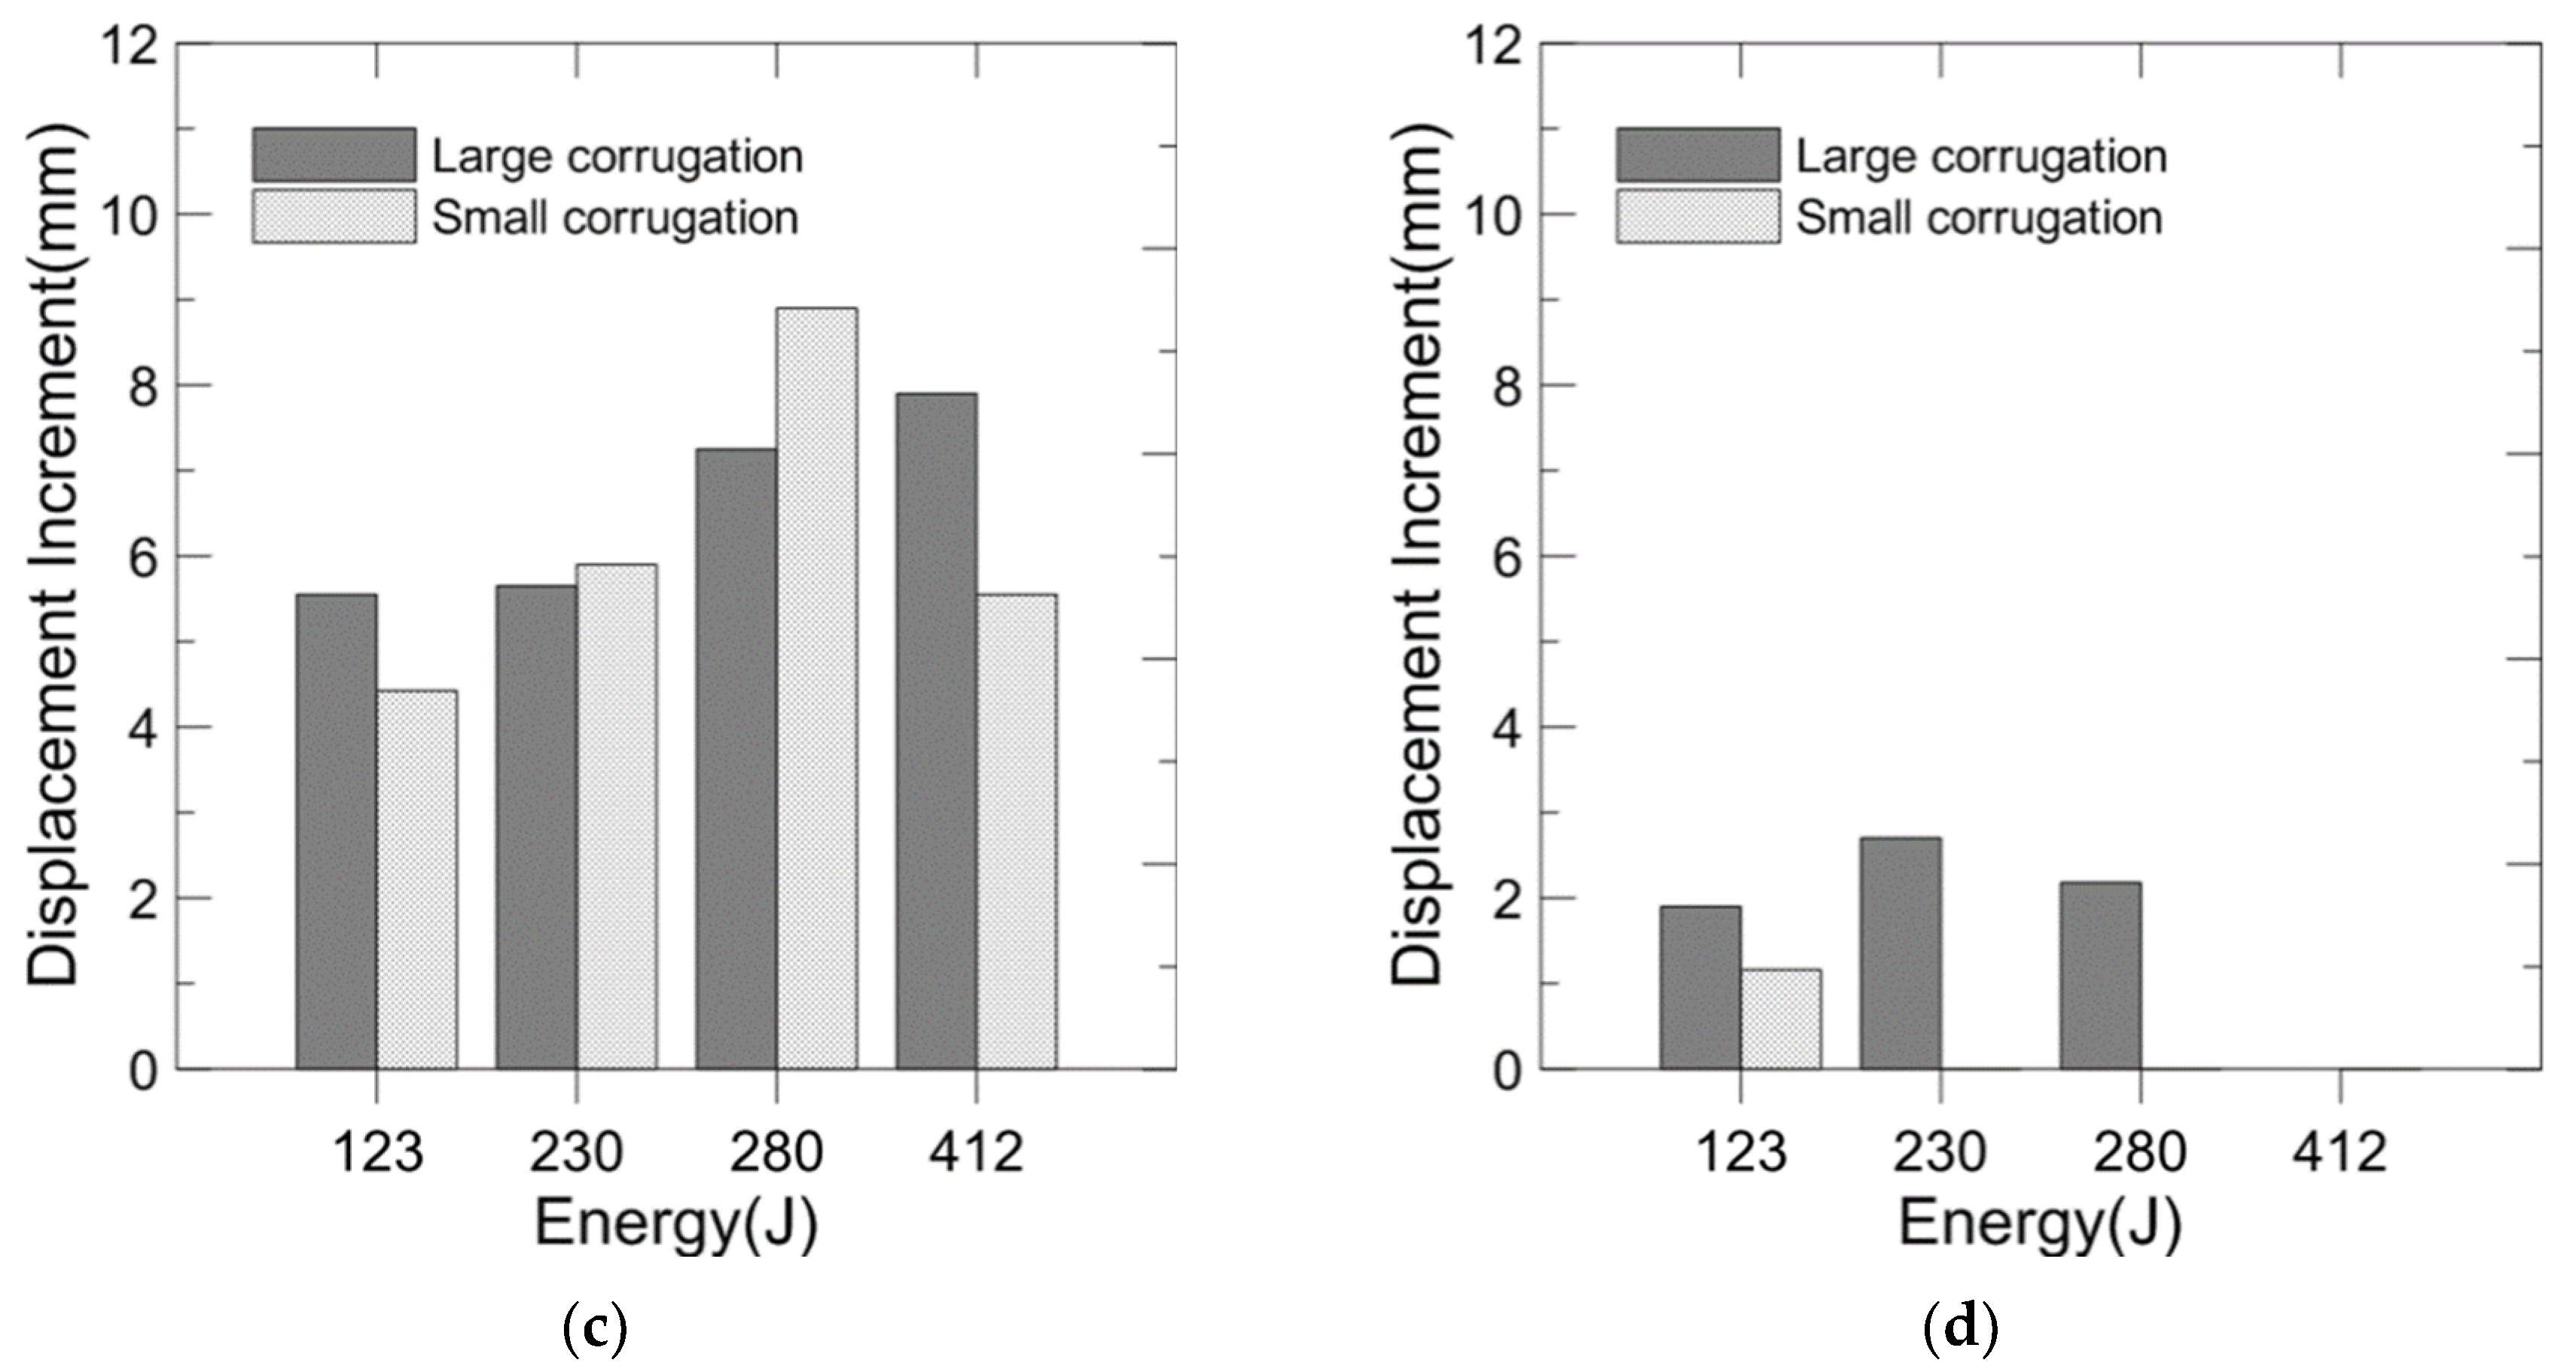
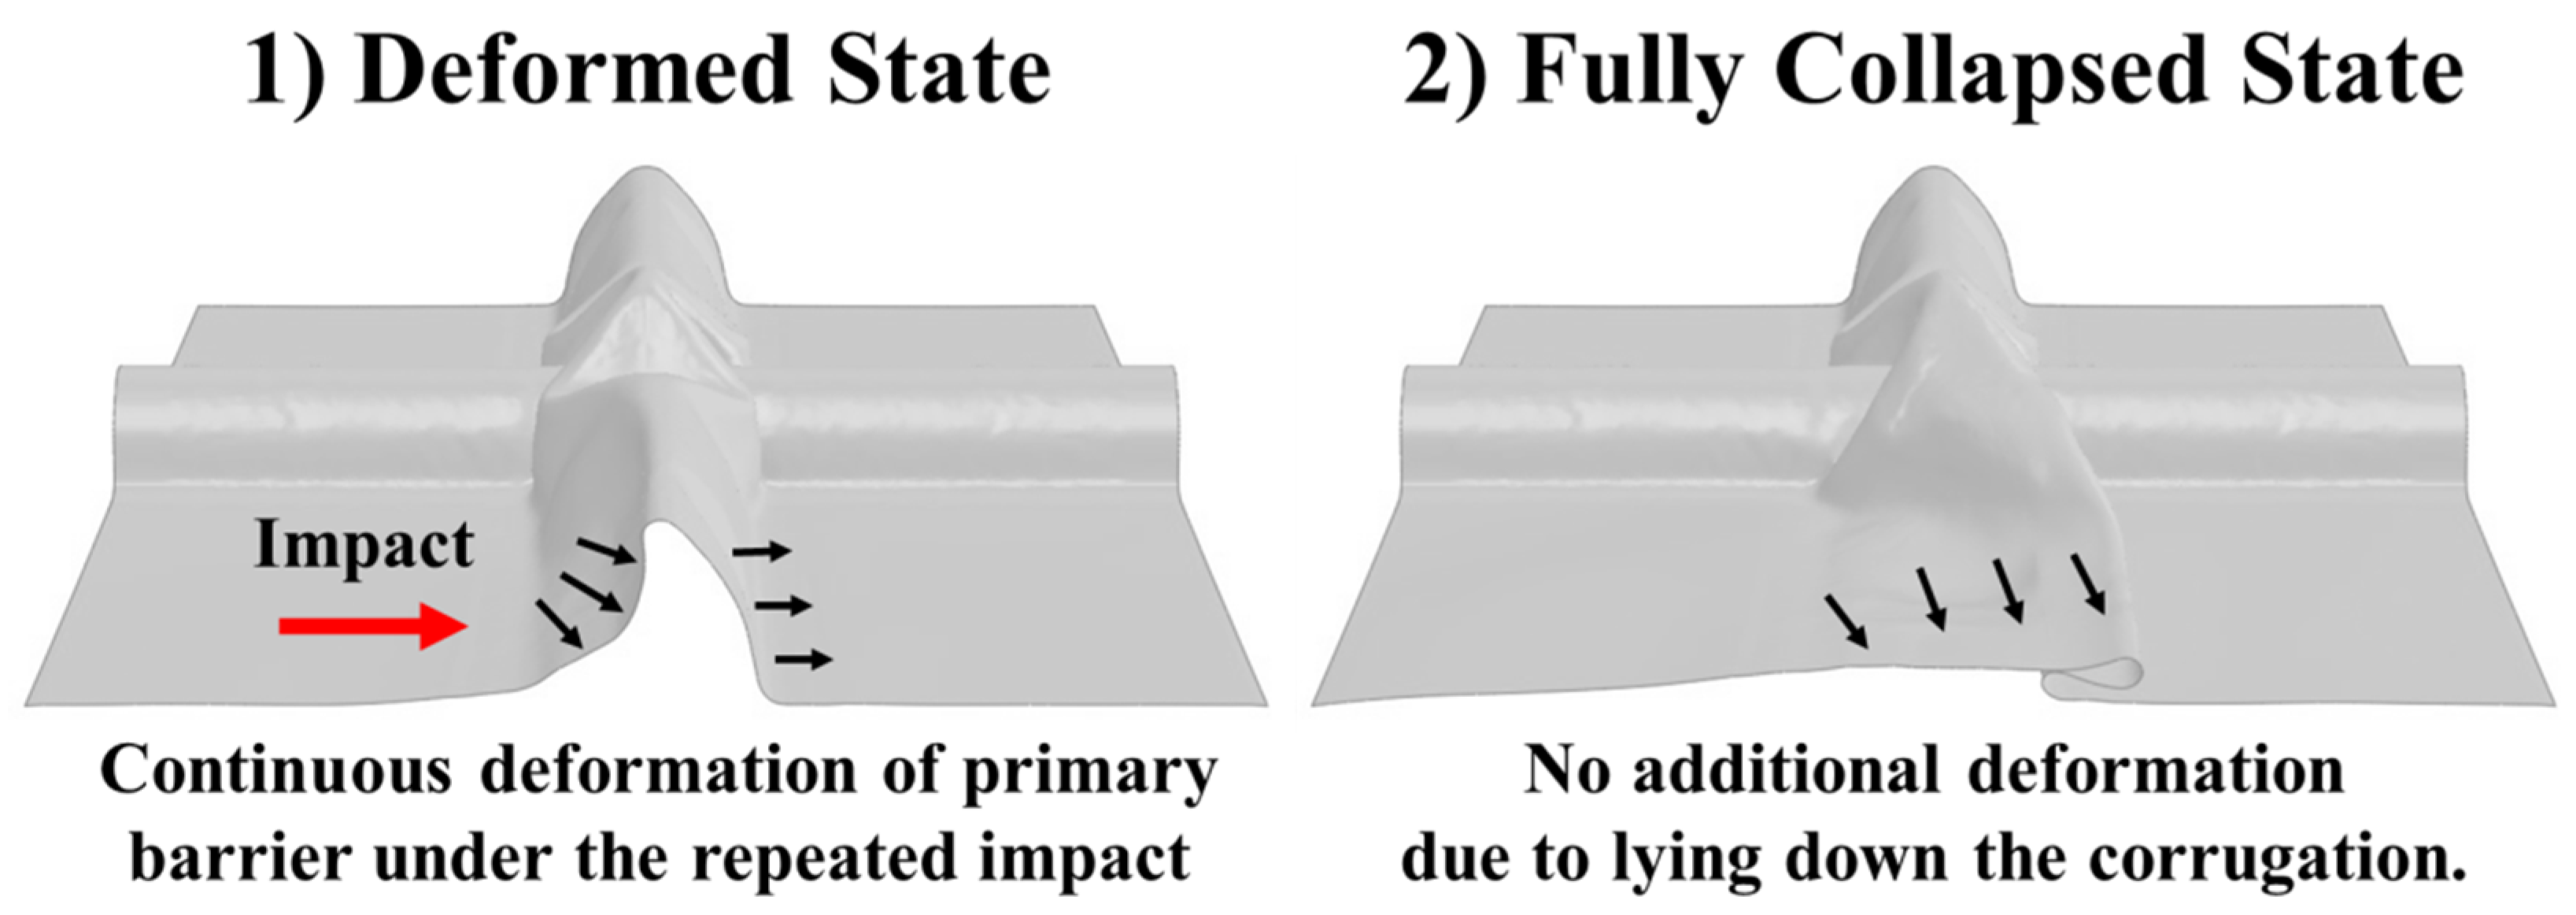
Figure 12c,d represent the displacement increment per number of impacts according to the scenario for the large and small corrugation specimens. In the case of a large corrugation specimen, from the first to fifth impact, the displacement increment continuously increases as in accordance with the impact energy. From the sixth to tenth impact, however, the displacement increment of the L230 scenario is more than that of the L282 scenario. This is because a large corrugation specimen of L282 is fully collapsed under the repeated sixth to tenth impacts in the lateral direction. The collapse phase of the corrugation is illustrated in Figure 13. The corrugation generally experiences two phases of collapse during repeated lateral impacts. In the deformed state, the displacement increment of the corrugation consistently increases under the repeated impacts. In the fully collapsed stage, the corrugation completely lies down on the bottom, and no additional increment in the displacement is observed under the lateral impacts.
In the case of the smallest corrugation specimens, as the impact energy increases, the displacement increment also increases. However, the displacement increment of a small corrugation in the S412 scenario suddenly decreases. The displacement increment per number of impacts in the S123 scenario from the sixth to tenth impact is less than from the first to fifth impact because of the collapse phase of the corrugation under the lateral impact. A small corrugation specimen in the S282 and S412 scenarios is completely collapsed under the third impact, whereas a small corrugation in the S123 scenario collapses under the tenth impact, so that a slight displacement increment from the sixth to tenth impact is observed.

3.3. Application to Failure Analysis of Insulation Panel

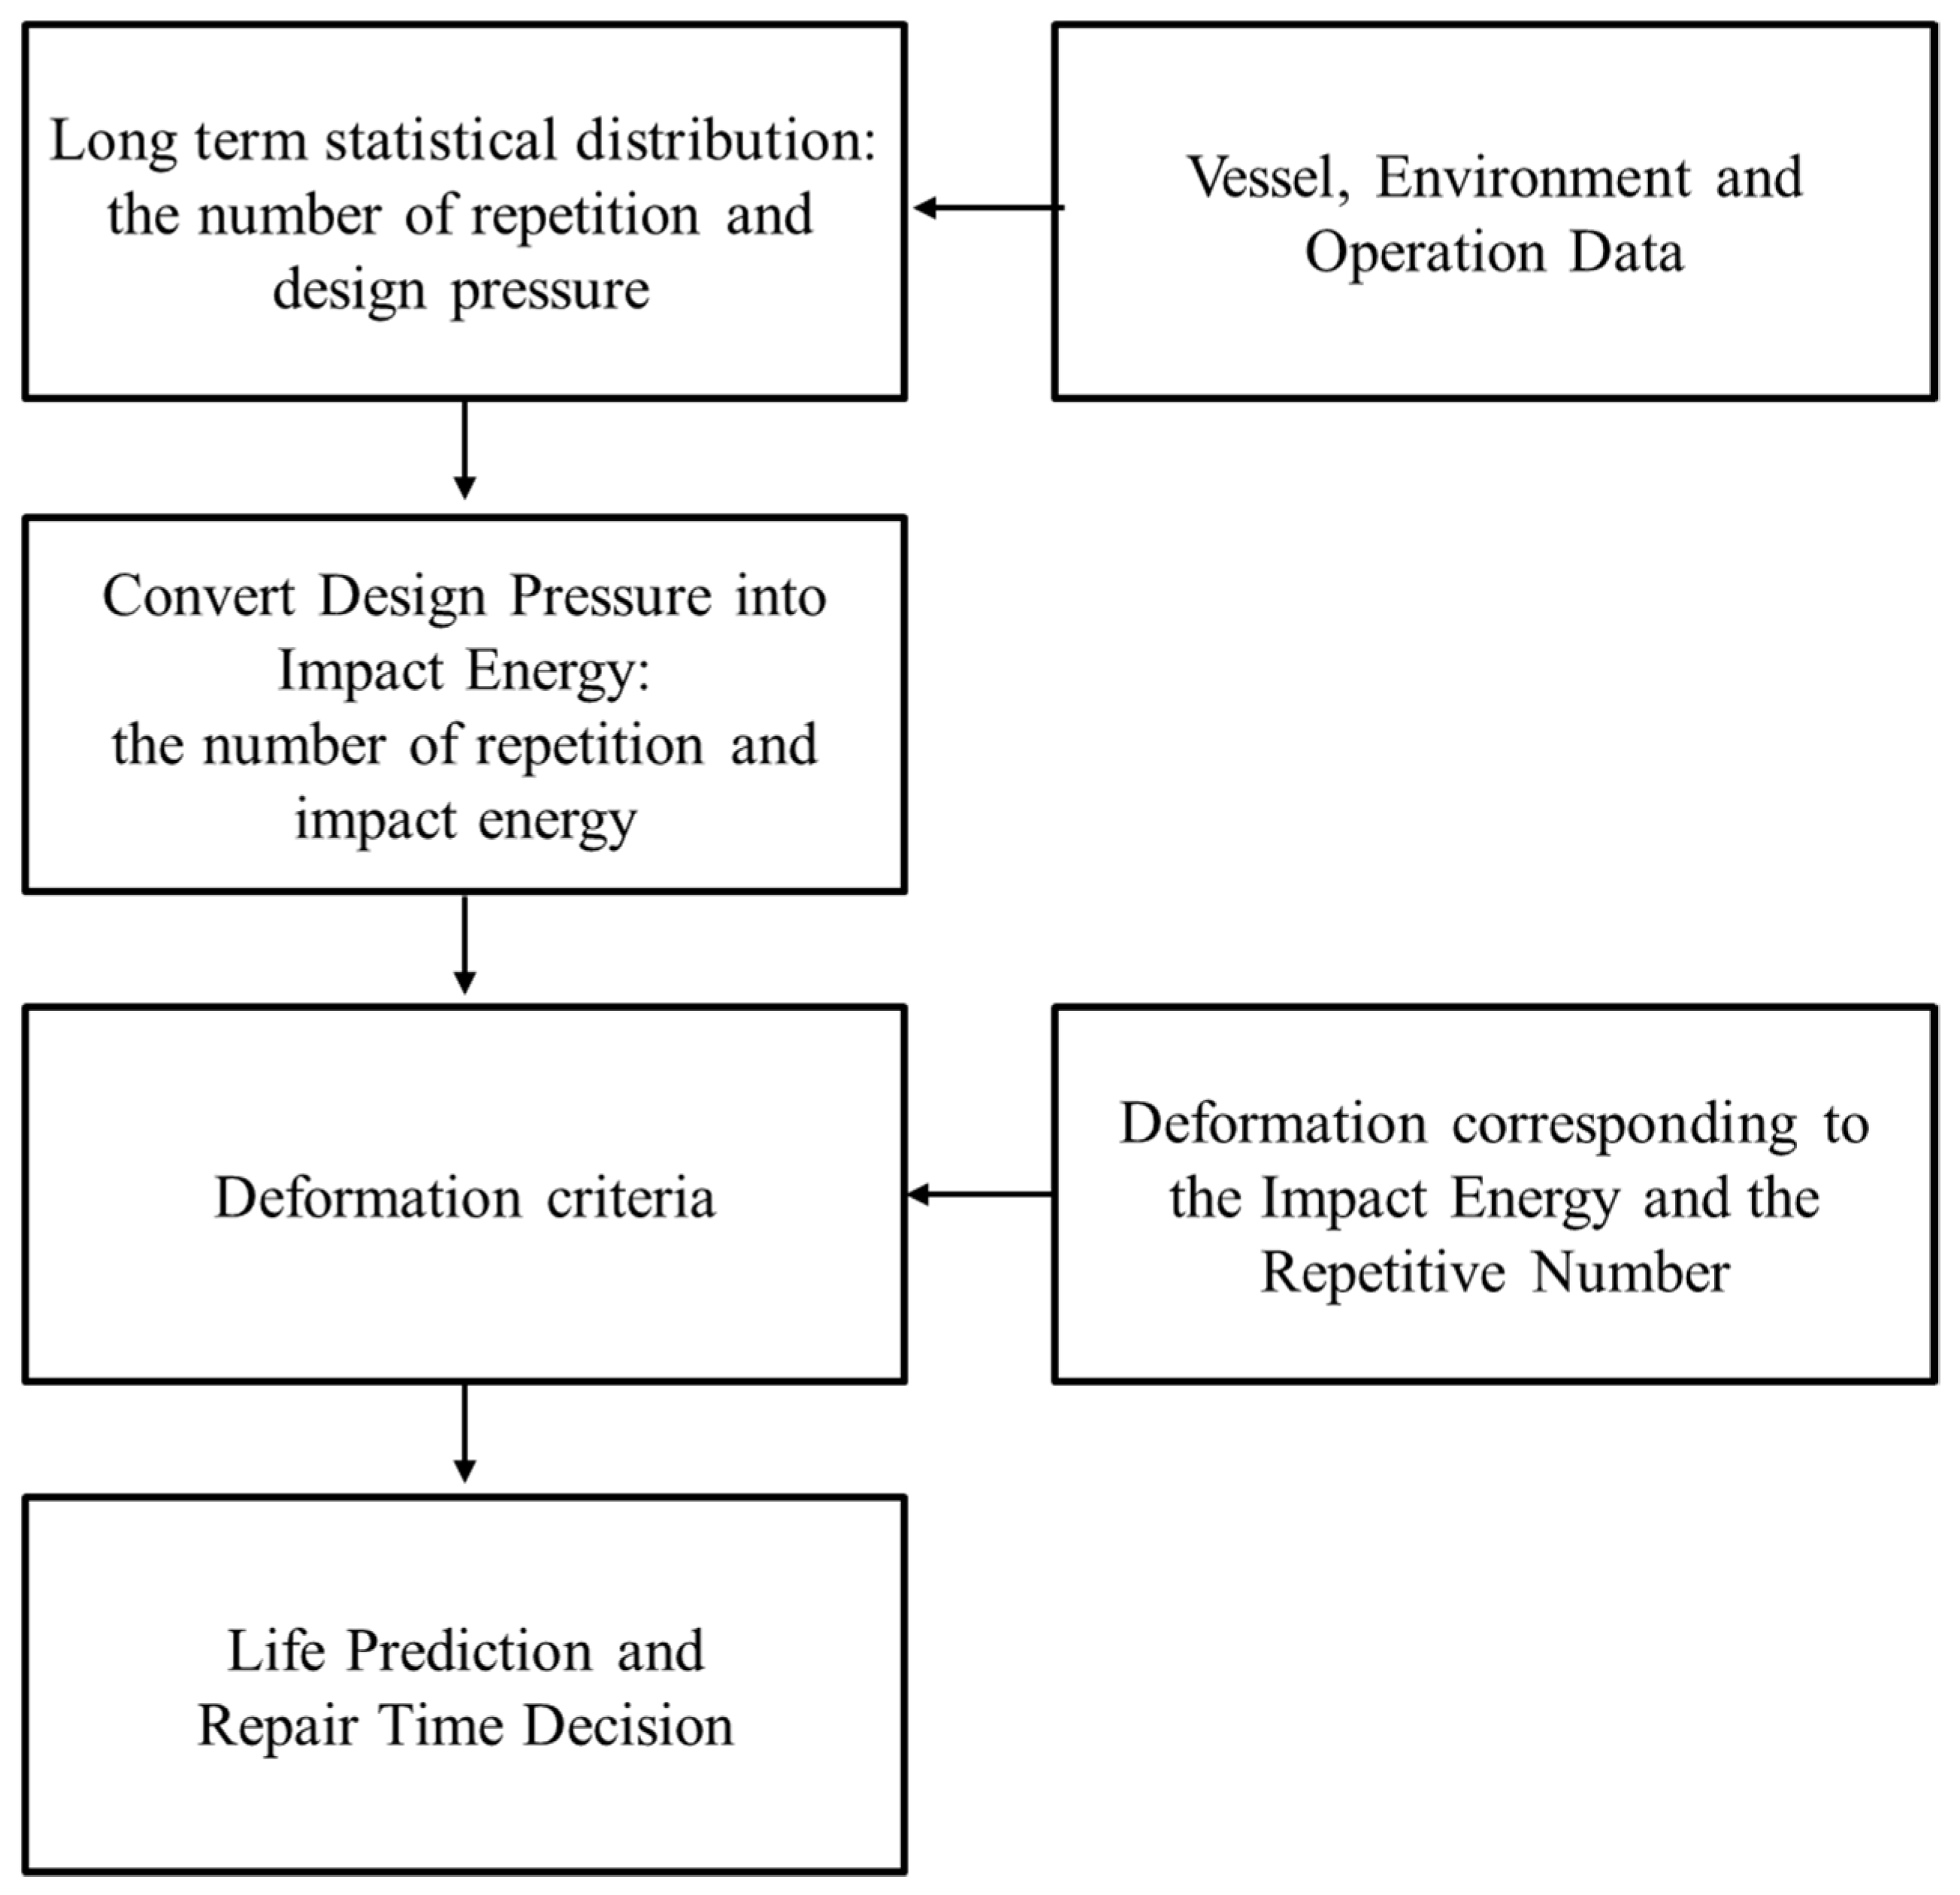
According to the DNV GL classification notes 30.9 [1], the amount of deformation of the corrugation in primary barrier is limited in accordance with the failure mode of the corrugation. In this study, the behavior of the primary barrier, especially corrugation, was obtained in accordance with the impact condition. Thus, it is possible to predict the lifetime of the primary barrier under the repeated impact loading by determining how many times the impact energy corresponding to the design pressure must be applied before reaching the deformation criteria. After selecting the representative pressure time history according to the vessel’s operation condition, the pressure time history can be converted into impact energy with the definition of the loading area and load velocity as illustrated in Figure 14.
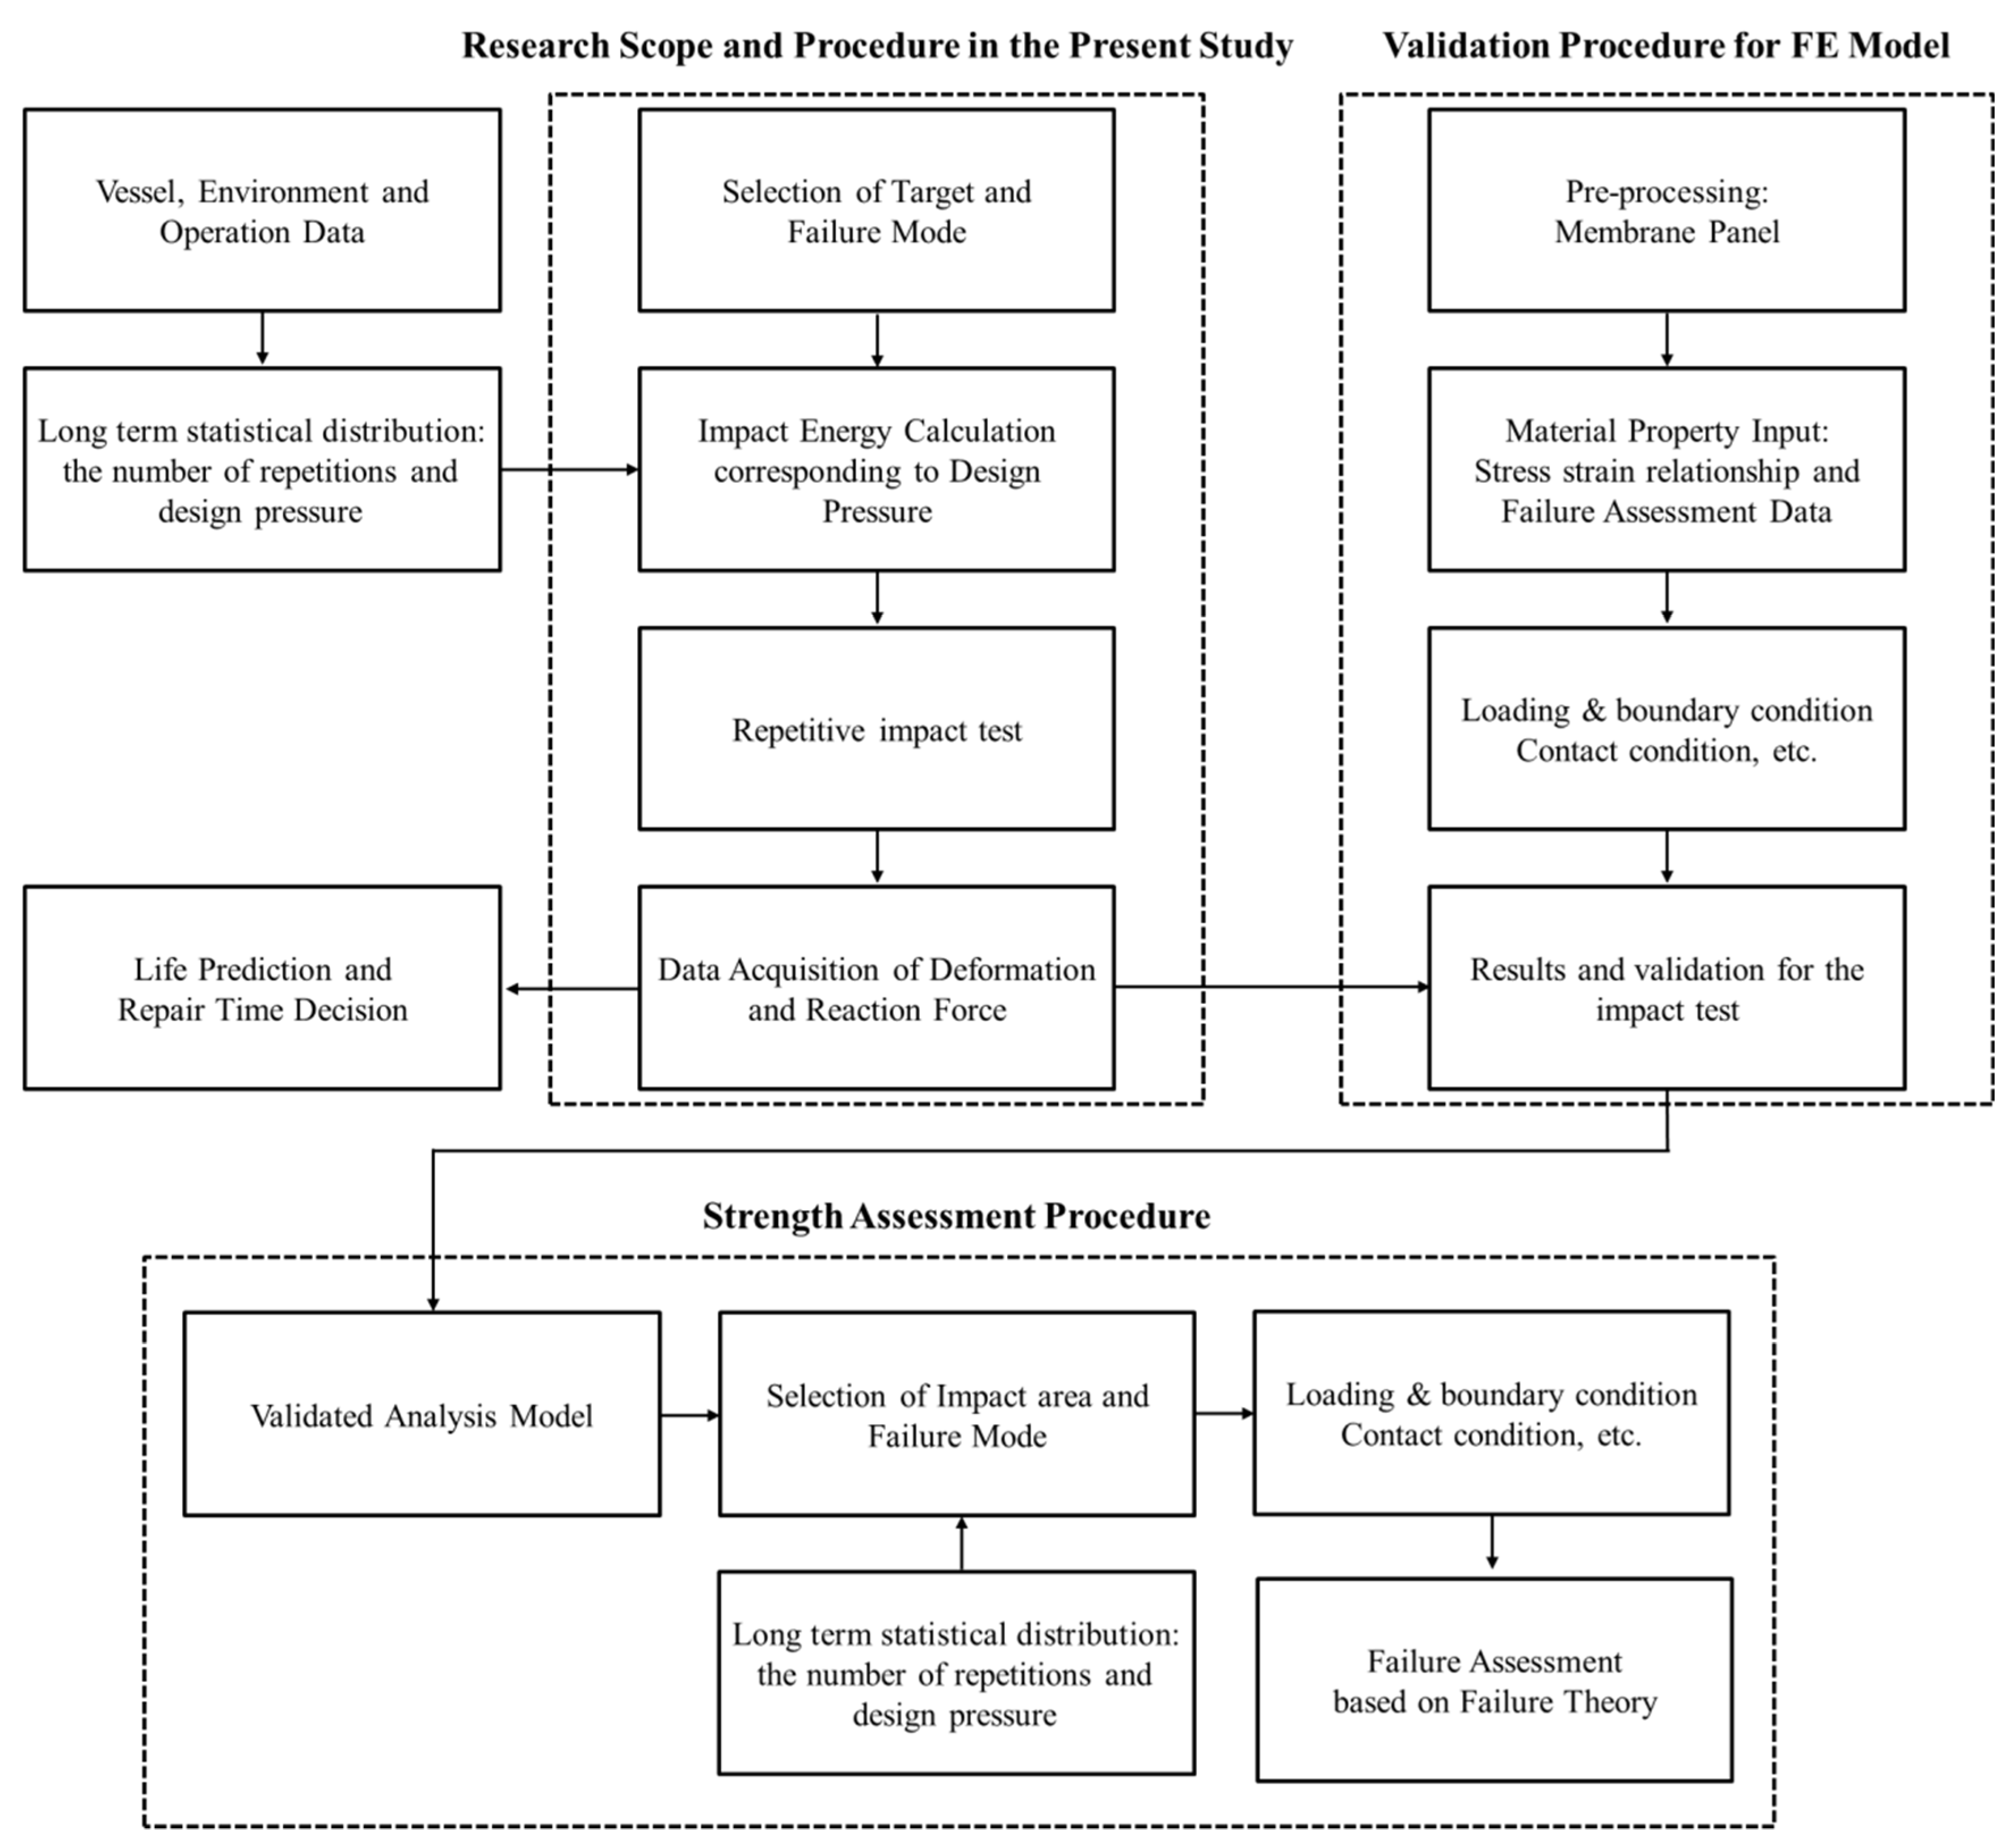
In this study, the fracture or damage was not observed at which the watertightness of the primary barrier could not be guaranteed, nor could the cracks be observed through the liquid penetrant examination. Thus, it is very difficult to experimentally define the failure criteria in terms of loss of the function of the structure. Hence, we are further studying failure criteria based on the failure theory of thin-walled structures using numerical analysis. In failure theory, beyond the equivalent plastic strain in accordance with the stress state, damage growth begins in the material and then fracture occurs, which is called the stage of material degradation [31]. The further study covers the “validation procedure for Finite element model” part shown in the Figure 15. In order to verify the numerical model, the experimental results are indispensable, and the result of the dynamic test is required, not the static test result. Using the numerical model based on failure criteria, it is possible to more accurately predict the failure of primary barrier because the phenomenological models of the failure are based on the failure diagram representing the equivalent plastic strain, which is a function of stress triaxiality [32].

4. Conclusions

In the present study, a custom-built impact test apparatus for a corrugation specimen is developed in order to simulate the jet flow impact on the primary barrier, and to quantitatively evaluate the impact characteristics of the primary barrier. The main conclusions are as follows:
  • Temporal patterns measured in the experiment and actual sloshing test were compared. In the force profile, the ratio of rise time and duration is similar to the actual sloshing phenomenon, and thus the effectiveness of the impact test method was confirmed. The effect of the impact energy and the number of repetitions on reaction force time–history and deformation of primary barrier were investigated. As the repetitive impact was applied, the force profile changed to a uniform shape.
  • Small corrugations have less impact resistance than large corrugations, but there was no significant difference in displacement increment for each corrugation. With repetitive impact loading, corrugation reached the collapse phase where it lies down on the bottom. When the corrugation collapses, the fulcrum phenomenon appears. If the collapsed primary barrier is subjected to a sloshing load, the plywood under the primary barrier can be damaged due to the geometric shape of the fulcrum concentrating the load.
  • Experimental results of the primary barrier behavior under impact conditions are needed to perform LNG CCS assessment under sloshing with a probabilistic analysis. Given that it is very difficult to define failure of a thin-walled structure made of stainless steel through the experimental results, it is necessary to develop a computational analysis methodology based on failure theory in order to define failure criteria of the primary barrier under a sloshing load.
The stainless steel used in the primary barrier exhibits outstanding mechanical performance in terms of the yield and tensile strength under cryogenic temperatures rather than at room temperature. Therefore, the experimental conditions are much more conservative than the actual conditions in an LNG cargo tank. However, in the cryogenic environment, the elongation of stainless steel decreased and, thus, further study is required to investigate the dynamic behavior of a primary barrier under a cryogenic environment.

Author Contributions

Conceptualization, M.-S.K.; Formal analysis, M.-S.K.; Investigation, J.-H.K. and S.-K.K.; Methodology, M.-S.K.; Project administration, J.-H.K. and S.-K.K.; Supervision, J.-M.L.; Writing—original draft, M.-S.K.; Writing—review & editing, J.-M.L.

Funding

The authors received no financial support for the research, authorship, and/or publication of this article.

Acknowledgments

This work was supported by the National Research Foundation of Korea (NRF) grant funded by the Ministry of Science and ICT (MSIT) (No. 2018R1A2B6007403). This work was supported by the National Research Foundation of Korea (NRF) grant funded by the Korea government (MSIT) through GCRC-SOP (No. 2011-0030013).

Conflicts of Interest

The authors declare no conflict of interest.

References

  1. Det Norske Veritas. Classification Note 30.9: Sloshing Analysis of LNG Membrane Tanks; Det Norske Veritas: Oslo, Norway, 2014; pp. 1–98. [Google Scholar]
  2. Gavory, T.; De Seze, P.E. Sloshing in Membrane LNG Carriers and Its Consequences from a Designer’s Perspective. In Proceedings of the Nineteenth International Offshore and Polar Engineering Conference, Osaka, Japan, 21–26 July 2009. [Google Scholar]
  3. Noh, B.J.; Kim, W.S.; Kwon, S.H.; Chung, J.Y. Comparative Wet Drop Experiments of MARK III and KC-1 for membrane type LNG carriers. In Proceedings of the ASME 2009 28th International Conference on Ocean, Offshore and Arctic Engineering, Honolulu, HI, USA, 31 May–5 June 2009. [Google Scholar]
  4. Wang, K.S. Loss Prevention through Risk Assessment Surveys of LNG Carriers in Operation, under Construction, Conversion and Repair, BMT Marine & Offshore Surveys. Available online: http://www.bmtmarinerisk.com (accessed on 19 March 2019).
  5. Bogaert, H.; Kaminski, M.L.M.; Brosset, L. Full and large scale wave impact tests for a better understanding of sloshing: Results of the Sloshel project. In Proceedings of the ASME 2011 30th International Conference on Ocean, Offshore and Arctic Engineering, Rotterdam, The Netherlands, 19–24 June 2011. [Google Scholar]
  6. Chun, M.S.; Kim, M.H.; Kim, W.S.; Kim, S.H.; Lee, J.M. Experimental investigation on the impact behavior of membrane type LNG carrier insulation system. J. Loss. Prev. Process Ind. 2009, 22, 901–907. [Google Scholar] [CrossRef]
  7. Kim, S.K.; Lee, C.S.; Kim, J.H.; Kim, M.H.; Lee, J.M. Computational evaluation of resistance of fracture capacity for SUS304L of liquefied natural gas insulation system under cryogenic temperatures using ABAQUS user-defined material subroutine. Mater. Des. 2013, 50, 522–532. [Google Scholar] [CrossRef]
  8. Lee, C.S.; Cho, J.R.; Kim, W.S.; Noh, B.J.; Kim, M.H.; Lee, J.M. Evaluation of sloshing resistance performance for LNG carrier insulation system based on fluid-structure interaction analysis. Int. J. Nav. Archit. Ocean Eng. 2013, 5, 1–20. [Google Scholar] [CrossRef] [Green Version]
  9. Kim, J.H.; Kim, S.K.; Kim, M.H.; Lee, J.M. Numerical model to predict deformation of corrugated austenitic stainless steel sheet under cryogenic temperatures for design of liquefied natural gas insulation system. Mater. Des. 2014, 57, 26–39. [Google Scholar] [CrossRef]
  10. Lee, C.S.; Lee, J.M. Failure analysis of reinforced polyurethane foam-based LNG insulation structure using damage-coupled finite element analysis. Compos. Struct. 2014, 107, 231–245. [Google Scholar] [CrossRef]
  11. Lee, C.S.; Kim, M.S.; Park, S.B.; Kim, J.H.; Bang, C.S.; Lee, J.M. A temperature- and strain-rate-dependent isotropic elasto-viscoplastic model for glass-fiber-reinforced polyurethane foam. Mater. Des. 2015, 84, 163–172. [Google Scholar] [CrossRef]
  12. Andreaus, U.; Chiaia, B.; Placidi, L. Soft-impact dynamics of deformable bodies. Continuum Mech. Therm. 2013, 25, 375–398. [Google Scholar] [CrossRef]
  13. Andreaus, U.; Baragatti, P.; Placidi, L. Experimental and numerical investigations of the responses of a cantilever beam possibly contacting a deformable and dissipative obstacle under harmonic excitation. Int. J. Nonlinear Mech. 2016, 80, 96–106. [Google Scholar] [CrossRef]
  14. Lee, S.J.; Kim, M.H.; Lee, D.H.; Kim, J.W.; Kim, Y.H. The effects of LNG-tank sloshing on the global motions of LNG carriers. Ocean Eng. 2007, 34, 10–20. [Google Scholar] [CrossRef]
  15. Paik, K.J.; Carrica, P.M. Fluid-structure interaction for an elastic structure interacting with free surface in a rolling tank. Ocean Eng. 2014, 84, 201–212. [Google Scholar] [CrossRef]
  16. Paik, K.J.; Carrica, P.M.; Lee, D.; Maki, K. Strongly coupled fluid-structure interaction method for structural loads on surface ships. Ocean Eng. 2009, 36, 1346–1357. [Google Scholar] [CrossRef]
  17. Kim, S.Y.; Kim, Y.; Kim, K.H. Statistical analysis of sloshing-induced random impact pressures. Proc. Inst. Mech. Eng. Part M J. Eng. Marit. Environ. 2014, 228, 235–248. [Google Scholar] [CrossRef]
  18. Zhao, Y.; Chen, H.C. Numerical simulation of 3D sloshing flow in partially filled LNG tank using a coupled level-set and volume-of-fluid method. Ocean Eng. 2015, 104, 10–30. [Google Scholar] [CrossRef]
  19. Lafeber, W.; Brosset, L.; Bogaert, H. Elementary Loading Processes (ELP) involved in breaking wave impacts: Findings from the Sloshel project. In Proceedings of the Twenty-second International Offshore and Polar Engineering Conference, International Society of Offshore and Polar Engineers, Rhodes, Greece, 17–22 June 2012. [Google Scholar]
  20. Bunnik, T.; Huijsmans, R. Large scale LNG sloshing model tests. In Proceedings of the Seventeenth International Offshore and Polar Engineering Conference, International Society of Offshore and Polar Engineers, Lisbon, Portugal, 1–6 July 2007. [Google Scholar]
  21. Richardson, A.J.; Bray, W.H.; Sandström, R.E.; Lokken, R.T.; Danaczko, M.A. Advances in assessment of LNG sloshing for large membrane ships. In Proceedings of the 21st International Conference and Exhibit, Budapest, Hungary, 17–22 July 2005. [Google Scholar]
  22. Lugni, C.; Brocchini, M.; Faltinsen, O.M. Wave impact loads: The role of the flip-through. Phys. Fluids 2006, 18, 122101. [Google Scholar] [CrossRef]
  23. Kim, B.C.; Yoon, S.H.; Lee, D.G. Pressure resistance of the corrugated stainless steel membranes of LNG carriers. Ocean Eng. 2011, 38, 592–608. [Google Scholar]
  24. Kim, W.S.; Noh, B.J.; Lee, H.; Mravak, Z.; Lauzon, J.; Maguire, J.R.; Radosavljevic, D.; Kwon, S.H.; Chung, J.Y. Fluid-structure interaction modeling, relating to membrane LNG ship cargo containment system. In Proceedings of the Eighteenth International Offshore and Polar Engineering Conference, Vancouver, BC, Canada, 6–11 July 2008. [Google Scholar]
  25. Graczyk, M.; Moan, T. A probabilistic assessment of design sloshing pressure time histories in LNG tanks. Ocean Eng. 2008, 35, 834–855. [Google Scholar] [CrossRef]
  26. Park, W.S.; Yoo, S.W.; Kim, M.H.; Lee, J.M. Strain-rate effects on the mechanical behavior of the AISI 300 series of austenitic stainless steel under cryogenic environments. Mater. Des. 2010, 31, 3630–3640. [Google Scholar] [CrossRef]
  27. Huang, Z.Q.; Chen, Q.S.; Zhang, W.T. Pseudo-shakedown in the collision mechanics of ships. Int. J. Impact Eng. 2000, 24, 19–31. [Google Scholar] [CrossRef]
  28. Jones, N. Pseudo-shakedown phenomenon for the mass impact loading of plating. Int. J. Impact Eng. 2014, 65, 33–39. [Google Scholar] [CrossRef]
  29. Cho, S.R.; Truong, D.D.; Shin, H.K. Repeated lateral impacts on steel beams at room and sub-zero temperatures. Int. J. Impact Eng. 2014, 72, 75–84. [Google Scholar] [CrossRef]
  30. Ghajar, R.; Khalili, S.M.R.; Yarmohammad Tooski, M.; Alderliesten, R.C. Investigation of the response of an aluminium plate subjected to repeated low velocity impact using a continuum damage mechanics approach. Fatigue Fract. Eng. Mater. Struct. 2015, 38, 475–488. [Google Scholar] [CrossRef]
  31. Hooputra, H.; Gese, H.; Dell, H.; Werner, H. A comprehensive failure model for crashworthiness simulation of aluminium extrusions. Int. J. Crashworthines 2004, 9, 449–464. [Google Scholar] [CrossRef]
  32. Nam, A.W.; Choung, J. Prediction of failure strain according to stress triaxiality of a high strength marine structural steel. In Collision and Grounding of Ships and Offshore Structures; Amdahl, J., Ehlers, S., Leira, B.J., Eds.; CRC Press: Boca Raton, FL, USA, 2013; pp. 69–76. [Google Scholar]
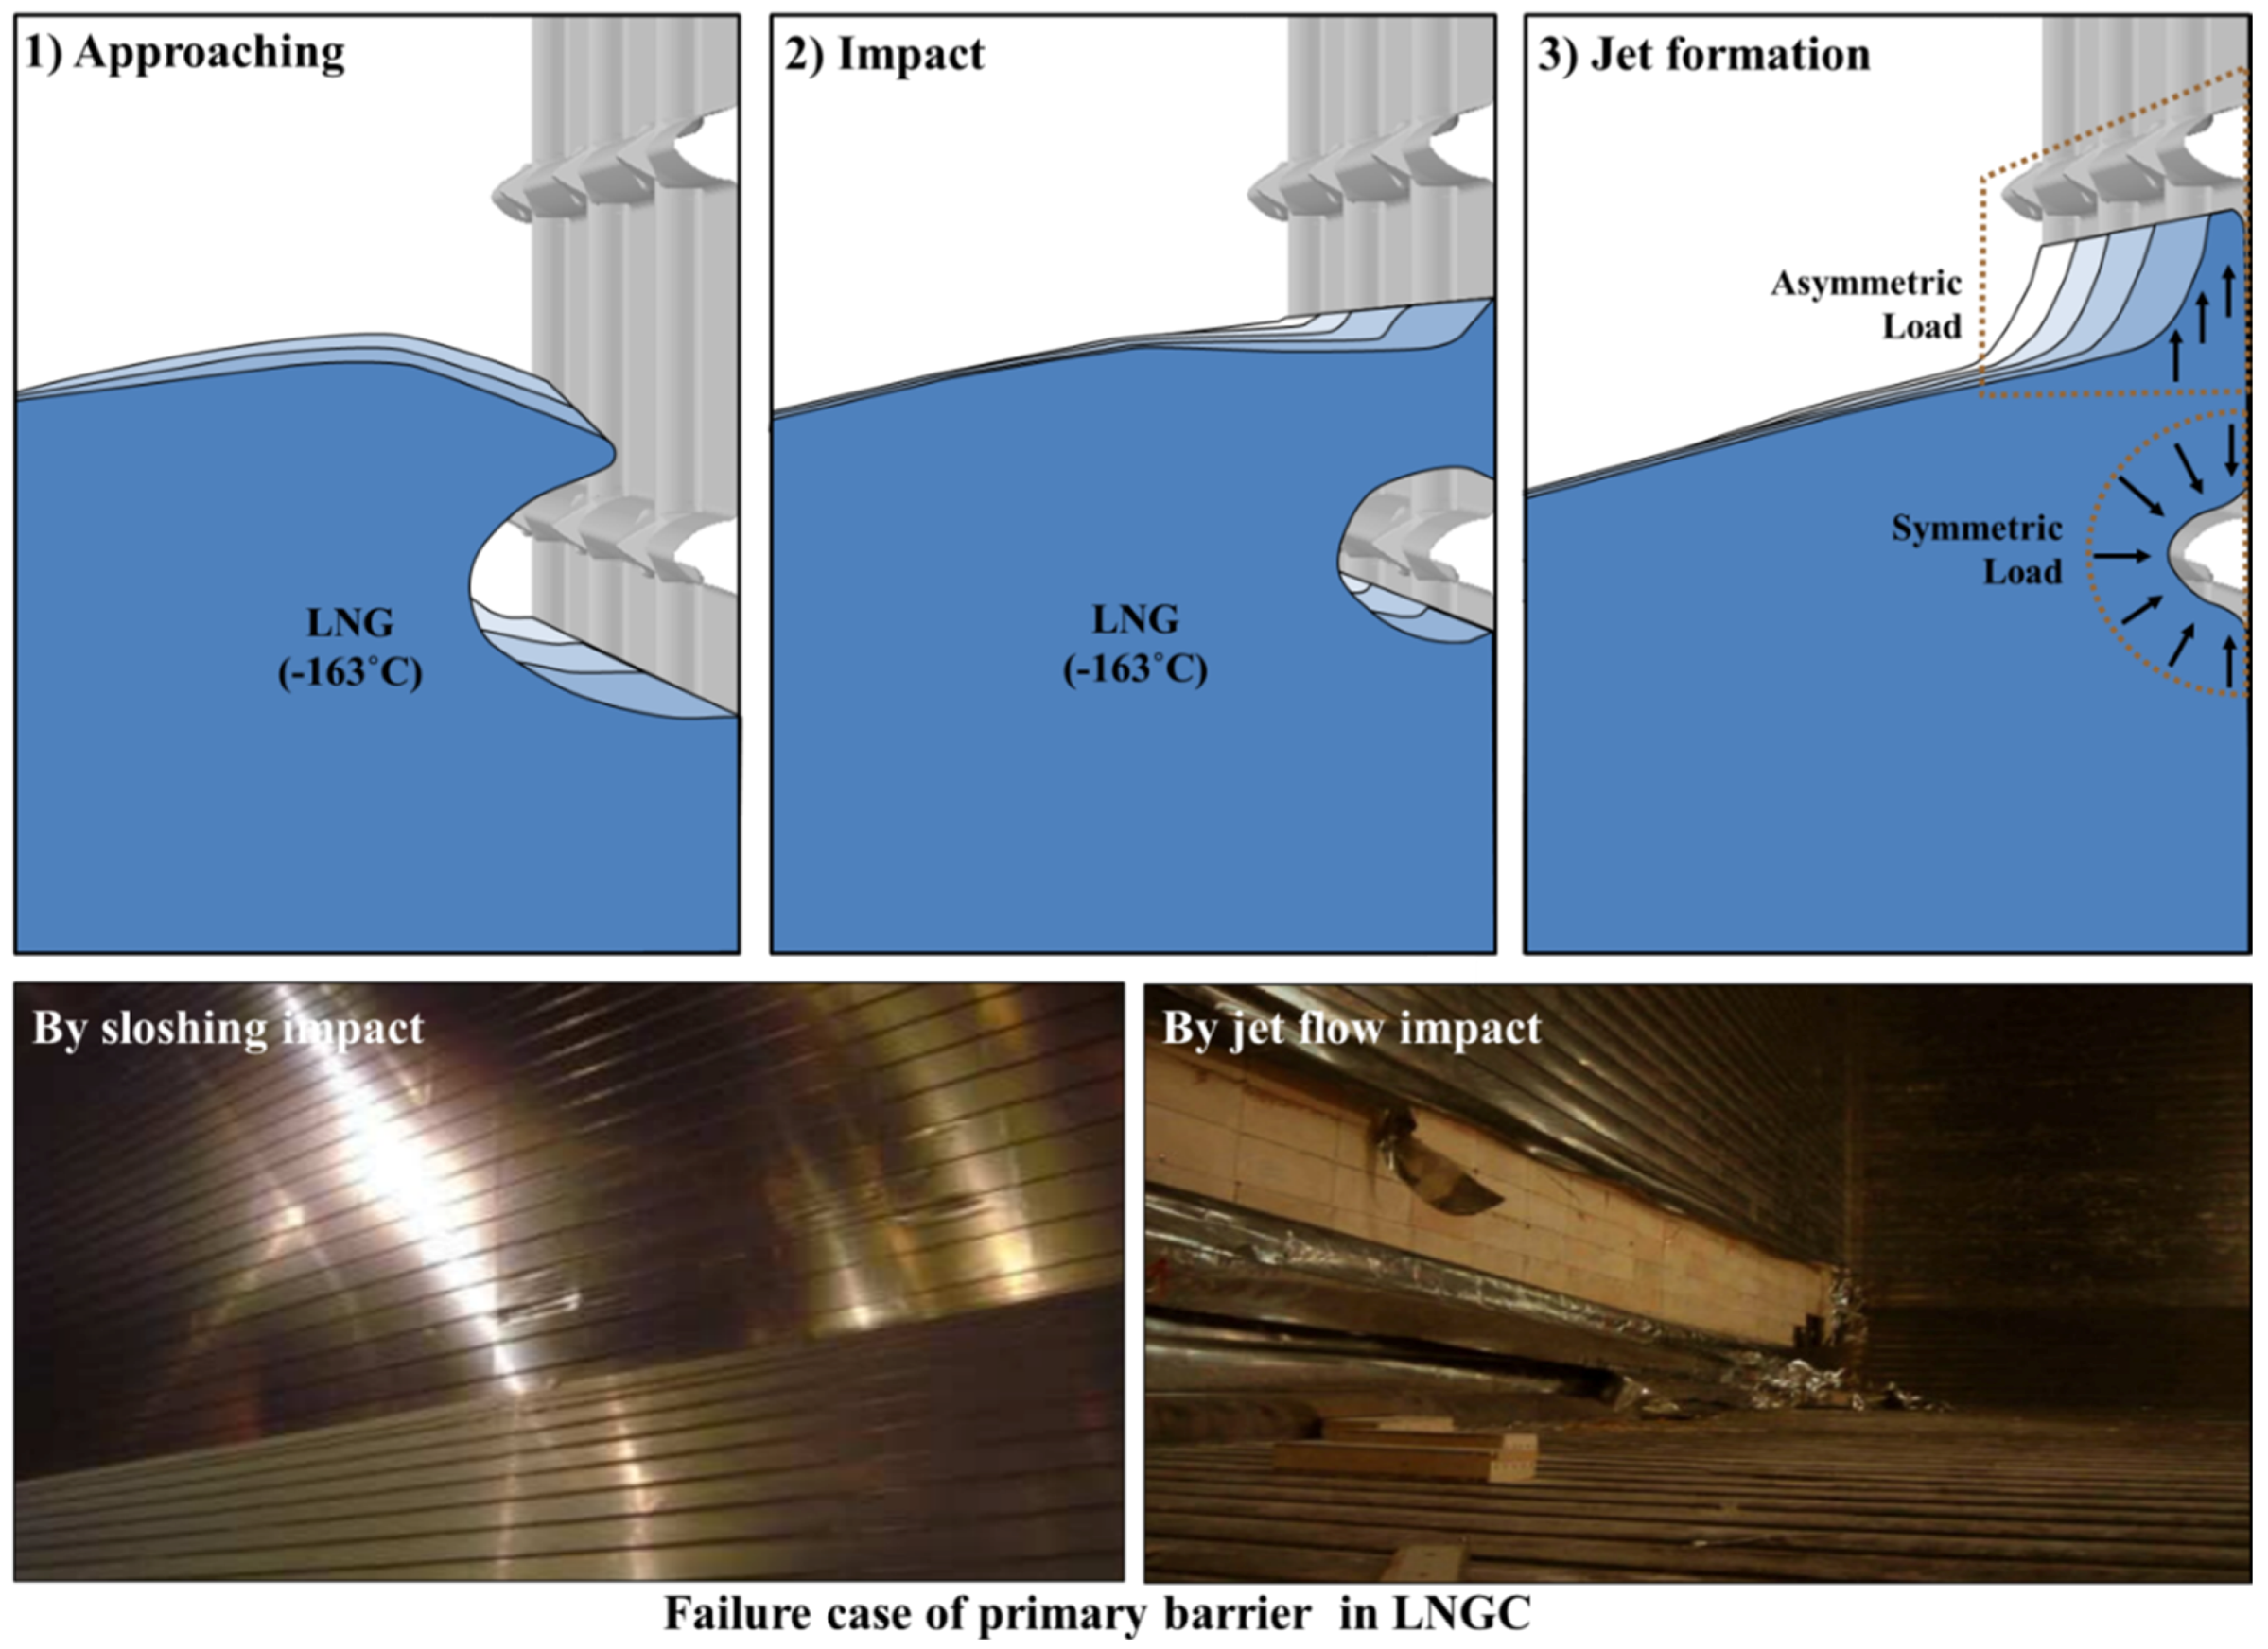
Figure 1. Schematic of sloshing impact applied to primary barrier in liquefied natural gas cargo containment system (LNG CCS).
Applsci 09 01558 g001
Figure 2. Specimen preparation for (a) membrane panel, (b) large corrugation, and (c) small corrugation.
Applsci 09 01558 g002
Figure 3. (a) Custom-built structural impact test equipment and (b) fixing jig with large corrugation specimen.
Applsci 09 01558 g003
Figure 4. Reaction force profile of (a) large and (b) small corrugation in accordance with impact energy.
Applsci 09 01558 g004
Figure 5. (a) Impulse from reaction force and (b) maximum reaction force in accordance with impact energy.
Applsci 09 01558 g005
Figure 6. Displacement measurement method for primary barrier.
Applsci 09 01558 g006
Figure 7. Comparison of displacement between large and small corrugation in accordance with impact energy.
Applsci 09 01558 g007
Figure 8. Reaction force time history of L123 scenario (a) from the first to the fifth impact loading and (b) from the sixth to tenth impact loading, and S123 scenario (c) from the first to the fifth impact loading and (d) from the sixth to tenth impact loading.
Applsci 09 01558 g008
Figure 9. Deformed configuration of the L123 scenario specimen under (a) the first impact loading, (b) the fifth impact loading and (c) the tenth impact loading, and of the S123 scenario specimen under (d) the first impact loading, (e) the fifth impact loading, and (f) the tenth impact loading.
Applsci 09 01558 g009aApplsci 09 01558 g009b
Figure 10. Affected area at the knot part distorted by (a) deformation of large corrugation and (b) deformation of small corrugation.
Applsci 09 01558 g010
Figure 11. Schematic diagram of hinge-shaped part playing a role of a fulcrum in primary barrier.
Applsci 09 01558 g011
Figure 12. Displacement of (a) large corrugation and (b) small corrugation as the number of impacts increased and displacement increment of the specimens per the number of impacts (c) from the first to fifth and (d) from the sixth to tenth.
Applsci 09 01558 g012aApplsci 09 01558 g012b
Figure 13. Collapse phase of corrugation under the repeated impact loading.
Applsci 09 01558 g013
Figure 14. Life prediction scheme using the result of this study.
Applsci 09 01558 g014
Figure 15. Research process for liquefied natural gas cargo (LNGC) structure member that includes research scope performed in this study.
Applsci 09 01558 g015
Table 1. Chemical composition of 304L stainless steel.
Chemical Composition (%)
CCrSiCuPMnNiSMo
0.01618.20.3760.50.0281.4518.630.02510.254
Table 2. Drop height of impactor with drop mass using energy equivalence.
No.Peak Pressure (MPa)Energy (J)Drop Velocity (mm/s)Drop Height (mm)
10.88123.3851.538
21.52230.31164.071
32.36282.21128.587
42.78412.01556.7127
Table 3. Experimental scenario for primary barrier under the repeated impact loading.
Scenario NameSpecimen TypeImpact Energy (J)The Number of Repeated Loading
L123Large corrugation123.310
L230230.310
L282282.210
L412412.05
S123Small corrugation123.310
S230230.34
S282282.23
S412412.03
Table 4. Comparison of experimental results and actual sloshing test in temporal pattern.
Duration (ms)Rise Time (ms)Rise Time/Duration
MeanSTDMeanSTDMeanSTD
Exp. result37.7108.219.475.90.5100.021
Graczyk and Moan, 200827.441.011.417.60.4800.200