Article

An Inductive Debris Sensor for a Large-Diameter Lubricating Oil Circuit Based on a High-Gradient Magnetic Field

School of Advanced Manufacturing Engineering, Chongqing University of Posts and Telecommunications, Chongqing 400065, China
*
Author to whom correspondence should be addressed.
Appl. Sci. 2019, 9(8), 1546; https://doi.org/10.3390/app9081546
Submission received: 18 February 2019 / Revised: 4 April 2019 / Accepted: 9 April 2019 / Published: 14 April 2019

Abstract

:
Wear is one of the main factors of machine failure. If abnormal wear was not detected in time during the operation of a mechanical system, it probably leads to catastrophic consequences. The wear debris in the lubricating oil circuit contains much information about equipment wear. Consequently, debris detection is regarded as an effective way to detect mechanical faults. In this paper, an inductive debris sensor based on a high-gradient magnetic field is presented for high-throughput lubricating oil circuits. The excitation coil of the sensor is driven by a constant current to generate a high-gradient magnetic field, and the induction coil is wound around the flow path. When wear debris cuts the magnetic line through the flow path, a corresponding induced voltage is generated. The experimental results show that the sensor output signal is linear with the drive current and the wear debris velocity. In addition, the shortest distance between the particles that the sensor output signals can be completely separated is 25 mm. When the distance is smaller, the induced signals are superimposed.

1. Introduction

Wear is one of the main factors affecting the reliability and service life of mechanical equipment. In the process of mechanical equipment operation, the wear debris produced by the continuous rubbing of friction pairs is collected in the oil system and circulates with the oil. The wear state of a machine can be directly reflected by the debris in the lube oil [1]. As a consequence, the detection of wear debris is significant in identifying abnormal wear conditions for the fault diagnosis and life prediction of mechanical equipment.
There are a lot of methods used for wear debris detection, such as optical methods, acoustic methods, capacitive methods, inductive methods, etc. With the maturity of image processing technology, optical methods [2,3,4,5] are widely used for extracting visual features of wear debris. This method can easily detect debris greater than 5 μm. However, the lube oil may gradually become nontransparent during the operating process, which causes difficulties in obtaining clear pictures and leads to the incorrect counting and sizing of wear debris. Overlapping wear debris and air bubbles in the oil will also have great impacts on the results. Additionally, acoustic methods [6,7,8] and capacitive methods [9,10,11,12] are used in debris detection. However, a common defect of the above three mentioned methods is that it is impossible to distinguish ferrous and non-ferrous debris, which is important for judging the source of wear.
However, the inductive method has a simpler structure, which is a prominent advantage, and can distinguish between ferrous and non-ferrous debris [13]. Thus, the inductive method is widely used in on-line wear debris monitoring. Miller et al. [14] applied the sensor to the online wear monitoring of aerospace engines. Becker et al. [15] applied the sensor to monitor the fatigue damage process of rolling bearings and determined a physically meaningful debris limit for a deteriorating rolling element bearing. Sheng et al. [16] applied the sensor to online wear of full-scale wind turbine gearboxes rated at 750 kW, and the gearbox was tested in three conditions: running-in, healthy, and damaged.
Studies indicate that abnormal wear debris size is above 10 μm [17]. An inductive debris sensor that is currently successful on the market is MetalSCAN from GasTOPS, which can detect 65 μm ferromagnetic debris. However, because it applies a 3-D solenoid structure [13], MetalSCAN does not have the ability to detect wear debris of a size smaller than 65 μm [18], which is vital to identifying abnormal wear conditions. To solve this problem, Du et al. [19,20] developed a 2-layer planar coil based inductive sensor that is capable of detecting 50 μm ferromagnetic debris in a 1.2 mm diameter pipe. After they used the parallel inductance-capacitance (LC) resonance method so that the sensor could detect 20 μm wear debris from a microfluid channel that is 1.2 mm in diameter [21]. Ren et al. [22] proposed a sensor that adopts a circular excitation and two semicircular sensing coils. It can measure ferromagnetic and non-ferromagnetic debris as small as 120 μm (D) and 210 μm (D) in a 34 mm-diameter pipe, but the induction coils may invade into the inside of the oil path, which will increase the flow resistance of lubricating oil and adversely affect the lubrication of the equipment. Hong et al. [23,24] developed a radial inductive debris detection sensor that could effectively detect 81 μm ferromagnetic debris in a pipe with a 20 mm diameter, but the magnetic field strength inside the pipe is about 100 μT, and the induced voltage signal is weak. In order to improve detection accuracy, an inductive debris sensor based on a high-gradient magnetic field that can detect wear debris of a size greater than 25 μm in lube oil in our previous work, was proposed [25]. However, the 3 mm outside diameter of the sensor has become a major defect, making it unsuitable for high-flow debris detecting.
Currently, research related to debris sensors mainly focuses on improving the recognition accuracy of wear debris, and exciting debris sensors are generally small in size of the oil path. The height of the oil path of image-based sensors is about 1 mm [21], which results in poor passability of the lubricating oil and easy jamming. The inductive debris sensor has a relatively large oil path size and is currently up to 34 mm [22]. Most inductive debris sensors are driven by high-frequency voltage, and the recognition accuracy of the sensor is directly related to the frequency of the drive voltage. However, the frequency of the drive voltage is too high, which will aggravate the skin effect of the excitation coil, causing an increasing temperature of the sensor and changing the magnetic field in the oil path. Moreover, for larger-diameter lubricating oil circuits, such as ships and steam turbines, only one bypass can be set for sampling and monitoring. This may change the flow resistance of the original lubricant oil circuit and affect the lubrication effect.
Accordingly, one possible solution is to develop a large-diameter debris sensor to match the size of the lubricating oil circuit based on the previously proposed inductive sensor [26]. However, the following problems exist: (a) compared with the small-diameter sensors, after increasing the diameter, it cannot be ignored that the magnetic field strength in the radial direction of the oil pipe is changing; and (b) when the pipe diameter is small, the entire oil pipe is in a strong magnetic field, and all the wear debris passing through the sensor can be detected. However, after the diameter of the oil pipe is increased, only the local region of the oil pipe is in a strong magnetic field, which causes some significant induced voltages not to be generated when wear debris passing through a portion of the tubing flow.
In this paper, a large-diameter inductive debris sensor is proposed. The sensor is driven by a constant current and generates a high-gradient magnetic field in a limited region near the wall of the sensor tube. When a piece of metal wear debris flows through the region, a pulse output signal similar to a sine wave is generated to achieve the on-line monitoring of the wear debris in larger-diameter lubricant lines.

2. Sensor Structure and Mathematical Model

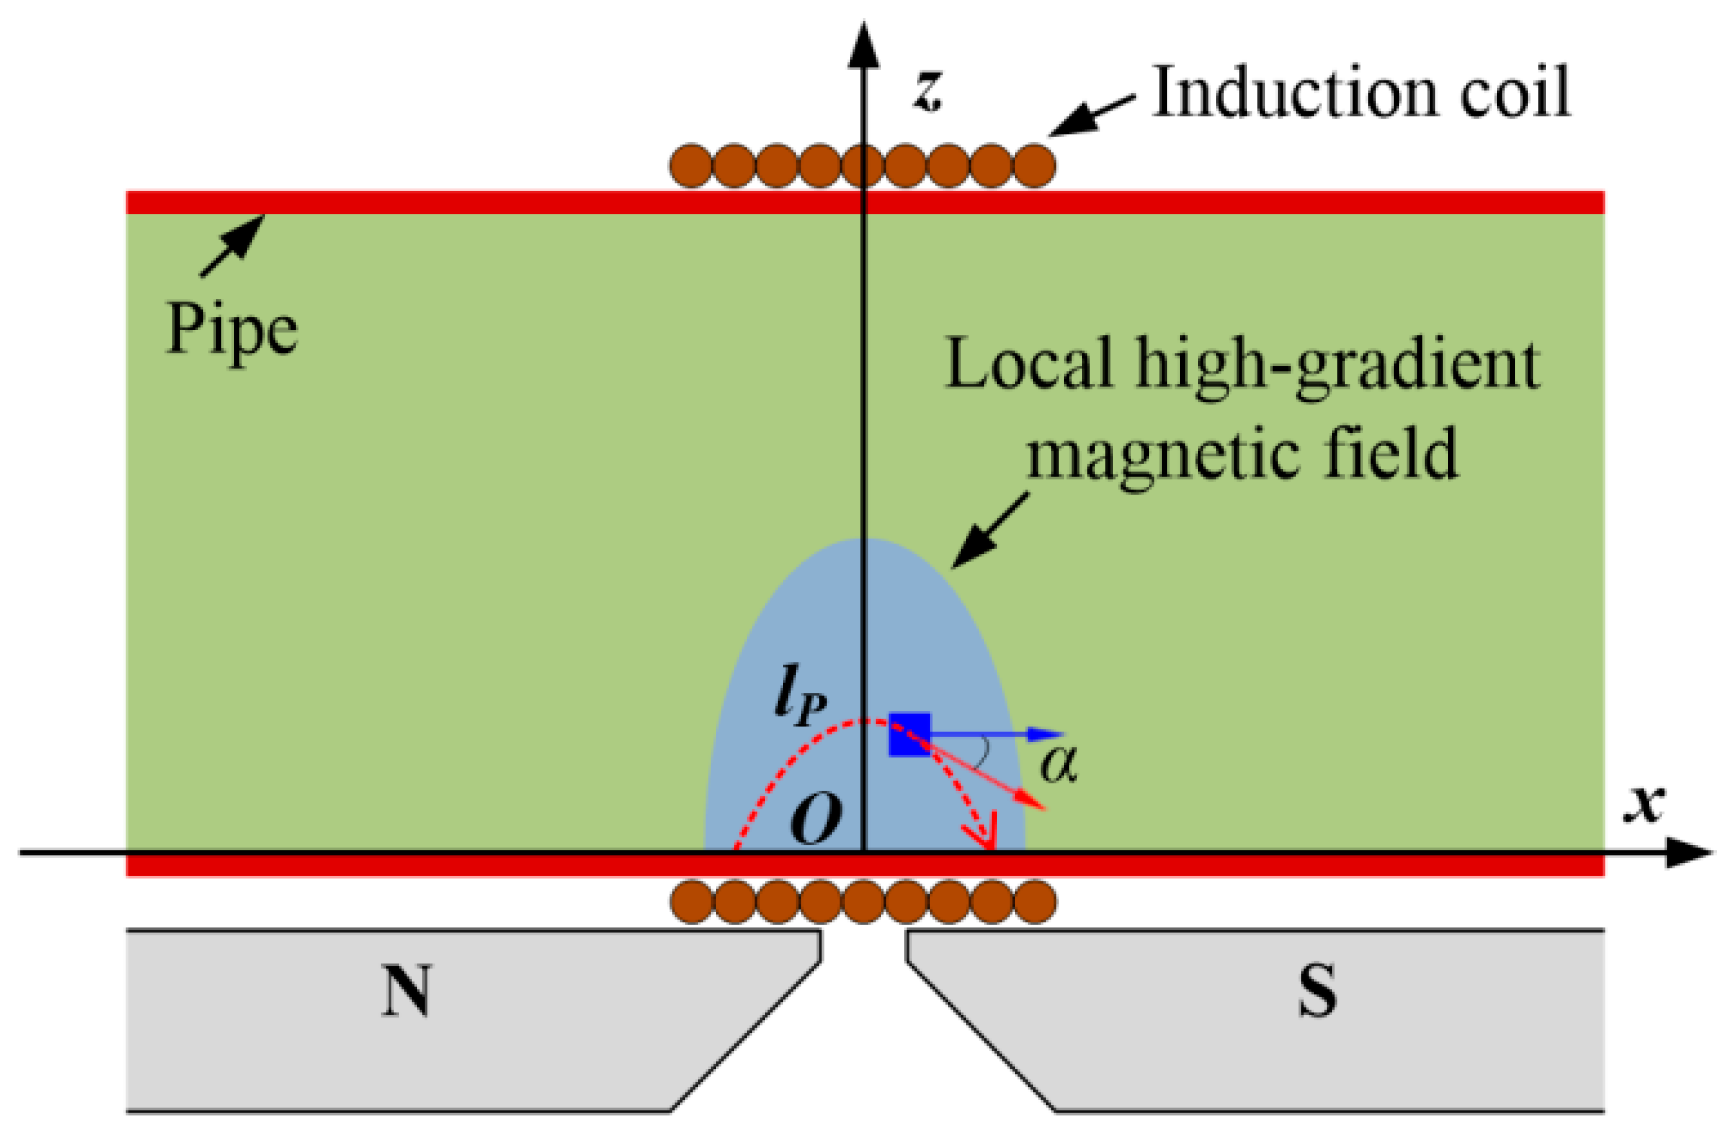
2.1. Sensor Structure

The structure diagram of the induction sensor of the large-diameter lube oil circuit presented in this paper is shown in Figure 1. The size of the oil path is determined by the specific oil circuit diameter. In this paper, the sensor is tested with the oil path of 100 mm long and 40 mm inner diameter. A 7000-turn induction coil (length 30 mm, wire diameter 0.05 mm) is wound around the pipe, which is mounted on the magnetic pole. To generate a high-gradient magnetic field, the excitation coil (2000-turn, wire diameter 0.4 mm) is sleeved on the iron core. The distance from the centerline to the surface of the magnetic pole is 23 mm. The magnetic pole structure of the sensor is shown in [25]. Moreover, the midpoint of the bottom of the oil path was set to zero point.

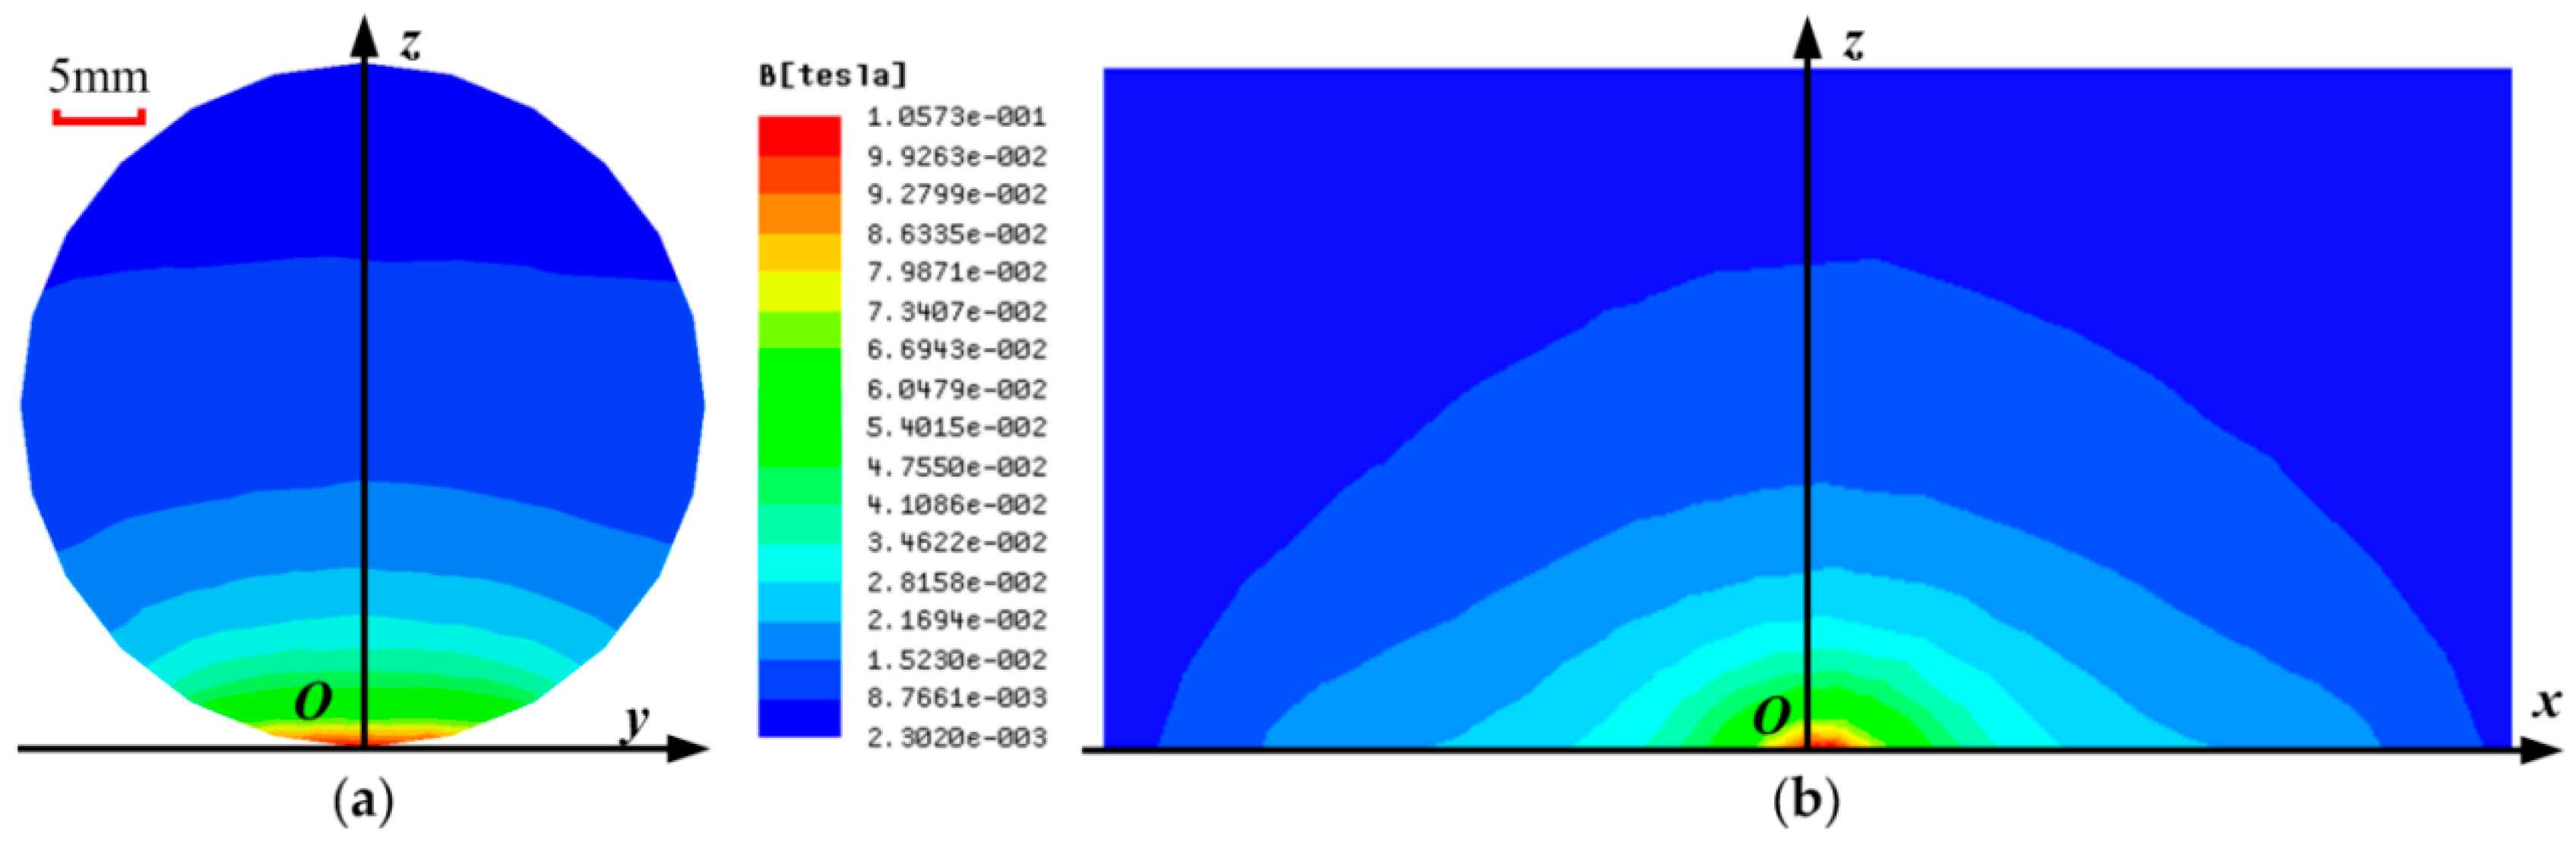
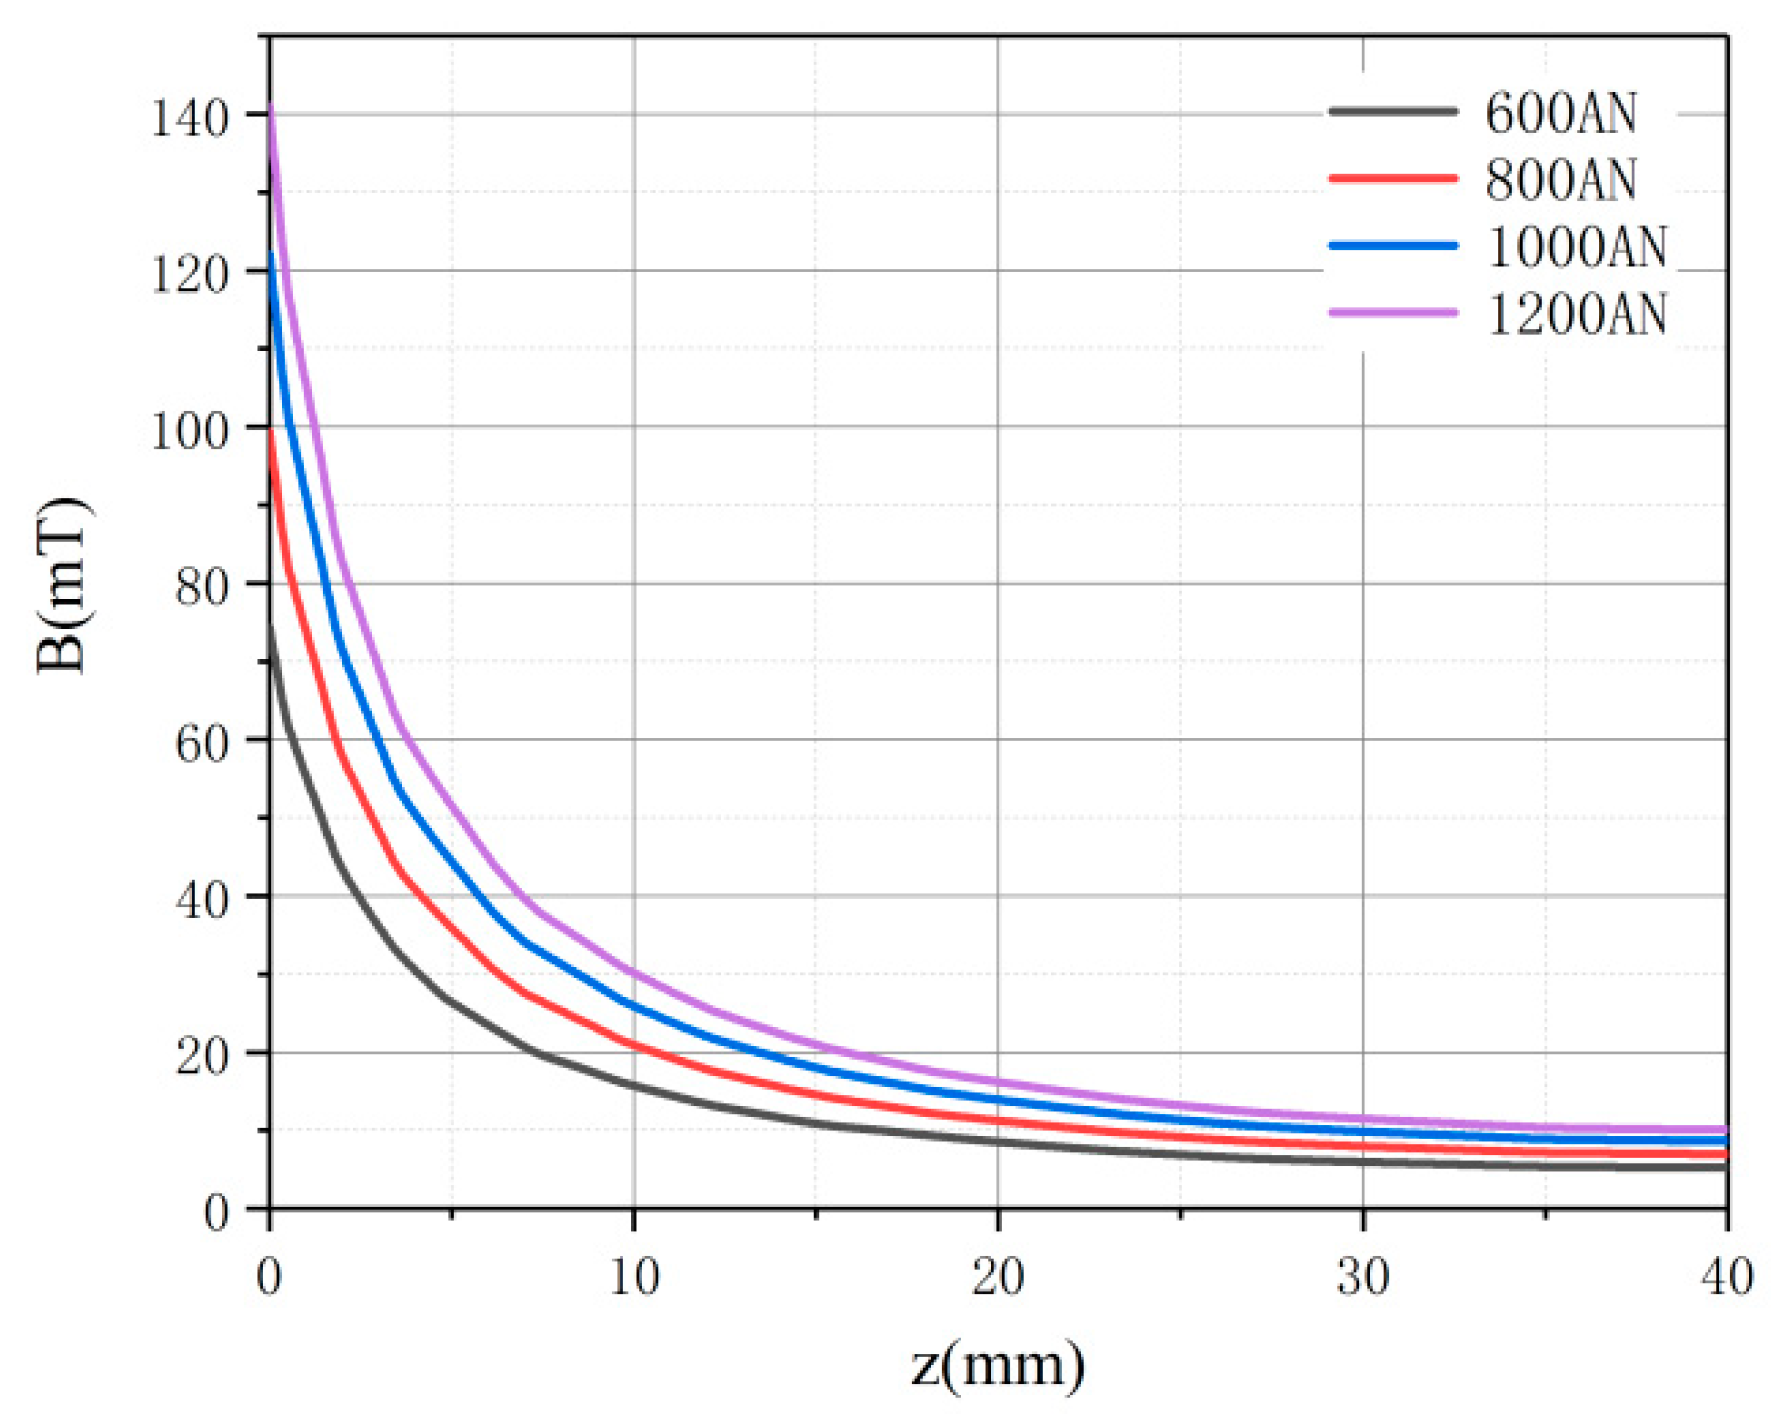
2.2. Mathematical Model of the Sensor

The excitation coil is driven by a constant current to produce a high-gradient magnetic field in a local region of the oil path that is close to the air gap. As shown in Figure 2, when the wear debris flows through this region, the induced voltage will be detected. In previous work [25], the mathematical model of the sensor was established. Supposing the debris is a cube with δ x × δ y × δ z . The induced voltage and the magnetic flux variation can be described as:
u = N lim Δ t 0 Δ ϕ Δ t
Δ ϕ = F δ x δ y δ z μ ( 1 1 μ d ) sin α l 2 ( x )
where u is the output voltage of the inductive coil, N presents the turn number of the induction coil, Δ ϕ is the magnetic flux variation caused by the wear debris, and Δ t is the time lag, μ and μ d represent the vacuum permeability and the relative permeability of the debris, l ( x ) is the length of the debris path, and α is the angle between the direction of debris movement and magnetic field direction. The magnetic potential can be calculated as F = N D I , where I is the exciting current and N D is the turn number of the excitation coil. Combining Equations (1) and (2), the sensor output voltage is:
u = 2 N N D I δ x δ y δ z μ ( μ d 1 ) μ d v d d x ( sin α l 2 ( x ) )
where v is the debris speed along the x-axis. It can be seen from Equation (3) that the output voltage is proportional to the velocity of the wear debris and the size of the current.

2.3. Transient Simulation of the Induced Voltage

As shown in Figure 3, the magnetic field distribution in the oil path is not uniform. The magnetic flux density B is relatively strong close to the air gap. With a current of 0.5 A, B can reach more than 100 mT. B decreases with the increase of height in z-axis direction. The variation of B along the x-axis is shown in Figure 4. When the z-height is small, B changes sharply along the x-axis, and a local high gradient magnetic field is formed along the x-axis. When z-height exceeds 10 mm, B changes gently along the x-axis. In addition, the maximum value of B is not at x = 0.
α can also be seen as the angle between B and the x-axis. Under different z-height conditions, the variations of α with x-axis is shown in Figure 5. Due to the error in the simulation calculation, the curve of α is not smooth. When x < −30 or x > 20, the variation law is more complicated, and it often changes sharply between 90 and −90. When −30 < x < 20, it is decremented, and positive and negative reversal occurs at x = −5.
Figure 6 shows a simulated output voltage signal wave when a piece of ferromagnetic debris flows through the sensor at a constant speed of 1 m/s. A pulse output signal is generated, which is similar to the output waveform of the three-coil induction wear debris sensor [14]. According to Equation (3), the inducted voltage is related to the change law of α . The simulated pulse signal also has a positive and negative reversal, which is consistent with the change of α . According to Equation (3), the induced voltage is related to α x , and the rough α curve will definitely causes noise in the simulated output voltage signal.

3. Experimental Results and Discussion

According to Equation (3), the induced voltage of the sensor output signal is related to the current, velocity, and magnetic field intensity, and the magnetic field intensity will change along the z-axis direction. To verify the relations between the induced voltage and the current, debris velocity and z-axis height, a series of experiments was conducted.

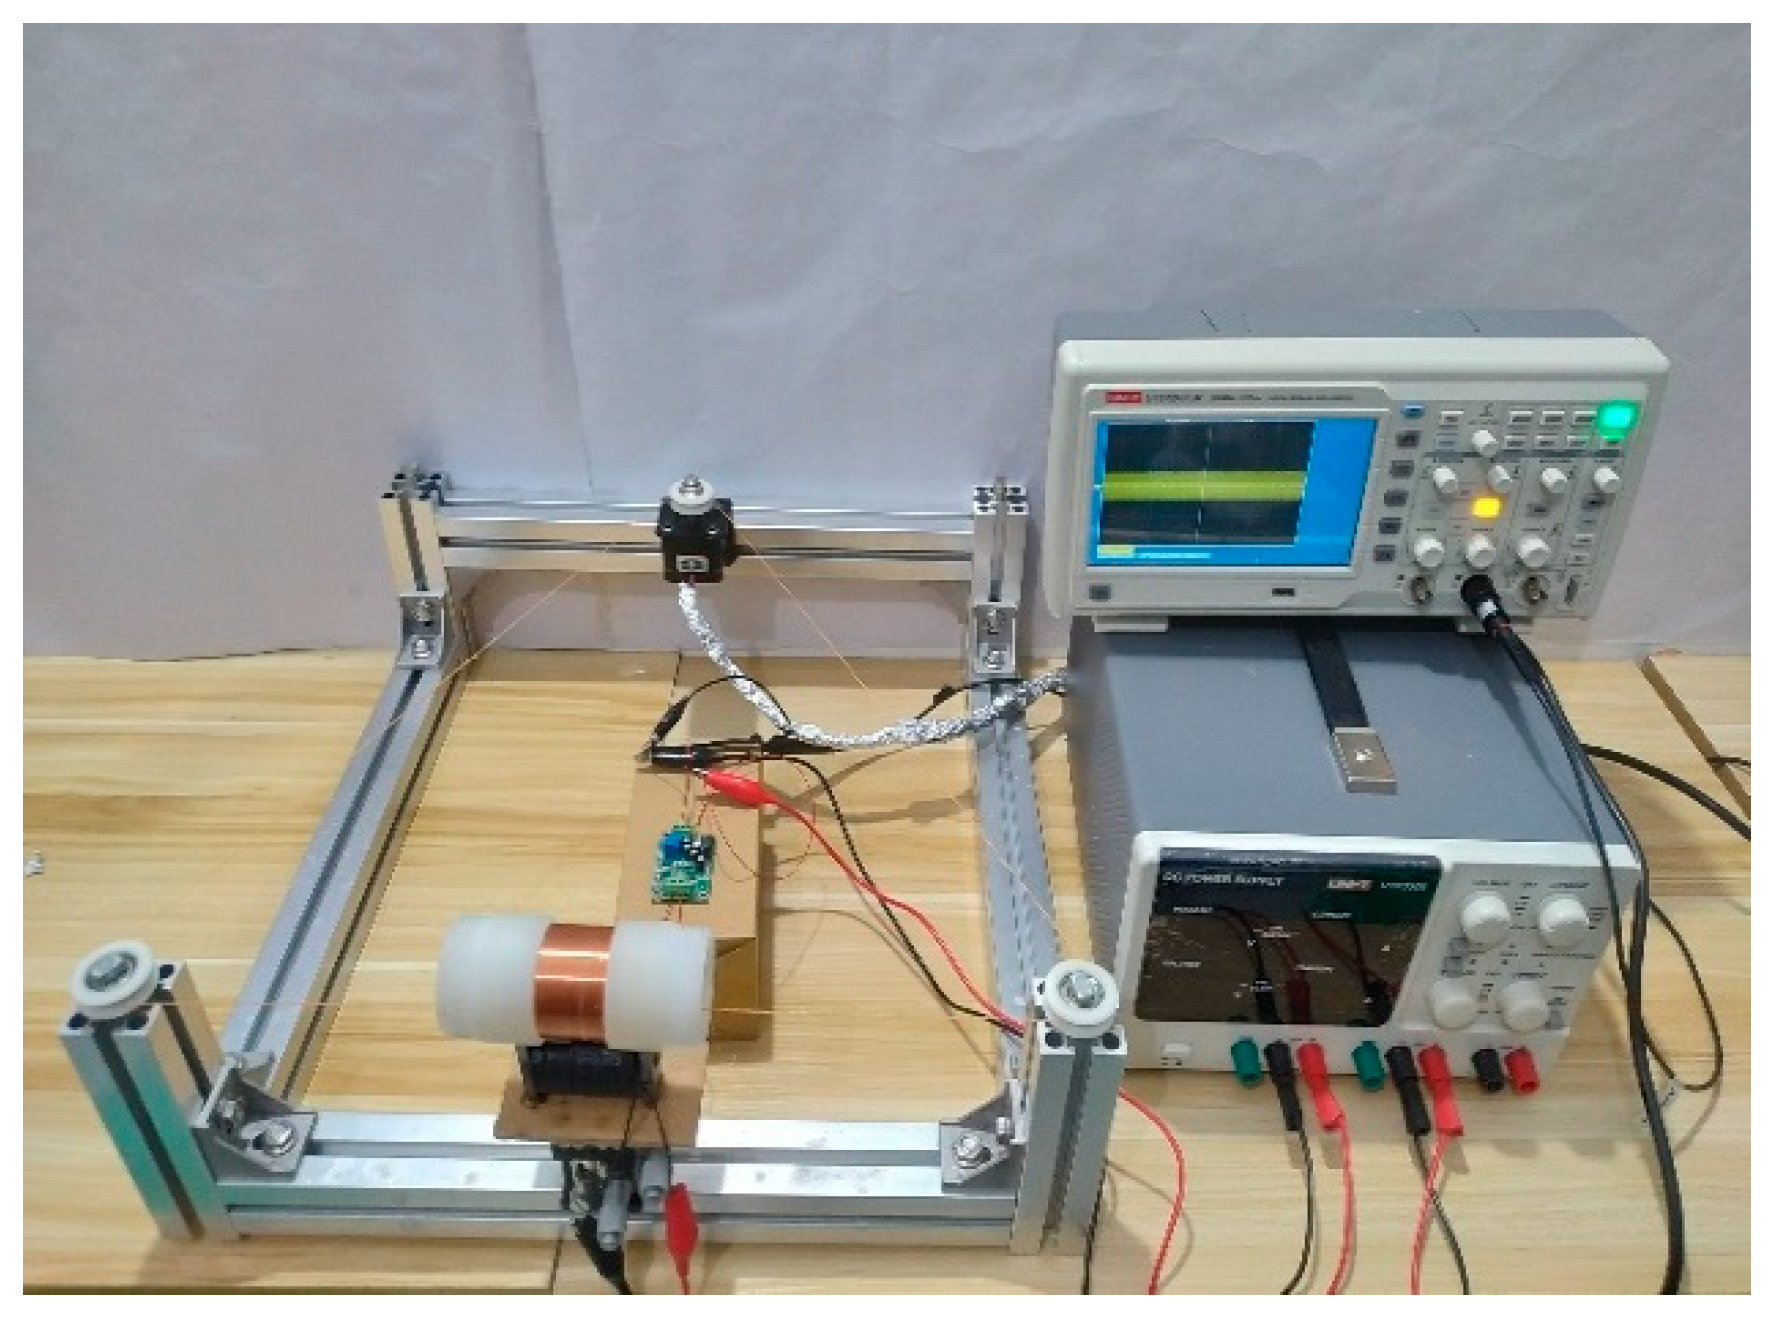
3.1. Experimental Rig

As shown in Figure 7, in order to obtain the relationship between the motion state of the debris and the induced voltage, one piece of ferromagnetic debris was attached to a nylon wire driven by a stepping motor. By manipulating the rotation speed of the motor or the radial height of the nylon thread, the wear debris can flow through the lube oil in the oil pipe at different velocities or with different radial positions. The voltage generated by the induction coil is weak, so an amplifier is installed between the sensor and PC to amplify the voltage signal output by the sensors.

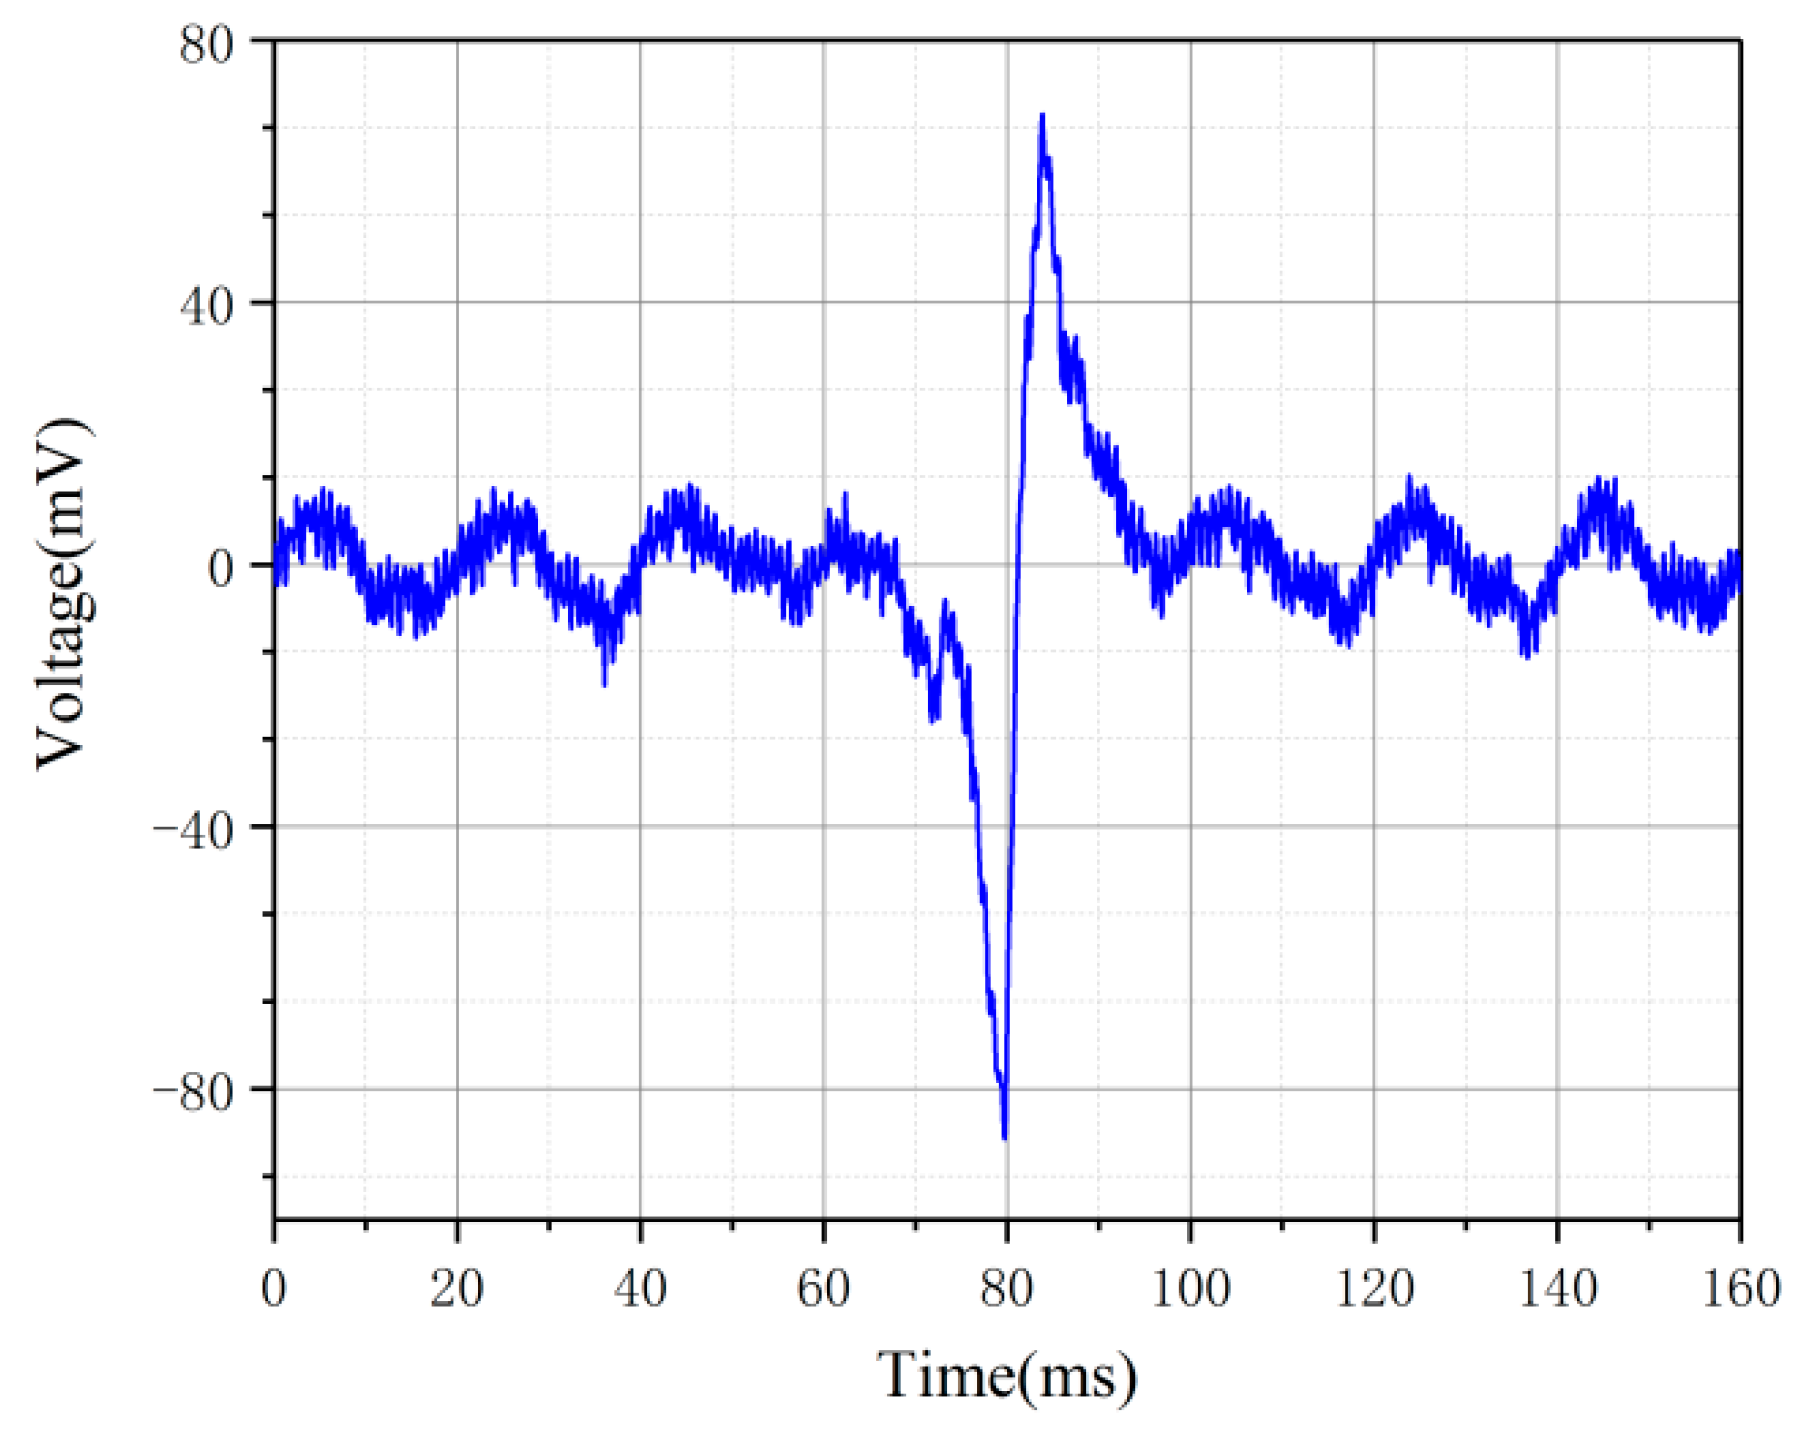
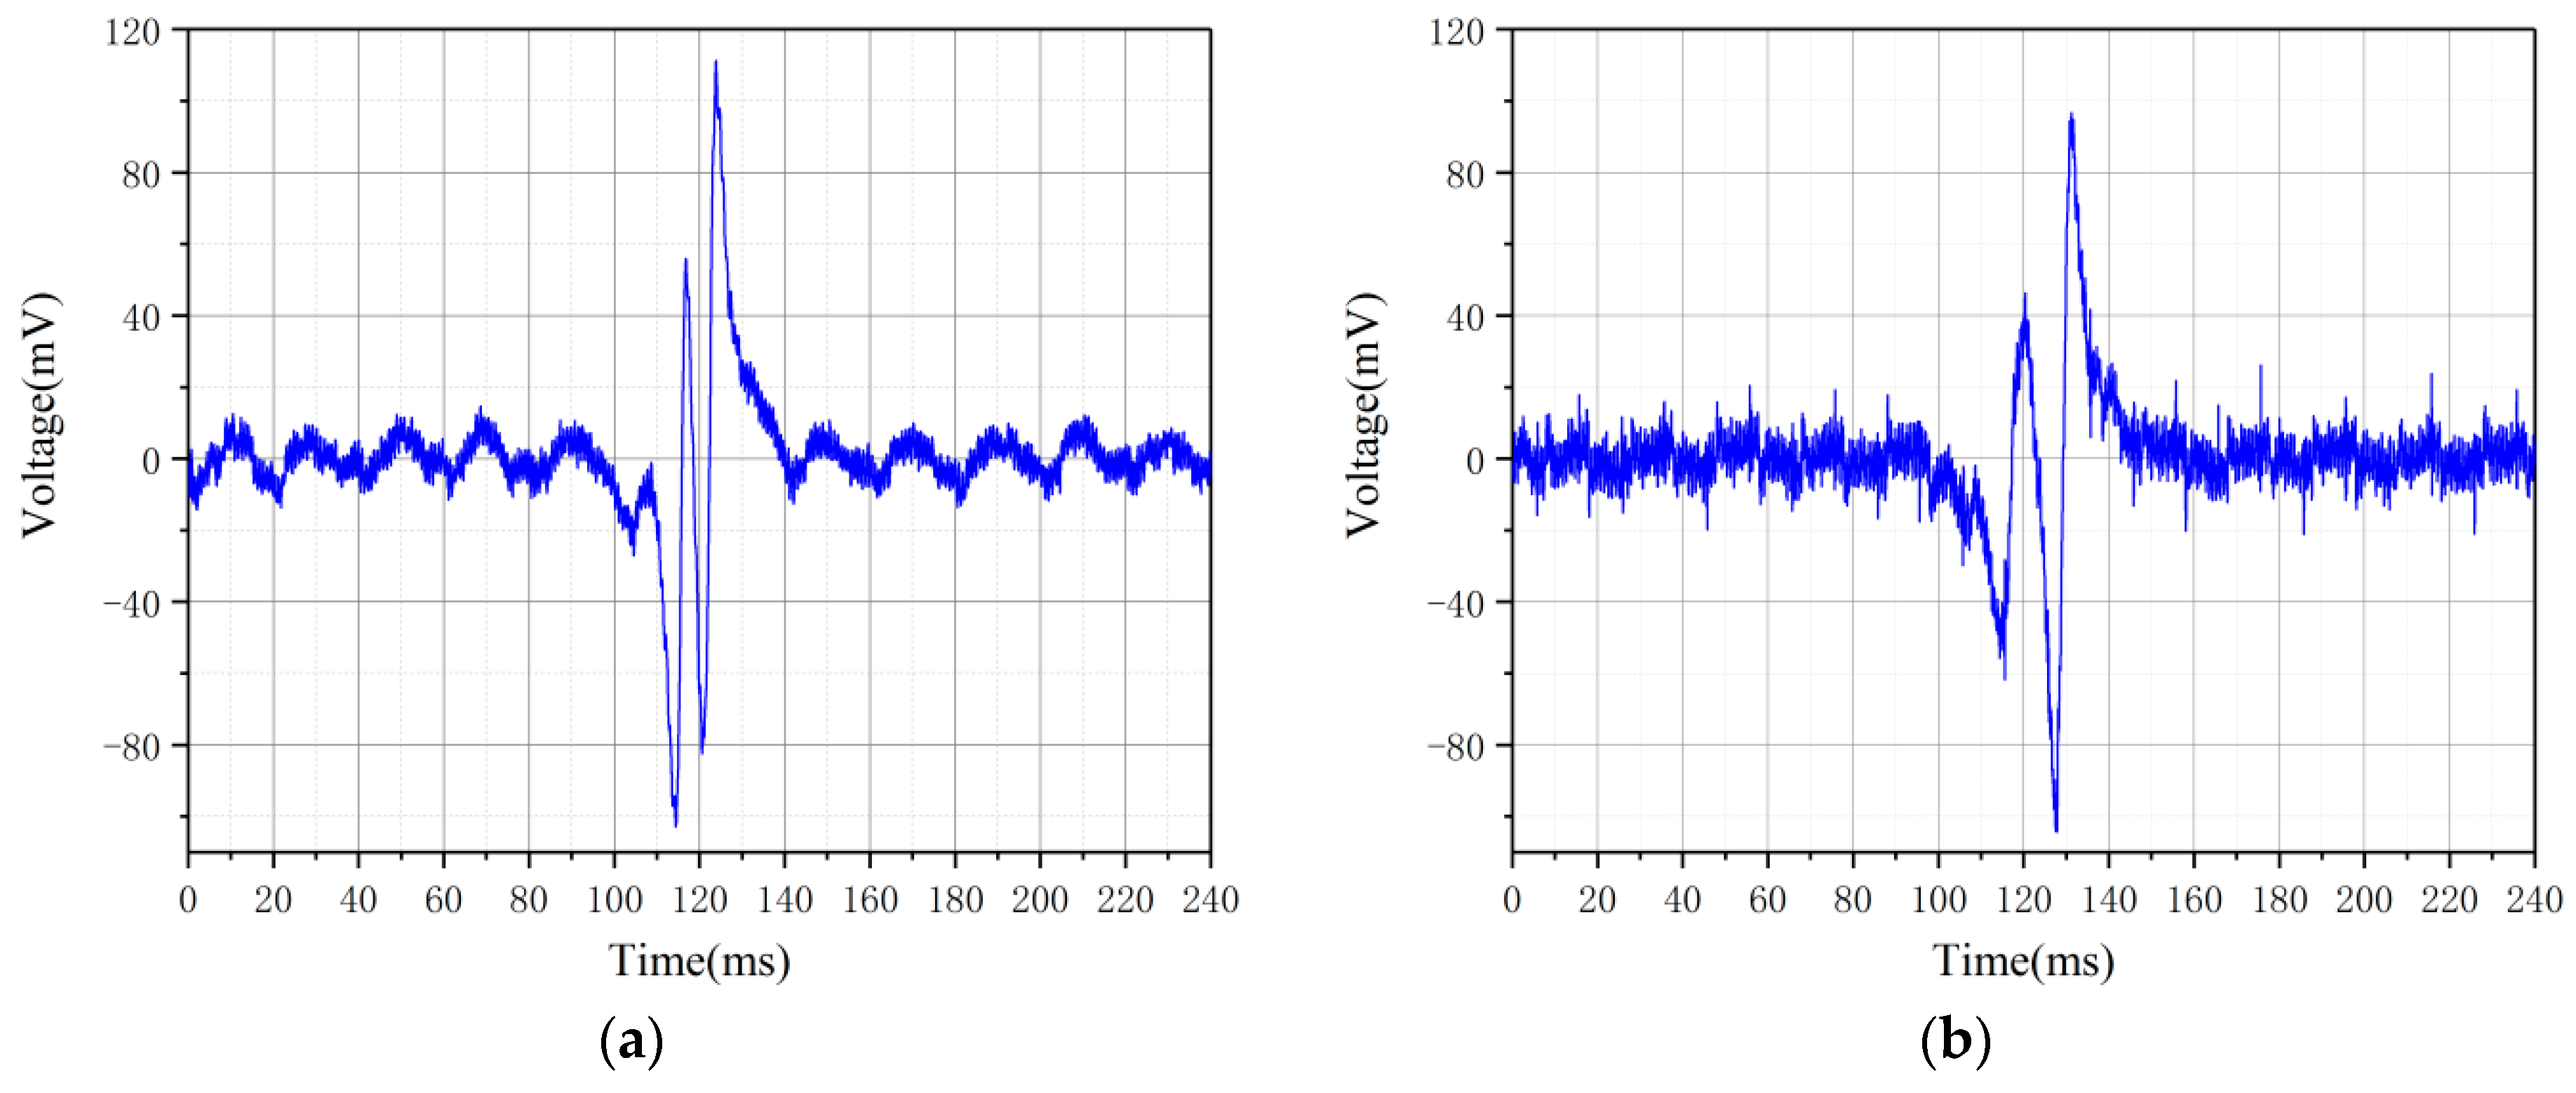
3.2. Experimental Result

The experiment adopted an iron particle (0.90 mm length, 0.90 mm diameter), and the amplification gain was 30. The particles are 1 mm from the flow tube wall. Figure 8 shows the output voltage signal of the sensor when the wear debris is driven at a speed of 2.12 m/s by a high-gradient magnetic field produced by a 0.4 A direct current. When the wear debris pass through the high-gradient magnetic field, a pulse output signal similar to a sine wave is generated, which matches the simulation wave shown in Figure 6. The signal first generates a valley and then forms a peak; the peak-to-peak value is 163 mV with the pulse width of approximately 28 ms. The background noise of the signal has a peak-to-peak value of approximately 30 mV. Furthermore, the background noise is a continuous sine wave whose frequency is 50 Hz due to industry frequency interference.

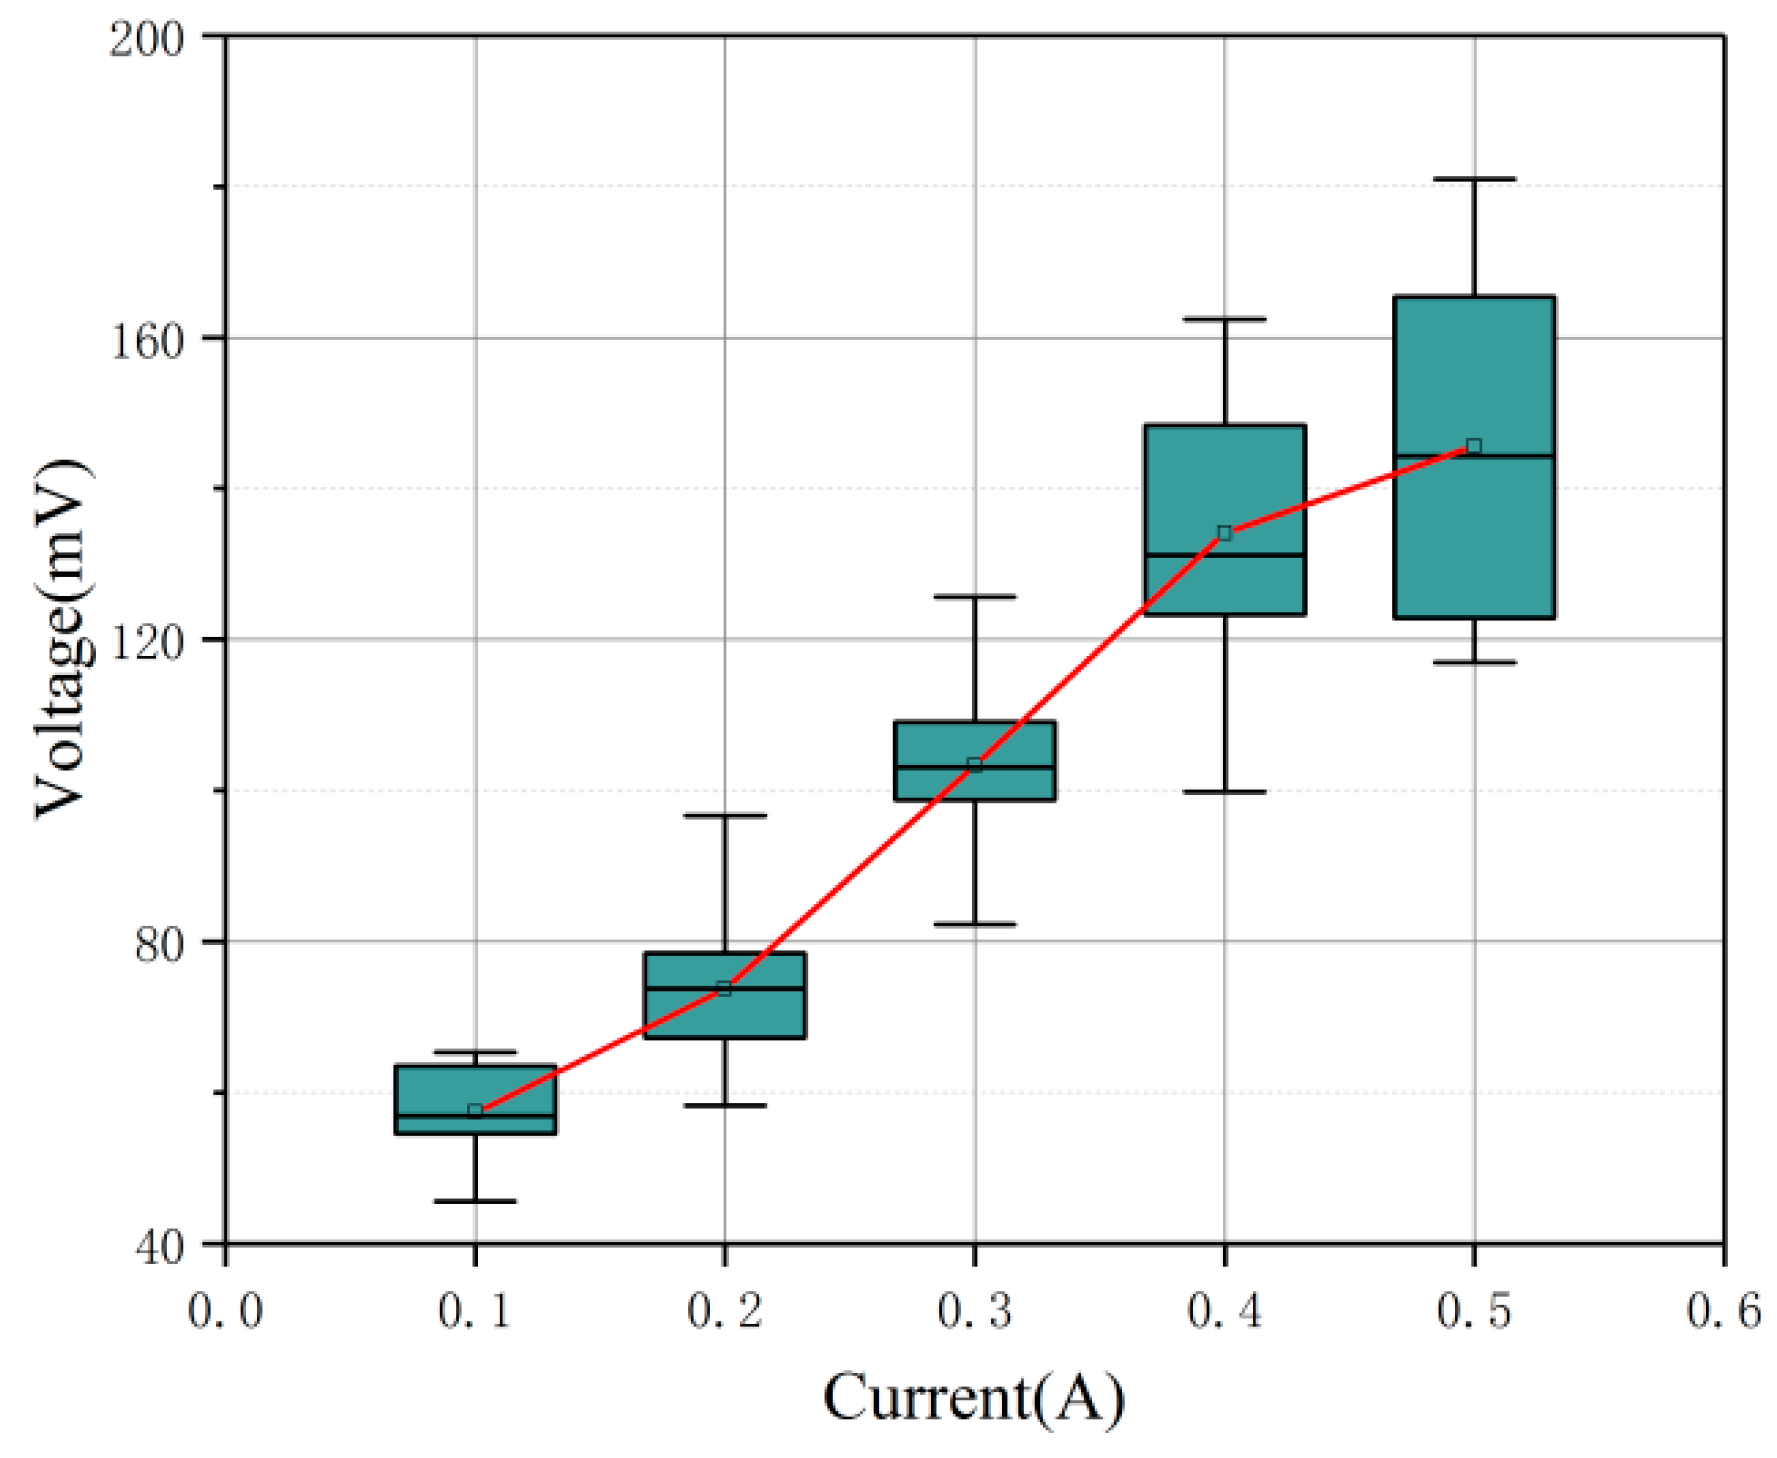
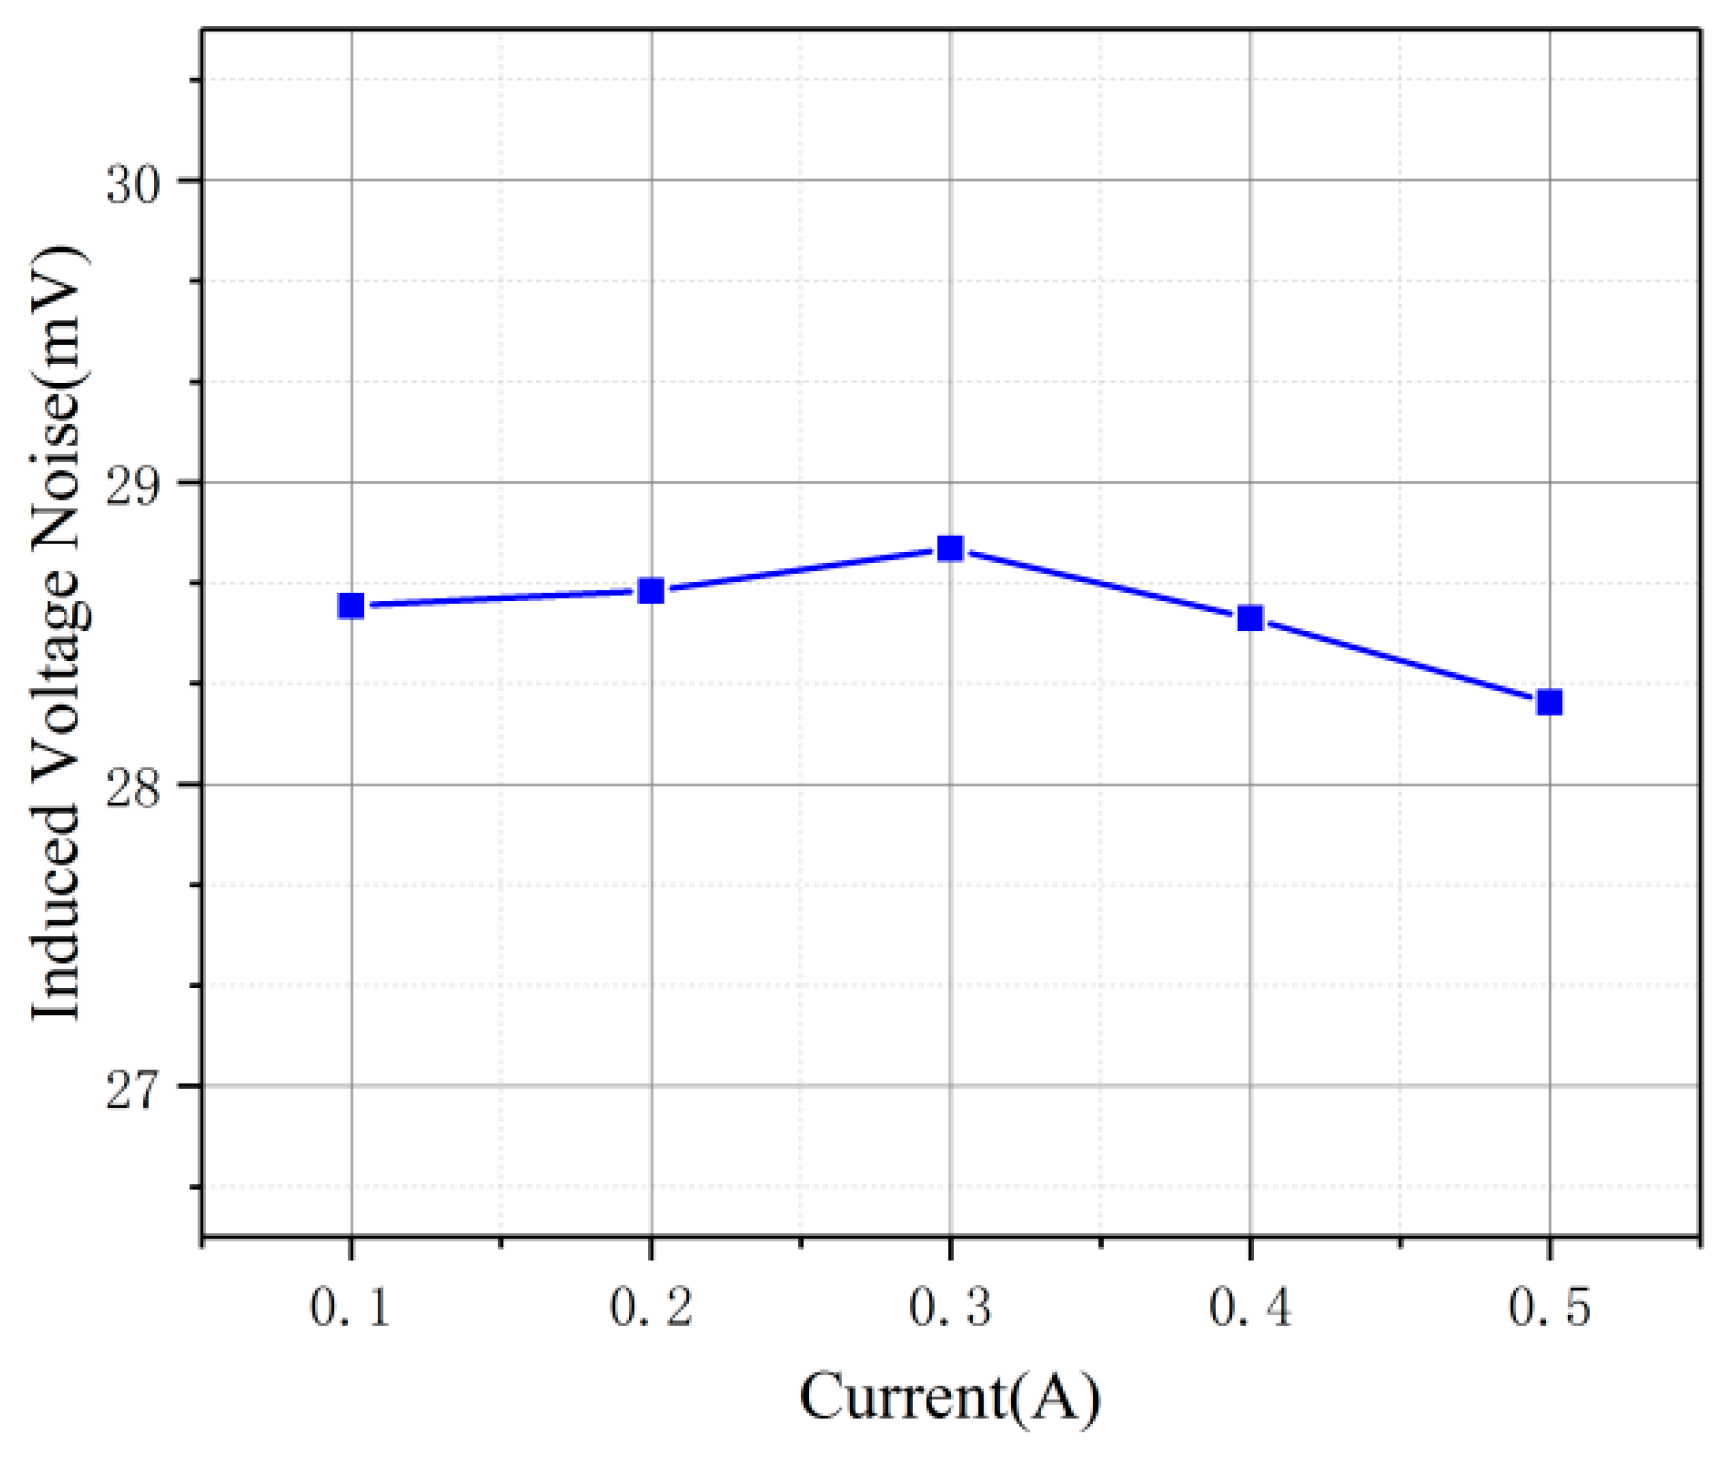
3.2.1. The Relation between the Current and Induced Voltage

According to Equation (3), the exciting current is a key factor of the sensor output. The z-axis direction height was set to 1 mm, and the iron debris moved along the x-axis at 2.12 m/s.
The peak-to-peak values of inductive voltage profiles with different exciting currents are shown in Figure 9. Each experimental condition in the figure is counted using 12 sets of data, with the top line and bottom line representing the maximum and minimum values, and the middle line representing the median. The top and bottom of the box are the upper quartile and the lower quartile respectively. The result indicates that there is a linear relationship between the peak-to-peak values and exciting current, which correlates well with Equation (3). However, by calculation, when the excitation current gradually becomes larger, the standard deviation of the experimental data increased from 6.2 to 22.1. Figure 10 shows the induced voltage noise variation under different drive current conditions. When the drive current varies from 0.1 to 0.5 A, the peak-to-peak value of the noise does not change significantly. The drive current of the excitation coil thus has little effect on the background noise of the output voltage.

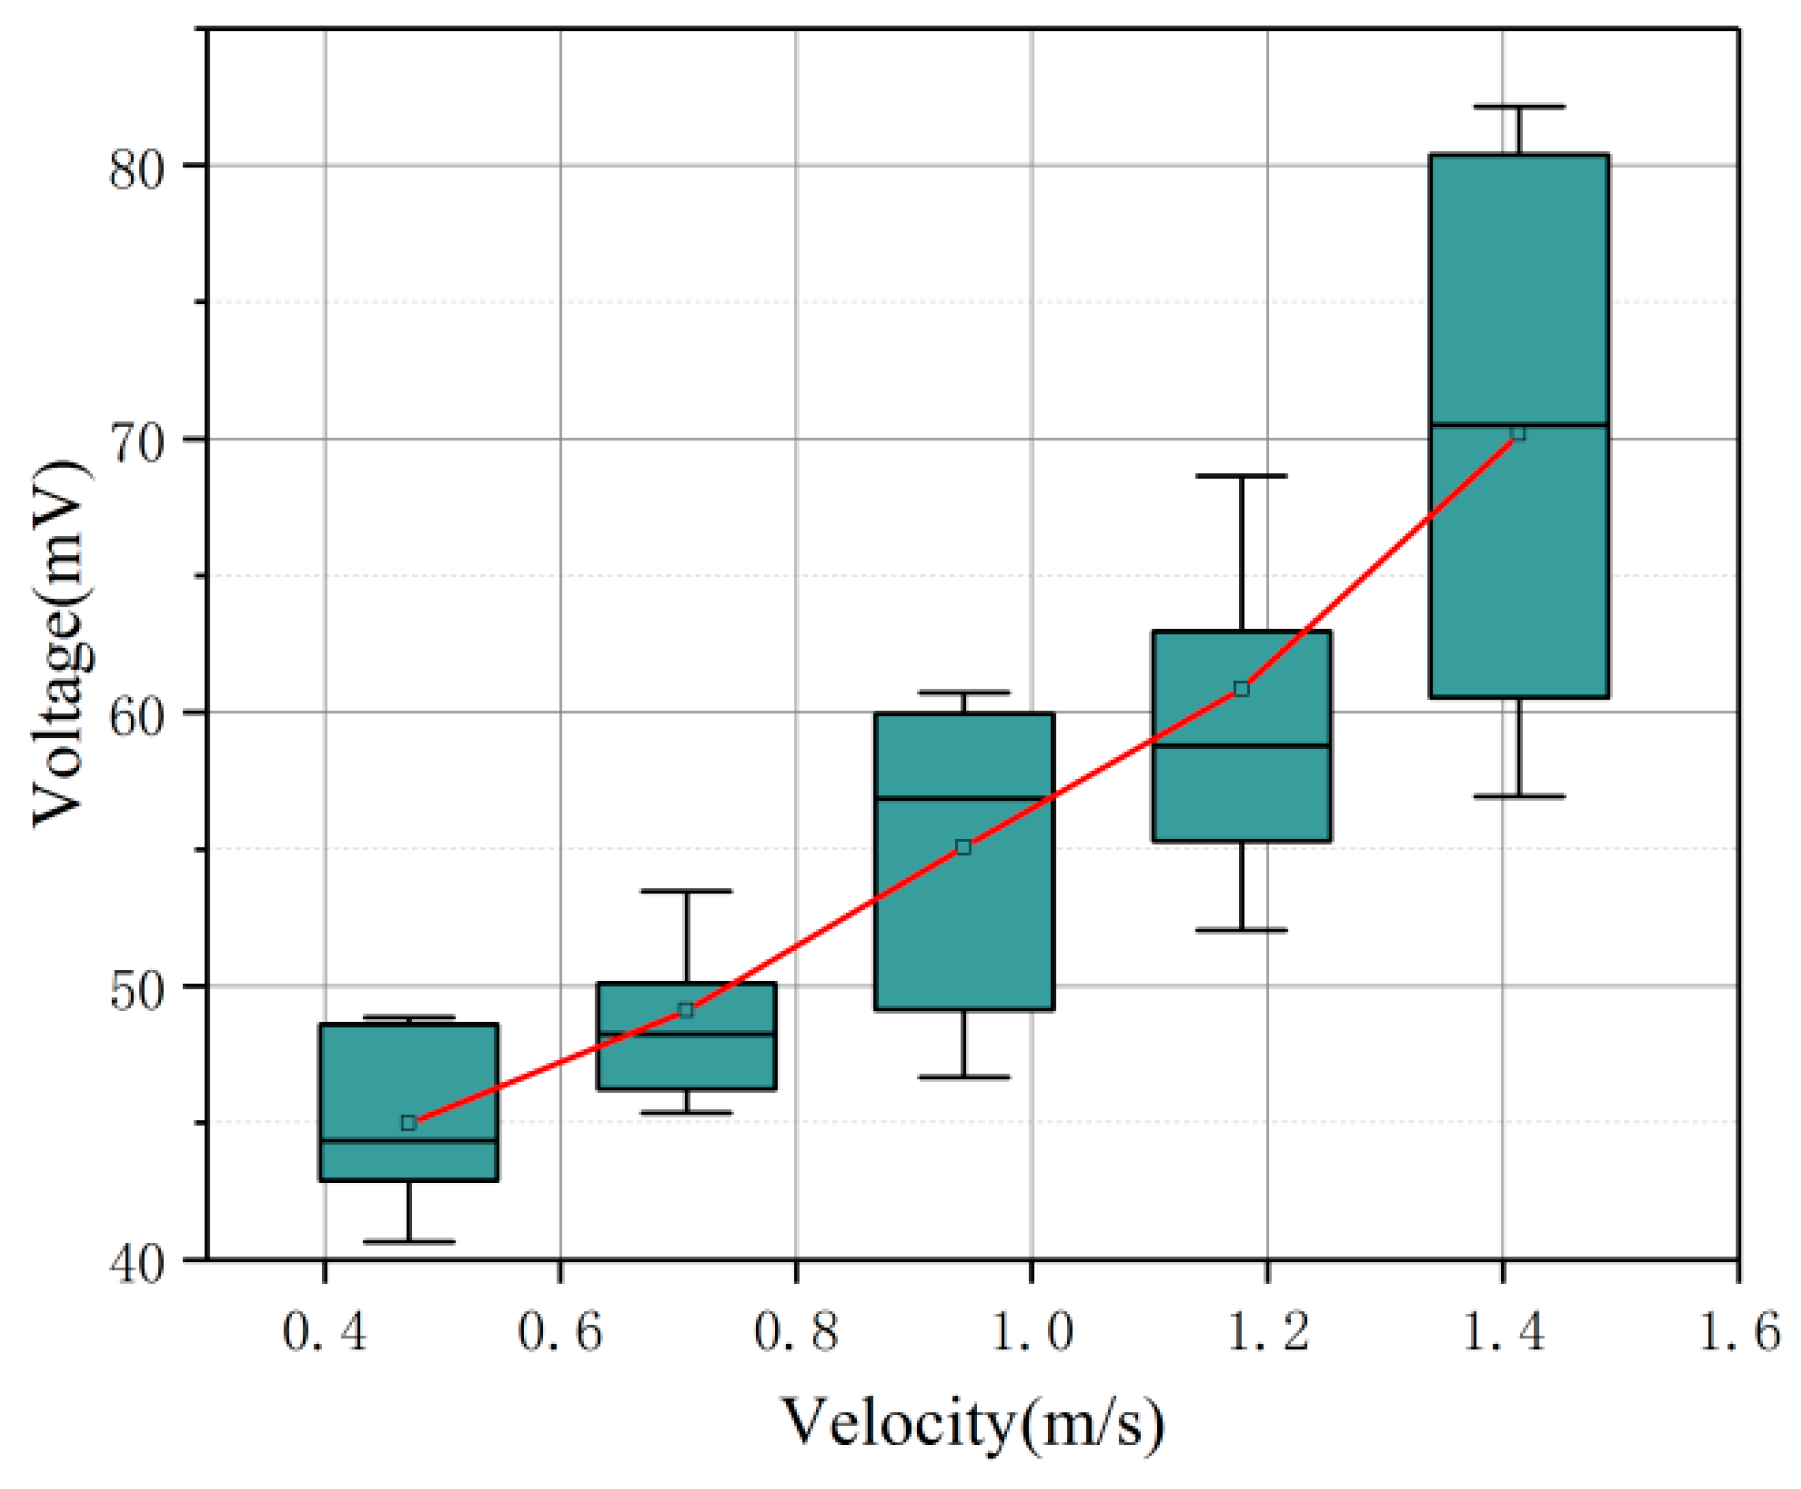
3.2.2. The Relation between the Debris Velocity and Induced Voltage

For the debris sensor based on the static magnetic field, the debris velocity is also a key factor of the sensor output. With a z-axis height of 1 mm and a drive current of 0.5 A, we let an iron particle pass the sensor at different speeds. The relationship between the debris speed and peak-to-peak values of the debris waveform are shown in Figure 11. It is observed that the induced voltage increased with the debris velocity. The standard deviation of the experimental data also increased with the velocity from 3.5 to 10.8. Furthermore, there was a linear relationship between the peak-to-peak value and exciting current, which correlates well with Equation (3).

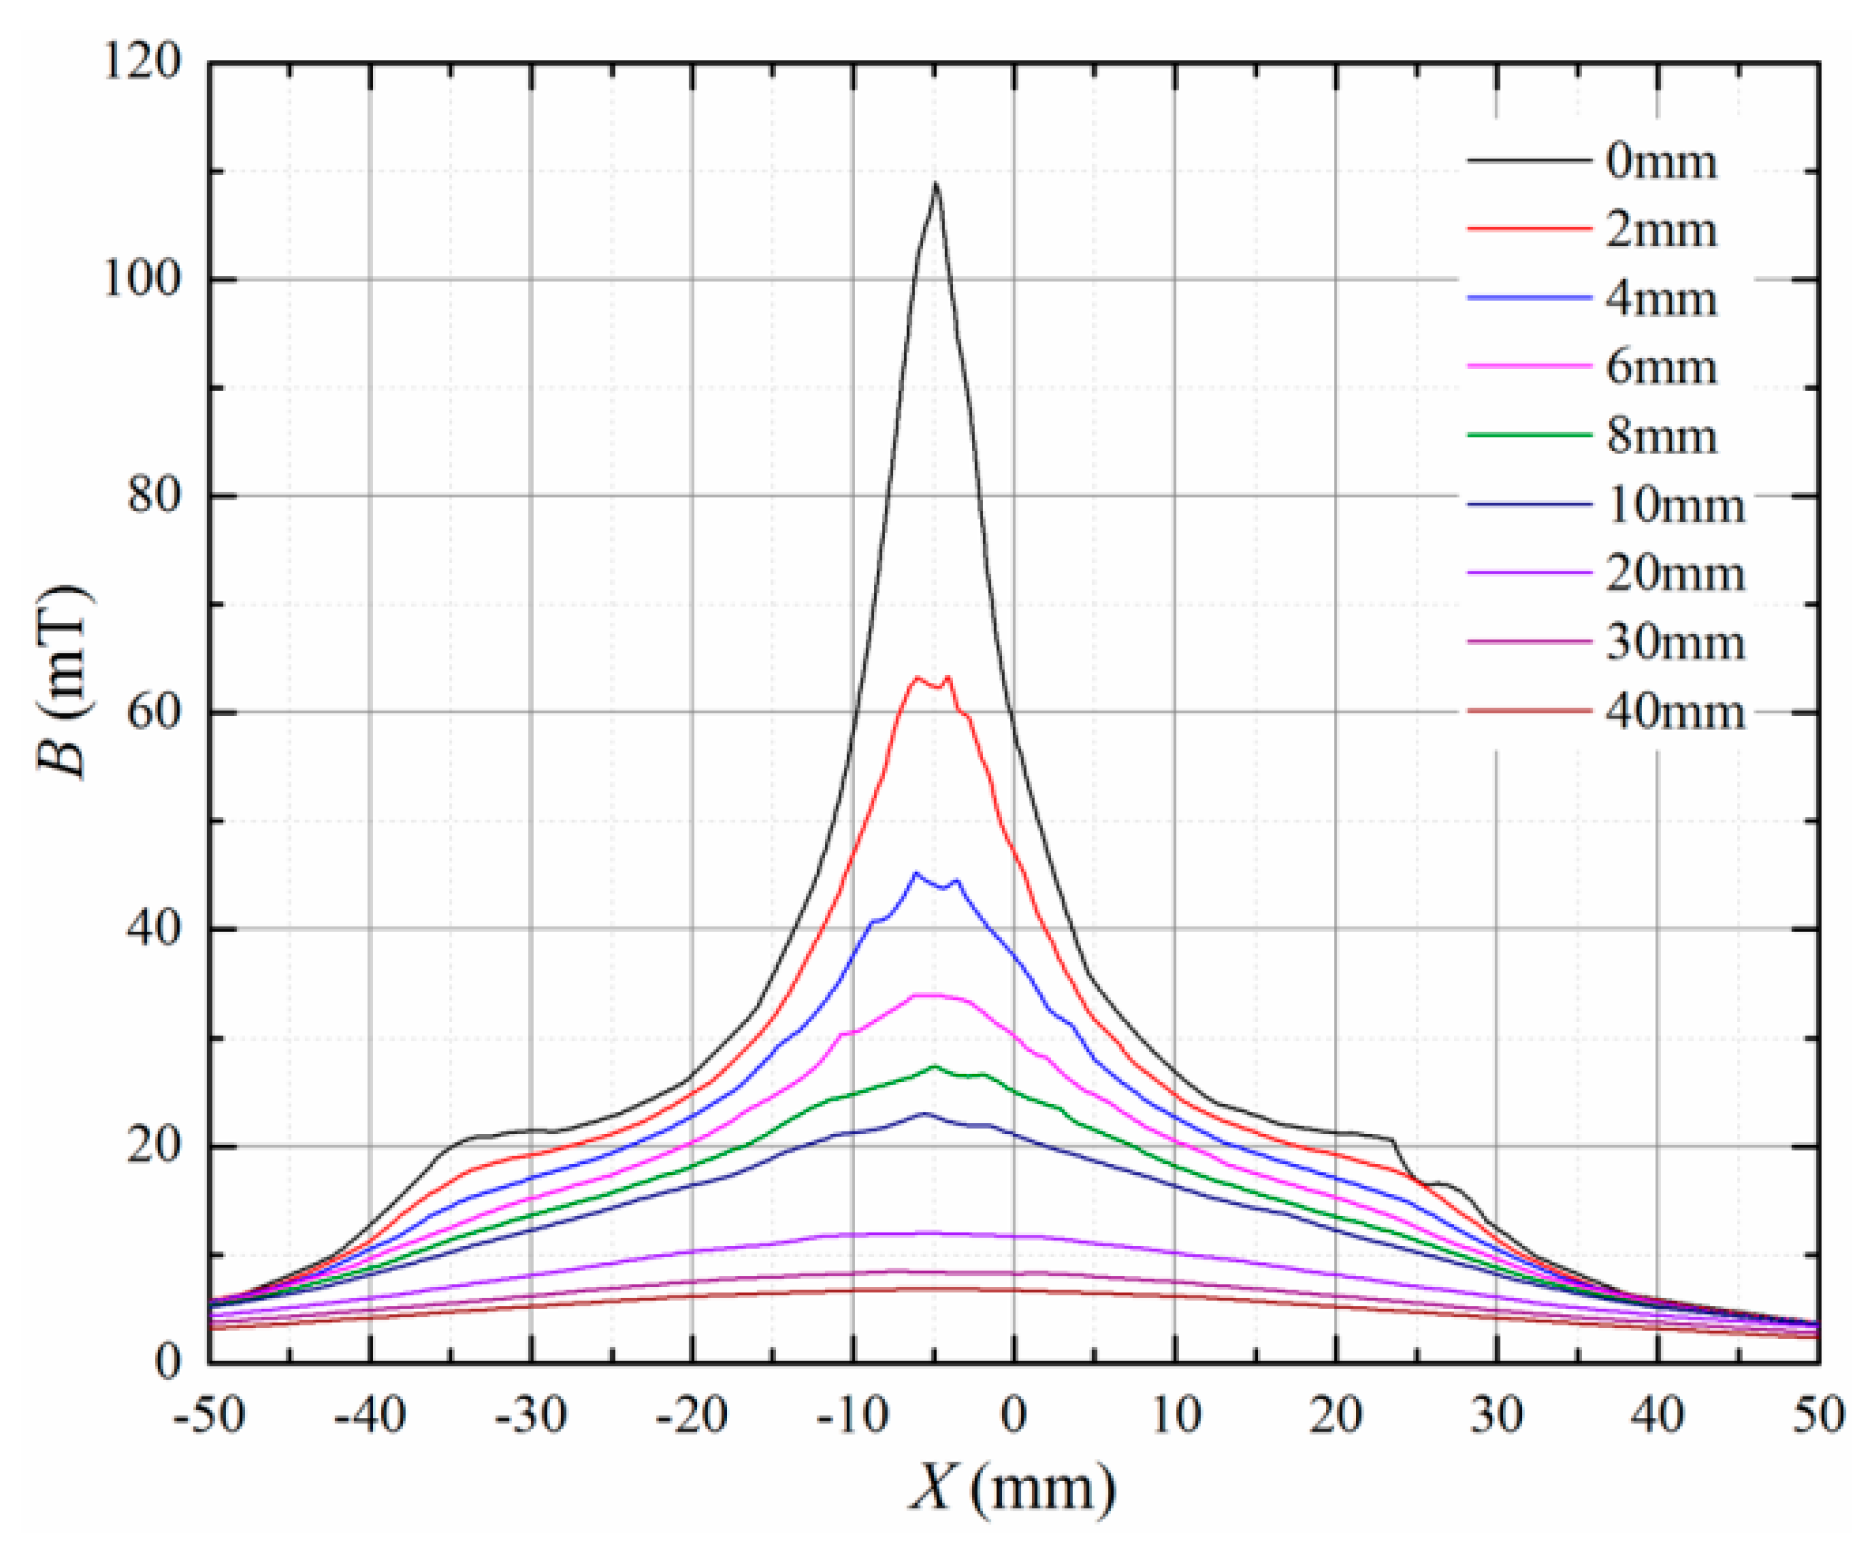
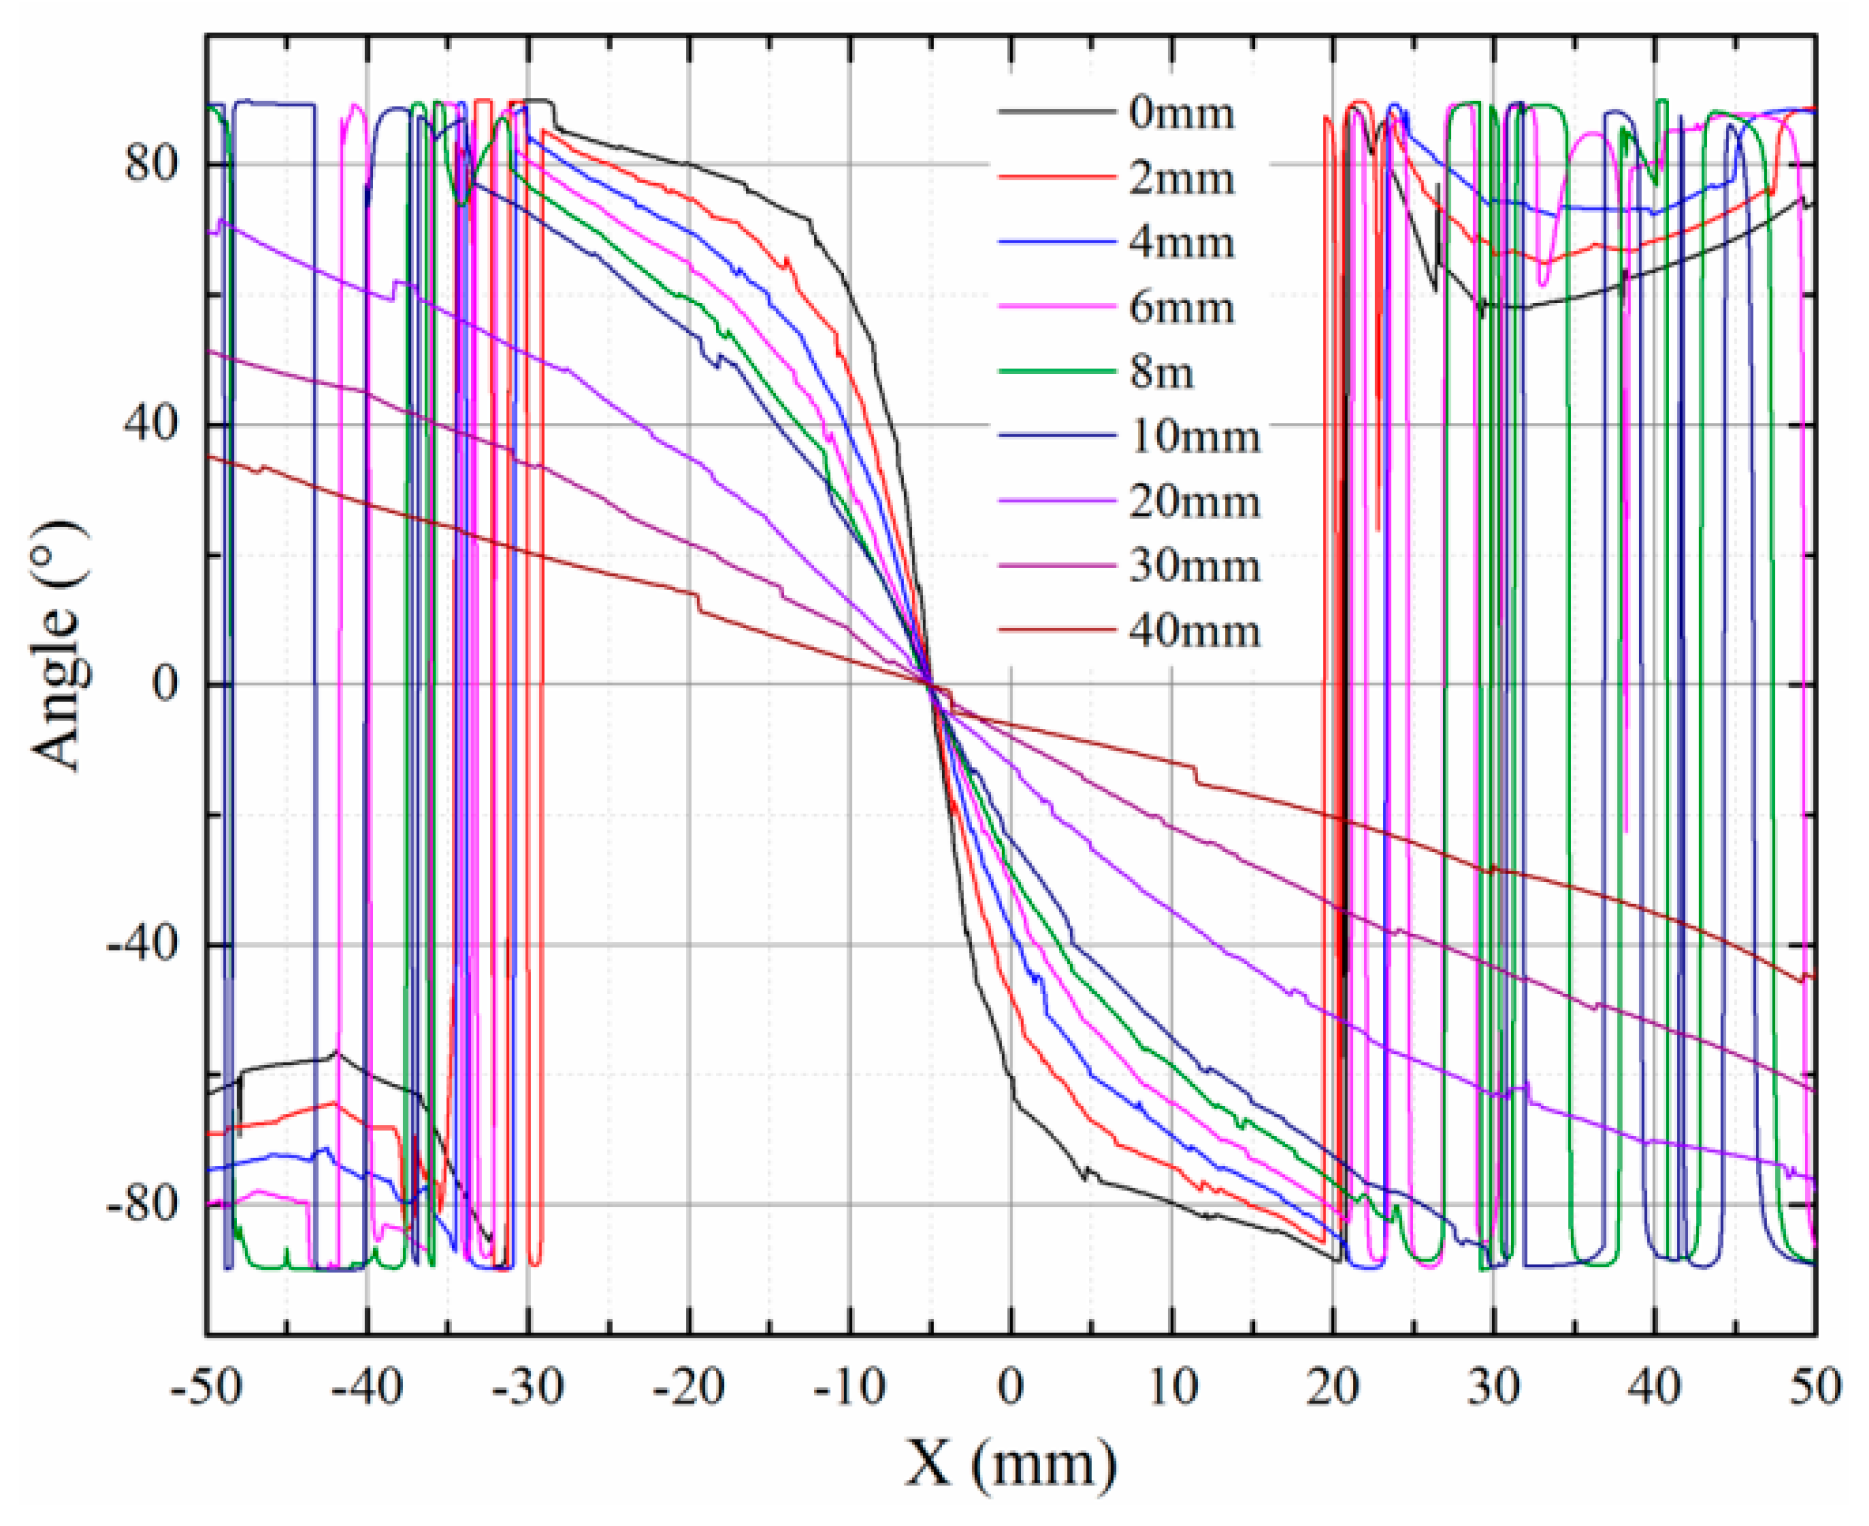
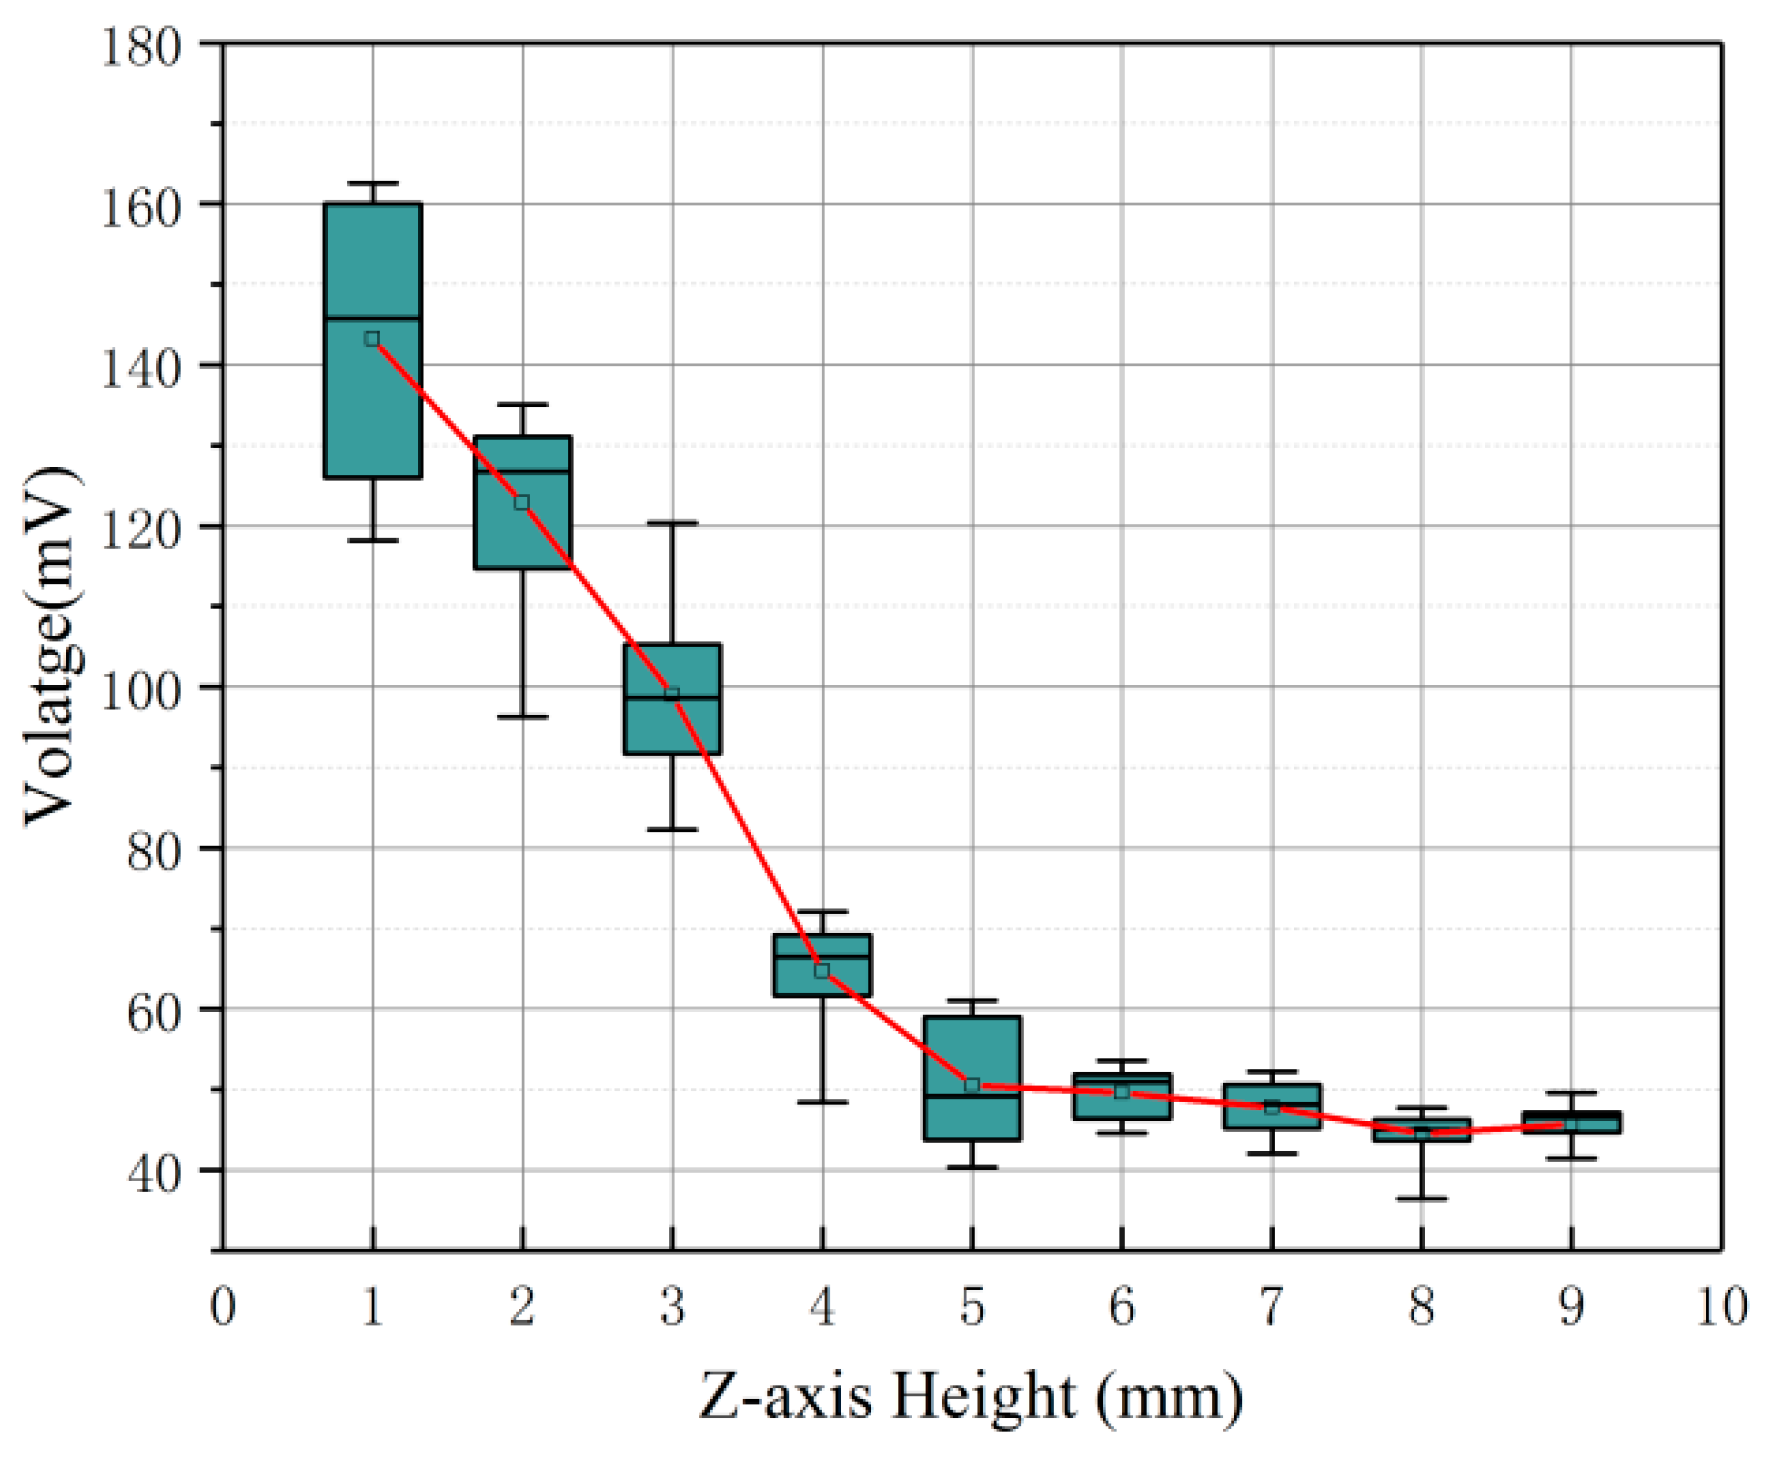
3.2.3. The Relation between the Z-Axis Height and the Induced Voltage

The excitation coil produced a high-gradient magnetic field, which decreased as the height increased along the z-axis direction. Consequently, when wear particles enter the magnetic field at different heights, the induced voltage generated by the debris cutting through the magnetic field will also change. The debris speed was set to 2.12 m/s, the current was set to 0.5 A.
Altering the height of the nylon thread can simulate the wear particles entering the magnetic field at different heights. The relationship between the z-axis height and the peak-to-peak values of the debris waveform are shown in Figure 12. The results show that the peak-to-peak values decreased as the z-axis height increased. From 1 mm to 4 mm, the peak-to-peak value attenuation was rapid, and from 5 mm to 9 mm, the attenuation was slow.
In addition, when the z-axis height was 1 mm, the signal-to-noise ratio (SNR) was 13.57, and when the z-axis height increased to 8 mm, the signal-to-noise ratio was 3.41. These results indicate that the sensor can effectively distinguish the maximum height of the z-axis of the wear debris signal up to 8 mm. Figure 13 shows the z-axis magnetic field distribution of the inductive sensor. Clearly, the variation trend of the induced voltages from different heights is consistent with the z-axis magnetic field distribution of the inductive sensor.

3.2.4. The Relation between the Debris Axial Distribution and the Induced Voltage

In the process of the continuous wear of friction pairs, more than one wear particle will be produced. When the spacing between the wear debris is too short, the induced voltage signals generated by the debris cutting the magnetic field will overlap, making it difficult to identify the size of each debris particle. To detect the influence of the spacing on the output voltage, we let two wear debris particles pass through the sensor at different spacing under the conditions that the speed of the stepping motor was set to 2.12 m/s, the z-axis height was set to 1 mm and the exciting current was set to 0.5 A.
The induced voltages of adjacent debris at different intervals are shown in Figure 14. The amplified background noise in the experiment was around 30 mV. When the spacing was less than 25 mm, the output signal waves overlapped, but when the spacing was 30 mm, the output signal waves were completely separate. As the spacing increases, the peak-to-peak value decreased.

3.2.5. Comparative Analysis

A. Comparison with previous work [25]
A test of an oil sample with <13 μm ferromagnetic particles was carried out. The drive current was 0.5 A, and the amplification factor was 30. A gear metering pump was used to flow the oil through the sensor at a rate of 3.75 L/min. As shown in Figure 15a, when there was no particle in the oil sample, the induced voltage was a random noise with a peak-to-peak value of 0.4 mV. When the oil contained particles, there were many substantial large surge voltages in the induced voltage signal, as shown in Figure 15b. The sensor proposed in this paper can detect 13 μm ferromagnetic particles. The previous sensor is able to identify 25 μm ferromagnetic particles at an amplification of 440 and a drive current of 0.4 A. Therefore, compared with previous sensors, the large-diameter sensor’s ability of detecting ferromagnetic particles is not significantly diminished.
In previous work, the diameter of the oil path was only 1.5 mm, the change of the magnetic field strength in the oil path was negligible, the radial position of the particle had negligible influence on the induced voltage, and all the particles flowing through the sensor can be detected. However, the smaller oil path increased the flow resistance of the lubricating oil, which easily causes oil path jam. The large-diameter sensor proposed in this paper can be used for monitoring large diameter lubricants without affecting the flow of lubricant. In particular, it is proposed that the diameter of the sensor can be changed according to the diameter of the oil path. When the diameter of the oil path exceeded 40 mm, a local strong high gradient magnetic field was formed in the oil path, thereby ensuring a strong induced voltage when the particles pass through. On the other hand, increasing the diameter of the oil path led to an important problem: when the diameter is small, the trajectory of the particles can be considered as a straight line. When the diameter is increased, the particles no longer move in a straight line, but a complex curve motion under the coupling of gravity, magnetic field and lubricating oil, which has a large influence on the induced signal. This issue will be studied in future work.
B. Comparison with other Sensors
Currently, many inductive debris sensors exist. Among them, the three-coil debris sensor is the most widely used due to its simple structure. The sensor is driven by high-frequency voltage, and its recognition accuracy is positively correlated with the frequency of the drive voltage [26]. When the diameter of the oil path increases, the drive voltage frequency must be increased to ensure the recognition accuracy, but this will increase the skin effect of the excitation coil, resulting in an increasing temperature of the sensor, which will affect the alternating magnetic field in the oil path. Ren et al. [22] proposed a new sensor structure, which includes multiple sensing coils inside an energizing coil. Although this sensor has a large diameter of 34 mm, the induction coils will invade into the inside of the oil path, which will increase the flow resistance of the lubricating oil and adversely affect the lubrication of the equipment. Hong et al. [24] proposed an innovative inductive sensor structure with a diameter of 20 mm. The magnetic field strength inside the pipe is about 100 μT, and the induced voltage signal is weak. If the diameter of the oil path is further increased, the magnetic field will be further weakened. The sensor proposed in this paper is driven by a constant current, which is not affected by the skin effect and does not change the flow resistance. As shown in Figure 3, a local area in the oil path is capable of generating a magnetic field of the order of 100 mT, which produces a stronger induced voltage signal.
For a large-diameter lubricating oil circuit, it is very difficult to achieve full flow monitoring of wear debris. More is to drill a bypass on the oil circuit, and then conduct on-line sampling and monitoring of the lubricating oil. This way changes the structure of the original lubricating oil circuit and changes the flow state of the lubricating oil, which may adversely affect the reliability and lubrication of the equipment. The sensor proposed in this paper generates a local high gradient magnetic field in a local area within the oil path. When the particle flows through the local area, a corresponding induced voltage is generated to achieve particle detection. In other words, the sensor only performs on-line sampling and detection on some of the particles flowing through the oil path, but the sensor does not need to set a bypass and does not change the flow state of the lubricating oil.

4. Conclusions

An inductive debris sensor for a large-diameter lube oil circuit based on a high-gradient magnetic field is presented in this paper. Its performance based on the debris velocity, current magnitude and radial height is illustrated by a number of experiments. The results indicate that the sensor is sensitive to iron debris, and that linear relationships exist between the induced voltage, the current, and debris velocity that correlate well with the equation of the induced voltage. The peak-to-peak value of the output voltage noise is not sensitive to the drive current of the excitation coil. The sensor only monitors wear debris with a z-axis height of less than 8 mm in a large-diameter pipe. In addition, when the axial spacing between two particles is less than 25 mm, the induced voltage signals of the two particles will exhibit aliasing.

5. Future Work

In future studies, first, since the induction coil is placed on the outer surface of the oil pipe, it is susceptible to electromagnetic interference, so it is necessary to reduce the background noise of the sensor and improve the SNR, thereby improving the detection accuracy of the sensor. Second, the sensor’s ability to detect non-ferromagnetic particles, such as copper particles, should be analyzed. Finally, the sensor can be used for the on-line monitoring of actual lubricant wear debris.

Author Contributions

Methodology, S.F.; writing—original draft preparation, S.F., X.W.; Data simulation, H.X., H.L.; writing—review and editing, S.F., X.W.; project administration, H.X.; supervision, J.L., H.L.; funding acquisition, S.F.

Funding

This research was funded by the National Science Foundation of China (No. 51605064 and No. 51705057), Science and Technology Research Project of the Chongqing Municipal Education Commission (No. KJ1704108), and Basic Research and Frontier Technology of the Chongqing Science and Technology Commission (No. cstc2017jcyjAX0126). Finally, the authors are very grateful to the anonymous reviewers for their helpful comments and constructive suggestions.

Conflicts of Interest

The authors declare no conflict of interest.

References

  1. Dupuis, R. Application of oil debris monitoring for wind turbine gearbox prognostics and health management. In Proceedings of the Annual Conference of the Prognostics and Health Management Society, Portland, OR, USA, 10–14 October 2010; pp. 10–16. [Google Scholar]
  2. Liu, Y.; Wen, S.; Xie, Y.; Zhao, F. Advances in research on a multi-channel on-line ferrograph. Tribol. Int. 1997, 30, 279–282. [Google Scholar]
  3. Rheims, J.; Wriedt, T.; Bauckhage, K. Sizing of inhomogeneous particles by a differential laser Doppler anemometer. Meas. Sci. Technol. 1999, 10, 68. [Google Scholar] [CrossRef]
  4. Hamilton, A.; Cleary, A.; Quail, F. Development of a novel wear detection system for wind turbine gearboxes. IEEE Sens. J. 2014, 14, 465–473. [Google Scholar] [CrossRef]
  5. Wu, T.; Wu, H.; Du, Y.; Kwok, N.; Peng, Z. Imaged wear debris separation for on-line monitoring using gray level and integrated morphological features. Wear 2014, 316, 19–29. [Google Scholar] [CrossRef]
  6. Nemarich, C.P.; Whitesel, H.K.; Sarkady, A. On-Line Wear Particle Monitoring Based on Ultrasonic Detection and Discrimination; David Taylor Research Center Bethesda Md Propulsion and Auxiliary Systems: Anaheim, CA, USA, 1988. [Google Scholar]
  7. Du, L.; Zhe, J. An integrated ultrasonic–inductive pulse sensor for wear debris detection. Smart Mater. Struct. 2012, 22, 025003. [Google Scholar] [CrossRef]
  8. Xu, C.; Zhang, P.; Wang, H.; Li, Y.; Lv, C. Ultrasonic echo waveshape features extraction based on QPSO-matching pursuit for online wear debris discrimination. Mech. Syst. Signal Process. 2015, 60–61, 301–315. [Google Scholar] [CrossRef]
  9. Zhe, J.; Choy, F.K.; Murali, S.V.; Sarangi, M.A.; Wilfong, R. Oil debris detection using capacitance and ultrasonic measurements. In Proceedings of the ASME/STLE 2007 International Joint Tribology Conference, San Diego, CA, USA, 22–24 October 2007; pp. 113–115. [Google Scholar]
  10. Wen, Z.; Yin, X.; Jiang, Z. Applications of Electrostatic Sensor for Wear Debris Detecting in the Lubricating Oil. J. Inst. Eng. 2013, 94, 281–286. [Google Scholar] [CrossRef]
  11. Keller, M.; Saba, C. Monitoring of ester base lubricants by dielectric constant. Lubr. Eng. 1989, 45, 347–351. [Google Scholar]
  12. Murali, S.; Xia, X.; Jagtiani, A.V.; Carletta, J.; Zhe, J. Capacitive Coulter counting: Detection of metal wear particles in lubricant using a microfluidic device. Smart Mater. Struct. 2009, 18, 037001. [Google Scholar] [CrossRef]
  13. Zhu, X.; Zhong, C.; Zhe, J. Lubricating oil conditioning sensors for online machine health monitoring—A review. Tribol. Int. 2017, 109, 473–484. [Google Scholar] [CrossRef]
  14. Miller, J.L.; Kitaljevich, D. In-line oil debris monitor for aircraft engine condition assessment. In Proceedings of the 2000 IEEE Aerospace Conference. Proceedings (Cat. No. 00TH8484), Big Sky, MT, USA, 25 March 2000; Volume 6, pp. 49–56. [Google Scholar]
  15. Becker, A.; Abanteriba, S.; Forrester, D. Determining inductive sensor wear debris limits for rolling contact fatigue of bearings. Proc. Inst. Mech. Eng. Part J J. Eng. Tribol. 2015, 229, 698–711. [Google Scholar] [CrossRef]
  16. Sheng, S. Monitoring of wind turbine gearbox condition through oil and wear debris analysis: A full-scale testing perspective. Tribol. Trans. 2016, 59, 149–162. [Google Scholar] [CrossRef]
  17. Tucker, J.E.; Galie, T.R.; Schultz, A.; Reintjes, J.; Lu, C.; Sebok, T.; Holloway, C.; Tankersley, L.L.; McClelland, T.; Howard, P.L.; et al. LASERNET fines optical wear debris monitor: A Navy shipboard evaluation of a CBM enabling technology. In Proceedings of the 3rd Intelligent Ships Symposium, Philadelphia, PA, USA; 1999; pp. 137–150. [Google Scholar]
  18. Du, L.; Zhe, J.; Carletta, J.E.; Veillette, R.J. Inductive Coulter counting: Detection and differentiation of metal wear particles in lubricant. Smart Mater. Struct. 2010, 19, 057001. [Google Scholar] [CrossRef]
  19. Du, L.; Zhe, J. A high throughput inductive pulse sensor for online oil debris monitoring. Tribol. Int. 2011, 44, 175–179. [Google Scholar] [CrossRef]
  20. Du, L.; Zhe, J. Parallel sensing of metallic wear debris in lubricants using undersampling data processing. Tribol. Int. 2012, 53, 28–34. [Google Scholar] [CrossRef]
  21. Du, L.; Zhu, X.; Han, Y.; Zhao, L.; Zhe, J. Improving sensitivity of an inductive pulse sensor for detection of metallic wear debris in lubricants using parallel LC resonance method. Meas. Sci. Technol. 2013, 24, 075106. [Google Scholar] [CrossRef]
  22. Ren, Y.J.; Li, W.; Zhao, G.F.; Feng, Z.H. Inductive debris sensor using one energizing coil with multiple sensing coils for sensitivity improvement and high throughput. Tribol. Int. 2018, 128, 96–103. [Google Scholar] [CrossRef]
  23. Hong, W.; Wang, S.; Tomovic, M.; Han, L.; Shi, J. Radial inductive debris detection sensor and performance analysis. Meas. Sci. Technol. 2013, 24, 125103. [Google Scholar] [CrossRef]
  24. Hong, W.; Wang, S.; Tomovic, M.M.; Liu, H.; Wang, X. A new debris sensor based on dual excitation sources for online debris monitoring. Meas. Sci. Technol. 2015, 26, 095101. [Google Scholar] [CrossRef]
  25. Feng, S.; Yang, L.; Qiu, G.; Luo, J.; Li, R.; Mao, J. An Inductive Debris Sensor Based on a High-Gradient Magnetic Field. IEEE Sens. J. 2019, 19, 2879–2886. [Google Scholar] [CrossRef]
  26. Myshkin, N.K.; Markova, L.V. Wear prediction for tribosystems based on debris analysis, On-Line Cond. Monit. Ind. Lubr. Tribol 2017, 131–201. [Google Scholar] [CrossRef]
Figure 1. The structure diagram of the induction sensor: (a) cutaway view; and (b) 3-D model.
Applsci 09 01546 g001
Figure 2. Working principle of sensor.
Applsci 09 01546 g002
Figure 3. Magnetic distribution in the large-diameter oil tube. (a) radial; (b) axial.
Applsci 09 01546 g003
Figure 4. Variation of the magnetic flux density over z-height.
Applsci 09 01546 g004
Figure 5. Variation of the angle α over z-height.
Applsci 09 01546 g005
Figure 6. Simulation wave (0.5 mm × 0.5 mm × 0.5 mm iron debris, 1000 AN magnetic potential, 1 m/s).
Applsci 09 01546 g006
Figure 7. Experimental rig.
Applsci 09 01546 g007
Figure 8. Output wave (0.90 mm length and 0.90 mm diameter iron debris, 2.12 m/s, 0.4 A exciting current).
Applsci 09 01546 g008
Figure 9. Variation in the output voltage with the current.
Applsci 09 01546 g009
Figure 10. Variation in the induced voltage noise with the current.
Applsci 09 01546 g010
Figure 11. Variation in the output voltage with the velocity.
Applsci 09 01546 g011
Figure 12. Variation in the output voltage with the z-axis height.
Applsci 09 01546 g012
Figure 13. Z-axis magnetic field distribution of the inductive sensor.
Applsci 09 01546 g013
Figure 14. Inductive voltages of two wear debris particles separated by different distances: (a) 10 mm; (b) 20 mm; (c) 25 mm; and (d) 30 mm.
Applsci 09 01546 g014aApplsci 09 01546 g014b
Figure 15. Results of the oil sample (a) without debris and (b) with <13 μm debris.
Applsci 09 01546 g015

