Article

Selection of Diagnostic Symptoms and Injection Subsystems of Marine Reciprocating Internal Combustion Engines

Faculty of Marine Engineering1, Maritime University of Szczecin, Szczecin 70-500, Poland
Appl. Sci. 2019, 9(8), 1540; https://doi.org/10.3390/app9081540
Submission received: 2 January 2019 / Revised: 28 March 2019 / Accepted: 8 April 2019 / Published: 13 April 2019

Abstract

:
This paper presents the planning of an experiment aimed at determining the scope of scientific research. It has been demonstrated in the conducted reliability investigations that main and auxiliary combustion engines, chosen as the objects of marine vessels, are the most unreliable components of injection apparatus as a weak link of a fuel feed functional system. The author seeks to use the minimum number of diagnostic parameters to obtain the maximum amount of information about the state of the test object. Reliability indexes, theoretical research and preliminary diagnostic tests were used to select the diagnostic signal reception points. In the initial determination of the measured quantities, the following methods were used: decomposition of the combustion engine on a functional systems, significant assemblies and elements, analysis of working and residual processes. Preliminary tests of the injection subsystem were carried out outside the internal combustion engine, as well as tests on real objects in laboratory conditions and in the conditions of marine vessels. To obtain a lot of information about the research object, a lot of diagnostic parameters were used at the beginning. On this basis, the preliminary selection of signals and diagnostic parameters related to the technical state was carried out, conducting the analysis in the various domains. Methodical and experimental diagnostic models were elaborated.

Graphical Abstract

1. Introduction

Complexity of the design of contemporary floating objects requires the development of appropriate methods to control their correct operation, which in turn justifies the desirability of developing effective methods for planning diagnostic experiments. Experience shows the need to develop optimal algorithms’ research proceedings, in particular for complex (multidimensional) mechanical objects with a high level of interferences [1].
As a result of diagnostic activities, large sets of measurement parameters are obtained. Therefore, there is a need to develop a database and select useful symptoms. Planning experimental research should provide answers to a number of questions, such as: what means of measurement should be used, how the measurement should be performed, what should be measured and how to infer.
The mathematical theory of experiment planning proposes scientifically justified methods that allow one to plan the experiment procedure in such a way as to receive the maximum amount of anticipated information at the lowest possible cost and time [2]. Planning for diagnostic experiments in the application of internal combustion engines dealt with include authors in the works [1,3,4] and if appropriate ISO 3534-3 standard. Facing the challenge of planning diagnostic experiments to be applied to internal combustion engines, the authors proposed a new approach to building the diagnostic model of complex mechanical objects.
The applied procedures of planning diagnostic experiments included the selection of features of the object’s state, diagnostic parameters and observation sites, as well as diagnostic symptoms. It results from the strategy of operation of objects based on their technical state aimed at in order to rationally plan diagnostic tests [1,4,5,6] and the ISO 3534-3 standard. This applies to both the optimization of the periodicity of diagnosed and the scope of diagnosis [6,7].
The literature describes many methods and plans for conducting research [5,6]. A typical experiment plan consists of the following elements [2]:
  • formulation of a research problem
  • definition of restrictions based on preliminary information about the test object
  • the proposal of a mathematical model
  • choosing a research plan based on the mathematical theory of experiment planning
  • test plan execution
  • analysis of the obtained results and implementation of the mathematical model by determining unknown parameters
  • verification of the mathematical model or a new model proposal
  • using the model to further study the object’s properties, including the optimal conditions for its functioning
The above-mentioned works in the field of experimental planning provide a significant contribution within the scope of research limitations [1], planning and performing an optimal experiment [2], pre-selection of diagnostic parameters and choice of principal test conditions [3], proposing a new approach to building the diagnostic model [4], determining of the points of conducting a factor experiment in a specific order [5] and application in the creation of a new quality [6]. The selection of measured quantities, locations of signal receiving points and conditions of testing combustion engines is typically made on the basis of literature-based knowledge, experience or intuition.

2. Planning Diagnostic Experiments

2.1. Criteria for the Selection of the Research Object

To take into account the rational amount of information about the technical condition of the tested object, the following should be selected using the experiment planning methods [1,4]:
  • the research object
  • type of experiment
  • locations of measuring sensors
  • measured quantities and observation sites
  • measurement methods and devices
  • test conditions
  • diagnostic symptoms
  • frequency of measurements
  • inference methods
The coverage of the entire ship with diagnostic tests is unjustified economically considering the performed functions and varied probability of damage to its components during operation. It is recommended to choose a research object that affects reliability, operating costs and performed functions by sea-going vessels.
The basic criteria for selecting a diagnostic test object include:
  • the responsibility of the assembly (element) in realising a task chain
  • functionality on the ship
  • the object’s impact on safety (people, goods and the environment)
  • unreliability
  • maintenance costs in upstate
The required reliability of a ship is called its value in the interval (0, 1) and a given value of time (0, ∞), which results from the needs [8]:
  • ensuring the safety of people, cargo and the environment
  • implementation of tasks
  • effective (optimal according to economic criteria) operation of a sea-going ship
Therefore, it is necessary to perform both a frequency analysis of events and an analysis of consequences. Every unintended event involving fatality or an injury, entire vessel loss or part failure of ship, other property loss or failure, or environmental damage which results in loss of ability or limitation of ability in any time interval to action may be considered a maritime accident [9]. Ships, wharfs and people are subject to sea accidents. In general, marine accidents can be divided into navigational, technical and of mixed nature. It is possible to estimate entire objects or detect weak links in the reliability chain.

2.2. Research Object Selection Methods

The selection of the object of research on a ship, which is a complex over-system, is important. A system O is a set of interrelated elements, referred to as called objects, related to each other and relationships among them Re [7]:
O = {O1, O2, …., On, Re1, Re2, …., Rem},
where: O1—element of the system O, i = 1, 2, …, n; Rej—relationships among elements of the system, j = 1, 2, …, m.
The most important indicators are indicators of reliability and safety of the operation of vessels and equipment installed on them [10,11]. They have an impact on the profitability and ecological aspects. Functional reliability of a motor vessel is the probability of correct performance of specific tasks by the vessel in a given time and under certain conditions of exploitation [8] (p. 15):
Rvs(τ) = {Rcp(τ)Rmp(τ)},
where: Rcp(τ)—reliability of the deck part of the ship, Rmp(τ)—reliability of the machinery part, τ—time.
The functional reliability of the deck part of a sea-going vessel can be specified by the following formula:
Rcp(τ) = Rnv(τ)Rst(τ)Rh(τ)Rc(τ)Rs(τ)Rma(τ)Rsh(τ),
where: Rnv(τ)—reliability of the navigation system, Rst(τ)—reliability of the steering system, Rh(τ)—reliability of the hull system, Rc(τ)—reliability of the cargo system, Rs(τ)—reliability of the safety system, Rma(τ)—reliability of the mooring and anchoring system, Rsh(τ)—reliability of the social-hotel system.
In turn, the functional reliability of the machinery part Rmp(τ) can be determined by the formula:
Rmp(τ) = Rmd(τ)Rpp(τ)Ras(τ)Rca(τ)Rsw(τ)Rfw(τ)Rf(τ)Ro(τ)Rog(τ)Rb(τ)Rba(τ)Rco(τ)Rac(τ),
where: Rmd(τ)—reliability of the main propulsion, Rpp(τ)—reliability of the power plant, Ras(τ)—reliability of the auxiliary steam system, Rca(τ)—reliability of the compressed air system, Rsw(τ)—reliability of the sea water system, Rfw(τ)—reliability of the fresh water system, Rf(τ)—reliability of the fuel system, Ro(τ)—reliability of the lubricating oil system, Rog(τ)—reliability of the outlet gases system, Rb(τ)—reliability of the bilge system, Rba(τ)—reliability of the ballast system, Rco(τ)—reliability of the cooling system, Rac(τ)—reliability of the air conditioning system. The risk level of each subsystem and element was estimated [9].
The reliability and economic indexes were used to determine the weak link of the seagoing vessels. Information on adverse events was collected from more than 1100 cases of one of the largest ship-owner in the world, mainly operating the bulk carriers. Information on adverse events was collected on the basis documentation of the department of the insurances and breakdowns of the ship-owner as well as the verdicts of the Maritime Chamber from the period of 12 years. In the investigations of adverse events, those contained in ISO 3534-3 standard and literature [1,2,6,9] were followed. The basic reliability indexes of the renewable facilities are the readiness coefficient, meaning the probability that in a certain instant the object is in the state of disability [2,4]:
k g = E ( τ z ) E ( τ z ) + E ( τ n ) ,
where: E(τz)—the expected value of the duration of the state of ability enabling the execution of the task, E(τn)—the expected value of the duration of the disability to perform the task.
Sea vessels may appear in one of the distinguished or technical states:
St = {Sti; i = 1, n}
where: St1—the state of full ability, St2—the state of partial ability, St3—the state of task disability, St4—the state of disability.
The technical readiness coefficient does not provide information on the impact of the disability state of the objects on the performance of the tasks by the object in the operating system. For data stored in the deck and engine room documents on the operation of piston marine engines, it is difficult to use them to estimate the readiness coefficient because the fault time of the combustion engines is not always recorded. Another possible use is the participation coefficient of undesirable events in the i-th subsystem of the ship (engine) Kes:
K e s = N e s N e o ,
where: Nes—the number of undesirable events of the i-th subsystem, Neo—the number of undesirable events of the object.
The results of the estimation of participation coefficient of the adverse events of the examined seagoing vessels are presented in Figure 1. From Figure 1a, it appears that most often the adverse events occurred in the navigation and cargo systems of the deck part. In the machine part, which the author represents, generally events occurred mainly in the main propulsion and power plant. However, when analysing the costs incurred due to the occurrence of adverse events, they were definitely related to the main propulsion engines, while those in the auxiliary engines, located in the engine room, come third in terms of costs. Unit cost indicator for an undesirable event of the ship kjz has been calculated according to the following formula:
K j s = C i s C e o ,
Cis—the costs of an undesirable event i-th system, Ceo—the total costs of all adverse events.
The greatest damage to the navigation system was dominated by losses caused by collisions of ships with other floating objects and by collisions with quays or a sluice on the entrance to the shoal. A loading system was predominantly affected by failures which occurred during cargo handling and the main propulsion by failures of reciprocating main engines.
The losses incurred due to adverse events initiated in the main propulsion system of the ship were the highest considering the prices of spare parts and failure repairs (Figure 1b). The most common adverse events in the main propulsion were generally the failures to piston combustion engines and their lack of readiness to operate. The requirement to ensure a high level of reliability of marine combustion engines results from the safety of shipping as a stoppage of the ship is associated with take out from use and reduction of profit, possible loss of cargo or collision, as well as the possibility of loss of human life or health [9]. Similar results include literature data where the reliability of the main propulsion engine had a principal influence on the ship’s technical readiness and the share of failure amounted to 40% of the undesirable events on the ship [8,9,10,11]. The drive of today’s operated ships is more than 90% of piston combustion engines and in the total costs of operating the ship, the costs of the engine room are at least 30% [12].
Considering the above, the reciprocating internal combustion engine was selected as a research object which has a significant impact on reliability, operating costs and functions performed by sea-going vessels. The main object of a sea-going vessel is therefore the self-ignition engine. Research into adverse events involving internal combustion engines has demonstrated the need for its upgraded diagnostics. Ensuring safety is not possible without the use of appropriate diagnostics.

2.3. Selection of the Location of Measurement Places

The marine combustion engine is a complicated object in respect to dynamics and kinematics. To determine the locations and areas of measurement of diagnostic signals, the methods that were used were those proposed in the literature [3,4,13]:
  • about the highest level of noise signal generated
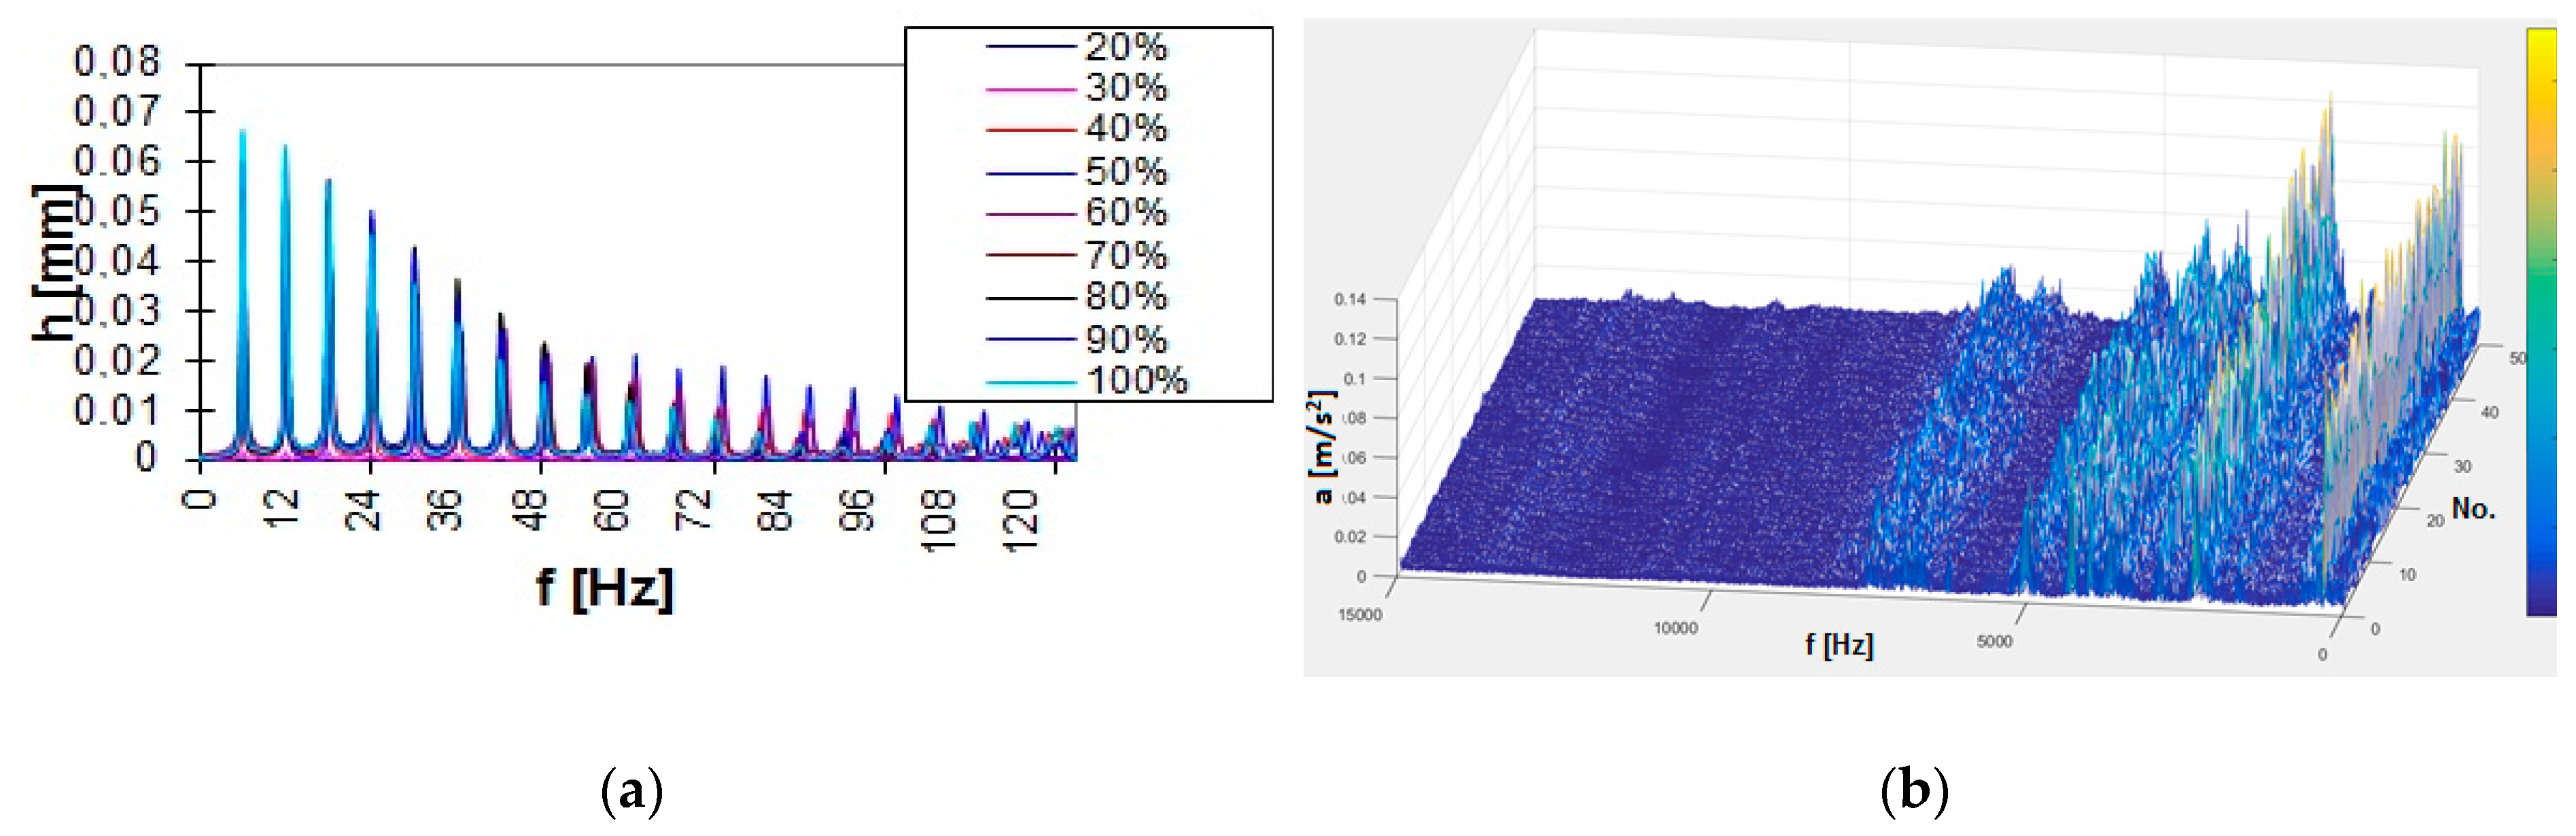
  • about the highest level of vibration signal generated
  • about the highest number of harmonics in the frequency spectrum
  • about the expected location of the damage signal generation
  • of places independent of each other
  • of reliability analysis
  • of preliminary test results
The selection of measurement points of diagnostic signals was made using reliability indexes. The tests were carried out for main propulsion engines and auxiliary marine engines of the same rotational speed and were fed with distillate and residual fuels. The purpose of these investigations was to assess the reliability of marine combustion engines by determining the values of reliability indicators for the engine as an object as well as for its basic assemblies, subassemblies and components. The reliability functions were estimated depending on the working time, however it has been shown that it is not a univocal relationship.
A hierarchical decomposition of the tested internal combustion engine at functional systems and elements included in its composition have been performed. As a complex object, the piston combustion engine consists of a structure of functional systems. The functional system in the reciprocating internal combustion engine accomplishes a partial objective, conditioning the achievement of a superior goal. The division of the engine into functional systems is the first level of its division into elements. The zero level represents the engine as the complex object. The next level is the functional systems of the engine, which realise partial objectives that enable the achievement of the objectives of the entire engine. Individual functional systems are further divided into subsystems which constitute the next level of hierarchical decomposition of the engine and accomplish partial objectives of the functional systems.
The engine was decomposed into layers of functional systems and assemblies, as shown in Figure 2, taking into account the division presented in the literature [7,13,14]. As the literature does not specify the limit of the engine, the author decided to include the collaborating installations. In this work, it was limited to the decomposition of engines up to three levels: engine, functional system, assembly. Each of the investigated engines was one of three with one non-working reserve and one working or two non-working reserves, depending on the load and operational situation.
This and their elements have been numbered according to the numbering system contained in the code book. The exception is components not covered by the code numbering system due to the fact that parts have been manufactured by other manufacturers than the engine manufacturer. The first digit means the functional system, e.g., 4—the fuel feed system; the next digit represents the assembly and its components, which are part of the functional system, 10—the injection pump as an assembly. The last part of the numeric block is the code number of the part specified by the engine manufacturer and included in the code book, H55 000—injection pump.
The reliability investigations carried out are aimed at estimating the values of reliability indicators of systems and components of tested engines in the operation phase. The operation phase, from the hand-over of the object to the user to the withdrawal from use, includes: awaiting the start of use, use, on-demand duty, stoppage between consecutive usage states, maintenance and awaiting maintenance.
The damage to the piston combustion engine was considered as random events because its occurrence is influenced by many factors: complex energy transformation processes, the impact of the environment and various operators. For reliability tests, information on the operation of 18 medium-speed engines by two ship-owners was collected according to the selected test plan. Reliability analysis was conducted on the basis of a passive experiment: data was obtained from machine documentation, computers’ databases, observation of conditions and work parameters during ship stops in ports and shipyards. The reliability assessment was carried out according to a specified plan, and in relation to the tests of the systems and engine components, it was carried out according to the plan (Noe, Ra, θk) [2]. This means that the observations were subject to the Noe = 18 engines. Combustion engines damaged in the analysed period were repaired (Ra) and tests of a particular engine were conducted from the beginning of operation and ended after three periodic maintenance (θk) sessions for classification of the ship. The observation period for one engine was on average about 34,000 h of work.
The article presents the results of auxiliary tests of marine engines of the same rotational speed and fuelled by distillate fuels due to restrictions on the use of residual fuels in many regions. Various reliability indicators can be used for reliability investigations [2,8,13,15,16,17] and this work used the indicator of the individual damages of individual functional subsystems and components of K s i d :
K s i d = N s i d N e s d   for   i   =   1 ,   2 ,   3 ,   ,   n ;
where: N s i d —number of damages of the i-th functional system, N e s d —number of damages in all functional systems of the investigated sample of the internal combustion engines.
Figure 3a shows that the most unreliable functional system in the quantitative terms is the fuel feed system of engines fuelled by distillate fuel; the second most unreliable is the working medium exchange system. The reliability analysis carried out for the functional systems of the engines showed that the most failing system of engines fuelled by residual fuel is the lubrication system [18]. Analogous estimates were made for the third level of decomposition of the investigated sample of combustion engines of one type and the indicator of the share of damages of particular elements was used K e i d :
K e i d = N e i d N e e d ,   for   i   =   1 ,   2 ,   3 ,   ,   n ;
where: N e i d —number of damages of the i-th functional system, N e e d —number of damages in all functional systems of the investigated internal combustion engines.
A similar analysis was carried out in order to select the most unreliable element of the internal combustion engine with the addition of the injection subsystem and the control valves grouped together (Figure 3b). The most unreliable component of this system as well as the entire engine is at the injector valve.
Therefore, the injection subsystem of internal combustion engines was selected as the study object. In the preliminary phase, this looked at the influence of the location of measuring sensors from the injection pump through the injection pipe of a length of 460 to 860 mm to the injector on the values of diagnostic parameters and as presented in works [3,19].

3. Results of Diagnostic Tests

3.1. Selection of the Type of Experiment

For diagnostic tests aimed at determining the relation between the diagnostic parameter and the technical state, the following types of experiment were distinguished: active, passive and passive–active. An active diagnostic experiment consists of deliberately changing the features of the state and measuring the corresponding changes in signals. Its disadvantage is the necessity of repeated dismantling and assembly which results in changes in the technical state, hence it is usually used to study the influence of control and disturbances on the values of the signal vector. The active experiment was used in tests of the injection subsystem outside the internal combustion engine. The tests were divided into the preliminary ones where the influence of individual input variables (power supply, control and test conditions) on the values of diagnostic parameters and basic research was investigated, and the principal ones, where the influence of representative features of the technical state on the values of diagnostic parameters, was examined. The engine tests, conducted in the laboratory and on marine vessels, included both a passive and passive–active experiment. The preliminary tests were performed to examine the influence of engine load on the diagnostic parameters. In the principal tests, the features of technical state during prophylactic maintenance and post damage were examined.
The passive–active experiment was conducted on the basis of data collected in two measurement points. The technical state was identified upon starting a new engine or an engine after scheduled maintenance, as well as before scheduled maintenance or failure.

3.2. Quantities Initially Included in the Studies

Diagnostic tests of marine diesel engines, mainly power generators, were carried out in two stages: in laboratory conditions at the Maritime University of Szczecin and in the operating conditions of significant shipowners on sea-going ships. The initial stage consisted of measuring the output variables y (diagnostic parameters, engine operation parameters) dependent on the value of input quantities x (engine load, location of measurement sensors), with the influence of the values assumed as constant (technical state of the internal combustion engine) and unavoidable disturbing quantities (internal and external conditions of the engine and the impact of other marine engine facilities). The elementary characteristic is the course of changes in the value of the diagnostic parameter as a function of any variable that determines the test conditions. The number of elementary characteristics Lc will be equal to:
Lc = MipzjncNltpm,
where: M = {Mi}—signal reception place (location of the sensor), pz = {pzj}—injection pump supply pressure, n = {nc}—camshaft speed, N = {Nl}—fuel setting, tp = {tpm}—temperature of fuel supply.
In order to analyze the influence of particular test condition vectors on changes in the diagnostic parameter values, coupled characteristics were obtained (for one changing input quantity and the steady-state of the others).
The principal stage consisted of measuring the output variables Y (diagnostic parameters, engine operation parameters) at changing input variables X (state characteristics of the internal combustion engine, crankshaft speed or camshaft speed, fuel type and physicochemical properties of the fuel, control settings) and under the influence of quantities assumed as steady Cs (engine load, rotational speed of the crankshaft) and unavoidable interference magnitudes Z:
Y = f(X, Mi, pzj, nc, Nl, tpm, Cs, Z),
To obtain a large amount of information on the test object, a large number of diagnostic parameters related to the technical state was used. Comprehensive preliminary tests were carried out and signal parameters were chosen which were correlated with the input quantities in preliminary studies. The following signals were used: acoustic pressure, pressure in the injection subsystem and in the engine cylinders as well displacement, velocity and vibration acceleration signals received at various locations of the injection subsystem [18].
The measuring sensors were calibrated before measurements. The measurement circuit consisted of sensors, amplifiers, power supplies, terminal connection and a computer or laptop with an analog-to-digital card and a meter of reference parameters. An integrated signals acquisition and analysis system was applied with analogue-to-digital processing and data recording with an appropriate sampling frequency, having regard to the ISO 13374-4:2015 standard. The data acquisition system consisted of a device archiving the large number of data in the operating memory which were controlled by a portable computer and after being saved and given to further analysis using, among others, the Matlab Simulink computer program.
Bench tests of the injection subsystem outside the engine demonstrated low usefulness of acoustic pressure signals which is why after the initial research, they were abandoned in further studies [3]. The Figure 4a,b present the time waveforms of displacement and vibration signals, respectively, used for the assessment of the injection apparatus.
The technical state of the injector has an impact on unit fuel consumption, values of engine operation parameters, toxicity of outlet gases and level of noise generated by the engine, etc. These are the main factors determining the progress in the construction and operation of internal combustion engines. The injection sub-system was selected for diagnostic tests. The test results depend on the adopted internal combustion engine limit and the accepted failure criterion.
In the testing of the injection subsystem outside the engine, an active experiment was carried out. Tests of real combustion engines were performed which use active and passive–active experiments, taking into account the advantages and disadvantages of particular types of plans. The plan was used to study the influence of power supply, control and disturbances on the values of diagnostic parameters of the injection subsystem outside the engine and to select the conditions for conducting the principal tests.
The vibration displacement and pressure signals were polyharmonic where the spectres’ super-harmonics represented multiples of crankshaft speed frequency (Figure 5a). The time waveforms of velocity and acceleration signals were also polyperiodic and more disturbed (Figure 5b). Vibration processes are characterized by high speed of information transmission; they reflect significant physical processes occurring in the object (deformations, stresses, collisions of elements) and enable global and local assessment [1,3,4]. The Figure 5b shows high repeatability of the spectra at synchronous averaging which does not require a large number of measurements for the analysis.

3.3. Determination of Test Conditions

In diagnostic tests, conditions for running the experiment are important for credibility and reproducibility of results. Conditions of experiments on combustion engines are defined by [3,4,14,20]: operational measure of ageing, rotational speed, load (from idling to 110% load), steering, temperature of the cooling medium and parameters of the surrounding air. The type of work of the internal combustion engine is also important: transient work or steady-state work, start-up, coasting or stoppage and safety are the most important onboard ships. The states of non-stationary work are also transitions between stationary types of work. Signals in transitions between different states of stationary modes of engine operation were not recorded in order to avoid beats in the signal and blur of the spectrum. Load changes of internal combustion engines were carried out by switching on electric energy receivers or by using a water resistor.
The internal combustion engine should be tested under specific conditions defined by the set of physical quantities [21]:
C = {C1, C2, …, Cin},
The engine operation status is described by the set of physical quantities of Sp [21]:
Sp = {Sp1, Sp2, …, Spin},
The work of an internal combustion engine is the set, which is the sum of collections of operating conditions and the state of operation of an internal combustion engine:
W = CS = {P1, P2, …, Pin},
where:
Wi = Ci + Spi,
In real operating conditions of the self-ignition engine, besides load changes and rotational speed, there are still factors related to ambient parameters [3,13]:
  • pressure, temperature and relative humidity of the environment
  • operating conditions associated with increasing the resistance of the air filter, the temperature of oil and cooling water
For engines with self-ignition, the ambient parameters, according to the ISO 15550:2002 standard reference conditions, should be:
  • total barometric pressure 100 kPa
  • air temperature 25 °C
  • relative humidity 30%
  • charge air coolant temperature 25 °C
The following parameters of the test conditions were taken into account during the construction of the diagnostic model: operating time θ, relative load RL, coolant temperature tw, correction factor for normal conditions according to ISO. With other values of ambient parameters, correction of diagnostic parameters to normal conditions according to ISO is required.
In the tested range of rotational speed changes of the camshaft, their influence on the values of the majority of amplitude estimates and spectral parameters of signals is visible (Figure 6a). Generally, with the increase of the rotational speed of the camshaft, an increase in the value of diagnostic parameters and doses of fuel injected by the injector nozzle is observed.
It was assumed that in the preliminary tests [3], if the diagnostic parameters are correlated with the input quantities (e.g., with engine load), they would also correlate with the technical state in the principal research of the complete engine [19]. The amplitude estimates of signals were defined at works [1,4]. The determined selective multiple test was used to investigate the effects of the: feeding, steering and interferences on the values of diagnostic parameters of the injection subsystem outside the combustion engine and the conditions of principal research were selected [19].
Therefore, the covariate parameters with engine load should be taken into account since they are usually correlated with the technical state (Figure 6b). At the same time, it is a verification of the significance of the influence of selected input quantities on the output quantities where very strict relations were obtained.
When looking for useful methods of signal analysis, wavelet analysis was used, among others. As an example, a continuous wavelet transform (CWT) of the vibration acceleration signal a(τ) is defined in the time and frequency domain [1]. The continuous wavelet transform of the vibration acceleration signal a(τ) is defined in the domain of time and frequency:
C W T a T = 1 | α | + a ( τ ) ψ * ( τ t α ) d τ
where: α—scaling parameter, T—the location of the window in the time domain, t—shift of wavelet in time domain, *—complex coupling, ψ(τ)—is an acceptable basic wavelet.
An example of continuous wavelet analysis DWT is shown in Figure 7, where the frequency of the vibration acceleration signal does not change over time. The wavelet transform was also used for the reduction of interference of the signals in in-ship conditions.

3.4. Selection of Signals and Diagnostic Parameters

The experiment planning methods were also applied in the selection of useful diagnostic symptoms. The signal vector was reduced in the preliminary tests which use statistical measures [1,3,4,19]. The basis for this was a correlation matrix for the selection of parameters independent of one other.
The coefficient of correlation was determined between values of diagnostic parameters obtained in subsequent measurements and independent variables by the formula:
k = i = 1 n ( x i x ¯ ) ( y i y ¯ ) i = 1 n ( x i x ¯ ) 2 i = 1 n ( y i y ¯ ) 2
where: i—the sequence number of the input or output quantities, xi—successive value of the given entrance size, x ¯ —average value of the input quantity in the set of observations, yi—successive value of the given diagnostic parameter, y ¯ —average value of the diagnostic parameter in the set of observation.
A hypothesis of a lack of correlation between variables was also tested. The similarity of bivariate distributions of the input quantities and diagnostic parameters in the general population was examined. Based on the test results, the hypothesis was verified that the measured input values X and the diagnostic parameters Y are not correlated, i.e., Ho: k = 0, against the alternative hypothesis H1: k 0. The value of the correlation coefficient k from the sample and the Student’s t-value were calculated:
t = k 1 k 2 n 2
If inequality is obtained from the comparison of the calculated value of t with the critical value, the Ho hypothesis about the lack of correlation between diagnostic parameters and the input quantities should be rejected. When, on the other hand, it has no basis to reject the null hypothesis Ho, the variables mentioned are not correlated (the number “0”).
Values of the correlation coefficient [3,4,19] for assessment of the usefulness of exemplary diagnostic parameters in time, amplitudes, frequency and wavelet domain was presented in work [18].
For the assessment of diagnostic parameters, the values of statistical measures were also determined for the spectral parameters in the preliminary tests and are presented in Table 1. A second degree spectral moment is calculated from the formula:
m 2 = f 2 S ( f ) d f
The values of the correlation coefficient within the scope of very strict dependencies (more than 0.9) were considered useful (Figure 8). The statistical analysis presented enabled the preliminary reduction of the observation vector in the principal research. Spectral polyharmonic symptoms in the low frequency band have proved to be the most useful in the studies conducted hitherto [3,19].
The preliminary research, although time and labour intensive, has made it possible to set the general directions of the study, shorten the time of principal research and specifies its conditions.

4. Conclusions

The article presents the criteria for selecting the test object with the example of the marine vessels, without reliance on dubious and partial literature data in this respect. When analysing undesirable events of sea-going vessels, both the number of failures and their technical and economic consequences should be taken into account. The most unreliable objects of sea-going vessels are main combustion engines, the most unreliable functional system is the fuel feed system and the most unreliable elements are injection valves in the injection subsystem.
Methods for the selection of measurement sites using the criterion of reliability and preliminary test results are presented. The input quantities in the preliminary diagnostic tests of exemplary marine medium speed combustion engine are: the relative load of the engine (preset and measured), the delivered dose of fuel, etc. The principal research uses the technical state of the engine as the input quantities. In studies, this proved to be useful in the active and passive–active experiments.
The parameters of operation of an internal combustion engine, such as the crankshaft (camshaft) rotational speed as well as of reference parameters and of working mediums (temperature and pressure of oil, water and fuel on the engine’s inlet), are considered to be disturbances to the value of diagnostic symptoms, hence the need to determine and maintain them on a fixed level.
The results of the correlation of the diagnostic parameters with the engine load authorize us to presume that changes of the mentioned parameters will show a good correlation with the changes of properties of the technical state of the elements of the injection subsystem in the sea-going ship conditions, which has been confirmed in the results of the hitherto research.
In the principal research, further reduction of the diagnostic parameters of signals such as displacement, velocity, acceleration of vibrations, as well as fuel pressure in the injection subsystem and in the cylinders of internal combustion engines can be made based on the relations with the technical state.

5. Patents

Monieta, J. Method and device for diagnosing injectors. Patent of the Polish Republic 2008, no. 199362B1, pp. 1–6.

Funding

The research work has been financed from means of Scientific Research Committee in 2003 as research project [5T12D 00524].

Acknowledgments

This research outcome has been achieved under the research project “Ecological and economic aspects of the operation of selected elements of marine energy systems” No. 1/S/IESO/2014 financed from a subsidy of the Ministry of Science and Higher Education for statutory activities.

Conflicts of Interest

The author declares no conflict of interest.

References

  1. Żółtowski, B.; Cempel, C. Elements of the theory of technical diagnostics. In Engineering of Diagnostics Machines; Society of Technical Diagnostics: Bydgoszcz, Poland, 2004; pp. 17–525. [Google Scholar]
  2. Migdalski, J. Planning experiments in reliability. In Reliability Engineering; University of Technology and Agriculture in Bydgoszcz, ZETOM Warsaw: Bydgoszcz, Poland, 1992; pp. 123–157. [Google Scholar]
  3. Monieta, J. Preliminary diagnostic investigation of injectors of marine diesel engines. Expl. Prob. Mach. 2003, 1, 169–185. [Google Scholar]
  4. Tomaszewski, F. Problems of Determination of a Complex Mechanical Structure’s Technical Condition Using Vibroaccoustic Signal. Habilitation Dissertation, Poznan University of Technology, Poznan, Poland, 1998. no. 337. [Google Scholar]
  5. Korzyński, M. Experiment Methodology; WNT: Warsaw, Poland, 2013. [Google Scholar]
  6. Polanski, Z. Planning Experience in Creating Quality; Statsoft: Kraków, Poland, 1999; pp. 37–46. [Google Scholar]
  7. Woropay, M. Method of Building Multilevel Systems for Testing Reliability Made of Elements with Established a Priori Significance. Habilitation Dissertation, no. 18. University of Technology and Agriculture in Bydgoszcz, Bydgoszcz, Poland, 1983. [Google Scholar]
  8. Czajgucki, J.Z. The Method of Implementation of the Postulate of the Required Reliability of Marine Engine Power Plants in the Process of Their Design; WSM: Gdynia, Poland, 1991. [Google Scholar]
  9. Revised Guidelines for Formal Safety Assessment (FSA) for Use in The Imo Rule-Making Process; London Se1 7sr, MSC-MEPC.2/Circ.12/Rev.2; International Maritime Organization: London, UK, 2018; pp. 1–71.
  10. Tarełko, W. Methodology of Designing Exploitation Properties of Complex Technical Objects; Library of Problems of Exploitation, Gdynia: Radom, Poland, 2011. [Google Scholar]
  11. Girtler, J.; Kuszmider, S.; Plewiński, L. Selected Issues of the Operation of Ships in the Safety Aspect of the Navigation; Maritime University of Szczecin: Szczecin, Poland, 2003. [Google Scholar]
  12. Banks, J.; Hines, J.; Lebold, M.; Campbell, R.; Begg, C.; Byington, C. Failure modes and predictive diagnostics considerations for diesel engines. Report: New Frontiers in Integrated Diagnostics and Prognostics. In Proceedings of the 55th Meeting of the Society for Machinery Failure Prevention Technology, Virginia Beach, VA, USA, 2–5 April 2001; pp. 93–102. [Google Scholar]
  13. Witkowski, K. The correct selection of diagnostic parameters of marine diesel engine and their minimization of as a necessary action in the formation of diagnostic algorithm. J. KONES Power Trans. 2017, 24, 287–292. [Google Scholar] [CrossRef]
  14. Kontovas, C.A.; Psaraftis, H.N. Formal safety assessment: A critical review. Mar. Technol. USA 2009, 46, 45–59. [Google Scholar]
  15. Dong, C.; Yuan, C.; Liu, Z.; Yan, X. Marine propulsion system reliability research based on fault tree analysis. Adv. Shipp. Ocean 2013, 2, 27–33. [Google Scholar]
  16. Grzywaczewski, Z. Reliability of Ships; WEMA Machine Industry Publishers: Warsaw, Poland, 1988. [Google Scholar]
  17. Adamkiewicz, W.; Hempel, L.; Posiadło, A.; Sliwinski, R. Research and Evaluation of Machine Reliability in the Transport System; WKiŁ: Warsaw, Poland, 1983. [Google Scholar]
  18. Monieta, J. Experiment designing in operating investigations of sub-assembly of the marine energy systems. Environment, Energy & Earth Sciences. E3S Web of Conferences. In Proceedings of the 3rd Internal Conference on Energy and Environmental Protection, Krakow, Poland, 13–14 September 2018; pp. 19–25. [Google Scholar] [CrossRef]
  19. Monieta, J. Control diagnosis of marine diesel engines injectors with utilization of the parameters of the working and concomitant process. Ex Probe Mach. 2001, 4, 167–179. [Google Scholar]
  20. Pietak, A. Operation of the Engine with SI Conditions of Dynamically Changing Loads. Diagnosis of CI Engines Based on Transient Processes. Habilitaion Dissertation, Poznan University of Technology, Poznan, Poland, 1999; pp. 21–34. [Google Scholar]
  21. Chłopek, Z. Some remarks on engines testing in dynamic states. Com. Eng. Pol. 2001, 143, 60–71. [Google Scholar]
Figure 1. Results of the estimation of the rate of frequency of adverse events in functional systems of the seagoing vessels under analysis (a); estimates of the unit cost indicator of adverse events in functional systems of the surveyed seagoing vessels (b): nv—navigating, st—steering, h—hull, c—cargo, s—safety, ma—mooring and anchoring, sh—socio-hotel, mp—main propulsion, pp—power plant, as—auxiliary steam, ca—compressed air, sw—sea water, fw—fresh water, f—fuel, o—oil, eg—outlet gases, b—bilge, ba—ballast, co—cooling, ac—air conditioning.
Applsci 09 01540 g001
Figure 2. Fragment of the block diagram of the hierarchical decomposition of the marine combustion engine intended fuelled with distillate fuels: 0—engine level, 0.1—engine block, 0.2—piston-crank system, 0.3—exchanges of the working medium system, 0.4—fuel feed system, 0.4.1—settling tank, 0.4.2—transport pump, 0.4.3—filter of the transport pump, 0.4.4—fuel service tank, 0.4.5—centrifuge filter, 0.4.6—fuel centrifuge, 0.4.7—strainer fuel filter, 0.4.8—fine filter, 0.4.9—booster fuel pump, 0.4.10—injection pump, 0.4.11—injection pipe, 0.4.12—injector, …, 0.4.16—check valve, 0.5—lubrication system, 0.6—cooling system, 0.7—starting system, 0.8—automatic steering and control system.
Applsci 09 01540 g002
Figure 3. Diagram participation of individual damages of functional systems of marine engines fuelled by distillate fuels: 1—block, 2—piston-crank, 3—exchange, 4—starting air, 5—feed, 6—lubricating, 7—cooling, 8—control and steering (a); (b) diagram of the most unreliable 12 auxiliary engine components and selected subsystems: 1—injector valve, 2—double oil filter, 3—foundation frame, 4—piston ring, 5—outlet valve, 6—air filter, 7—inlet valve, 8—cylinder head, 9—fine fuel filter, 10—injection pump, 11—oil bypass filter, 12—fuel pipe, Is—injection subsystem, Vio—intake and outlet valve.
Applsci 09 01540 g003
Figure 4. Sample time waveforms of the displacement vibration signal h of the injector needle for the fuel setting 70% (a); time waveforms of the vibration velocity signal v processed in the injection subsystem in the frequency range 0–20 kHz at a 40% relative load of engine (b): τ —time.
Applsci 09 01540 g004
Figure 5. Influence of the fuel setting in the range of 20–100% on the spectrum of displacement vibration signals in the 0–125 Hz frequency band (a); the cascade spectrum of the vibration acceleration signal in the injection subsystem in the 0–15 kHz frequency band (b): f—frequency.
Applsci 09 01540 g005
Figure 6. The influence of rotational speed of camshaft nca on values of amplitude estimates of acceleration vibration signal on the injector valve for fuel setting 58% along with an approximation line for the polynomial model (a); (b) the effect of engine load on the amplitude measures of vibration acceleration signals received in the injection subsystem along with an example error field: aver—average value, peak—crest value, p-p—peak to peak value, rms—root-mean-square value, rmsblower borderline, rmst—upper borderline, RL—relative load.
Applsci 09 01540 g006
Figure 7. An example of original acceleration vibration signal (a) and continuous wavelet transform (b).
Applsci 09 01540 g007
Figure 8. Correlation coefficient k and results of H1 alternative hypothesis testing (1), that the input quantities (dose of fuel) in preliminary studies are correlated for the symptoms of spectral vibration displacements; fo—rotational frequency.
Applsci 09 01540 g008
Table 1. The values of statistical measures of the pressure spectral symptoms in the engine cylinder for individual relative loads of the internal combustion engine: Hsa—average value of amplitude harmonic in spectrum, σ2—variance, σ—standard deviation, m2—the second degree central moment, Hcrms—root-mean-square value of amplitude harmonic in spectrum, Ran—range.
MeasureEngine Relative Load [%]
0255075100
Hca0.02150310.0251280.0297250.0334320.037543
σ20.00149990.0021390.0030580.0044420.005621
σ0.03872830.0462470.0552960.0666480.074976
Hcrms0.49572770.5889870.7025160.8343180.938233
m4−0.61845−0.61837−0.61838−0.61837−0.61837
Ran0.19459140.2325220.281550.3441970.387929

