Abstract
In order to reduce stormwater runoff, permeable brick was prepared by compounding with fly ash and steel slag as the main substrate. The study found that the amount of steel slag has a significant influence on the compressive strength of permeable brick. When the proportion of steel slag is 6.5%, the compressive strength of permeable brick after 28 days curing can reach 26.32 MPa. The strength of permeable brick decreases with the increase of fly ash content, but the permeability coefficient increases significantly. The results show that the compressive strength and permeability coefficient of permeable bricks can reach a good level when the composite ratio of steel slag is 6%, fly ash is 30%, and the design target of porosity is 20%.
1. Introduction
In recent years, the rapid urbanization has led to a large area of urban surface covered by impervious materials such as concrete, resulting in a significant increase in surface rainwater runoff, which not only aggravates the pollutant load of the receiving water body, but also makes urban flood control and urban stormwater management face more severe challenges [1,2]. On the other hand, China, as an industrial power, has a large output of steel slag and fly ash. Although it has been applied in the fields such as building materials, its second utilization rate is still at a low level [3,4]. Existing studies found that steel slag and fly ash have a significant removal effect on phosphorus in wastewater [5]. Therefore, this kind of industrial waste residue can be mixed into permeable brick by certain technical means and used for urban pavement or riverbank paving, which can not only reduce rainwater runoff and reduce phosphorus pollution, but also recycle industrial waste [6,7,8].
Based on the above background, the experiment used fly ash and steel slag as the base material, basalt crushed stone and cement as the aggregate and adhesives supplemented by a plant-type foaming agent. The constituents were stirred and mixed in the container, then injected into the formwork for forming and curing. The optimum material mix ratio was determined by investigating its influence on the permeability and strength of the permeable brick. On this basis, the intensive research on the compressive strength and water permeability coefficient of the permeable brick after forming was carried out with reference to the relevant ASTM standards and regulations.
2. Materials and Methods
2.1. Test Materials
Steel slag and fly ash were used as the base material for the preparation of permeable brick. Basalt gravel was used as the aggregate and cement was used as the binder. A small amount of plant foaming agent was added to expand the porosity of the material. The mixture of steel slag and fly ash has good thermal stability and no obvious change in thermal expansion coefficient at normal temperature. Combined with the previous research results, factors such as compressive strength, porosity, water permeability, and material forming were taken into comprehensive consideration [9,10], and relevant parameters of the prepared materials were selected as follows:
Cement (C): P.O 42.5 ordinary Portland cement; Steel slag: ≥90 mesh; Fly ash: ≥70 mesh; Basalt gravel (G): Gravel with a particle size of 2.36–4.75 mm and 4.75–9.5 mm continuous grade; Plant cement foaming agent: pH value 4.5 ± 0.5, specific gravity 1.28 ± 0.02; Water (W): General tap water. The particle size distribution of the substrate is shown in Table 1.

Table 1.
The size distribution of the substrate.
The fly ash used in the test was taken from the raw ash storage yard of a power plant. The main oxide components are shown in Table 2.
Table 2.
Percentage of oxides in fly ash.
The steel slag used in the test was taken from the water quenching slag of a steel plant without magnetic separation, which was taupe powder with a density of about 2.64 g/cm2. The oxide content and particle size distribution are shown in Table 3.
Table 3.
Percentage of oxides in steel slag.
2.2. Laboratory Apparatus
The main test instruments were as follows: pH-101B type mv/pH meter (Jiangsu Cody Instrument Factory, Jiangyan, China, 2015); TG328A analytical balance (Shanghai Balance Instrument Factory, Shanghai, China, 2014); GZX-9070MBE type electric heating constant temperature blast drying box (Shanghai Boxun Industrial Co., Ltd. Medical equipment factory, Shanghai, China, 2015); HH-8 digital display thermostatic water bath; SH2-82 constant temperature oscillator (Guohua Electric Co., Ltd., Changzhou, China, 2014); 752 UV-visible spectrophotometer; General “Dutch brick” plastic template; Self-made permeability coefficient penetration instrument; YES-2000 digital display pressure testing machine (Jinan Xulian Instrument Equipment Factory, Jinan, China, 2013).
2.3. Preparation Process
In combination with the static pressure forming process and the vibration forming process, the materials were mixed, stirred, and placed in the “Dutch brick” plastic mold. It was stirred again evenly to make it natural. The natural maintenance period is 28 days [11,12].
When calculating the amount of different aggregates, the “volume method” in Specification for Mix Proportion Design of Ordinary Concrete (JGJ55-2011) was adopted to design the material mix proportion. The formula is as follows [13]:
In the formula, , , , , and are the amount of basalt gravel, water, cement, fly ash, and steel slag in one cubic meter permeable brick slurry (unit: kg), respectively. The , , , , are the apparent densities of basalt gravel, water, cement, fly ash, and steel slag (unit: kg/m3). The is the percentage of air content in the slurry, here the value is equal to one.
2.4. Research Method
2.4.1. Study Method of Compressive Strength
The compressive strength of the samples in this test was measured according to ASTM C109/C109M-12, Standard Test Methods for Compressive Strength of Hydraulic Cement Mortars. Therefore, the sizes of the permeable brick samples were 50.8 mm × 50.8 mm × 50.8 mm, and the samples were continuously and uniformly pressurized by a hydraulic universal press. The loading speed was controlled to be 0.5 MPa/s. Compressive strength was calculated according to the following formula [14]:
In the above formula, is the compressive strength (MPa) of the sample, is the breaking load (N) when the sample is broken, and A is the pressure receiving area (mm2).
At the beginning of the test, the strength of the samples of each group was tested for seven days and cured for 28 days to ensure that the various parameters adopted in the subsequent test met the relevant standards of permeable bricks [15,16]. Secondly, the water-cement ratio, steel slag content, fly ash content, and porosity were set as variables, and the proportion design schemes of different groups were determined according to the characteristics of different variables. Finally, based on the test results, the effects of different variables on the compressive strength of permeable brick were discussed.
2.4.2. Study Method of Permeability
The permeability coefficient of the permeable brick was determined according to ASTM D2434-68 [17] and ASTM C1781/C1781M-15 [18]. The water permeability coefficient test device is shown in Figure 1 [19,20]:
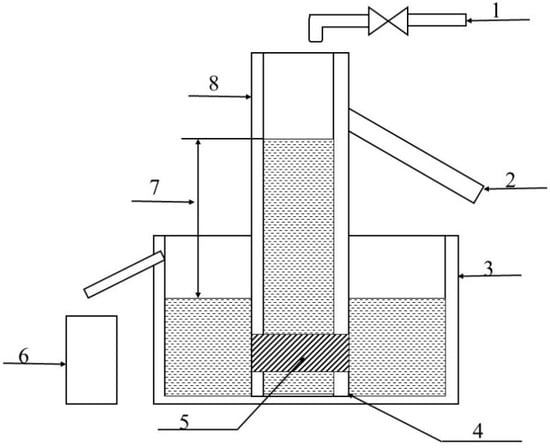
Figure 1.
The water permeability coefficient test device (1—water supply system, 2—overflow port, 3—overflow water tank (the water tank with the drain port and maintaining a certain water level), 4—bracket, 5—permeable brick sample, 6—measuring cylinder, 7—water level difference, 8—water cylinder (a cylinder with an overflow and maintaining a certain water level)).
The permeability coefficient was calculated according to the following formula [17,21]:
In the above formula, is the water permeability coefficient (cm/s) of the sample at a water temperature T °C, is the amount of water oozing (mL) in time t seconds, L is the thickness (cm) of the sample, and A is the upper surface area of the sample (cm2), H is the water level difference (cm), and t is the time (s).
The results were averaged over three samples with an accuracy of 1.0 × 10⁻³ cm/s.
The viscosity of water is determined by the nature of the water itself and generally decreases with increasing temperature [22]. Therefore, the lower the temperature, the worse the permeability of permeable brick. The permeability coefficient of the sample is affected by the water viscosity to some extent, so the measured results must be converted after the test to obtain the standard permeability coefficient. The water temperature at 15 °C is the standard temperature, and the water permeability coefficient at the standard temperature should be calculated according to the following formula:
In the above formula, is the permeability coefficient (cm/s) of the sample at the standard temperature, is the dynamic viscosity coefficient (kPa·s) of water at T °C, and is the dynamic viscosity coefficient of water at 15 °C (kPa·s).
3. Results and Discussion
3.1. Effects of Different Variables on Compressive Strength
The compressive strength tests were carried out for different variables. The test results are summarized in Table 4.
Table 4.
The compressive strength of permeable bricks at different water cement ratios.
As shown in Figure 2, when the water-cement ratio is less than 20%, with the increase of water-cement ratio, the compressive strength of the permeable bricks increases, but the range is considerably small. When the water-cement ratio is about 28%, the compressive strength after seven days (28 days of curing) reaches the maximum, which is 27.54 MPa (27.23 MPa). When the water-cement ratio is larger than 28%, the compressive strength decreases significantly with the increase of the water-cement ratio. This is because when the water-cement ratio is less than 20%, the slurry prepared for water-permeable brick is insufficiently hydrated, its fluidity is weak, the workability of concrete is poor, and concrete vibration and compaction are very difficult. The coating layer and bonding layer on the surface of aggregate particles are not evenly distributed. Therefore, the mechanical performance is relatively weak. When the water-cement ratio is about 28%, the slurry is fully hydrated, the structural layer is evenly distributed, the overall structural stability is reliable, and the effective void ratio of the formed brick is less, so the compressive strength exhibits a maximum value. When the water-cement ratio continues to increase, the cementitious material located at the upper part flows to the lower part of the structural layer under the action of gravity, resulting in blockage of the concrete bottom and the insufficient thickness of the upper surface slurry, which reduces the compressive strength of the permeable brick [4].
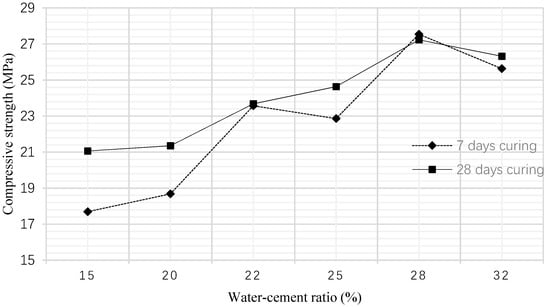
Figure 2.
Compressive strength under different water-cement ratio conditions.
As seen from Table 5 and Figure 3, when the proportion of steel slag is less than 6%, the compressive strength of permeable brick will increase with the increase of steel slag proportion. When the content of steel slag continues to increase, the compressive strength increases within a small range. This is because part of the steel slag can fill the voids during the preparation of the brick, increasing the contact point between the slurry particles, thereby causing the compressive strength increase within a certain range. When the internal voids of the slurry are fully filled, the compressive strength reaches the maximum value and it no longer increases [12].
Table 5.
Compressive strength at different steel slag contents.
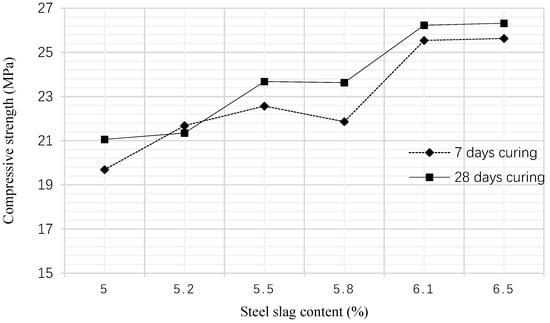
Figure 3.
Compressive strength at different steel slag contents.
In order to make the permeable brick having a certain compressive strength, in the subsequent tests, the proportion of the steel slag was adjusted to 6.5%.
It can be seen from Table 6 and Figure 4 that the fly ash content has a great influence on the compressive strength of the permeable brick. With the increase of the fly ash content, the compressive strength of the permeable brick shows a downward trend. When the fly ash content is 30%, the compressive strength of the 28 days curing permeable brick reaches a maximum value of 26 MPa. This is because of the poor plasticity of fly ash. When the proportion of the fly ash increases, the overall mechanical properties of the shaped permeable bricks are closer to the fly ash, so the compressive strength decreases [9]. Therefore, in subsequent tests, the proportion of fly ash was controlled to 30%.
Table 6.
Compressive strength at different fly ash contents.
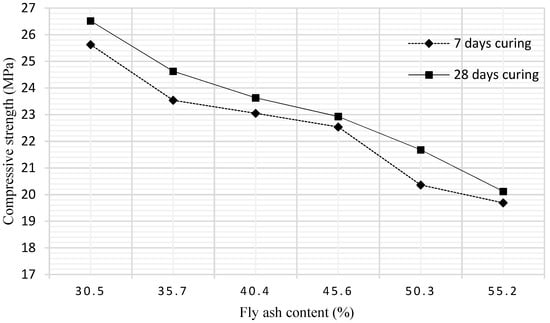
Figure 4.
The compressive strength at different fly ash contents.
Porosity is the main parameter reflecting the structure of permeable concrete. The porosity can also basically reflect the water permeability of permeable concrete. At the same time, porosity also provides direct information for the mix design.
It can be seen from Table 7 and Figure 5 that the compressive strength of the permeable bricks decreases with increasing porosity. This is because when the porosity increases, the contact points and contact faces between the various components of the permeable brick decrease, so it is liable to be destroyed under external force [12]. Fitting the data in Figure 5, it is found that there is an approximate relationship between the compressive strength and porosity of the permeable brick.
where F is the compressive strength of permeable brick and p is the observed porosity.
Table 7.
The 28 days curing compressive strength at different permeable brick porosity.
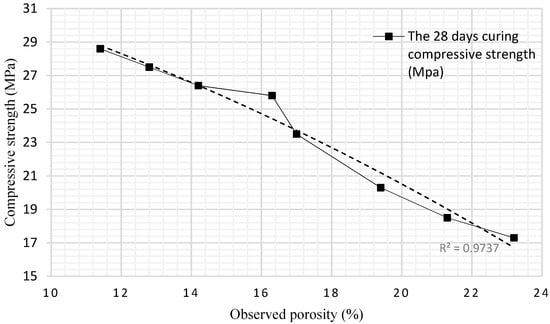
Figure 5.
The 28 days curing compressive strength of different observed porosity.
3.2. The Influence of Different Variables on Permeability
In the analysis of the water permeability of the molded permeable brick, only three variables (steel slag content, fly ash content, and porosity) were selected. A suitable mix design scheme is obtained by variable analysis. The test results are organized as shown below.
As seen from Figure 6, the permeability coefficient of permeable brick fluctuates between 1.08 cm/s and 1.16 cm/s when the proportion of steel slag content changes, and there is no obvious alteration. This is because the steel slag has a small particle size and is wrapped by fly ash. At the end of the molding, a reasonable space is still left so that the water can still be infiltrated through the pores [5].
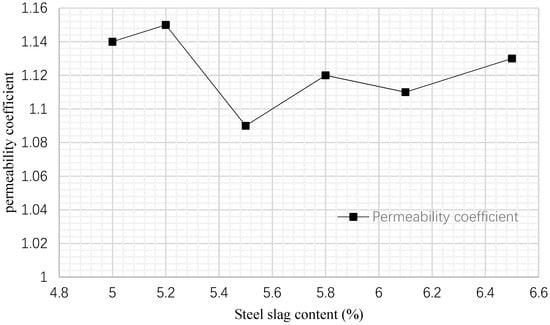
Figure 6.
Permeability coefficient corresponding to different steel slag content.
As seen from Figure 7, when the fly ash content rises from 30% to 55%, the permeability coefficient of the permeable brick increases gradually from 1.12 cm/s to 1.21 cm/s. This is because the fly ash particles are mixed with other materials during the slurry forming process to form colloidal particles which have a smaller particle size. No further polymerization occurs between such colloids. When the content of fly ash increases, the number of colloidal particles grows and the space between the particles expands, so the water permeability coefficient also increases [3]. The purpose of this study was to use fly ash and steel slag to make permeable bricks. The key objective was to improve the proportion of fly ash and steel slag in permeable brick as much as possible. When the content of fly ash is 30%, the compressive strength of permeable brick can meet the requirement to use this material.
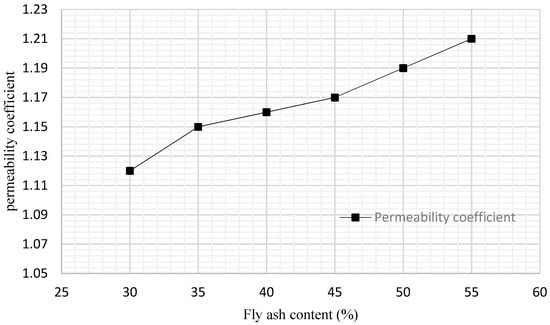
Figure 7.
Permeability coefficient corresponding to different fly ash content.
As can be seen from Table 8 and Figure 8, when the porosity is constant, the permeability coefficient increases with the rise of water level difference. When the water level difference is constant, the permeability coefficient increases with the higher porosity. When porosity is less than 16%, the difference of permeability coefficient under different water level difference is very small, because when porosity is low, there are fewer effective pore channels in the material, which cannot reflect the actual effect of water head difference on permeability coefficient [9]. When the porosity is more than 16%, the influence of water level difference on the permeability coefficient becomes obvious, indicating that the permeable brick has good permeability. When the porosity is more than 25%, the permeability coefficient changes little with the increase of porosity, indicating that the internal pores of the permeable brick are fully utilized, and the permeable brick has the best permeability.
Table 8.
Permeability coefficient (cm/s) corresponding to different porosity and water level difference.
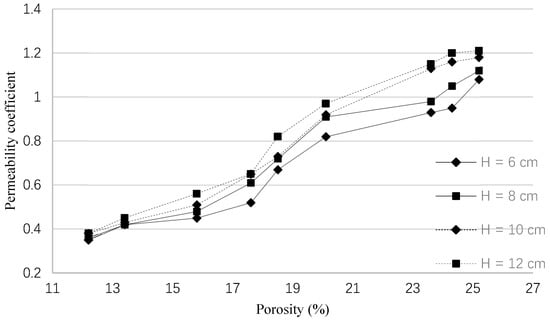
Figure 8.
Permeability coefficient (cm/s) corresponding to different porosity and water level difference.
Therefore, porosity had the greatest influence on the permeability coefficient of permeable bricks. When porosity increased from 12% to 25%, the permeability coefficient increased from 0.4 cm/s to 1.2 cm/s.
In the test, the data when the water level difference of 6 cm was selected for polynomial fitting. The fitting results are as follows:
where P denotes the permeability coefficient, x denotes the porosity. The coefficient of determination R2 = 0.98.
The formed permeable bricks prepared by the test basically meet the requirements of GB/T 25993-2010 and the ASTM C902-15. Moreover, the source materials are widely used and the cost is low. It can reduce the surface runoff of rainwater, and at the same time, the industrial waste can be recycled. Therefore, such permeable bricks have broad engineering application prospects.
4. Conclusions
The test results showed that the water-cement ratio, steel slag, and fly ash content have significant effects on the compressive strength and water permeability of the permeable brick. Considering the compressive strength and water permeability, the best mix proportion of permeable bricks was 6.5% for steel slag, 30% for fly ash, and 25% for target porosity.
In this study, the cement content was fixed, which is 10%. The fly ash and steel slag were replaced with cement. With the increase of substitution rate, the compressive strength of permeable brick decreases, but the increase in permeability was significant.
The compressive strength of permeable brick could be effectively improved by increasing the steel slag content. When the content of steel slag increased from 5% to 6.5%, the corresponding 28 days curing compressive strength increased from 21 MPa to 26 MPa. When the content of steel slag was larger than 6.5%, the compressive strength of permeable brick did not change significantly. The content of fly ash was negatively correlated with the strength of permeable bricks. As the content of fly ash increased, the strength of permeable bricks decreased.
The steel slag content had little effect on the water permeability coefficient, and the water permeable property was stable when the steel slag content was kept at about 6%. The fly ash content had a great influence on the permeability coefficient. The higher the content, the larger the porosity and the better the water permeability.
Author Contributions
Y.L. and W.T. developed methodology, performed the analysis, write the draft manuscript and the revised version. R.P.S. reviewed and commented on the original and revised manuscripts.
Funding
This research received no external funding.
Acknowledgments
The authors wish to thank the anonymous reviewers for their valuable suggestions.
Conflicts of Interest
The authors declare no conflict of interest.
References
- Kazemi, F.; Hill, K. Effect of permeable pavement basecourse aggregates on stormwater quality for irrigation reuse. Ecol. Eng. 2015, 77, 189–195. [Google Scholar] [CrossRef]
- Brattebo, B.O.; Booth, D.B. Long-term stormwater quantity and quality performance of permeable pavement systems. Water Res. 2003, 37, 4369–4376. [Google Scholar] [CrossRef]
- Wang, B.M.; Zhang, Y.; Han, Y. On Comprehensive Utilization of Fly Ash. Res. Appl. Build. Mater. 2011, 10, 10–13. [Google Scholar]
- Harmaji, A.; Sunendar, B. Utilization of Fly Ash, Red Mud, and Electric Arc Furnace Dust Slag for Geopolymer. Mater. Sci. Forum 2016, 841, 157–161. [Google Scholar] [CrossRef]
- Liu, Y.; Li, L.; Wang, S.Z.; Shi, H. Kinetics and thermodynamics of efficient phosphorus removal by a complex material. Desalin. Water Treat. 2015, 56, 1949–1954. [Google Scholar] [CrossRef]
- Vishwakarma, V.; Ramachandran, D.; Anbarasan, N.; Rabel, A.M. Studies of rice husk ash nanoparticles on the mechanical and microstructural properties of the concrete. Mater. Today Proc. 2016, 3, 1999–2007. [Google Scholar] [CrossRef]
- Wu, M.H.; Lin, C.L.; Huang, W.C.; Chen, J.W. Characteristics of pervious concrete using incineration bottom ash in place of sandstone graded material. Constr. Build. Mater. 2016, 111, 618–624. [Google Scholar] [CrossRef]
- Yuan, X.; Tang, Y.; Li, Y.; Wang, Q.; Zuo, J.; Song, Z. Environmental and economic impacts assessment of concrete pavement brick and permeable brick production process—A case study in China. J. Clean Prod. 2018, 171, 198–208. [Google Scholar] [CrossRef]
- Jiang, Z.W.; Sun, Z.P.; Wang, P.M. Effects of Some Factors on Properties of Porous Pervious Concrete. J. Build. Mater. 2005, 8, 513–519. [Google Scholar]
- Shahidan, S.; Koh, H.B.; Alansi, A.M.S.; Loon, L.Y. Strength Development and Water Permeability of Engineered Biomass Aggregate Pervious Concrete. MATEC Web Conf. 2016, 47, 01007. [Google Scholar] [CrossRef]
- Zhang, J.; Qian, X.Y.; Liu, F.H.; Zhu, J.; Shen, K.Z.; Gao, X.Q. Study on the Morphology and Properties of PP/HDPE Blend Prepared by Vibration Injection Molding. J. Macromol. Sci. B 2010, 50, 41–50. [Google Scholar] [CrossRef]
- Zheng, M.; Chen, S.; Wang, B. Mixture ratio design method of porous concrete based on orthogonality test. J. Tongji Univ. 2006, 34, 1319–1323. [Google Scholar]
- MOHURD. Specification for Mix Proportion Design of Ordinary Concrete; JGJ 55-2011; China Architecture & Building Press: Beijing, China, 2011. [Google Scholar]
- ASTM Standard Test Method for Compressive Strength of Hydraulic Cement Mortars (Using 2-in. or [50-mm] Cube Specimens); C109/C109M-12; ASTM International: West Conshohocken, PA, USA, 2012.
- ASTM. Standard Specification for Pedestrian and Light Traffic Paving Brick; C902-15; ASTM International: West Conshohocken, PA, USA, 2015. [Google Scholar]
- SAC. Permeable Paving Bricks & Permeable Paving Flags; GB/T 25993-2010; Standards Press of China: Beijing, China, 2011. [Google Scholar]
- ASTM. Standard Test Method for Permeability of Granular Soils (Constant Head); D2434-68; ASTM International: West Conshohocken, PA, USA, 2000. [Google Scholar]
- ASTM. Standard Test Method for Surface Infiltration Rate of Permeable Unit Pavement Systems; C1781/C1781M-15; ASTM International: West Conshohocken, PA, USA, 2015. [Google Scholar]
- Isobe, T.; Kameshima, Y.; Nakajima, A.; Okada, K.; Hotta, Y. Gas permeability and mechanical properties of porous alumina ceramics with unidirectionally aligned pores. J. Eur. Ceram. Soc. 2007, 27, 53–59. [Google Scholar] [CrossRef]
- Wu, X.W.; Ma, H.W.; Wu, N.; Shi, C.Q.; Zheng, Z.Y.; Wang, Y.F. Nepheline-based water-permeable bricks from coal gangue and aluminum hydroxide. Environ. Prog. Sustain. Energy 2016, 35, 779–785. [Google Scholar] [CrossRef]
- Khatri, R.P.; Sirivivatnanon, V. Methods for the determination of water permeability of concrete. ACI Mater. J. 1997, 94, 257–261. [Google Scholar]
- Doolittle, A.K. Studies in Newtonian Flow. I. The Dependence of the Viscosity of Liquids on Temperature. J. Appl. Phys. 1951, 22, 1031–1035. [Google Scholar] [CrossRef]
© 2019 by the authors. Licensee MDPI, Basel, Switzerland. This article is an open access article distributed under the terms and conditions of the Creative Commons Attribution (CC BY) license (http://creativecommons.org/licenses/by/4.0/).