Development of a Data-Mining Technique for Regional-Scale Evaluation of Building Seismic Vulnerability
Abstract
1. Introduction
2. Review: Regional-Scale Assessment of Buildings’ Seismic Vulnerability
2.1. Empirical Vulnerability Assessment
2.2. Analytical Vulnerability Assessment
2.3. Semi-Empirical Vulnerability Assessment
2.4. Machine Learning in Disaster-Risk Assessment
3. Methodology
3.1. Development of the Support Vector Machine Model
3.1.1. Support Vector Machine
3.1.2. Model Training and Testing
3.2. Development of Capacity Curves of Buildings
3.2.1. Pushover Analysis and the Capacity Spectrum Method
3.2.2. Selection of Building Characteristics
4. Model Verification
5. Discussion and Conclusions
Author Contributions
Funding
Conflicts of Interest
References
- Kircher, C.A.; Whitman, R.V.; Holmes, W.T. HAZUS earthquake loss estimation methods. Nat. Hazards Rev. 2006, 7, 45–59. [Google Scholar] [CrossRef]
- Grossi, P.; Kunreuther, H.; Patel, C.C. Catastrophe Modeling: A New Approach to Managing Risk; Springer: Boston, MA, USA, 2005. [Google Scholar]
- Mahsuli, M.; Rahimi, H.; Bakhshi, A. Probabilistic seismic hazard analysis of Iran using reliability methods. Bull. Earthq. Eng. 2019, 17, 1117–1143. [Google Scholar] [CrossRef]
- Deligiannakis, G.; Papanikolaou, I.; Roberts, G. Fault specific GIS based seismic hazard maps for the Attica region, Greece. Geomorphology 2018, 306, 264–282. [Google Scholar] [CrossRef]
- Ahmad, R.A.; Singh, R.P.; Adris, A. Seismic hazard assessment of Syria using seismicity, DEM, slope, active faults and GIS. Remote Sens. Appl. Soc. Environ. 2017, 6, 59–70. [Google Scholar] [CrossRef]
- Ferreira, T.M.; Vicente, R.; Da Silva, J.M.; Varum, H.; Costa, A. Seismic vulnerability assessment of historical urban centres: case study of the old city centre in Seixal, Portugal. Bull. Earthq. Eng. 2013, 11, 1753–1773. [Google Scholar] [CrossRef]
- Maio, R.; Ferreira, T.M.; Vicente, R.; Estêvão, J. Seismic vulnerability assessment of historical urban centres: Case study of the old city centre of Faro, Portugal. J. Risk Res. 2016, 19, 551–580. [Google Scholar] [CrossRef]
- Maio, R.; Ferreira, T.M.; Vicente, R. A critical discussion on the earthquake risk mitigation of urban cultural heritage assets. Int. J. Disaster Risk Reduct. 2018, 27, 239–247. [Google Scholar] [CrossRef]
- Cannizzaro, F.; Pantò, B.; Lepidi, M.; Caddemi, S.; Caliò, I. Multi-directional seismic assessment of historical masonry buildings by means of macro-element modelling: Application to a building damaged during the L’Aquila earthquake (Italy). Buildings 2017, 7, 106. [Google Scholar] [CrossRef]
- Fagundes, C.; Bento, R.; Cattari, S. On the seismic response of buildings in aggregate: Analysis of a typical masonry building from Azores. In Structures; Elsevier: Amsterdam, The Netherlands, 2017; pp. 184–196. [Google Scholar]
- Casapulla, C.; Argiento, L.U.; Maione, A. Seismic safety assessment of a masonry building according to Italian Guidelines on Cultural Heritage: simplified mechanical-based approach and pushover analysis. Bull. Earthq. Eng. 2018, 16, 2809–2837. [Google Scholar] [CrossRef]
- Greco, A.; Lombardo, G.; Pantò, B.; Famà, A. Seismic Vulnerability of Historical Masonry Aggregate Buildings in Oriental Sicily. Int. J. Archit. Herit. 2018, 1–24. [Google Scholar] [CrossRef]
- Kircher, C.A.; Nassar, A.A.; Kustu, O.; Holmes, W.T. Development of building damage functions for earthquake loss estimation. Earthq. Spectra 1997, 13, 663–682. [Google Scholar] [CrossRef]
- FEMA. FEMA154 Rapid Visual Screening of Buildings for Potential Seismic Hazards: A Handbook; Federal Emergency Management Agency: Washington, DC, USA, 2002.
- Guéguen, P.; Michel, C.; LeCorre, L. A simplified approach for vulnerability assessment in moderate-to-low seismic hazard regions: application to Grenoble (France). Bull. Earthq. Eng. 2007, 5, 467–490. [Google Scholar] [CrossRef]
- Milutinovic, Z.V.; Trendafiloski, G.S. Risk-UE An advanced approach to earthquake risk scenarios with applications to different european towns. In Contract: EVK4-CT-2000-00014, WP4: Vulnerability of Current Buildings; European Commission: Brussels, Belgium, 2003. [Google Scholar]
- Mansour, A.K.; Romdhane, N.B.; Boukadi, N. An inventory of buildings in the city of Tunis and an assessment of their vulnerability. Bull. Earthq. Eng. 2013, 11, 1563–1583. [Google Scholar] [CrossRef]
- Chen, C.-S.; Cheng, M.-Y.; Wu, Y.-W. Seismic assessment of school buildings in Taiwan using the evolutionary support vector machine inference system. Expert Syst. Appl. 2012, 39, 4102–4110. [Google Scholar] [CrossRef]
- Nakhaeizadeh, G.; Taylor, C. Machine learning and statistics. Stat. Comput. 1998, 8, 89. [Google Scholar]
- Yao, X.; Tham, L.; Dai, F. Landslide susceptibility mapping based on support vector machine: A case study on natural slopes of Hong Kong, China. Geomorphology 2008, 101, 572–582. [Google Scholar] [CrossRef]
- Lin, G.-F.; Chou, Y.-C.; Wu, M.-C. Typhoon flood forecasting using integrated two-stage support vector machine approach. J. Hydrol. 2013, 486, 334–342. [Google Scholar] [CrossRef]
- Lin, J.-Y.; Cheng, C.-T.; Chau, K.-W. Using support vector machines for long-term discharge prediction. Hydrol. Sci. J. 2006, 51, 599–612. [Google Scholar] [CrossRef]
- Tripathi, S.; Srinivas, V.; Nanjundiah, R.S. Downscaling of precipitation for climate change scenarios: A support vector machine approach. J. Hydrol. 2006, 330, 621–640. [Google Scholar] [CrossRef]
- Kao, W.-K.; Chen, H.-M.; Chou, J.-S. Aseismic ability estimation of school building using predictive data mining models. Expert Syst. Appl. 2011, 38, 10252–10263. [Google Scholar] [CrossRef]
- Chen, H.-M.; Kao, W.-K.; Tsai, H.-C. Genetic programming for predicting aseismic abilities of school buildings. Eng. Appl. Artif. Intell. 2012, 25, 1103–1113. [Google Scholar] [CrossRef]
- Riedel, I.; Guéguen, P.; Dalla Mura, M.; Pathier, E.; Leduc, T.; Chanussot, J. Seismic vulnerability assessment of urban environments in moderate-to-low seismic hazard regions using association rule learning and support vector machine methods. Nat. Hazards 2015, 76, 1111–1141. [Google Scholar] [CrossRef]
- Miranda, E.; Akkar, S. Generalized interstory drift spectrum. J. Struct. Eng. 2006, 132, 840–852. [Google Scholar] [CrossRef]
- Vapnik, V. The Nature of Statistical Learning Theory; Springer Science & Business Media: Berlin, Germany, 2013. [Google Scholar]
- Drucker, H.; Burges, C.J.; Kaufman, L.; Smola, A.J.; Vapnik, V. Support vector regression machines. In Proceedings of the Advances in Neural Information Processing Systems, Denver, CO, USA, 3–5 December 1996; pp. 155–161. [Google Scholar]
- Geisser, S. Predictive Inference; CRC Press: Boca Raton, FL, USA, 1993; Volume 55. [Google Scholar]
- Lewis, C.D. Industrial and Business Forecasting Methods: A Practical Guide to Exponential Smoothing and Curve Fitting; Butterworth-Heinemann: Oxford, UK, 1982. [Google Scholar]
- Pereira, F.C.; Rodrigues, F.; Ben-Akiva, M. Text analysis in incident duration prediction. Transp. Res. Part C Emerg. Technol. 2013, 37, 177–192. [Google Scholar] [CrossRef]
- Li, C.-S.; Chen, M.-C. A data mining based approach for travel time prediction in freeway with non-recurrent congestion. Neurocomputing 2014, 133, 74–83. [Google Scholar] [CrossRef]
- Benzer, S.; Benzer, R.; Günal, A.Ç. Artificial neural networks approach in length-weight relation of crayfish (Astacus leptodactylus Eschscholtz, 1823) in Eğirdir Lake, Isparta, Turkey. J. Coast. Life Med. 2017, 5, 330–335. [Google Scholar] [CrossRef]
- ATC. ATC40- Seismic Evaluation and Retrofit of Concrete Buildings; Applied Technology Council: Redwood City, CA, USA, 1996. [Google Scholar]
- Kappos, A.J.; Panagopoulos, G.; Panagiotopoulos, C.; Penelis, G. A hybrid method for the vulnerability assessment of R/C and URM buildings. Bull. Earthq. Eng. 2006, 4, 391–413. [Google Scholar] [CrossRef]
- Cheng, M.-Y.; Wu, Y.-W.; Syu, R.-F. Seismic Assessment of Bridge Diagnostic in Taiwan Using the Evolutionary Support Vector Machine Inference Model (ESIM). Appl. Artif. Intell. 2014, 28, 449–469. [Google Scholar] [CrossRef]
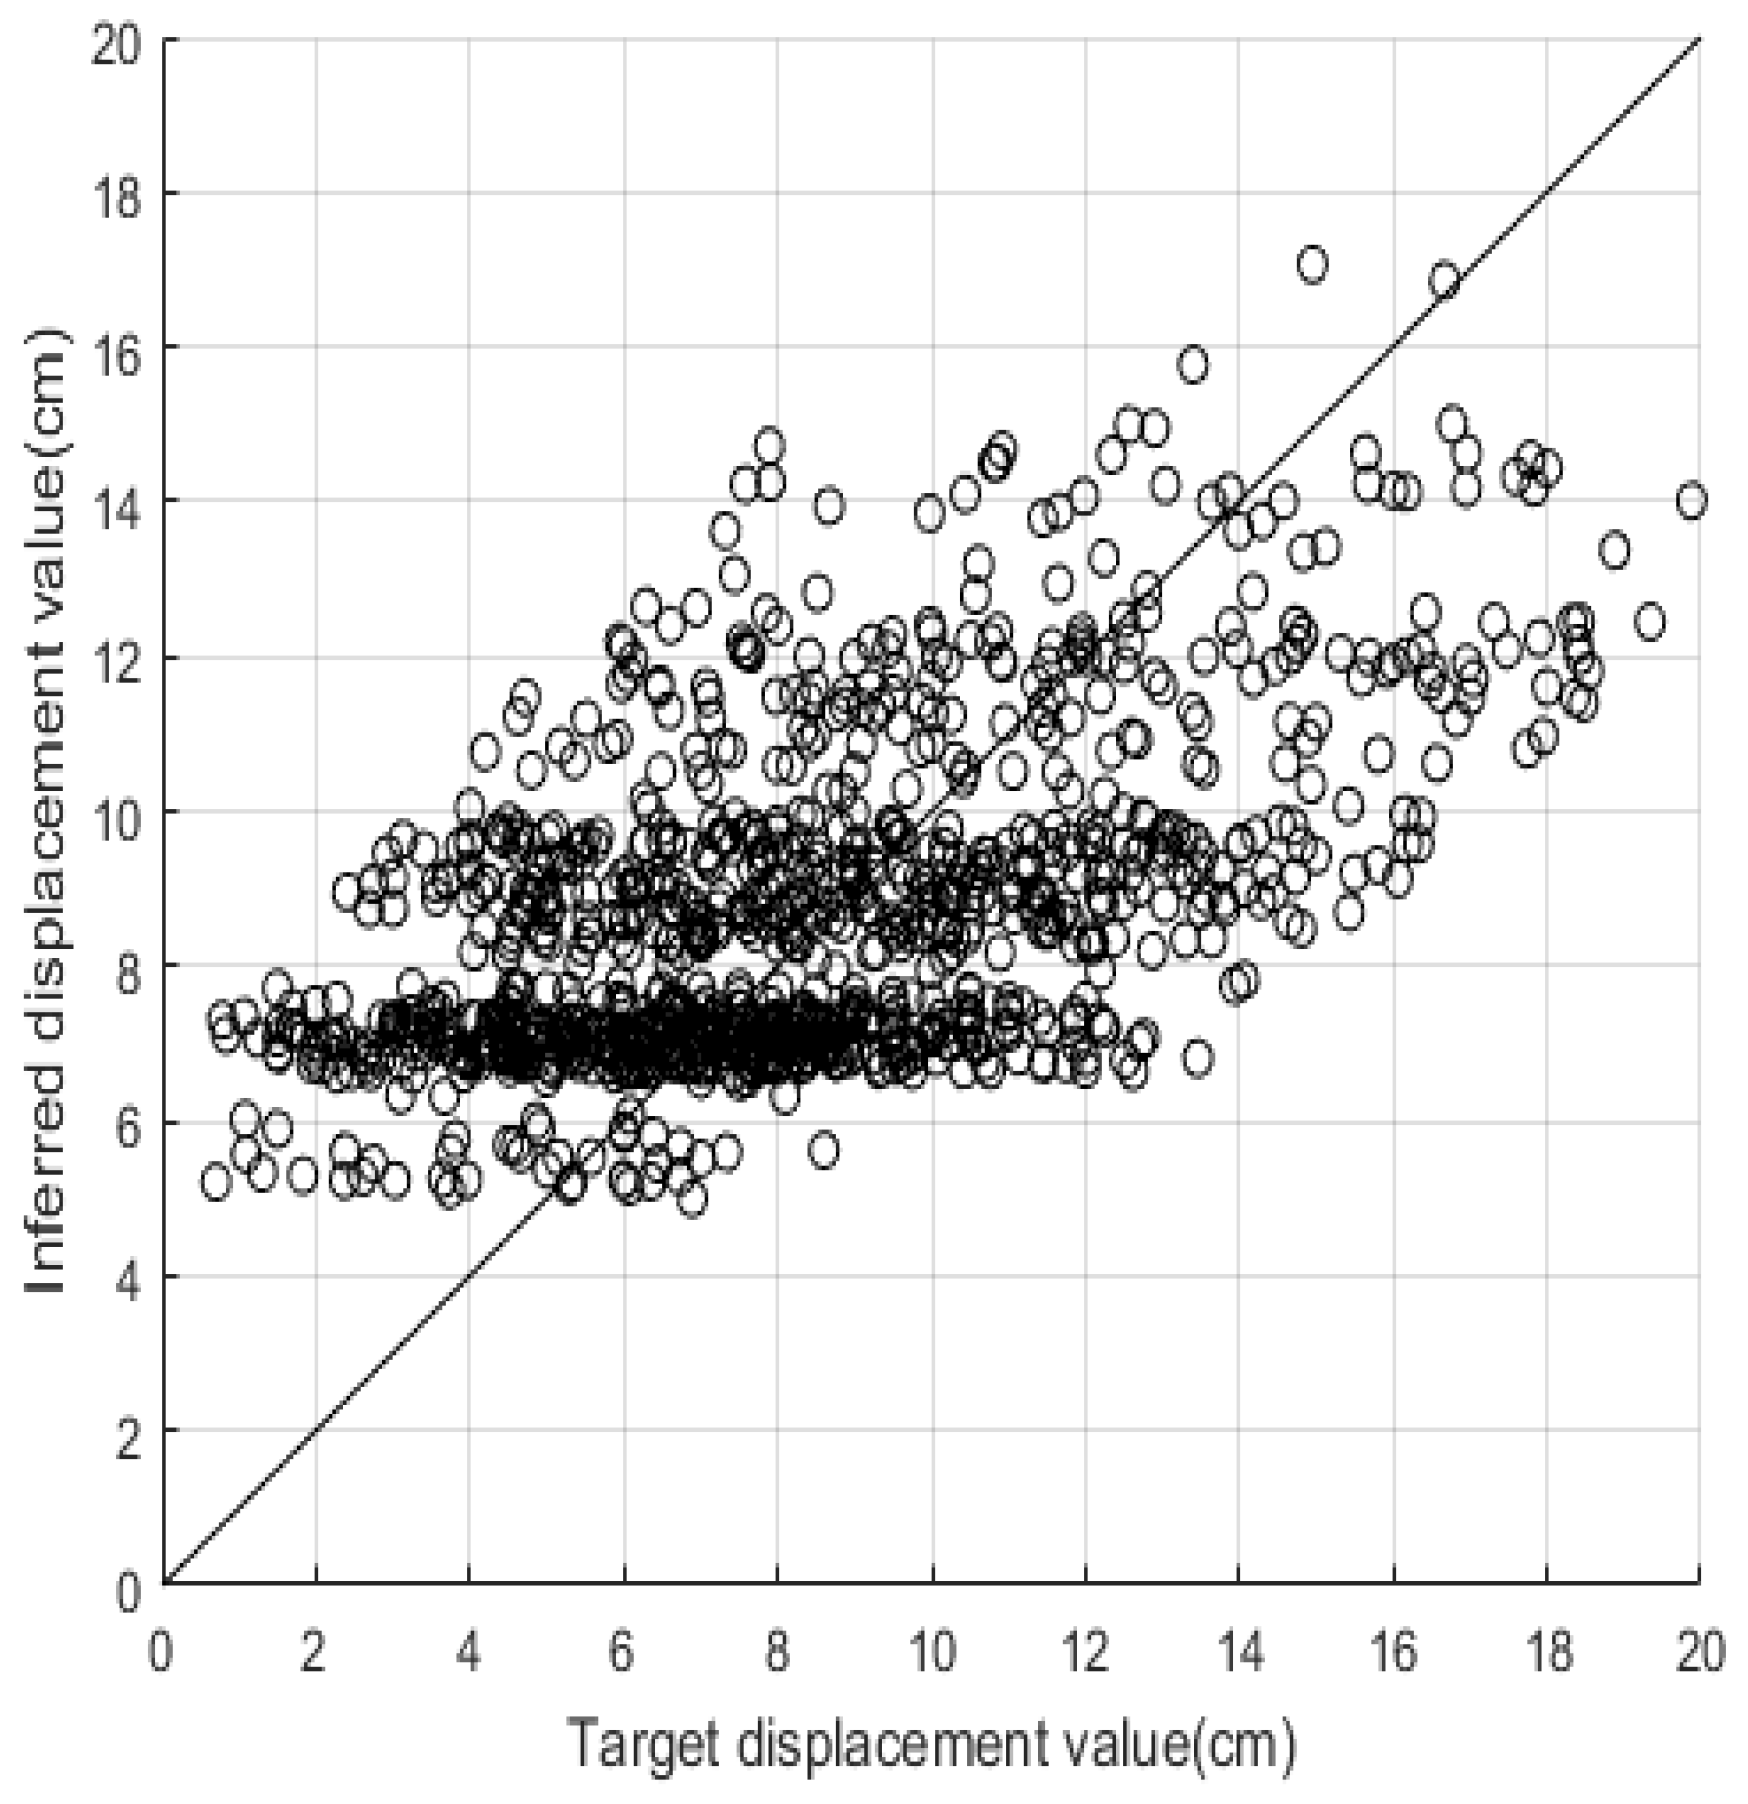
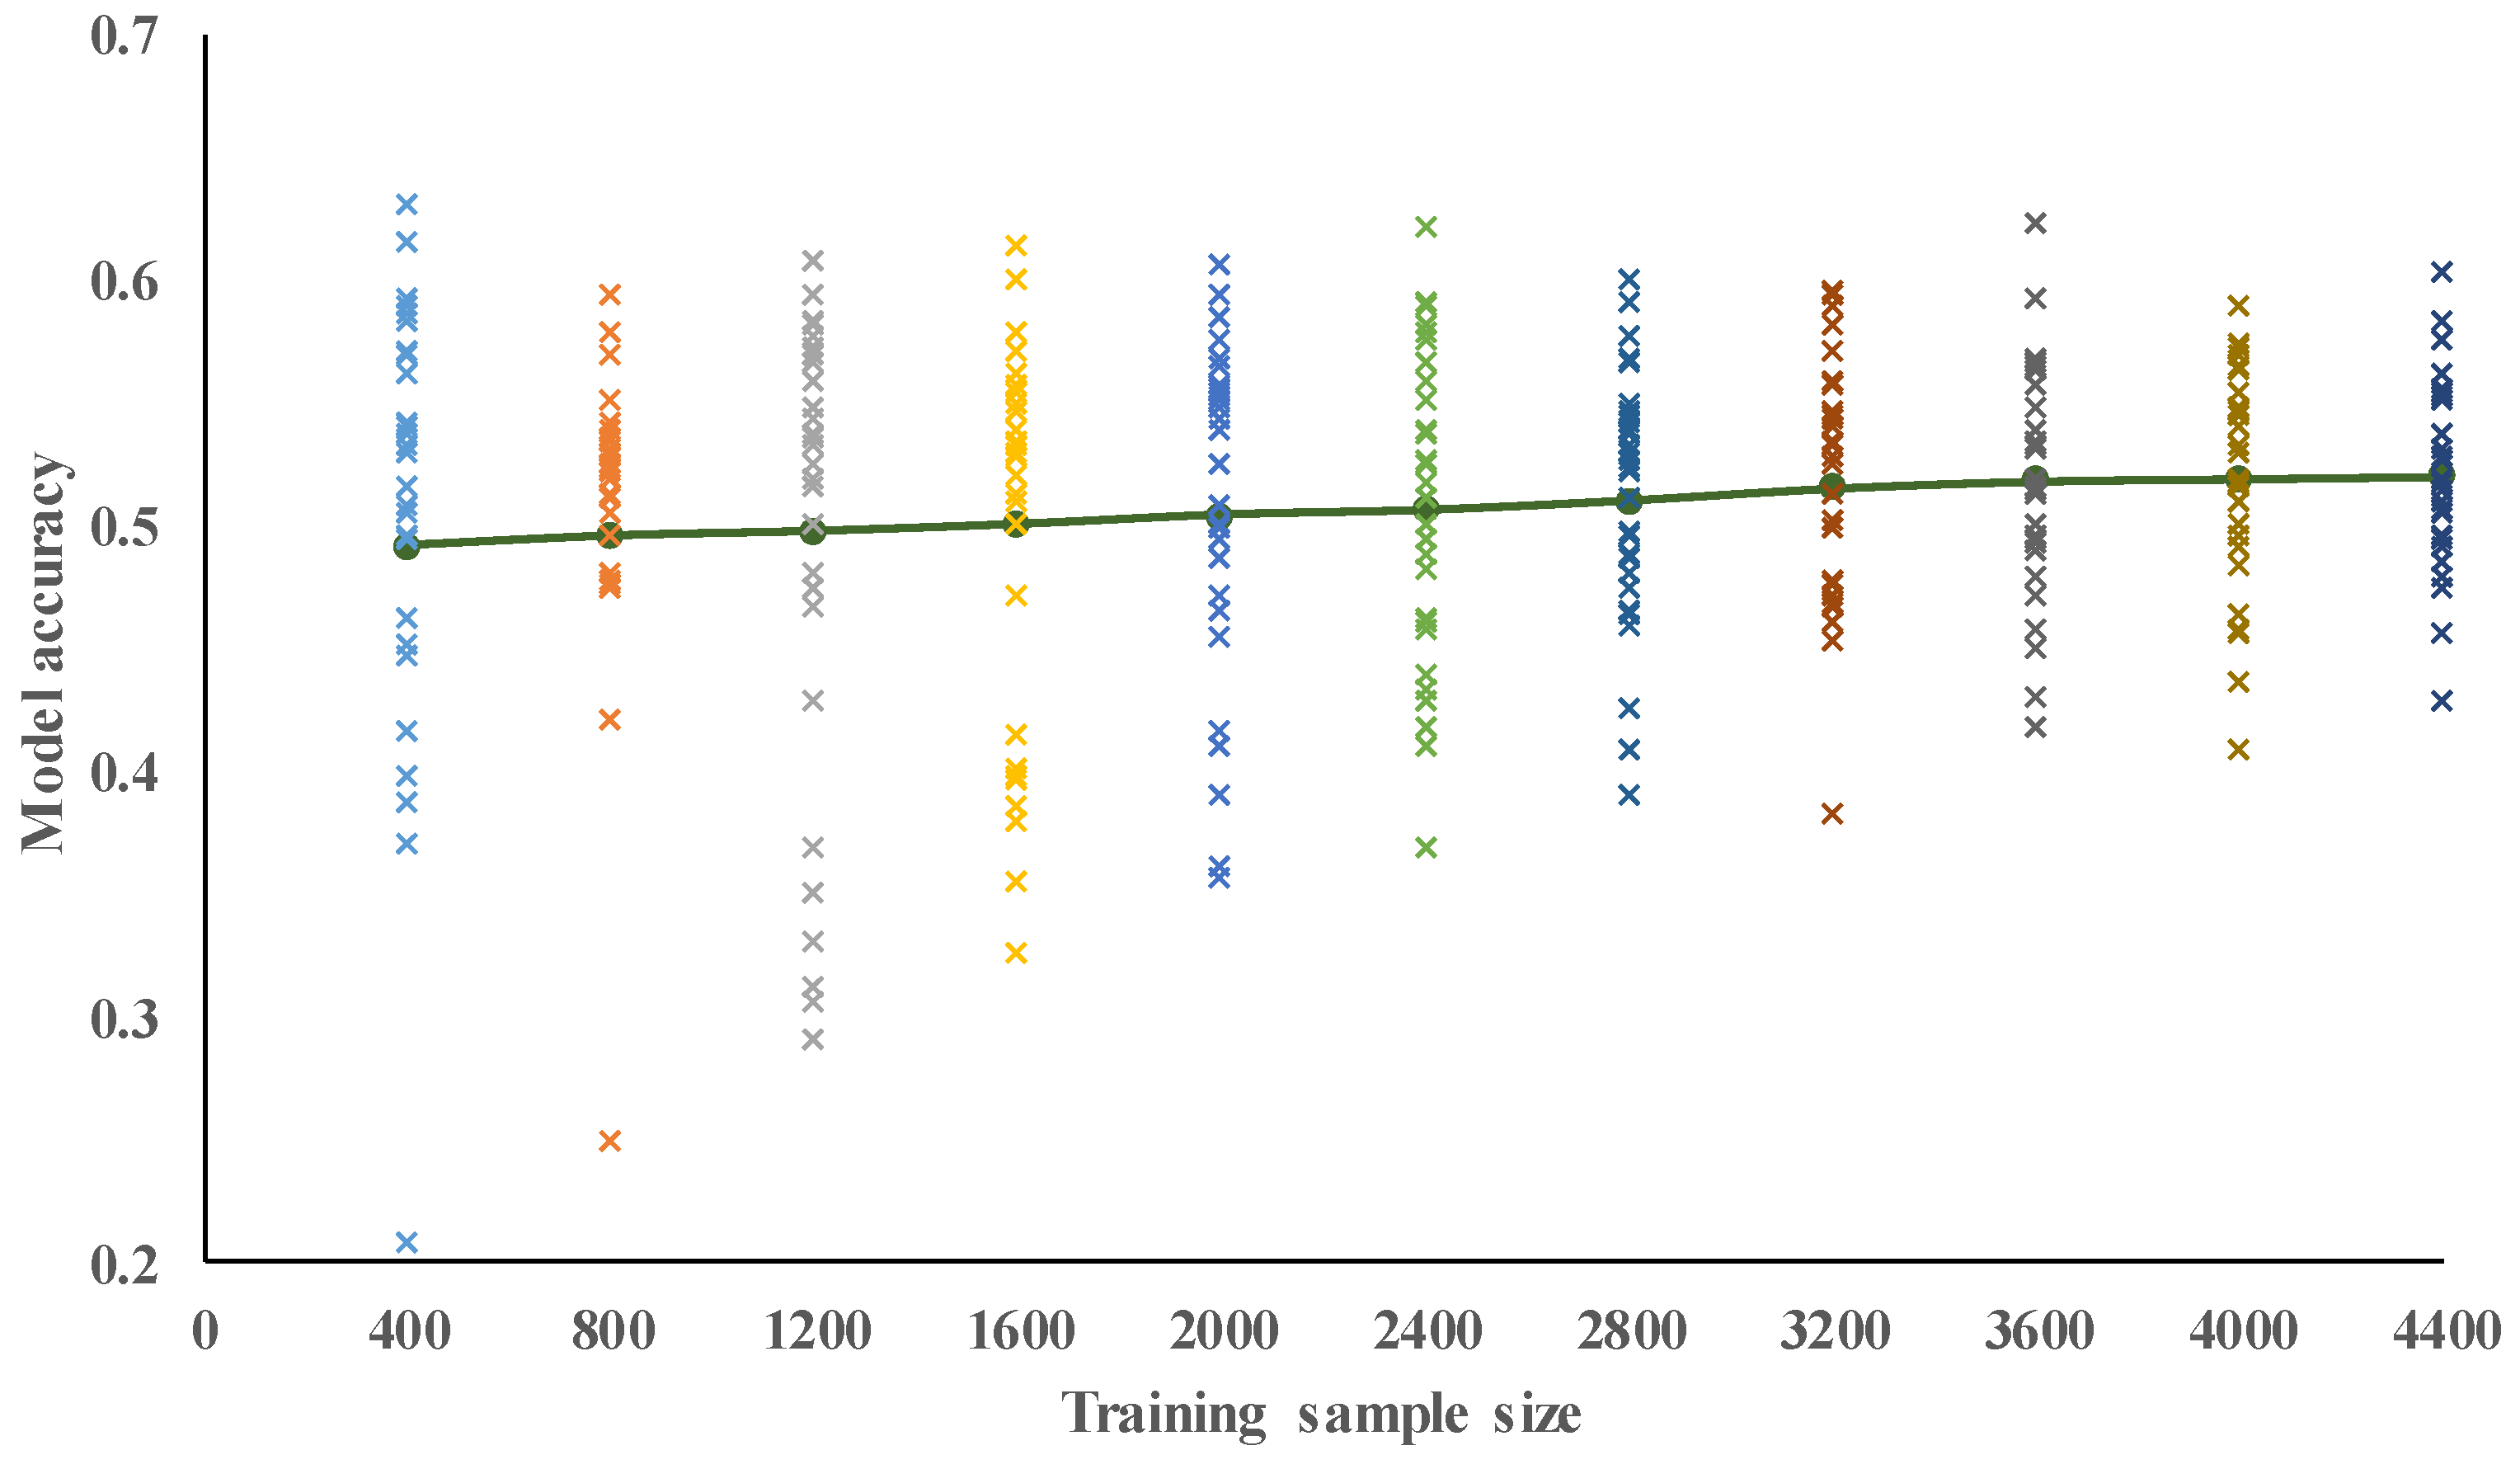

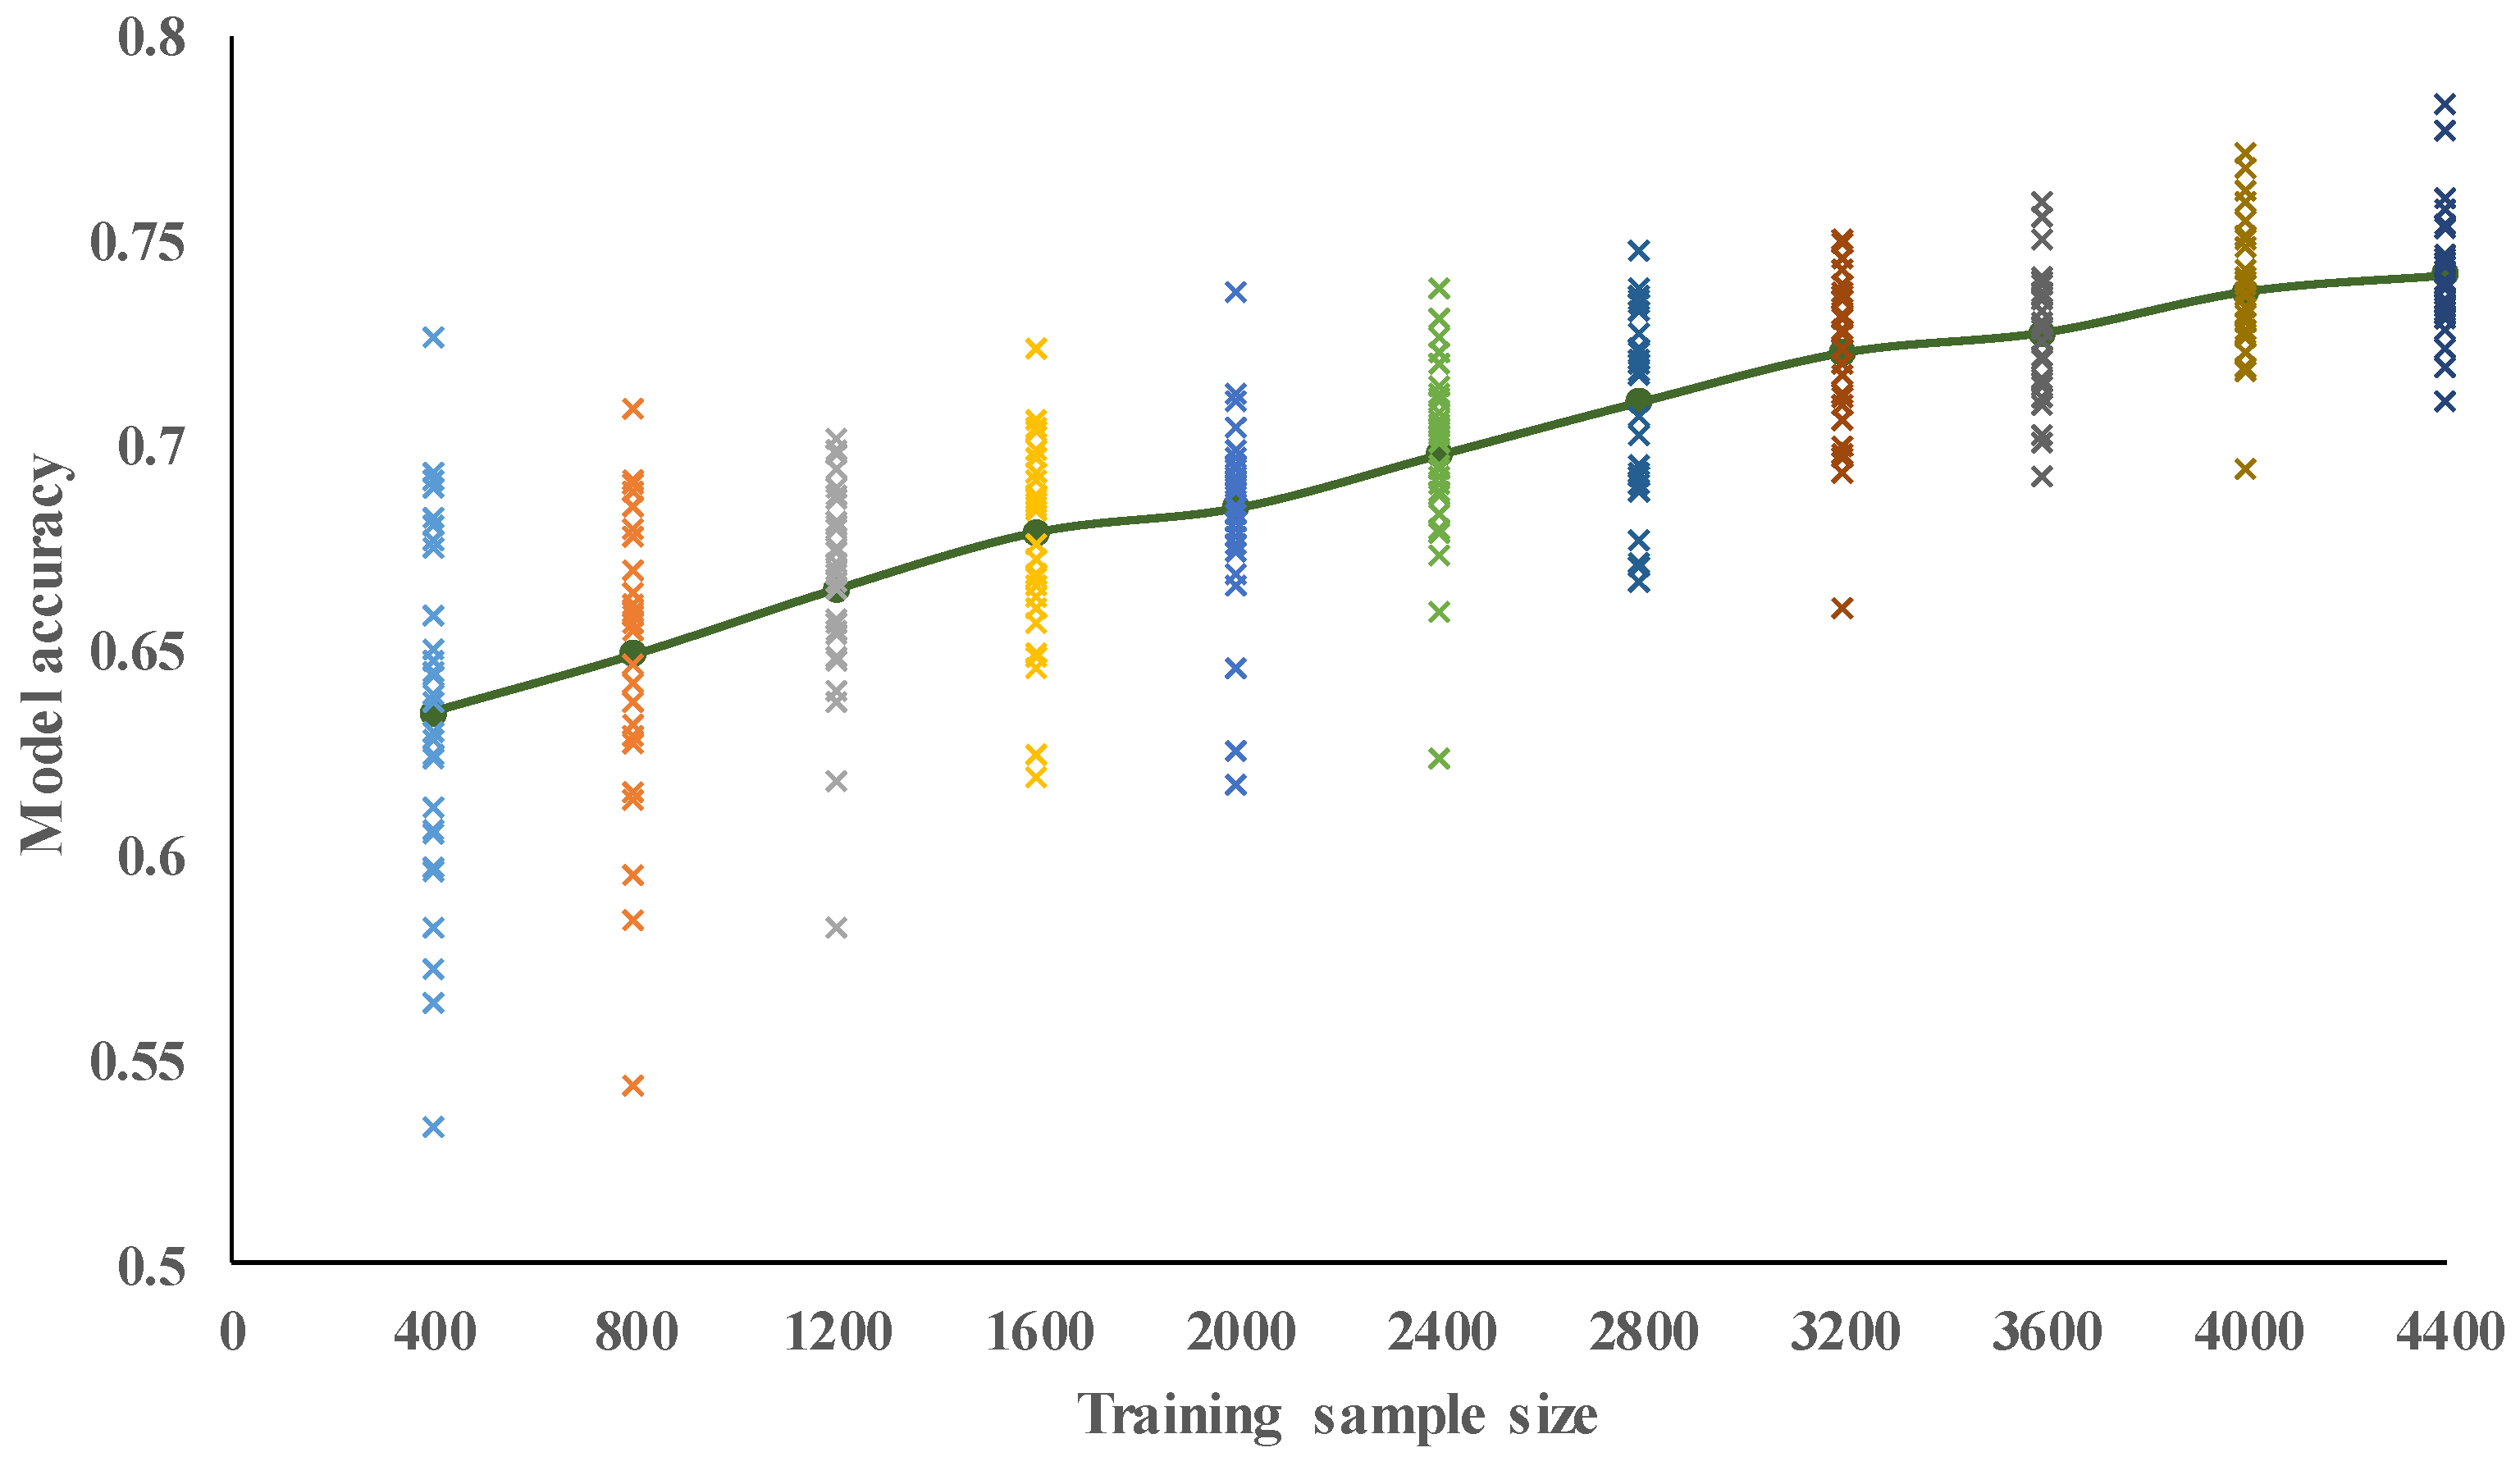
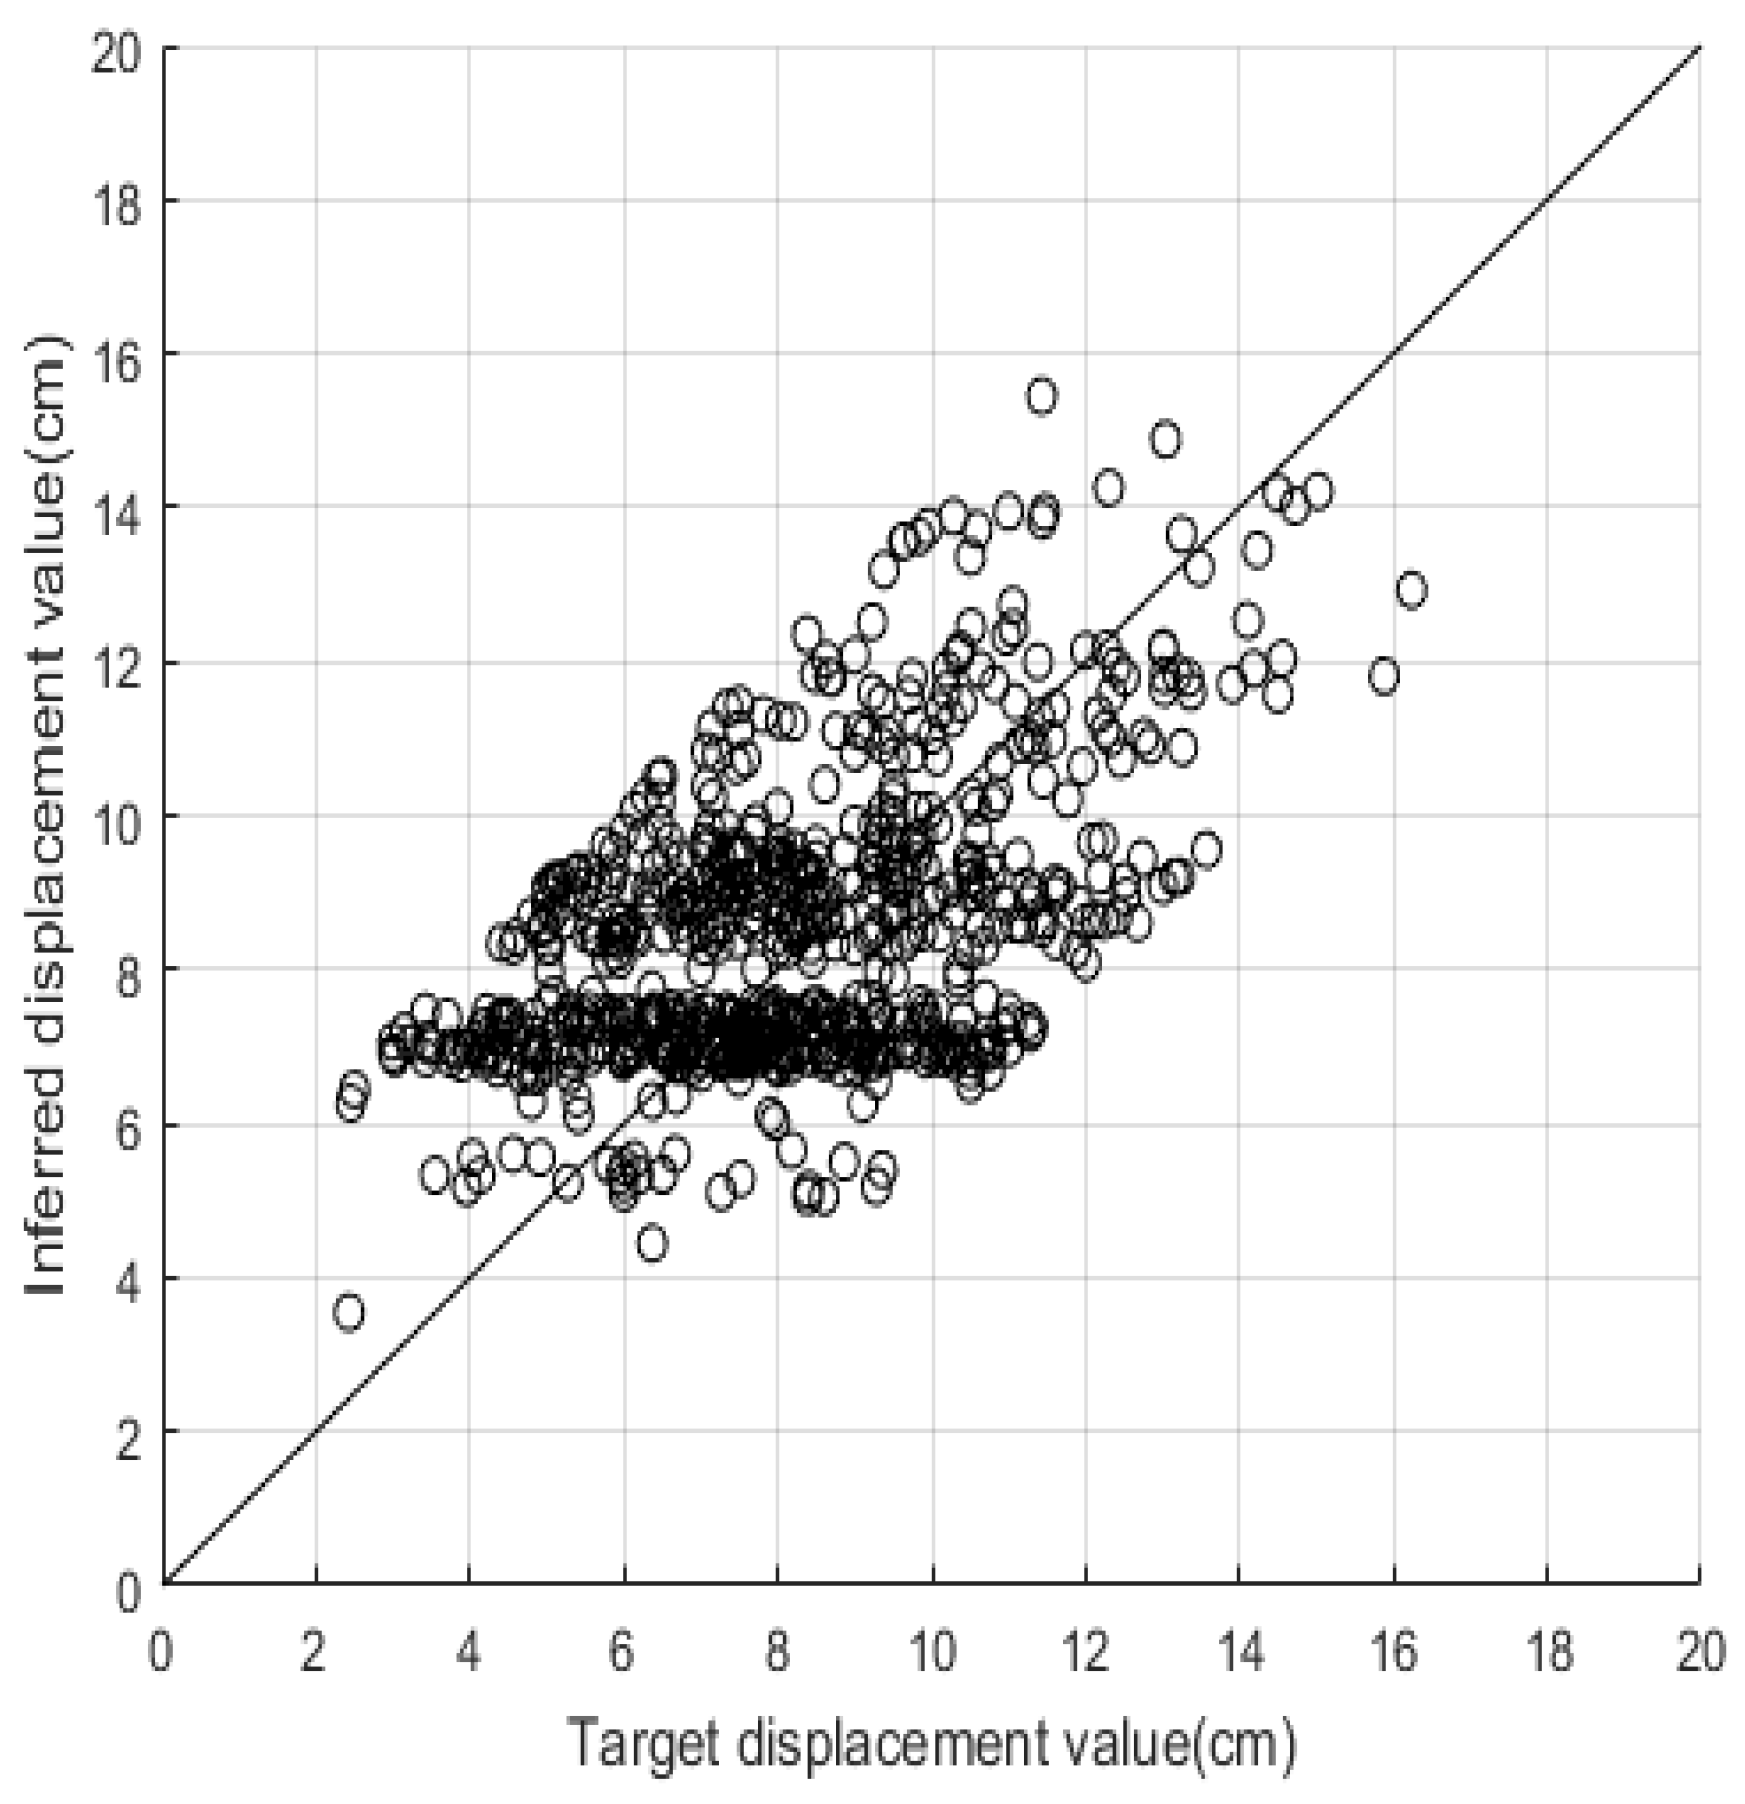
| Accuracy | Meaning |
|---|---|
| 1.0–0.9 | Precise prediction |
| 0.8–0.9 | Good prediction |
| 0.5–0.8 | Reasonable prediction |
| 0.0–0.5 | Poor prediction |
| Factors | Description |
|---|---|
| 1. Structural system | (1) Reinforced concrete (RC) frame without masonry infill wall (CF); (2) RC wall building (CSW); (3) RC frame building with structural wall (CFSW); (4) RC frame building with masonry infill wall (CFIW); (5) RC building with transfer plate (CT); (6) Masonry building (M); (7) Steel frame building (S); (8) Precast building (P) |
| 2. Building height (stories) | (1) Low-rise (1–3), (2) Mid-rise (4–7), (3) High-rise (8+) |
| 3. Seismic design standard | (1) High-code, (2) Medium-code, (3) Low-code, (4) Pre-code |
| 4. Built year | |
| 5. Total section area of columns in classrooms at ground level | |
| 6. Total section area of columns in partitions at ground level | |
| 7. Total section area of columns in corridors at ground level | |
| 8. Total section area of brick walls at ground level | |
| 9. Total section area of reinforced-concrete walls at ground level | |
| 10. Total section area of three-sided reinforced-concrete walls at ground level | |
| 11. Total section area of four-sided reinforced-concrete walls at ground level | |
| 12. Number of columns in classrooms at ground level | |
| 13. Number of columns in partitions at ground level | |
| 14. Number of columns in corridors at ground level | |
| 15. soft story | N/A (1), 2/3 wall inter. (0.9), 1/3 wall inter. (0.8) |
| 16. short column | N/A (1), 50% col./beam < 2 (0.9) |
| 17. plan irregularity | N/A (1), >15% dimension (0.95) |
| 18. vertical irregularity | N/A (1), >15% dimension (0.95) |
| 19. deterioration | Severe (0.9), Moderate (0.95), Slight (1) |
| 20. retrofitting intervention | Yes (1.2), No (1) |
| Number of Building Characteristics | Number of Training Data | ||||||||||
|---|---|---|---|---|---|---|---|---|---|---|---|
| 400 | 800 | 1200 | 1600 | 2000 | 2400 | 2800 | 3200 | 3600 | 4000 | 4400 | |
| 11 | 5 | 13 | 26 | 61 | 93 | 139 | 187 | 242 | 303 | 372 | 445 |
| 20 | 6 | 21 | 41 | 72 | 109 | 168 | 215 | 277 | 348 | 423 | 512 |
| Experiment | 11 Building Characteristics | 20 Building Characteristics | ||||||
|---|---|---|---|---|---|---|---|---|
| Training | Validating | Training | Validating | Training | Validating | Training | Validating | |
| 1 | 0.689 | 0.557 | 0.675 | 0.537 | 0.761 | 0.712 | 0.764 | 0.698 |
| 2 | 0.686 | 0.697 | 0.671 | 0.691 | 0.764 | 0.747 | 0.763 | 0.697 |
| 3 | 0.681 | 0.649 | 0.690 | 0.715 | 0.765 | 0.659 | 0.759 | 0.712 |
| 4 | 0.677 | 0.651 | 0.695 | 0.717 | 0.773 | 0.643 | 0.764 | 0.706 |
| 5 | 0.681 | 0.622 | 0.674 | 0.671 | 0.766 | 0.698 | 0.751 | 0.694 |
| 6 | 0.704 | 0.762 | 0.691 | 0.624 | 0.762 | 0.768 | 0.770 | 0.678 |
| 7 | 0.678 | 0.626 | 0.686 | 0.553 | 0.764 | 0.688 | 0.760 | 0.634 |
| 8 | 0.690 | 0.669 | 0.685 | 0.625 | 0.759 | 0.753 | 0.756 | 0.674 |
| 9 | 0.693 | 0.739 | 0.692 | 0.593 | 0.778 | 0.653 | 0.759 | 0.721 |
| 10 | 0.680 | 0.692 | 0.695 | 0.753 | 0.758 | 0.769 | 0.754 | 0.732 |
| Maximum | 0.704 | 0.762 | 0.695 | 0.753 | 0.778 | 0.769 | 0.770 | 0.732 |
| Minimum | 0.677 | 0.557 | 0.671 | 0.537 | 0.758 | 0.643 | 0.751 | 0.634 |
| Average | 0.686 | 0.666 | 0.684 | 0.648 | 0.765 | 0.709 | 0.760 | 0.695 |
| Size of Training Dataset | |||||||||||
|---|---|---|---|---|---|---|---|---|---|---|---|
| 400 | 800 | 1200 | 1600 | 2000 | 2400 | 2800 | 3200 | 3600 | 4000 | 4400 | |
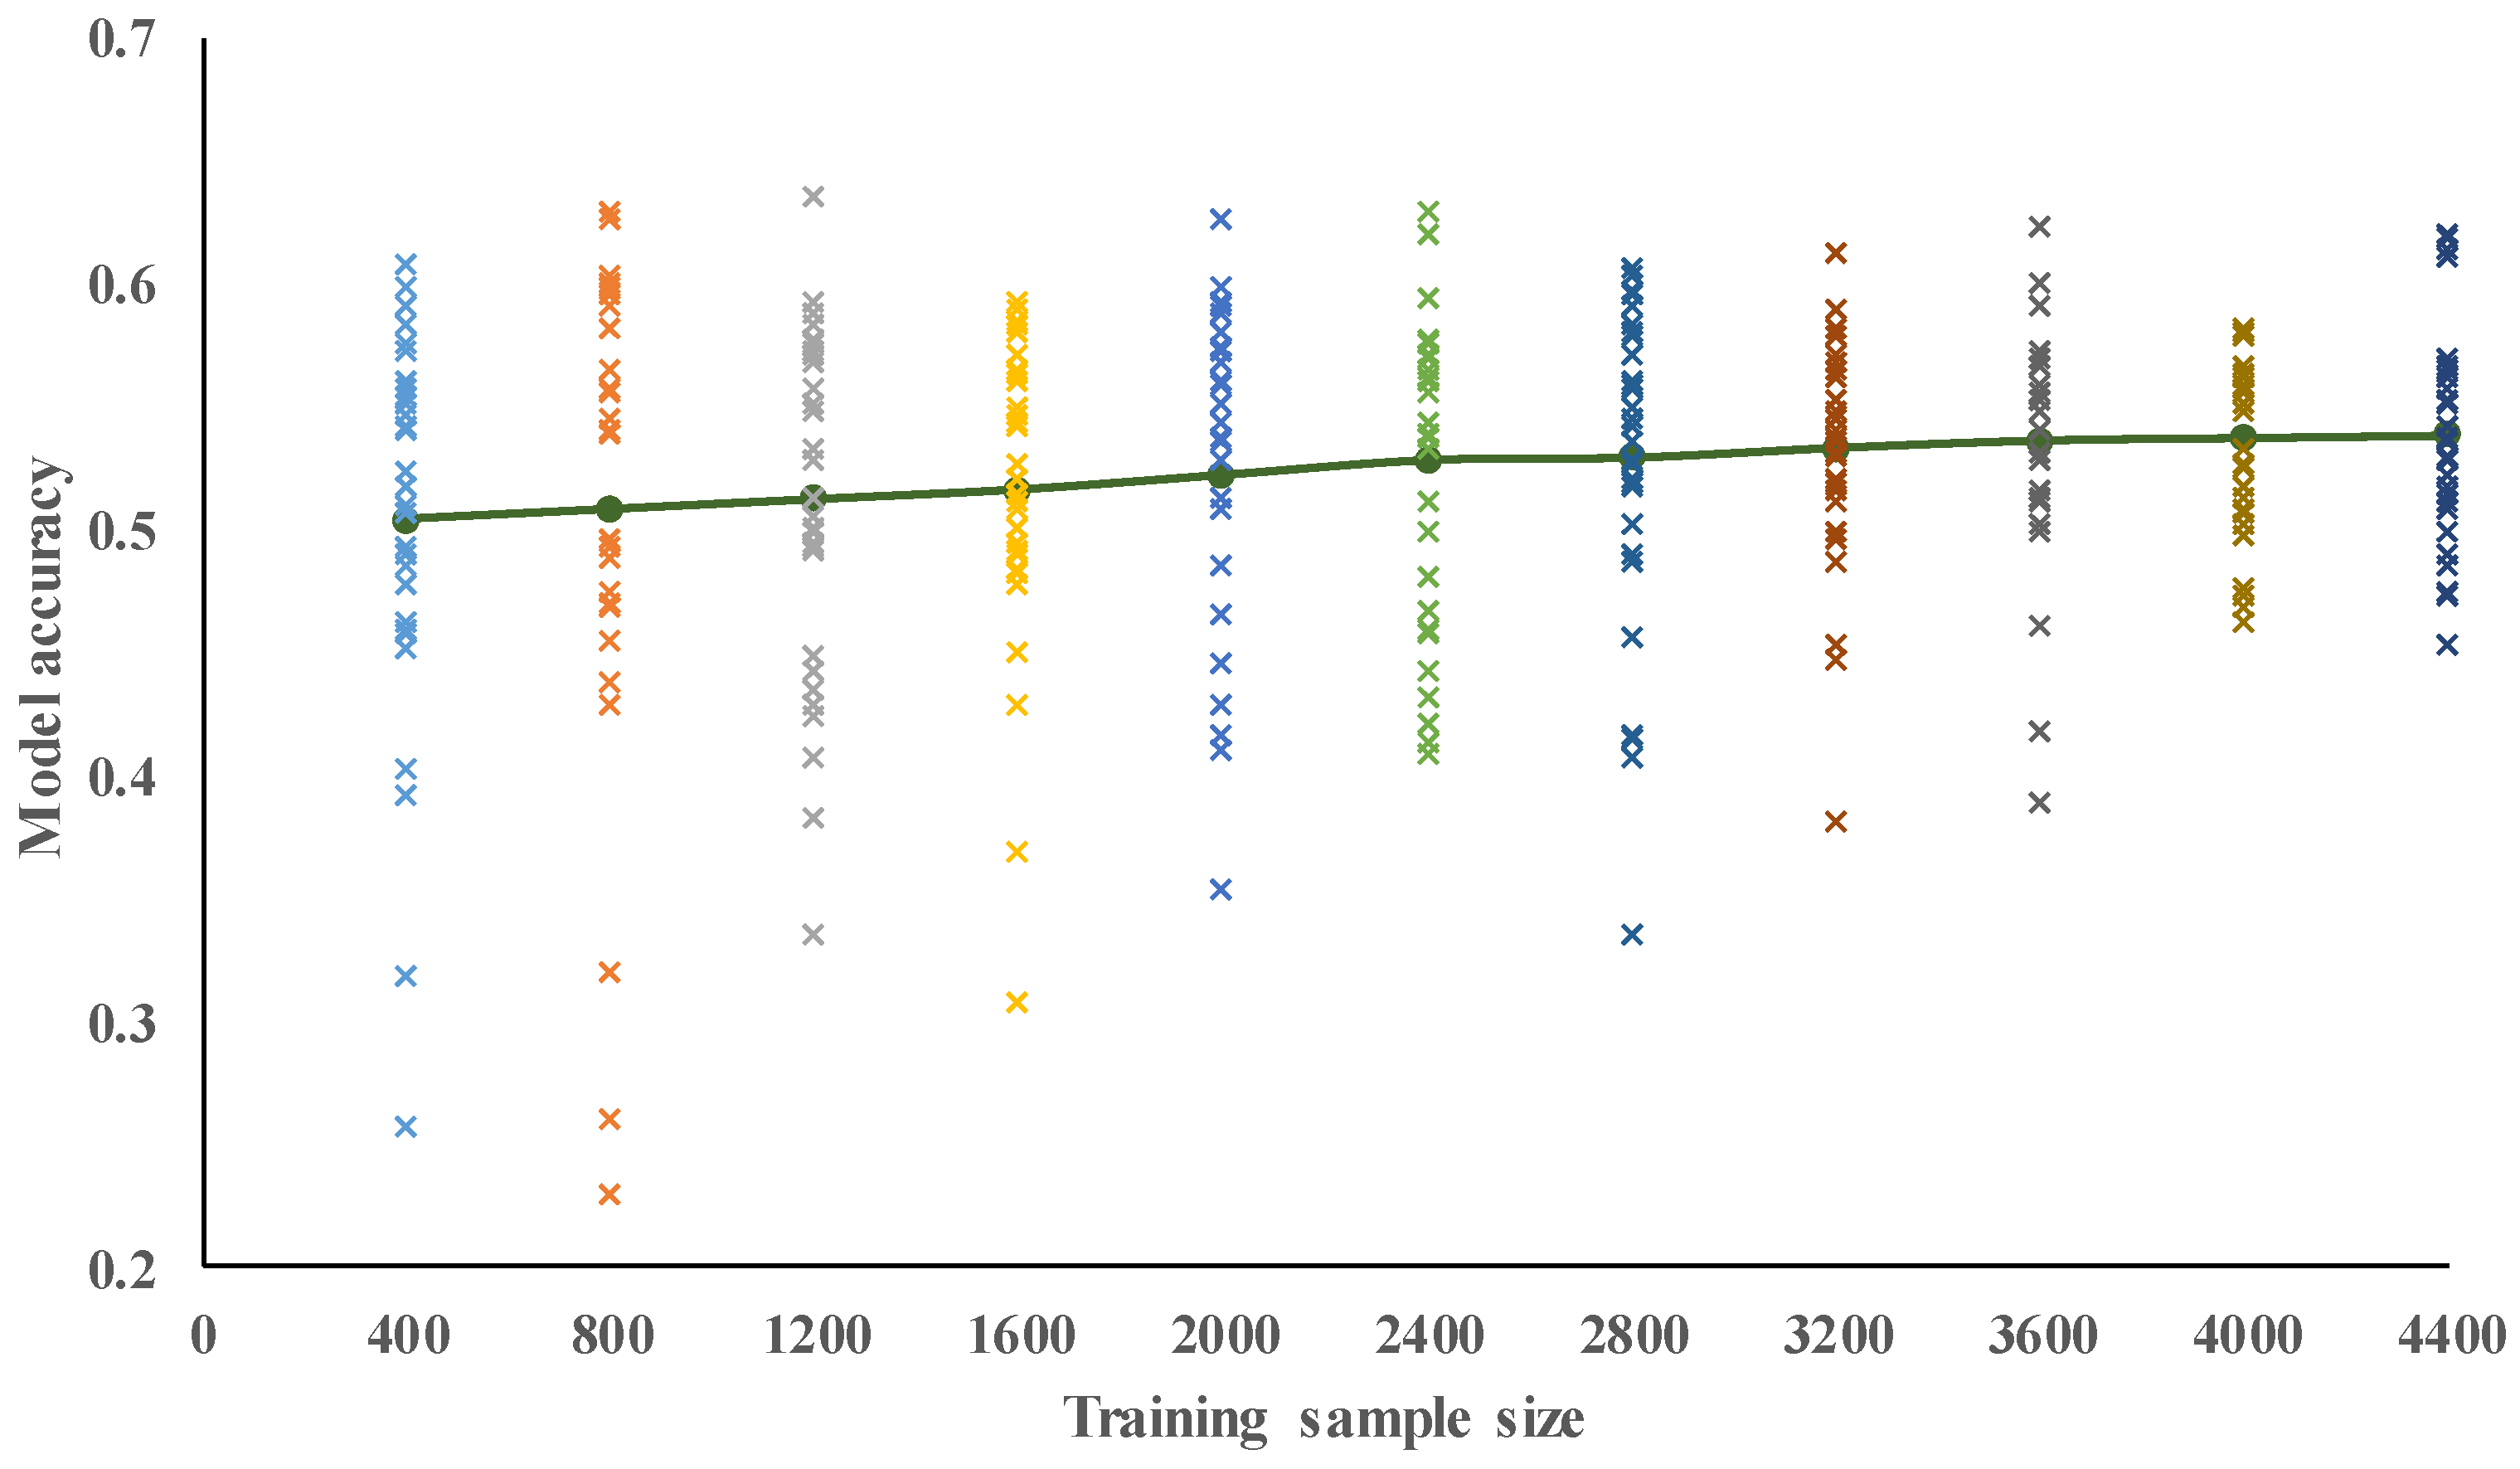
| Max. | 0.61 | 0.63 | 0.64 | 0.59 | 0.63 | 0.63 | 0.61 | 0.61 | 0.62 | 0.58 | 0.62 |
| Min. | 0.26 | 0.23 | 0.34 | 0.31 | 0.35 | 0.41 | 0.34 | 0.38 | 0.39 | 0.46 | 0.42 |
| Average | 0.51 | 0.51 | 0.51 | 0.52 | 0.52 | 0.53 | 0.53 | 0.53 | 0.54 | 0.54 | 0.54 |
| SD | 0.08 | 0.10 | 0.07 | 0.06 | 0.07 | 0.06 | 0.07 | 0.05 | 0.05 | 0.04 | 0.04 |
| Size of Training Dataset | |||||||||||
|---|---|---|---|---|---|---|---|---|---|---|---|
| 400 | 800 | 1200 | 1600 | 2000 | 2400 | 2800 | 3200 | 3600 | 4000 | 4400 | |
| Max. | 0.63 | 0.59 | 0.61 | 0.61 | 0.61 | 0.62 | 0.60 | 0.60 | 0.62 | 0.59 | 0.60 |
| Min. | 0.03 | 0.03 | 0.03 | 0.29 | 0.33 | 0.36 | 0.37 | 0.39 | 0.38 | 0.42 | 0.51 |
| Average | 0.49 | 0.49 | 0.50 | 0.50 | 0.51 | 0.51 | 0.51 | 0.52 | 0.52 | 0.52 | 0.52 |
| Standard Deviation (SD) | 0.12 | 0.11 | 0.09 | 0.08 | 0.07 | 0.06 | 0.05 | 0.05 | 0.05 | 0.04 | 0.04 |
| Size of Training Dataset | |||||||||||
|---|---|---|---|---|---|---|---|---|---|---|---|
| 400 | 800 | 1200 | 1600 | 2000 | 2400 | 2800 | 3200 | 3600 | 4000 | 4400 | |
| Max. | 0.73 | 0.71 | 0.70 | 0.72 | 0.74 | 0.74 | 0.75 | 0.75 | 0.76 | 0.77 | 0.78 |
| Min. | 0.53 | 0.54 | 0.58 | 0.62 | 0.62 | 0.62 | 0.67 | 0.66 | 0.69 | 0.69 | 0.71 |
| Average | 0.64 | 0.65 | 0.67 | 0.68 | 0.69 | 0.70 | 0.71 | 0.72 | 0.73 | 0.74 | 0.74 |
| SD | 0.04 | 0.04 | 0.03 | 0.02 | 0.02 | 0.02 | 0.02 | 0.02 | 0.02 | 0.02 | 0.02 |
| Size of Training Dataset | |||||||||||
|---|---|---|---|---|---|---|---|---|---|---|---|
| 400 | 800 | 1200 | 1600 | 2000 | 2400 | 2800 | 3200 | 3600 | 4000 | 4400 | |
| Max. | 0.70 | 0.67 | 0.70 | 0.69 | 0.70 | 0.72 | 0.71 | 0.73 | 0.73 | 0.72 | 0.73 |
| Min. | 0.39 | 0.53 | 0.57 | 0.59 | 0.60 | 0.61 | 0.62 | 0.64 | 0.64 | 0.64 | 0.66 |
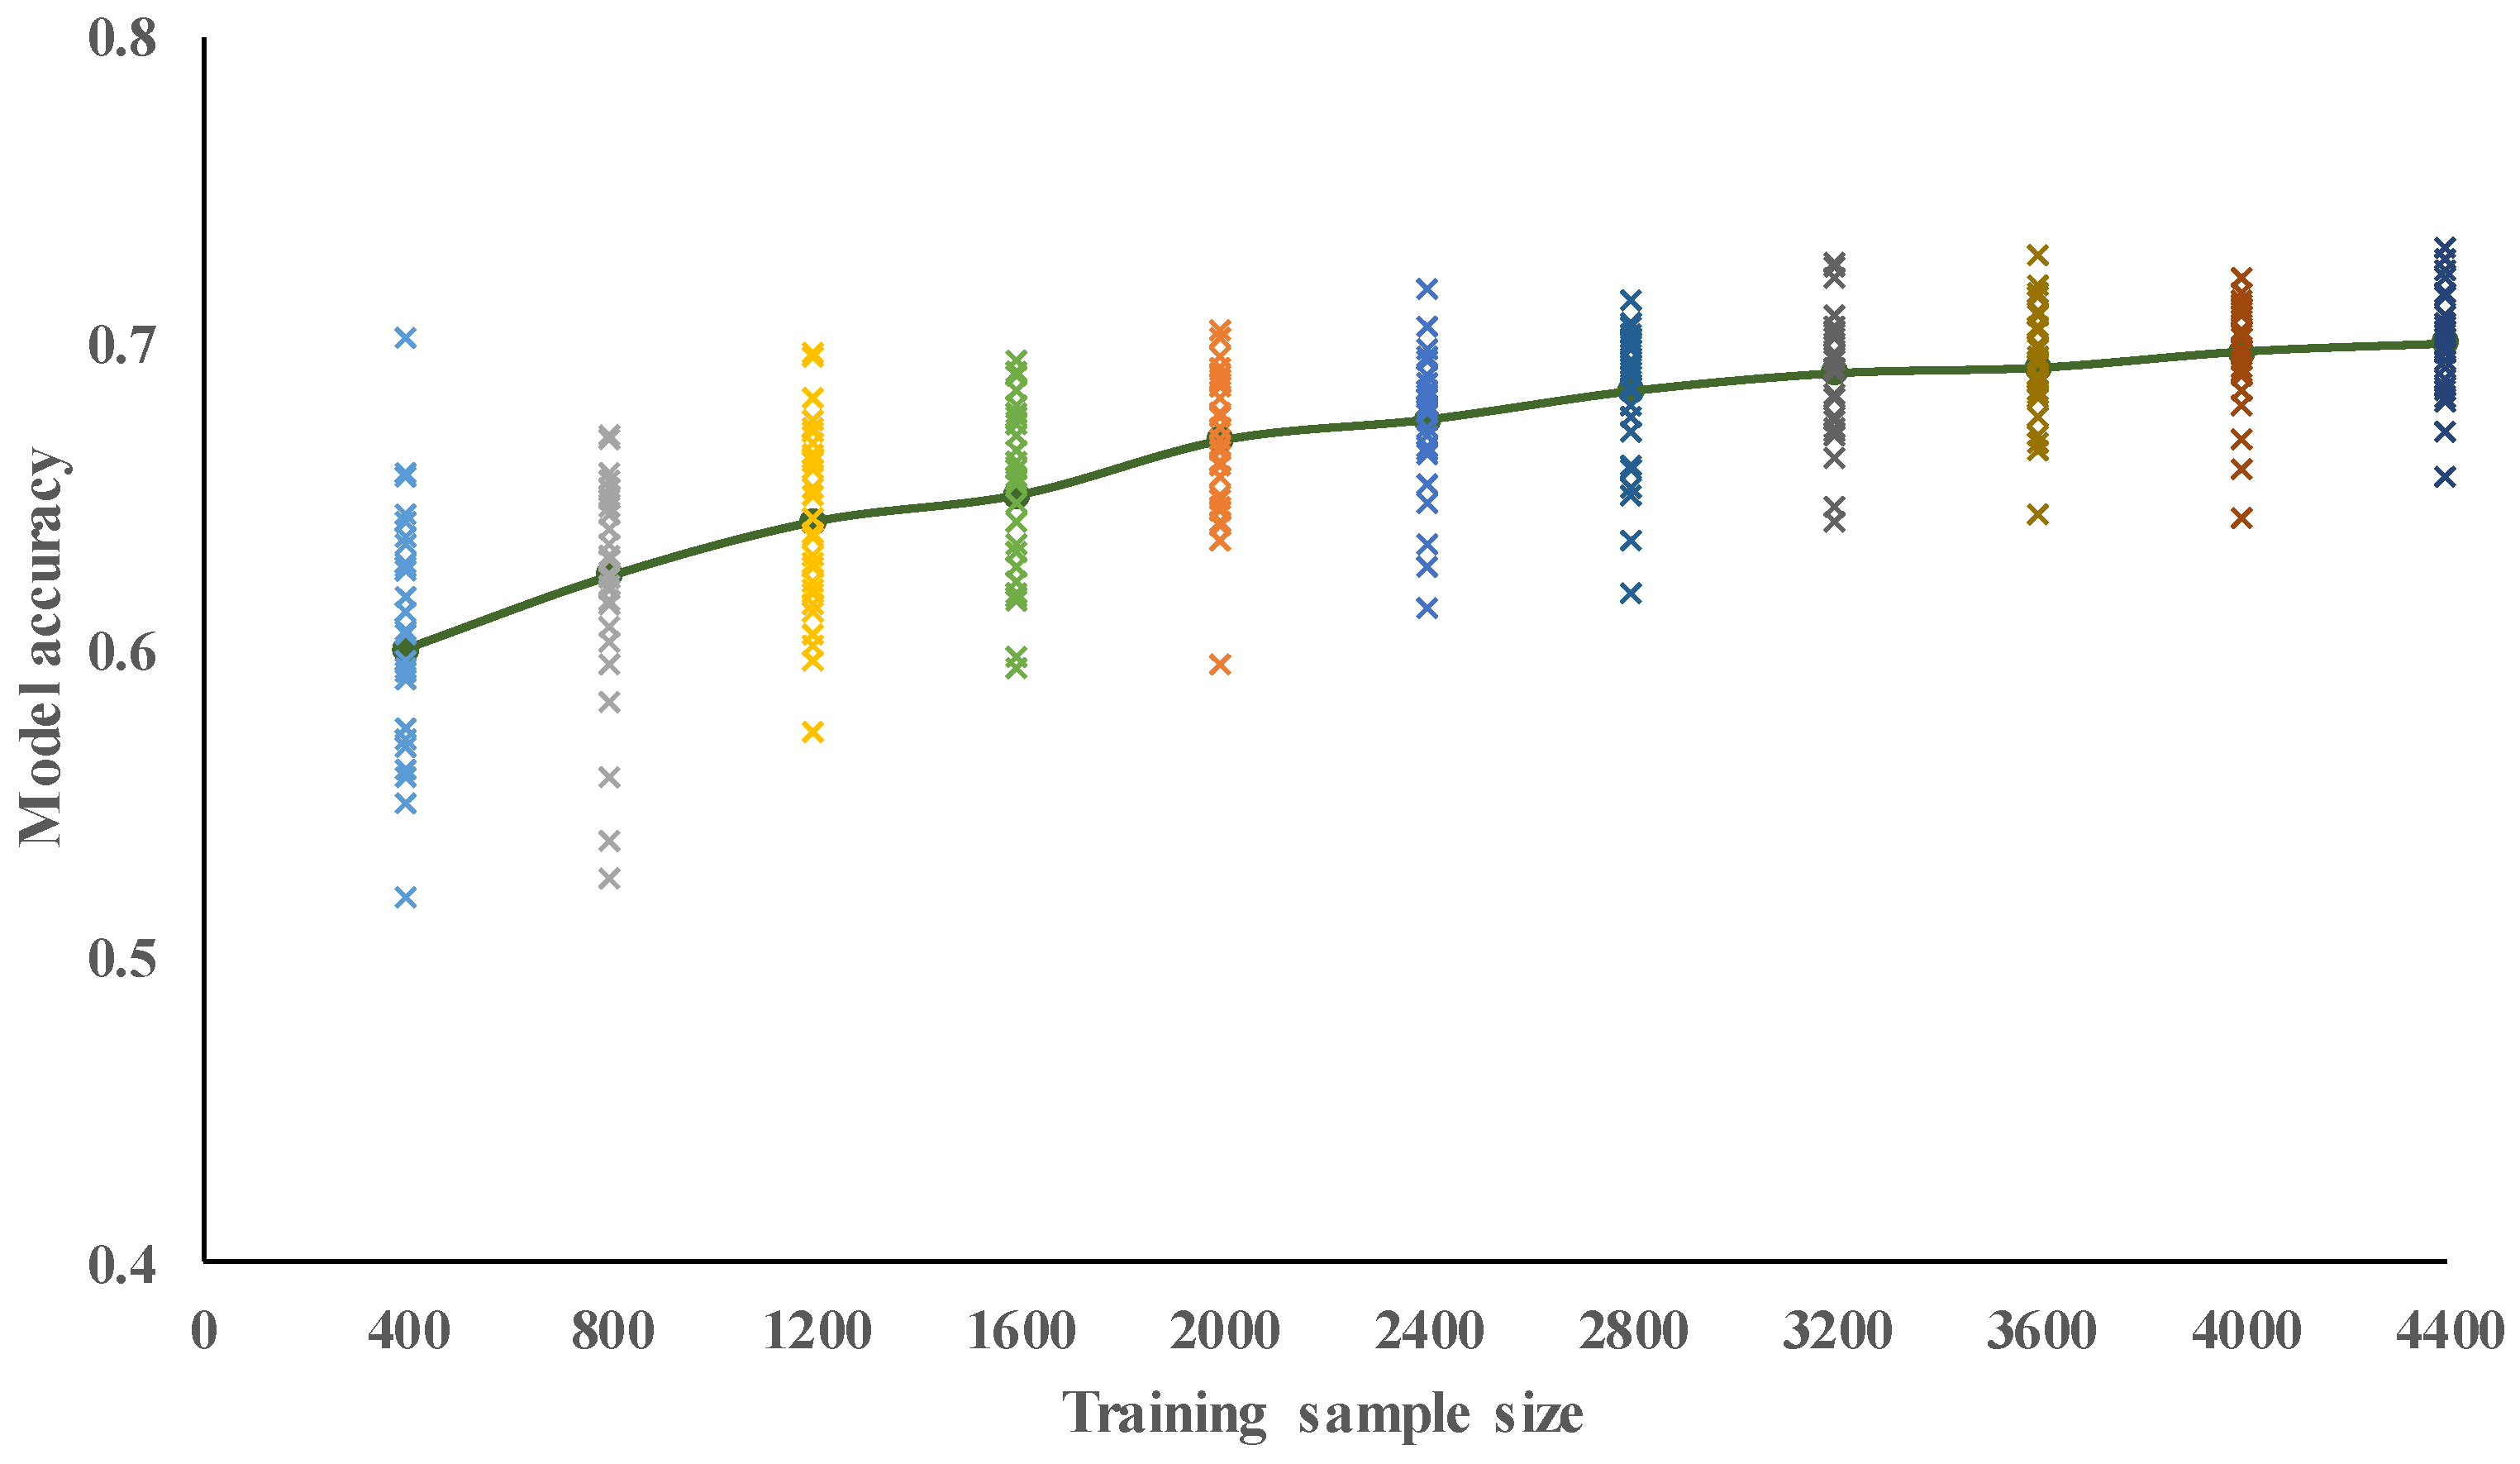
| Average | 0.60 | 0.62 | 0.64 | 0.65 | 0.67 | 0.68 | 0.68 | 0.69 | 0.69 | 0.70 | 0.70 |
| SD | 0.05 | 0.04 | 0.03 | 0.03 | 0.02 | 0.02 | 0.02 | 0.02 | 0.02 | 0.02 | 0.02 |
© 2019 by the authors. Licensee MDPI, Basel, Switzerland. This article is an open access article distributed under the terms and conditions of the Creative Commons Attribution (CC BY) license (http://creativecommons.org/licenses/by/4.0/).
Share and Cite
Zhang, Z.; Hsu, T.-Y.; Wei, H.-H.; Chen, J.-H. Development of a Data-Mining Technique for Regional-Scale Evaluation of Building Seismic Vulnerability. Appl. Sci. 2019, 9, 1502. https://doi.org/10.3390/app9071502
Zhang Z, Hsu T-Y, Wei H-H, Chen J-H. Development of a Data-Mining Technique for Regional-Scale Evaluation of Building Seismic Vulnerability. Applied Sciences. 2019; 9(7):1502. https://doi.org/10.3390/app9071502
Chicago/Turabian StyleZhang, Zhenyu, Ting-Yu Hsu, Hsi-Hsien Wei, and Jieh-Haur Chen. 2019. "Development of a Data-Mining Technique for Regional-Scale Evaluation of Building Seismic Vulnerability" Applied Sciences 9, no. 7: 1502. https://doi.org/10.3390/app9071502
APA StyleZhang, Z., Hsu, T.-Y., Wei, H.-H., & Chen, J.-H. (2019). Development of a Data-Mining Technique for Regional-Scale Evaluation of Building Seismic Vulnerability. Applied Sciences, 9(7), 1502. https://doi.org/10.3390/app9071502


