1. Introduction
Although climate is considered to be a factor extrinsic to buildings, they and their occupants are nevertheless affected by it [
1]. To ensure that all aspects of a building’s envelope function effectively, it is necessary to consider the movement of heat and air, and changes to temperature, in an integrated fashion [
2].
In addition to climate, architecture also affects the indoor climate and construction quality [
3]; this is seen, for example, in the ‘albedo effect’, with the reflection of solar rays by building roofs directly influencing air temperature and moisture, which in turn affect the possibility of condensation [
4].
A series of deficiencies may appear in building roofs, as these may be affected by climate conditions in their location; as a result, the following types of deficiencies were considered and evaluated: localized infiltrations, moistures (by infiltration and condensation) and fissures (in brick parapets and in gable-walls and slab faces).
The main factors affecting buildings and their occupants’ well-beings are temperature, moisture, solar radiation, wind, cloudiness and precipitation [
5]. These are known as climate conditions or parameters and should be taken into account in the initial phases of a project [
6]. Indoor air temperature and relative humidity in residential buildings significantly affect moisture, material durability, heating, ventilation, air-conditioning systems’ performance, and occupants’ comfort [
7].
Ishak et al. [
8] analyzed different design deficiencies, having observed the effects of defective design in building maintenance. They concluded that building designers are not always aware of the degree of maintenance required for building elements, and do not usually collaborate with maintenance personnel to help improve routine tasks, leading to implications to future maintenance and its costs.
Conceição et al. [
9] developed a system for the inspection, diagnosis and rehabilitation of roofs, within a proactive maintenance strategy for the prevention of anomalies. They classified common flat roof anomalies and studied their most probable causes through non-destructive in situ methods, along with various rehabilitation techniques, through correlation matrices.
Al-Homoud [
10] addresses the impact of the thermal design of envelopes on buildings’ thermal performance in hot climates, and emphasizes proper material selection according to building type and climate conditions.
Morgado et al. [
11] analyzed the influence of maintenance in flat roofs of 26 buildings in operation in Portugal, concluding that more aggressive climate conditions require specific maintenance plans based on the state of degradation of the elements and on the aggressiveness of the environment. Hamkhiyan [
12] carried out a hydrothermal and environmental comparative analysis of the different roof construction solutions in the Mediterranean climate, studying thermal transmittances and external and interstitial condensations.
Carretero-Ayuso et al. [
13] analyzed design deficiencies of flat roof projects in Extremadura (Spain), detecting that a large number of roof projects are inadequate; they did not, however, further examine the influence of climate conditions or building location [
14] in the problems arising during buildings’ service life. In turn, Alba Cruz et al. [
15] analyzed the influence of improved construction quality controls on the designs of waterproofing systems, but also did not take into account climate conditions.
Idris [
16] found that deficiencies in flat roofs in warm and dry climates usually appear because designers fail to take climate factors (particularly, precipitation) into account. Karatasou et al. [
17] analyzed the effects of urban meteorology on building designs, focusing on heat islands and the canyon effect, though they did not study the effect of these phenomena on the appearance of building deficiencies.
The climate conditions [
18] and the demographic environment affecting buildings directly influence the durability of their construction materials [
19]. Nevertheless, no studies were found that rigorously analyze the influence of climate conditions on building roof deficiencies [
20]. There are also no precedents that consider the expert reports related to complaints by users as a source of analysis.
In summary, prior research has focused on surveys (of users, designers, developers and/or builders) with samples of small statistical size and, for the most part, on detecting specific problems related to materials used in construction.
This research, then, uses judicial complaints by users to identify the types of construction deficiencies occurring in building roofs. In addition, the influence of climate conditions on the appearance and concentration of those deficiencies is analyzed, according to climate-geographical and thermal-hygrometric conditions, which include the following variables: latitude, situation, type of climate, precipitation, heating degree days, cooling degree days and wind speed. This provides research and building stakeholders with a tool to improve the maintenance of building roofs, allowing them to minimize errors in the design and execution stages and reduce repair costs throughout the service life. Moreover, the results can be incorporated into building roof maintenance plans, to optimize the frequency of preventive maintenance activities.
2. Methodology
This paper focuses on the civil responsibility insurance records of building surveyors and technical architects across Spain [
21]. Each of the records meets the requirement of being related to a user complaint filed between the years 2008 and 2010 [
22].
The sequence used to identify roof deficiencies was as follows: with the appearance of a deficiency in a building, users file complaints in court for their repair. Once the judicial process is initiated, expert reports are produced, verifying the existence of said deficiencies [
23]. After several years, with a ruling having been arrived at, the authors of this research finalize the number and type of construction deficiencies found, and incorporate the results in the study. The 763 deficiencies analyzed correspond to the entirety of complaints raised during this period in Spain.
This research considered the two construction variants that exist for this building unit: ‘flat roofs’ (FR) and ‘pitched roofs’ (PR) [
23]. The constructive deficiencies indicated in
Table 1 were typified for these two variants.
Building typologies were classified into: ‘apartment blocks’ (BT1), ‘detached houses’ (BT2), ‘semi-detached houses’ (BT3) and ‘other typologies’ (BT4).
Furthermore, the research is intended to analyze the influence that certain climate-geographical conditions can have on construction deficiencies, as well as the greater or lesser concentration of cases according to other additional thermal-hygrometric conditions, as described in
Table 2. The handling and processing of said conditions was carried out according to the building’s location.
Thermal-hygrometric conditions (heating degree days, cooling degree days and wind speed) are characterized as shown below:
Heating degree days (HDD) are defined as the sum (taking into account all days of the year) of the differences between a base temperature of 20 °C, taken as a reference, and the average temperature of the day when said temperature is lower than the base temperature [
24].
As for the calculation of average wind speed (WS), the normal figures of the annual compass rose of each geographical zone were considered, for the period from 1971 to 2000 [
25]. Precipitation data was obtained from the Spanish Meteorological Agency [
25].
Once construction deficiencies were obtained and quantified, they were characterized according to the climate-geographical conditions of the location of the buildings. Initially, the percentages of these roof deficiencies were calculated according to conditions A, B and C. Subsequently, these conditions were combined in pairs in order to ascertain which had a greater percentage.
The ten results by ‘segments of climate location’, as per the three conditions, were defined and sorted in decreasing order to obtain ‘ranges of concentration of anomalies’, according to the percentage obtained. From the values of these ranges, the ‘climate-geographical areas’ were established in such a way to simplify those ten combinations as per the three conditions into just four areas (RED, ORANGE, YELLOW and WHITE).
3. Results
It was found that, of the 763 cases of deficiencies analyzed, nearly 1/3 of all deficiencies appeared on pitched roofs (PR = 30%), and the remainder on flat roofs (FR = 70%). These deficiencies are analyzed in the sections below.
From among all these cases, those buildings that were not housing (either apartment blocks or houses) accounted for just 2.1% of the total (BT4 = 16). Given this small percentage and the different uses contained in this codification, it was decided not to include it in next figures.
3.1. Results by Type of Construction Deficiency
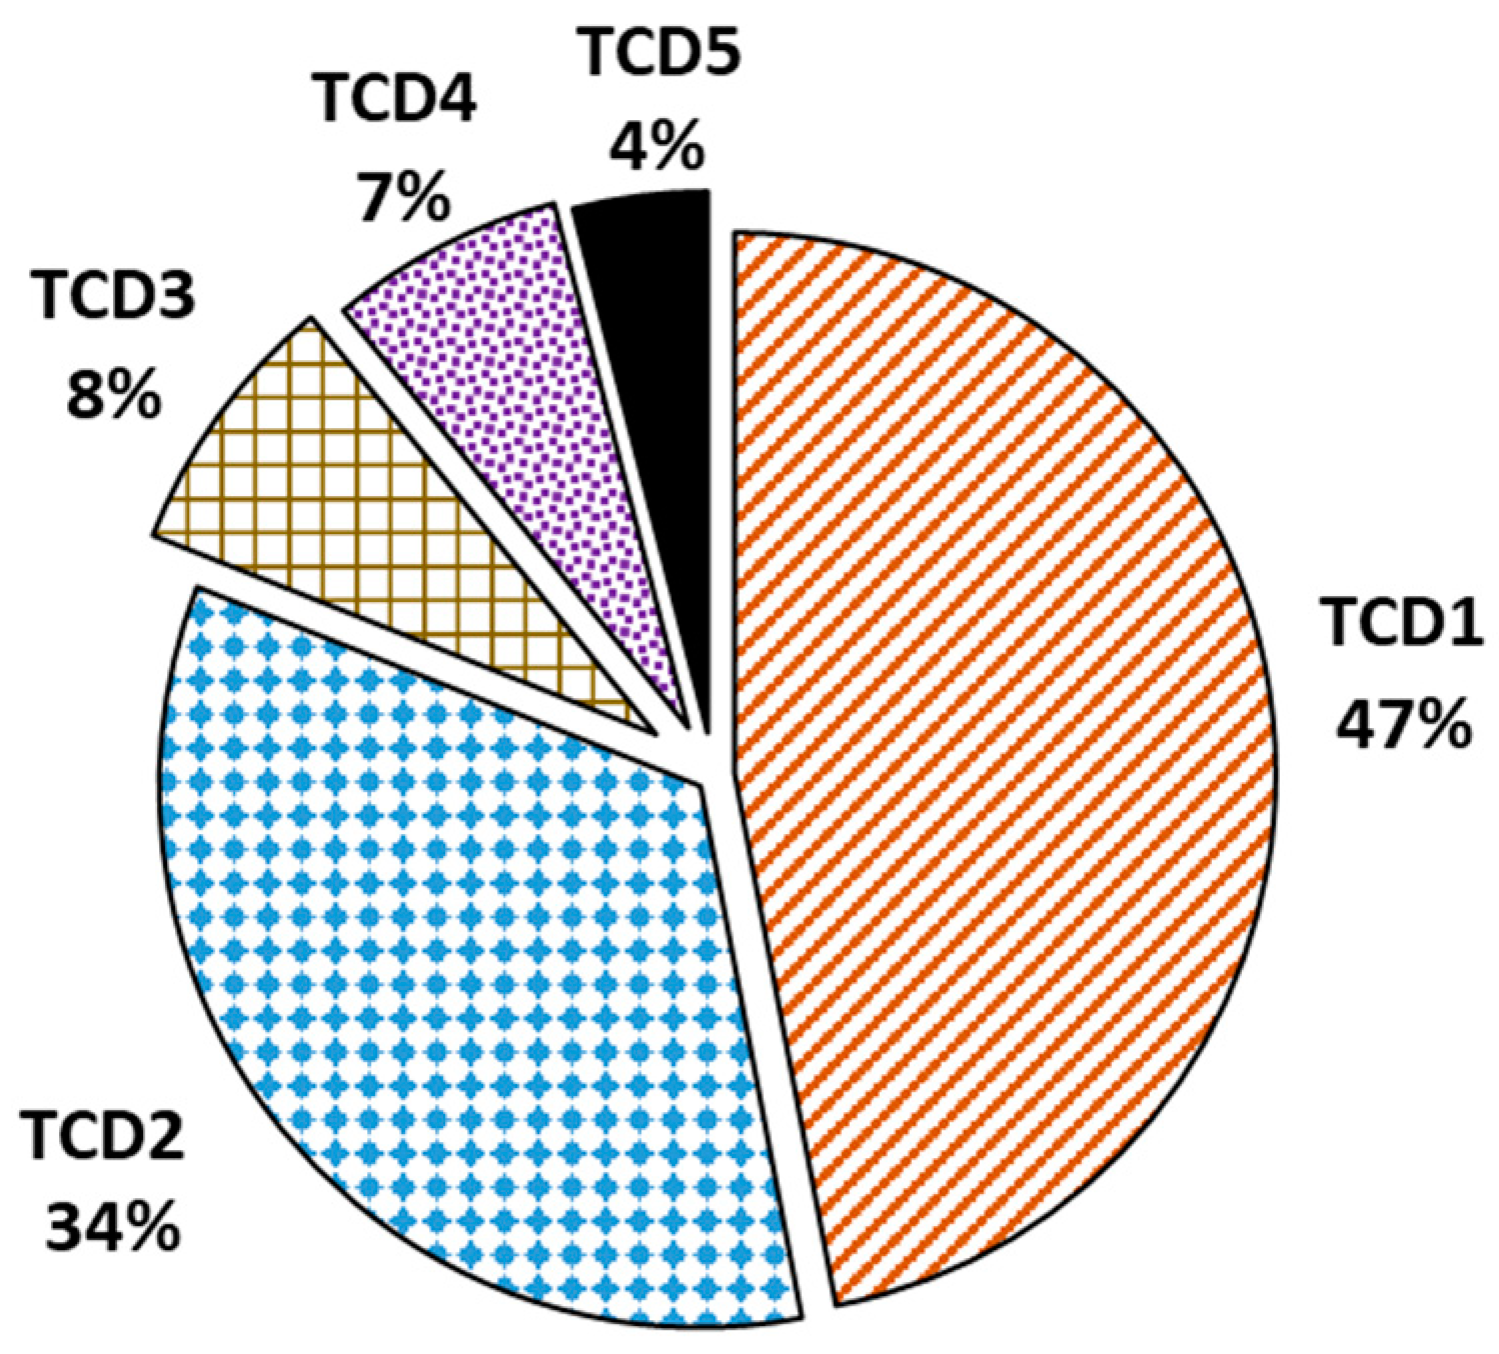
Figure 1 shows the number of cases by types of construction deficiency. The type with the highest number of cases was ‘localized infiltration’, with 355 cases (TCD1 = 47%), followed by ‘moisture by infiltration’, with 263 cases (TCD2 = 34%).
3.2. Results by Building Typologies
During data collection, the building typology for each of the construction deficiencies was also analyzed. The general figures resulting therefrom were:
apartment blocks (BT1 = 57%),
detached houses (BT2 = 21%),
semi-detached houses (BT3 = 20%) and
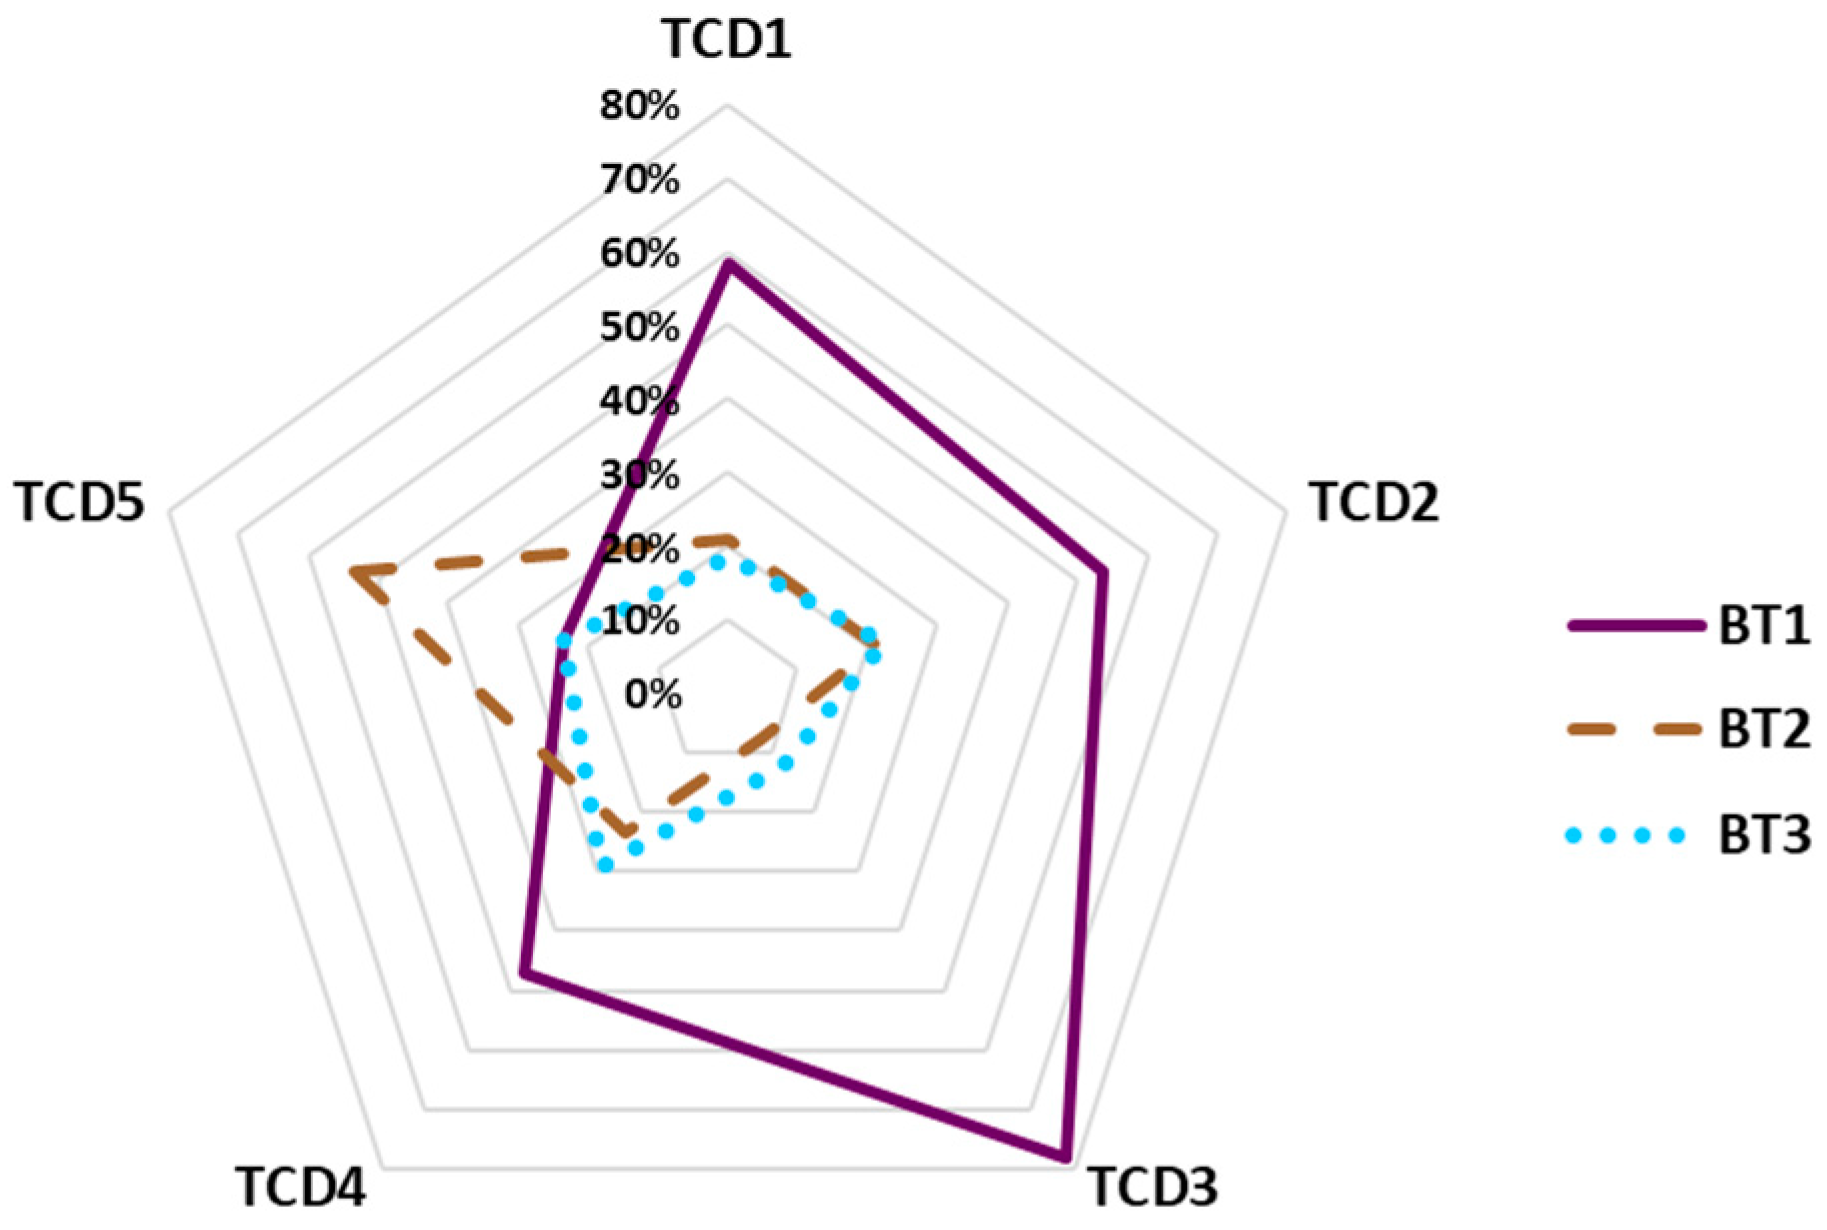
other typologies (BT4 = 2%). In turn, the percentages according to type of construction deficiency and building typology are shown in
Figure 2 (BT4 was excluded from the chart given its small presence).
3.3. Climate-Geographical Study
3.3.1. Determination of Climate Location Segments
According to the central section of
Table 3 it can be concluded that there are 2 segments of geographical location which obtain much higher results than the rest, in terms of presence of construction deficiencies: ‘Coastal-Mediterranean’ and ‘Coastal-North’ (in both cases > 40%).
Conditions A, B and C were combined (lower section of the same table), showing that the most cases are found in ‘Coastal-North-Oceanic’ and ‘Coastal-North-Mediterranean’ (> 18% each).
3.3.2. Ranking the Areas According to Normalized Frequencies
Table 4 establishes a quadrant wherein each of the climate-geographical areas is defined according to the rank of concentration of anomalies. Thus, and according to the percentage of construction deficiencies in roofs (%RD), if this figure should be greater than 15, it will be in the RED area (R); should it be between 12 and 15, it will be in the ORANGE area (O); should it be between 6 and 12, it will be in the YELLOW area (Y); and, finally, should it be less than 6, it will be in the WHITE area (W).
The aforementioned
Table 4 also includes an intermediate column (relative frequency) with the relation of the percentage of construction deficiencies according to the number of houses in Spain (the calculations were done taking into account the figure for each of the climate location segments) [
26]. Given that the relative frequencies were not high, the data was normalized so that the highest frequency was assigned a value equivalent to 100% and the remaining data were referred to this normalized value (standardized relative frequency column); this normalization is what made the creation of the climate-geographical areas R, O, Y and W possible.
Table 4 also shows that area R corresponds to the coastal administrative demarcations localized in the Central and North parts of Spain. Area O corresponds to the inland part of Spain, localized in the North-Central part of Continental climate. In turn, area Y contains the coastal parts localized in the South Mediterranean zone. Finally, area W contains the administrative demarcations with a sub-tropical climate and all others not included in the three previous areas.
In a subsequent phase, a fourth new variable was considered in order to observe which results and variations might result therefrom [
25]: the annual precipitation (condition D) of each of the administrative demarcations; represented in
Table 5. As shown in said table, there are four geographical segments (defined by their ‘situation-latitude-climate’), that are sub-divided into two (resulting in a total of eight; marked with * in this table), as they contain within them different values for annual precipitation (with their different classes defined as low/medium/high). These segments are: ‘Inland-North-Continental’ (broken down into medium precipitation, with %RD = 9.61% and low precipitation, with %RD = 5.37%), ‘Inland-Central-Continental’ (broken down into medium precipitation, with %RD = 11.24%, and low precipitation, with %RD = 2.37%), ‘Coastal-South-Mediterranean’ (broken down into medium precipitation, with %RD = 2.37%, and low precipitation, with %RD = 7.12%) and ‘Inland-North-Oceanic’ (broken down into medium precipitation, with %RD = 0.62%, and high precipitation, with %RD=0.50%). Re-sorting the resulting figures in decreasing order, we can conclude that:
The second area of concentration of anomalies (area O) disappears, as there is no geographical segment with %RD between 12 and 15 (for which reason the number of climate-geographical areas changes from 4 to 3).
The three geographical segments with the most intensity of percentage of deficiencies remain the same (Coastal-North-Oceanic, Coastal-North-Mediterranean and Coastal-Central-Mediterranean), and area R remains unchanged.
The inclusion of precipitation in the geographical analysis does not add significant value. It was observed that there are some zones with high or medium precipitation that are in climate areas of lesser incidence (W). Equally, the three segments that make up area R (already indicated in point b, above) see no changes to their position or percentage figures when precipitation is added. It should be mentioned, nevertheless, that the inclusion of condition D allowed us to reduce the number of areas to just three (R, Y and W).
This last statement is compatible with the fact that the most numerous deficiencies are ‘localized infiltrations’ (TCD1), more numerous than—for example—deficiencies related to the existence of fissures. In fact, this statement is aligned with what is indicated by the Spanish regulation on roofs [
27], which envisages one same type of design for their waterproofing, as well as one same level of calculations and safety (independently of the precipitation areas in which the buildings may be located).
3.4. Analysis of Climate-Geographical Conditions
The figures for percentage recurrence were found, in order to determine the influence of climate-geographical conditions in the roof deficiencies encountered in the research. The results are shown below.
3.4.1. Localized Infiltration (TCD1)
It was found that this construction deficiency is more frequent in flat roofs (FR = 70.99%) than in pitched roofs (PR = 29.01%). It occurs more often in the Mediterranean climate (43.10%) than in the Continental (28.45%), Oceanic (25.35%) or Sub-tropical (3.10%) climates. It was also found that it is more frequent in the North latitude (60.00%) than in the Central (26.76%) or South (13.24%) latitudes. It is more often found Inland (31.83%) than in Coastal (68.17%) zones, and in zones with Medium (60.56%) precipitation than in those with High (23.95%) or Low (15.49%) precipitation.
The high percentage of infiltrations in flat roofs, when compared to pitched roofs, is due to the fact that, in the former, the slope is lower, which results in slower drainage and higher probability of water retention. Furthermore, the construction system is more complex and includes additional layers of material, leading to a higher probability of errors and implying a greater professional preparation on the part of the workers executing them.
3.4.2. Moisture by Infiltration (TCD2)
This deficiency is more frequent in flat roofs (FR = 75.29%) than in pitched roofs (PR = 24.71%). It was found to be more present in the Mediterranean (41.44%) climate than in the Continental (30.80%), Oceanic (24.71%) or Sub-tropical (3.04%) climates. It occurs more frequently in the North latitude (53.23%) than in the Central (33.08%) or South (13.69%) latitudes, although it appears less frequently Inland (32.70%) than in Coastal (67.30%) zones. It was also found that this deficiency is more frequent in zones with Medium (56.65%) precipitation than in zones with High (24.71%) or Low (18.64%) precipitation.
The causes of greater moisture by infiltration in flat roofs are similar to those indicated in the previous point.
3.4.3. Fissures in Brick Parapets (TCD3)
This is more frequent in the Mediterranean climate (62.50%) than in the Continental (25.00%), Oceanic (10.94%) or Sub-tropical (1.56%) climates. It appears more in the North latitude (40.63%), than in the Central (34.36%) or South (25.01%) latitudes, as well as more in Coastal (73.44%) zones than Inland (26.56%). It was also found that it occurs more often in zones with High (10.94%) precipitation than in zones with Medium (62.50%) or Low (26.56%) precipitation.
This type of deficiency may occur more frequently in Mediterranean climates given the greater thermal variability throughout the day when compared to other locations in Spain, resulting in a higher number of dilation-contraction cycles and, as such, in a higher probability of appearance of fissures. If, in addition, the building is in a coastal location, wind and ocean air pressure may amplify the consequences.
3.4.4. Condensation Moisture (TCD4)
This deficiency occurs more frequently in pitched roofs (PR = 58.82%). It is less prevalent in the Mediterranean (31.38%) climate than in the Continental (33.33%) or Oceanic (35.29%) climates and appears more in the North (70.59%) latitude than in the Central (17.65%) or South (11.76%) latitudes. It is also less prevalent Inland (35.29%) than in Coastal (64.71%) zones. Equally, it was found that this construction deficiency appears more often in zones with Medium (50.98%) precipitation than in zones with High (35.29%) or Low (13.73%) precipitation.
The higher percentage of these deficiencies in flat roofs may be due to the fact that many workers tend to place the vapor barrier on the outside of the insulation. It is also easy to find zones where the insulating material has not been placed, and others in which it is common to find few ventilation openings in the roof plans. In turn, there is a higher percentage of this deficiency in zones to the North and where there is a medium or high precipitation, given that in these zones the thermal difference between the outer and inner layers of the roof is greater; and also because the placement on site of insulation is made less carefully, as it is thought that it is not as necessary given the lack of high temperatures—even though they may lead to thermal bridges that cause condensations whenever they are not properly placed.
3.4.5. Fissures in Gable-Walls and Slab Faces (TCD5)
This deficiency is more prevalent in Mediterranean (46.67%) climates than in the Continental (36.66%) or Oceanic (16.67%) climates. It appears more frequently in the North (60.00%) latitude than in the Central (33.33%) or South (6.67%) latitudes, and in Coastal (63.33%) zones than Inland (36.67%). It was also found that it is more concentrated in zones of Medium (66.67%) precipitation than in those of High (16.67%) or Low (16.66%) precipitation.
This deficiency can occur more frequently where there is medium precipitation, given that it is here where there are more thermal changes in smaller periods of time, given that the changes in temperature help increase movements caused by dilation.
3.5. Influence of Thermo-Hygrometric Conditions
As for the thermo-hygrometric conditions shown in
Table 2, the following analysis can be made.
3.5.1. Influence of the Number of Heating Degree Days (HDD)
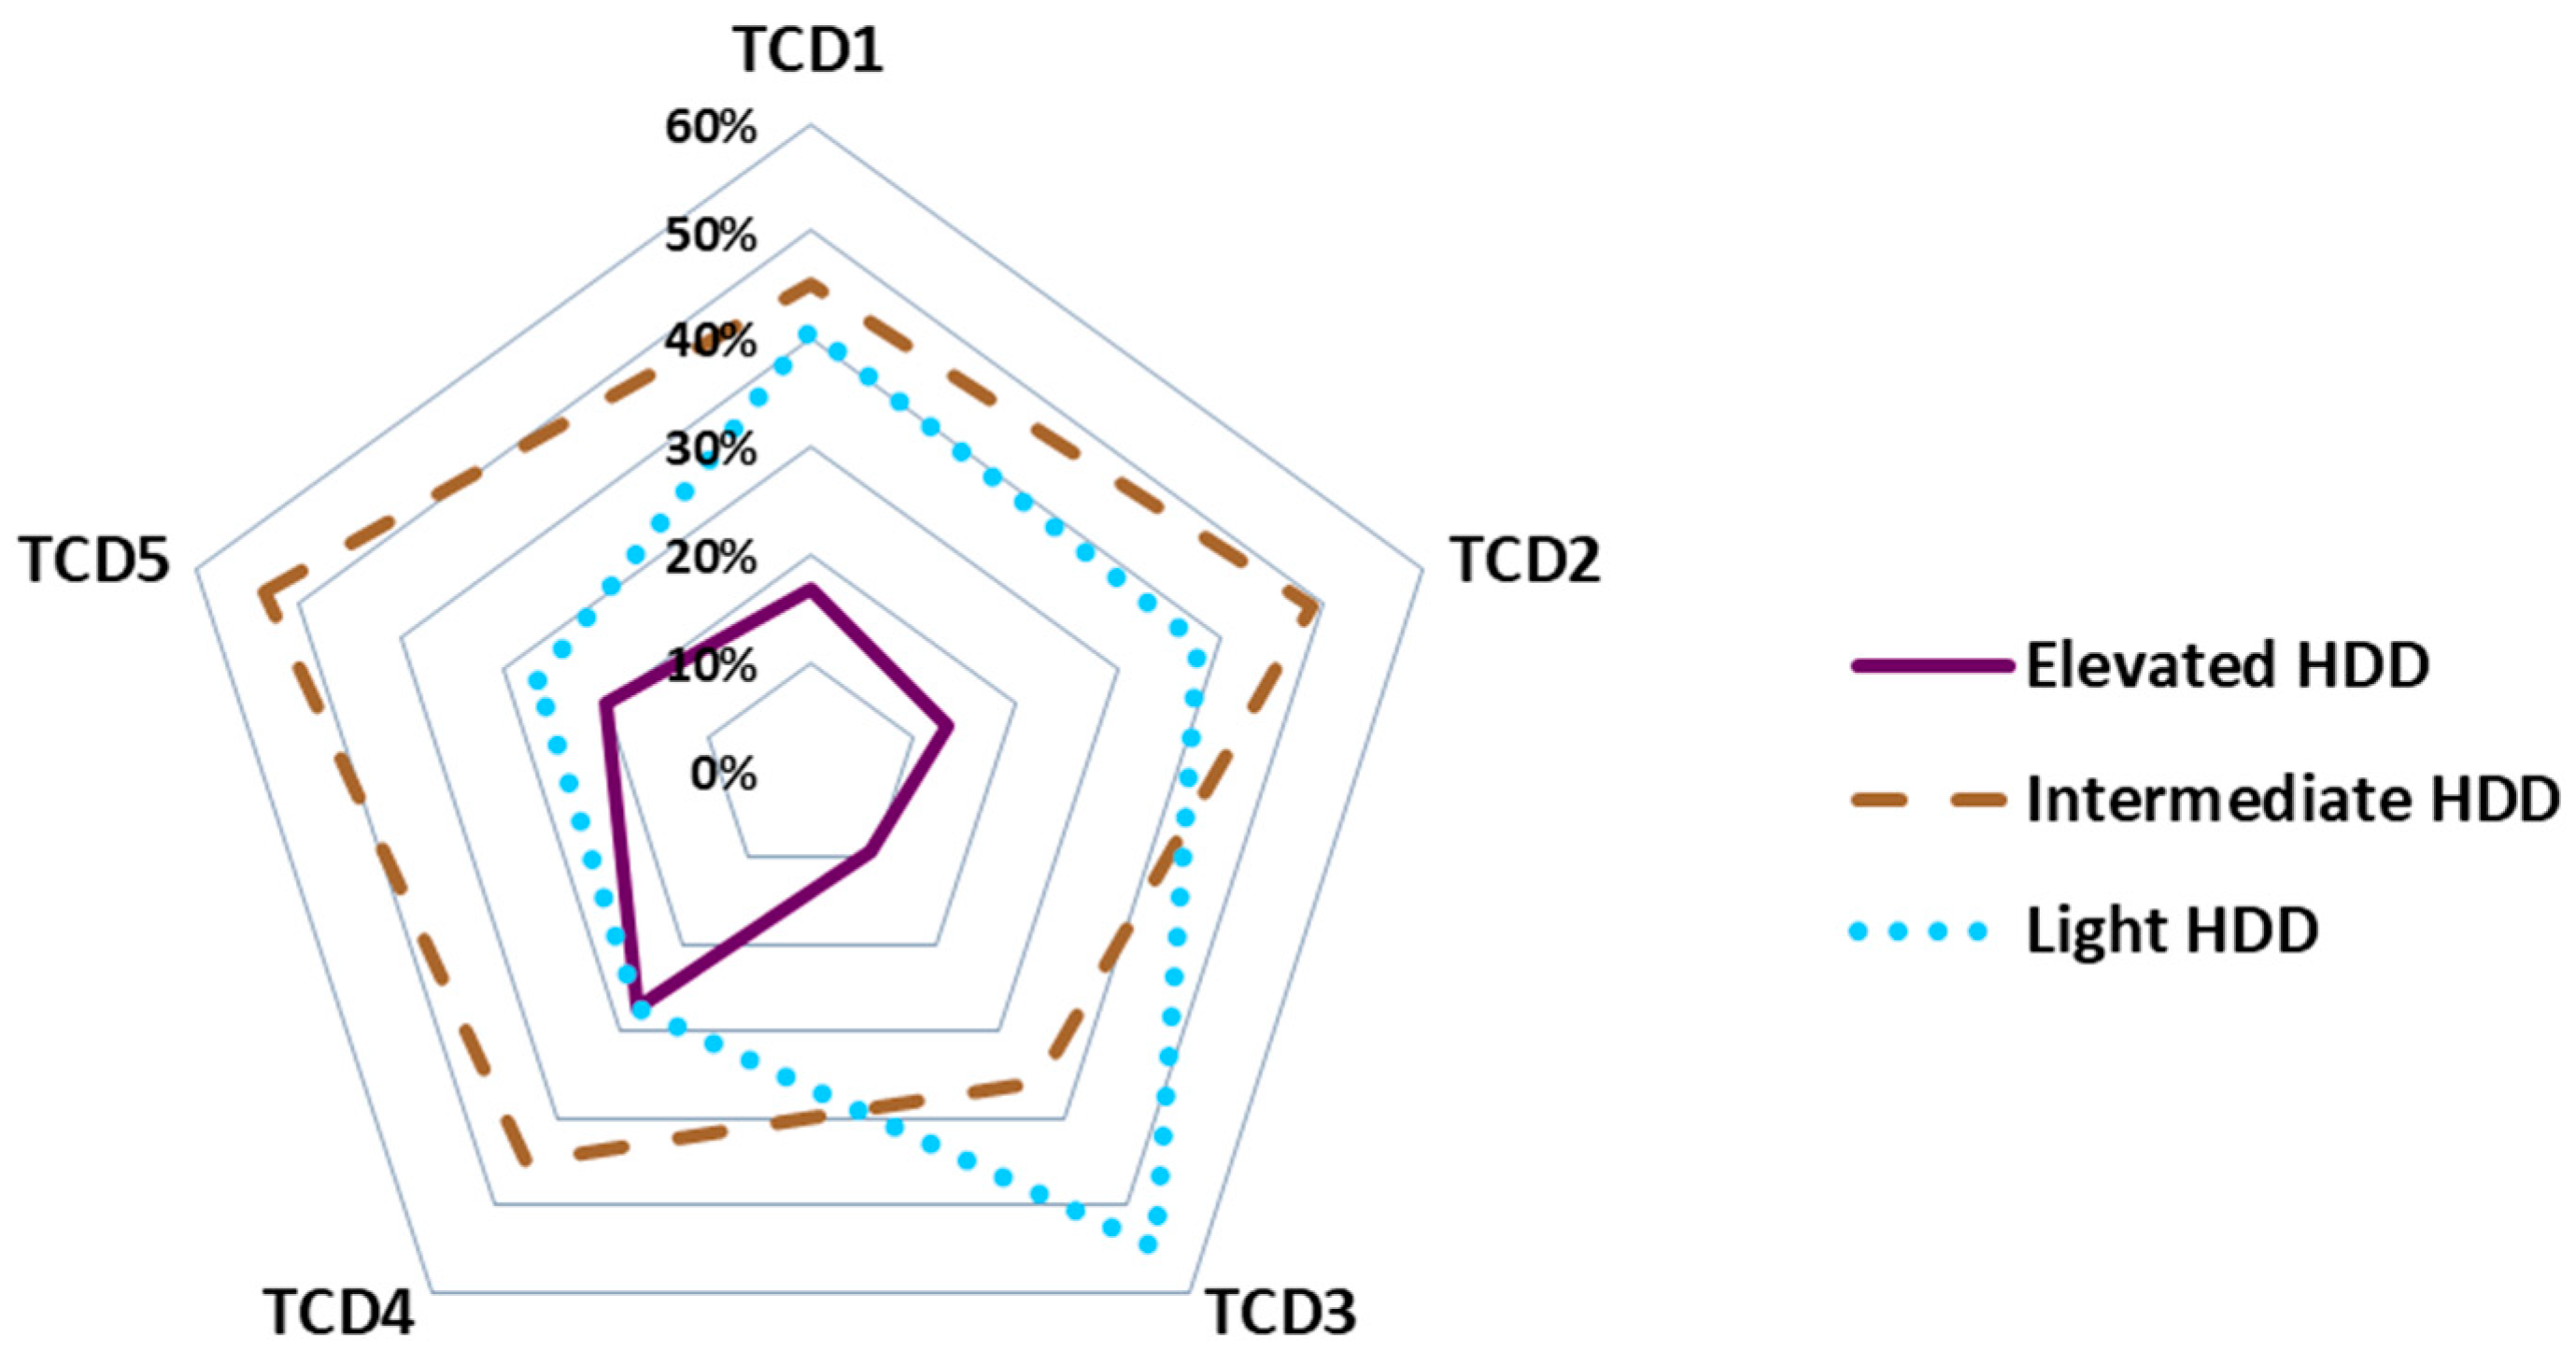
Figure 3 shows the number of heating degree days (HDD) for each roof deficiency found in the research, classified according to
Table 2. It can be seen that geographical zones with elevated heating demand have a lesser percentage of presence—by type of deficiency—in all construction deficiencies analyzed, with the exception of ‘condensation moisture’. It can also be seen that there is a higher presence in geographical zones with an intermediate heating demand (between 1800 and 2800 degree days), except for ‘Fissures in brick parapets’ (TCD3), which have a higher probability of taking place in conditions of light thermal demands. It is also observed that, in zones with an intermediate heating demand, the probability of the appearance of ‘fissures in gable-walls and slab faces’ (TCD5) is increased.
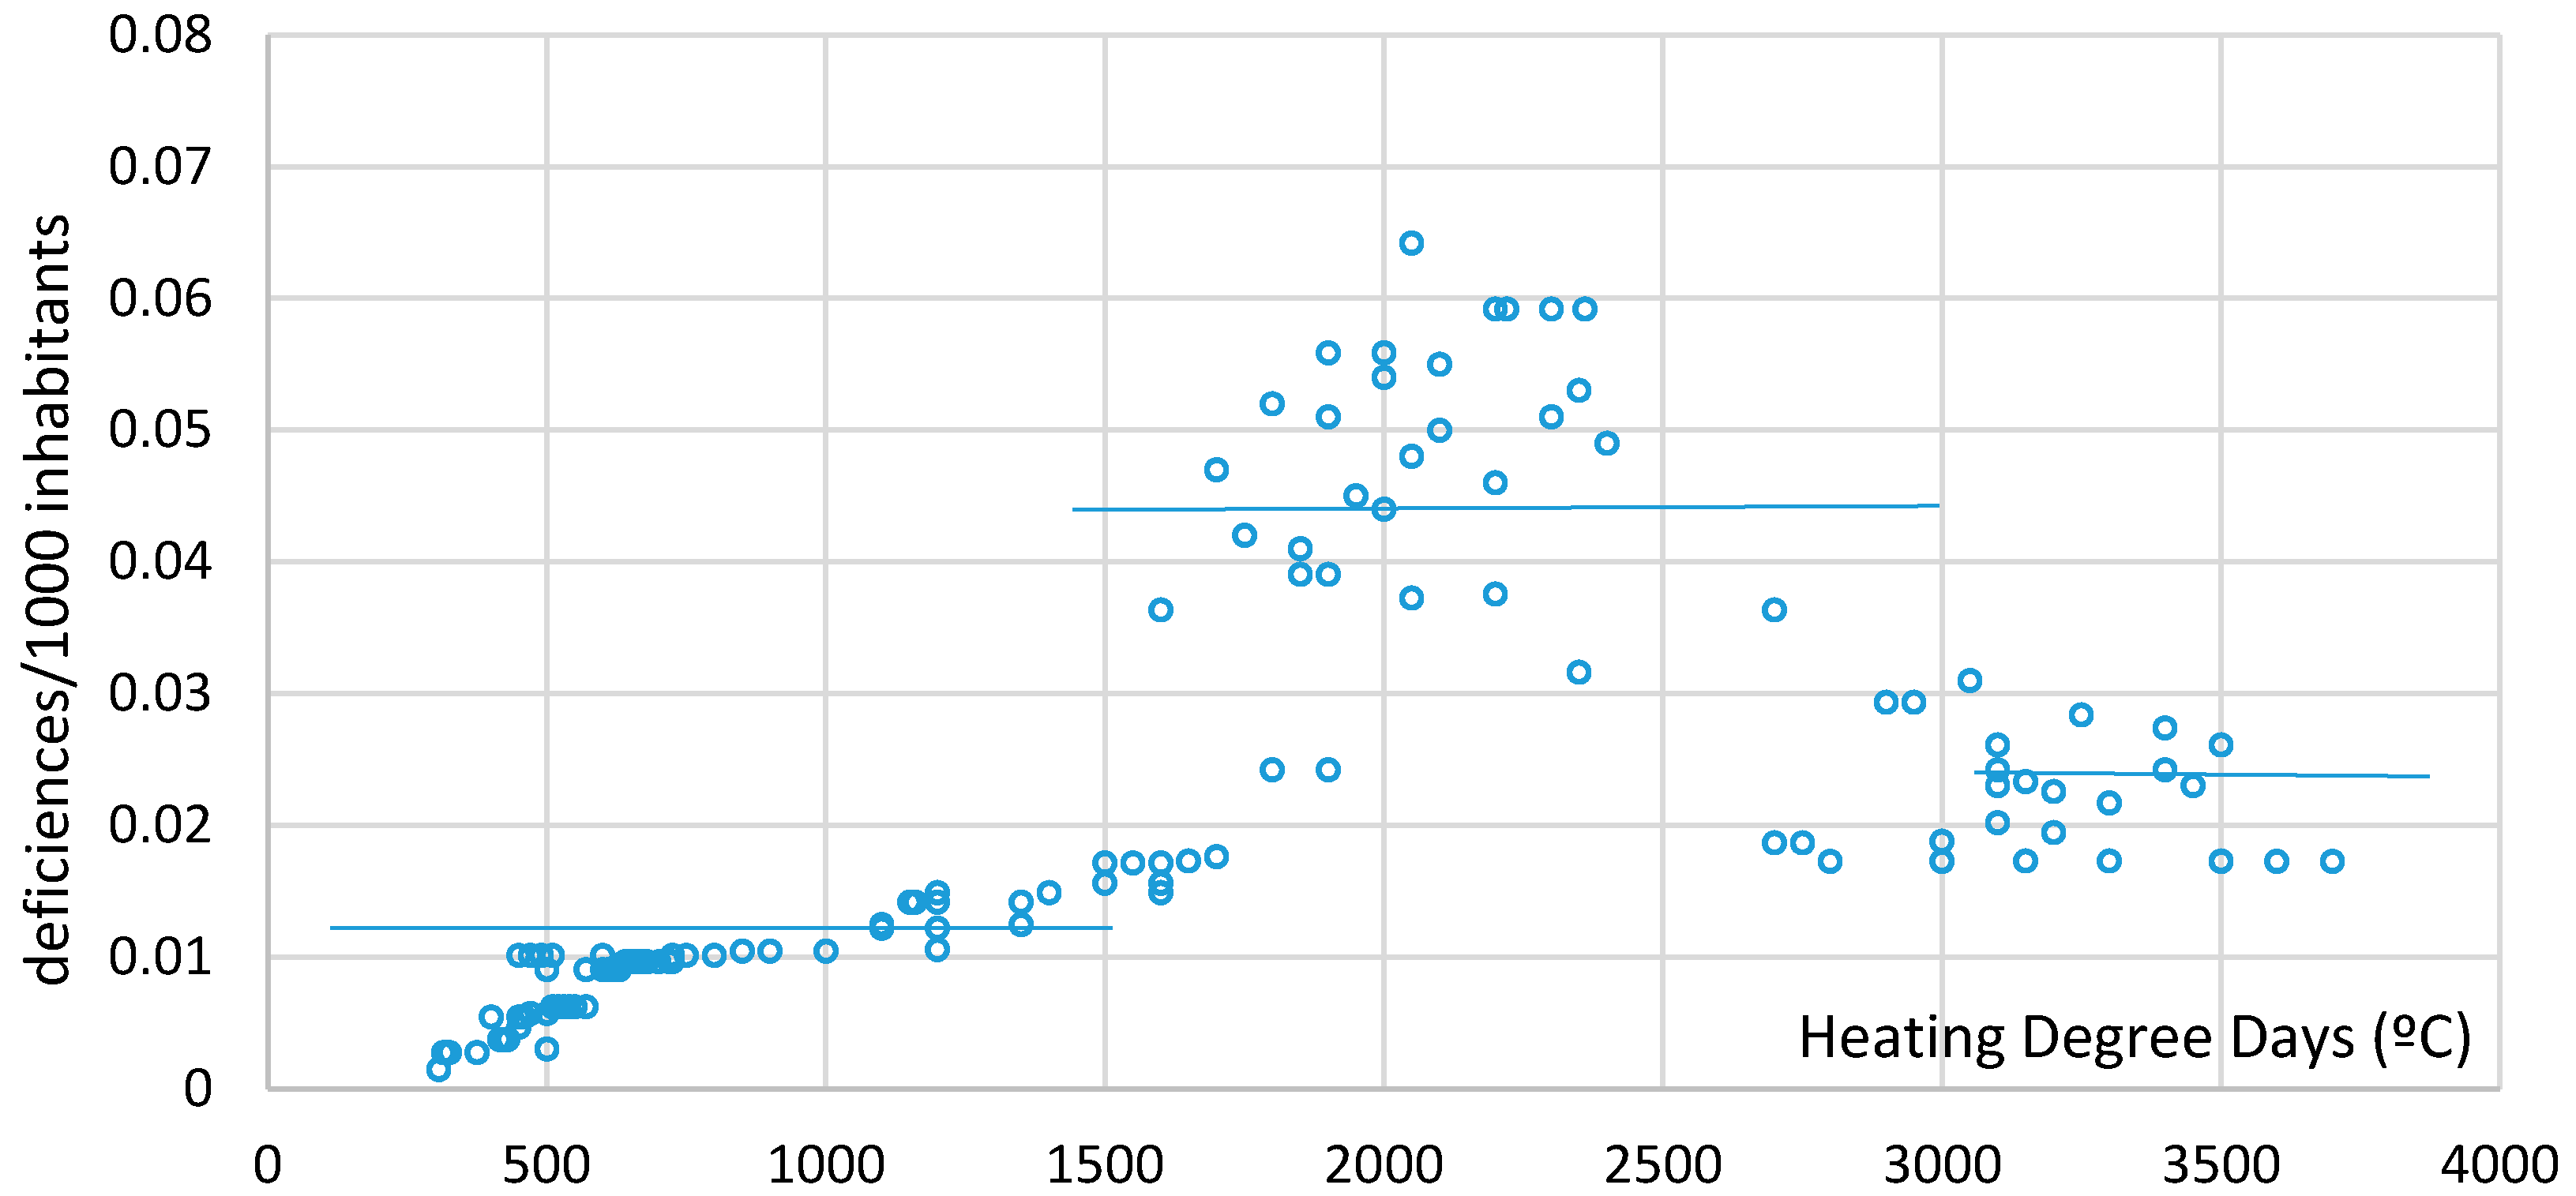
Figure 4 shows the trend analysis of the number of deficiencies per 1000 inhabitants by number of heating degree days of the building location. A higher percentage of deficiencies is found in those geographical zones where there is a thermal demand of between 1800 and 2800 heating degree days.
3.5.2. Influence of the Number of Cooling Degree Days (CDD)
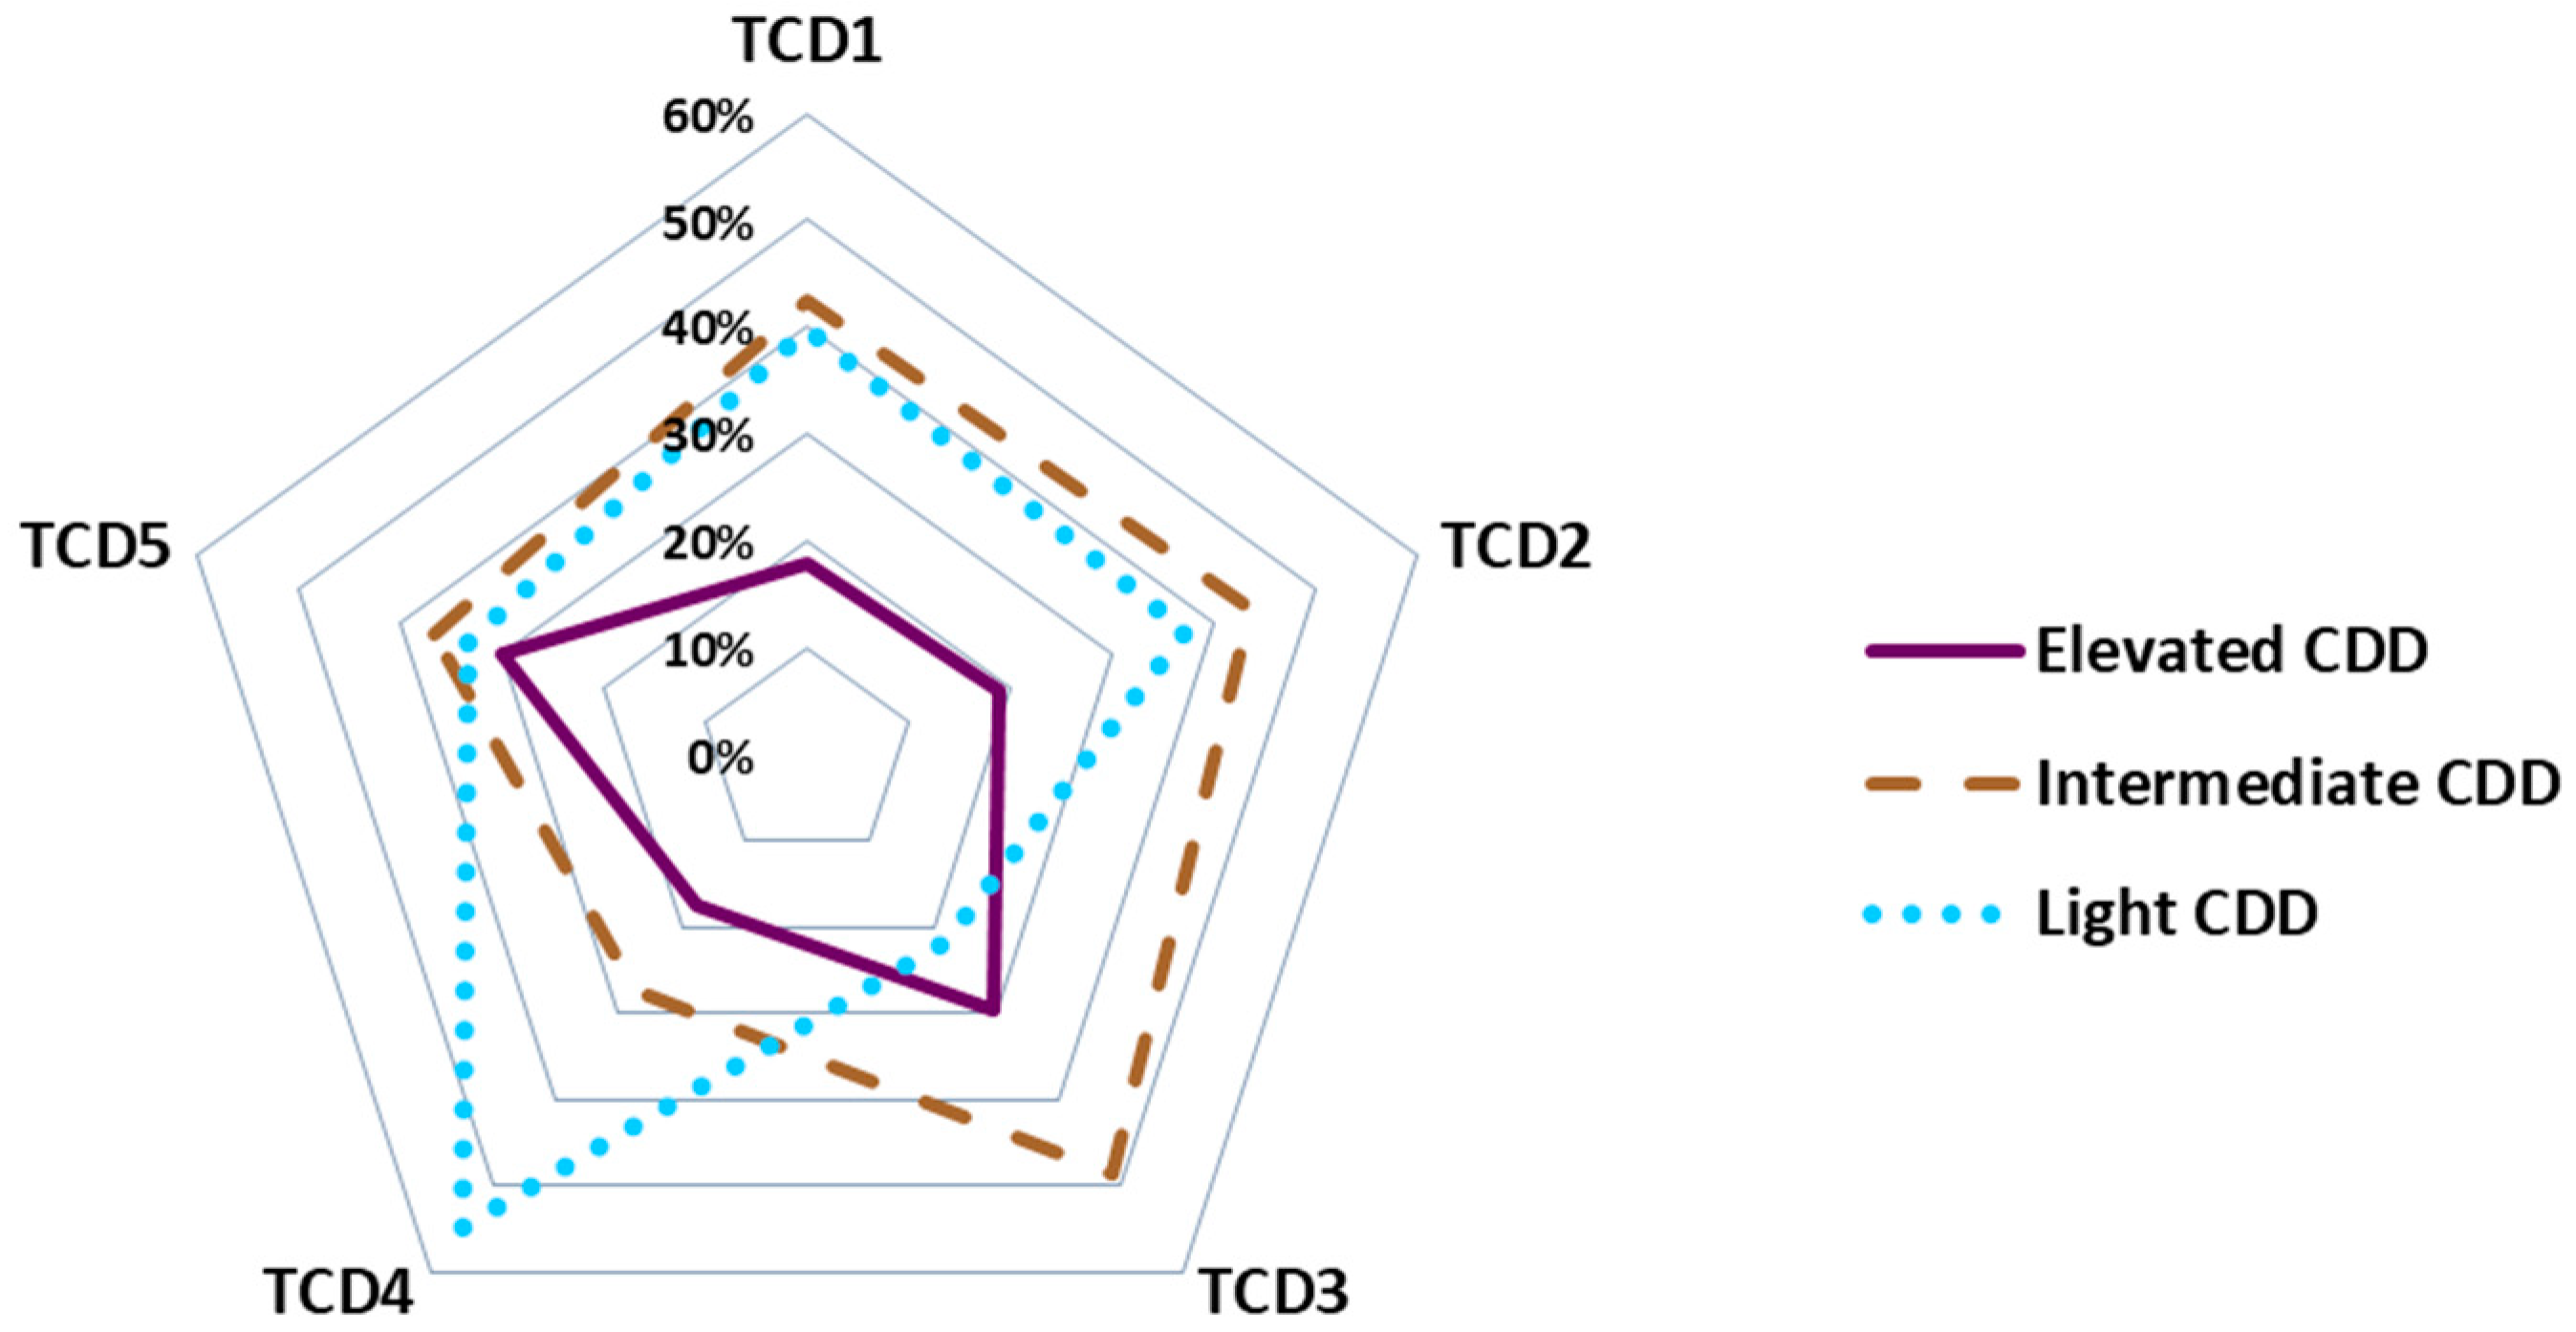
Figure 5 shows the number of cooling degree days (CDD) for each of the roof deficiencies identified, classified according to
Table 2. It is shown that, in geographical zones with elevated cooling demands (given that outside conditions are warmer in the summer months), the percentage of presence of all deficiencies analyzed decreases. It was found that the percentage of presence is greater in geographical zones with an intermediate cooling demand (between 450 and 700 degree days), except in the case of ‘Condensation moisture’ (TCD4) which has a higher risk of occurring in conditions of light cooling demands during the summer. Furthermore, it is observed that ‘fissures in brick parapets’ (TCD3) appear more frequently in buildings with an intermediate cooling demand and that ‘localized infiltrations’ (TCD1) occur less often in buildings with high cooling demand in the summer.
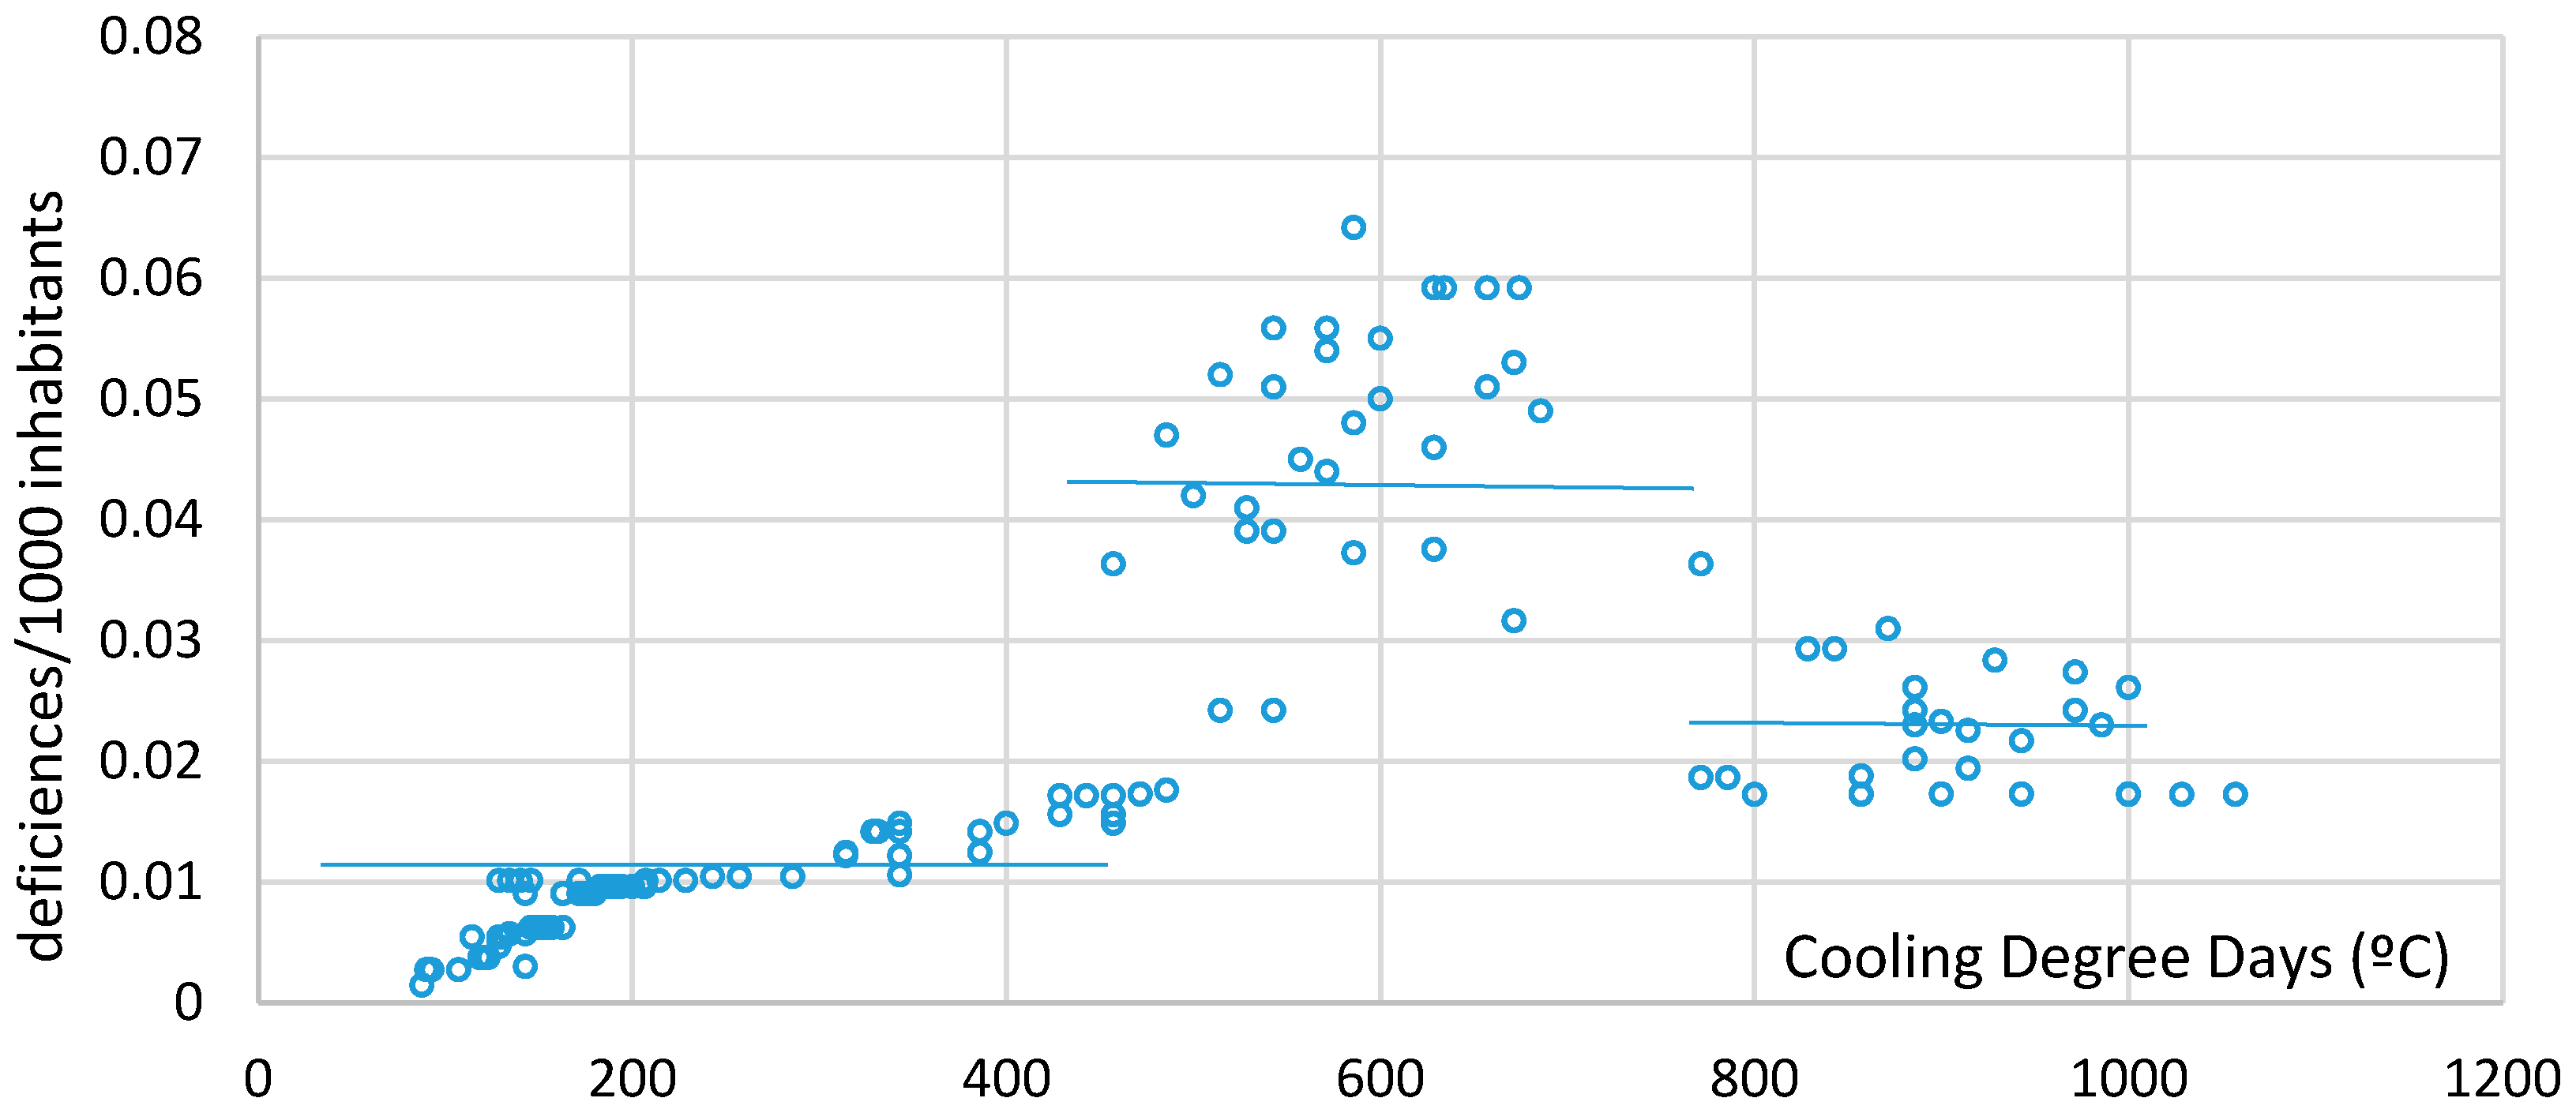
The trend analysis in
Figure 6 relates the number of deficiencies per 1000 inhabitants with the number of cooling degree days of the building location. A higher percentage of deficiencies is found in those geographical zones where there is a thermal demand of between 450 and 700 cooling degree days.
3.5.3. Influence of Average Wind Speed (WS)
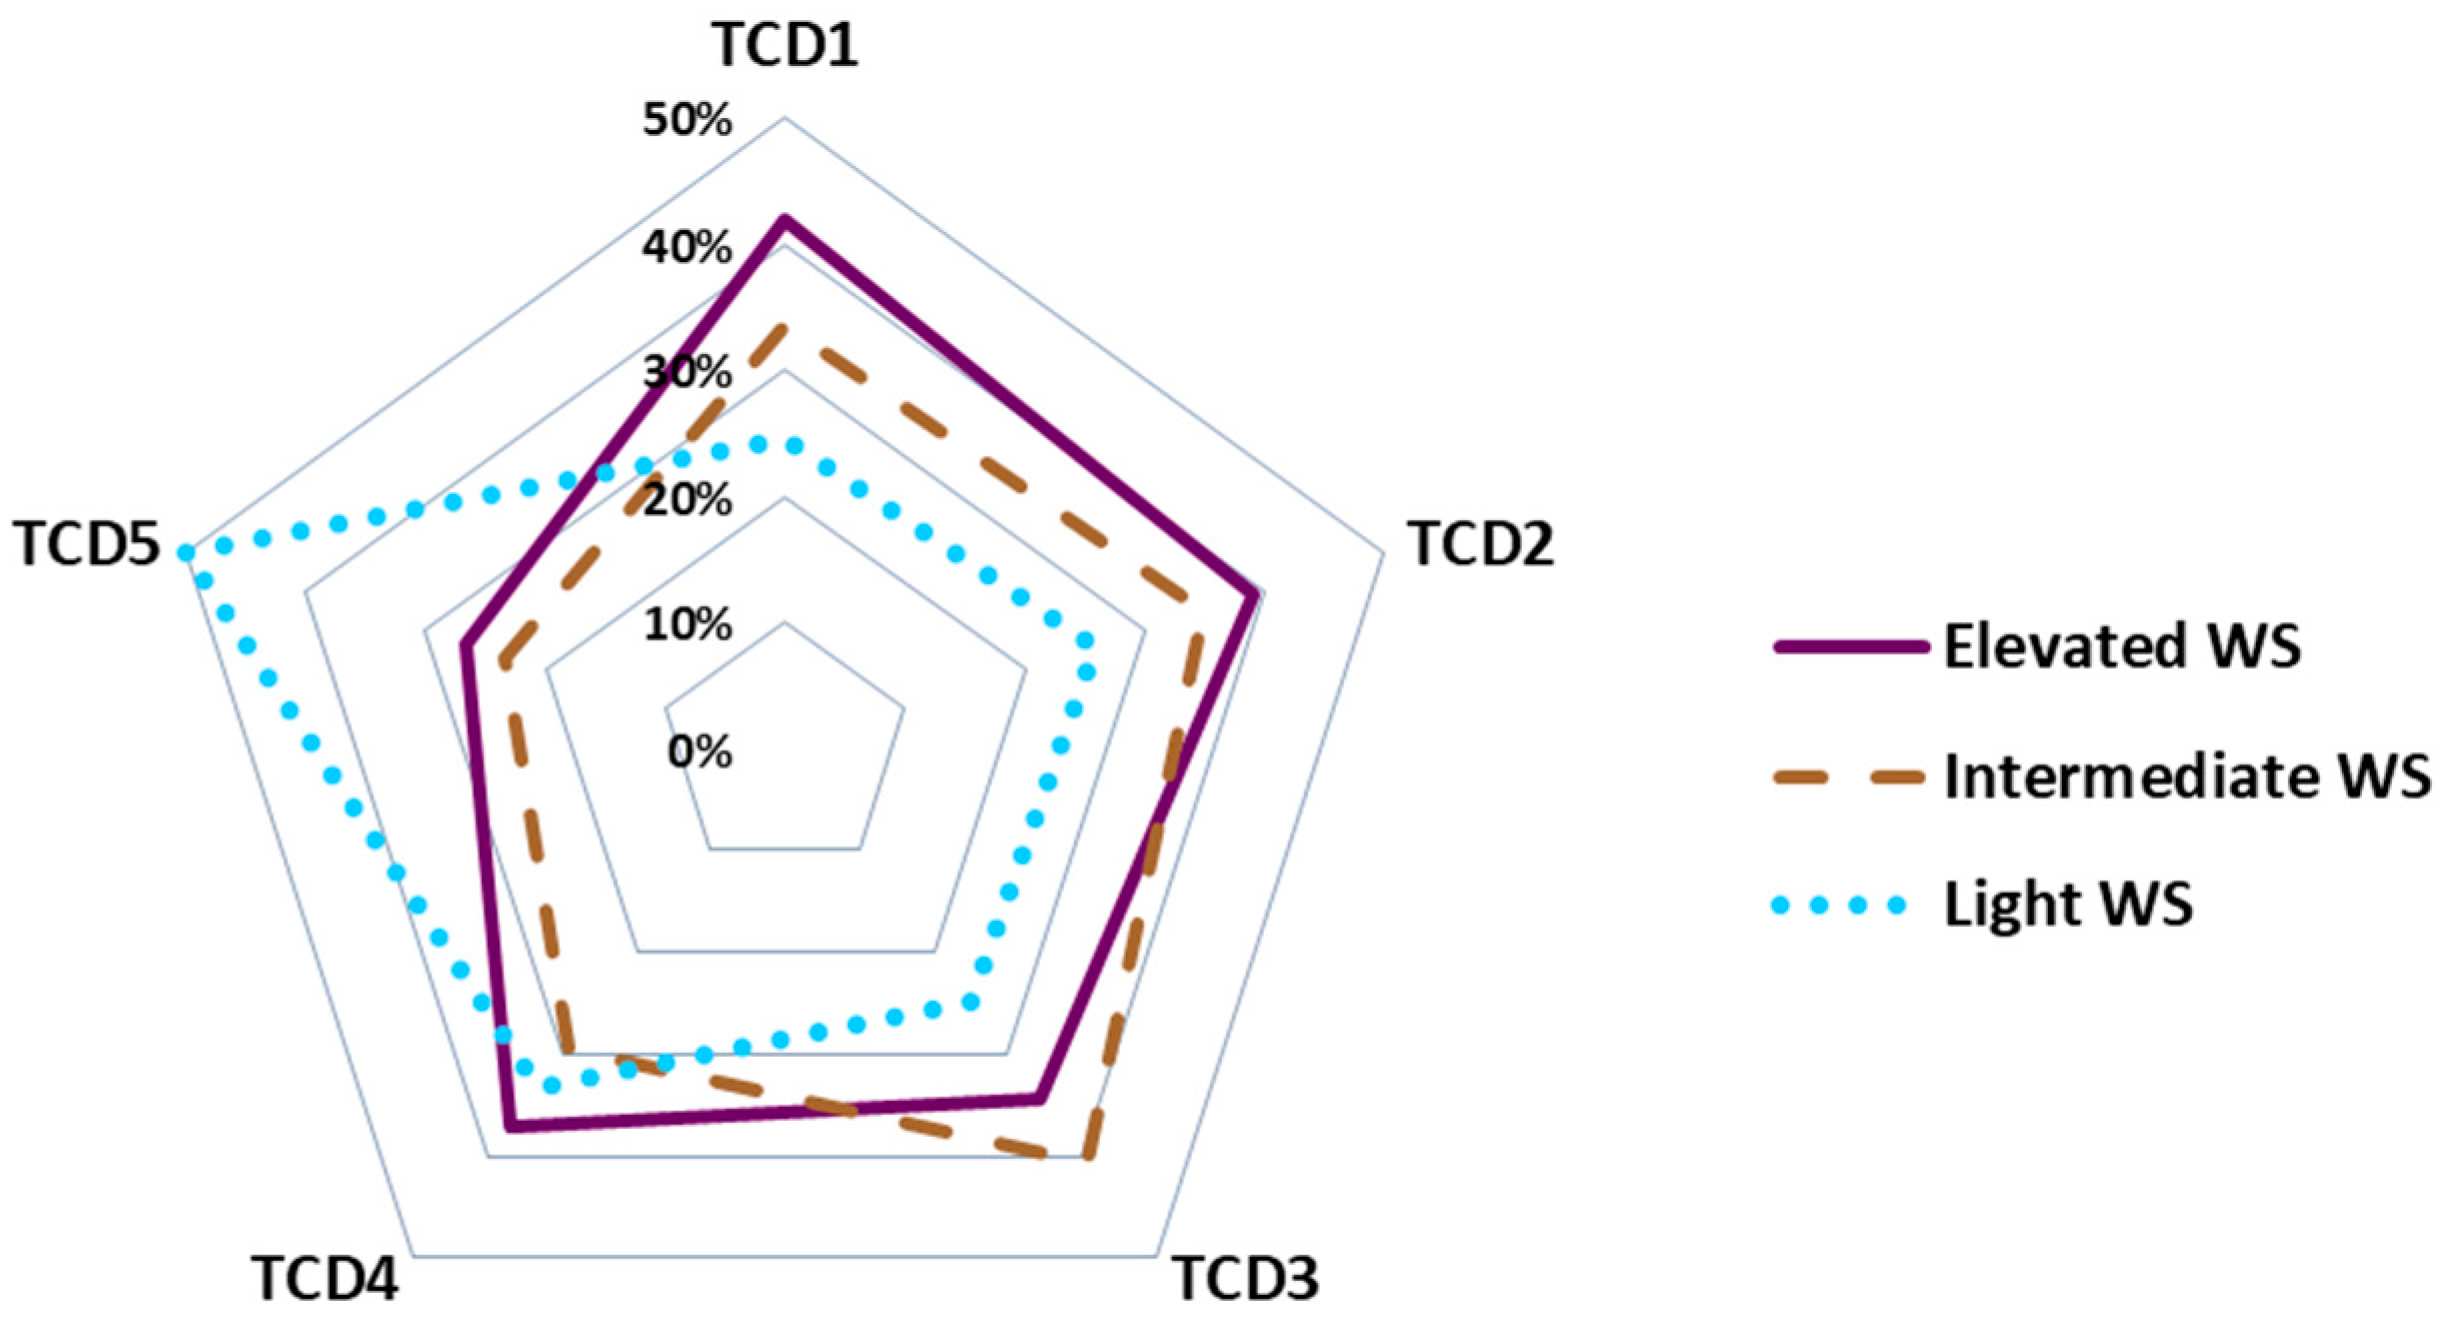
Figure 7 shows the average wind speed for each roof deficiency identified during the research, classified according to the wind speed, based on
Table 2. It can be seen how high wind speed (WS > 3 m/s) increases the percentage of presence of all analyzed deficiencies, except in ‘Fissures in gable-walls and slab faces’ (TCD5), in which the opposite effect takes place. Specifically, it is observed that ‘localized infiltrations’ (TCD1) and ‘moisture by infiltration’ (TCD2) are increased in proportion to wind speed. It is also observed that ‘fissures in brick parapets’ (TCD3) occur less frequently under light wind speed.
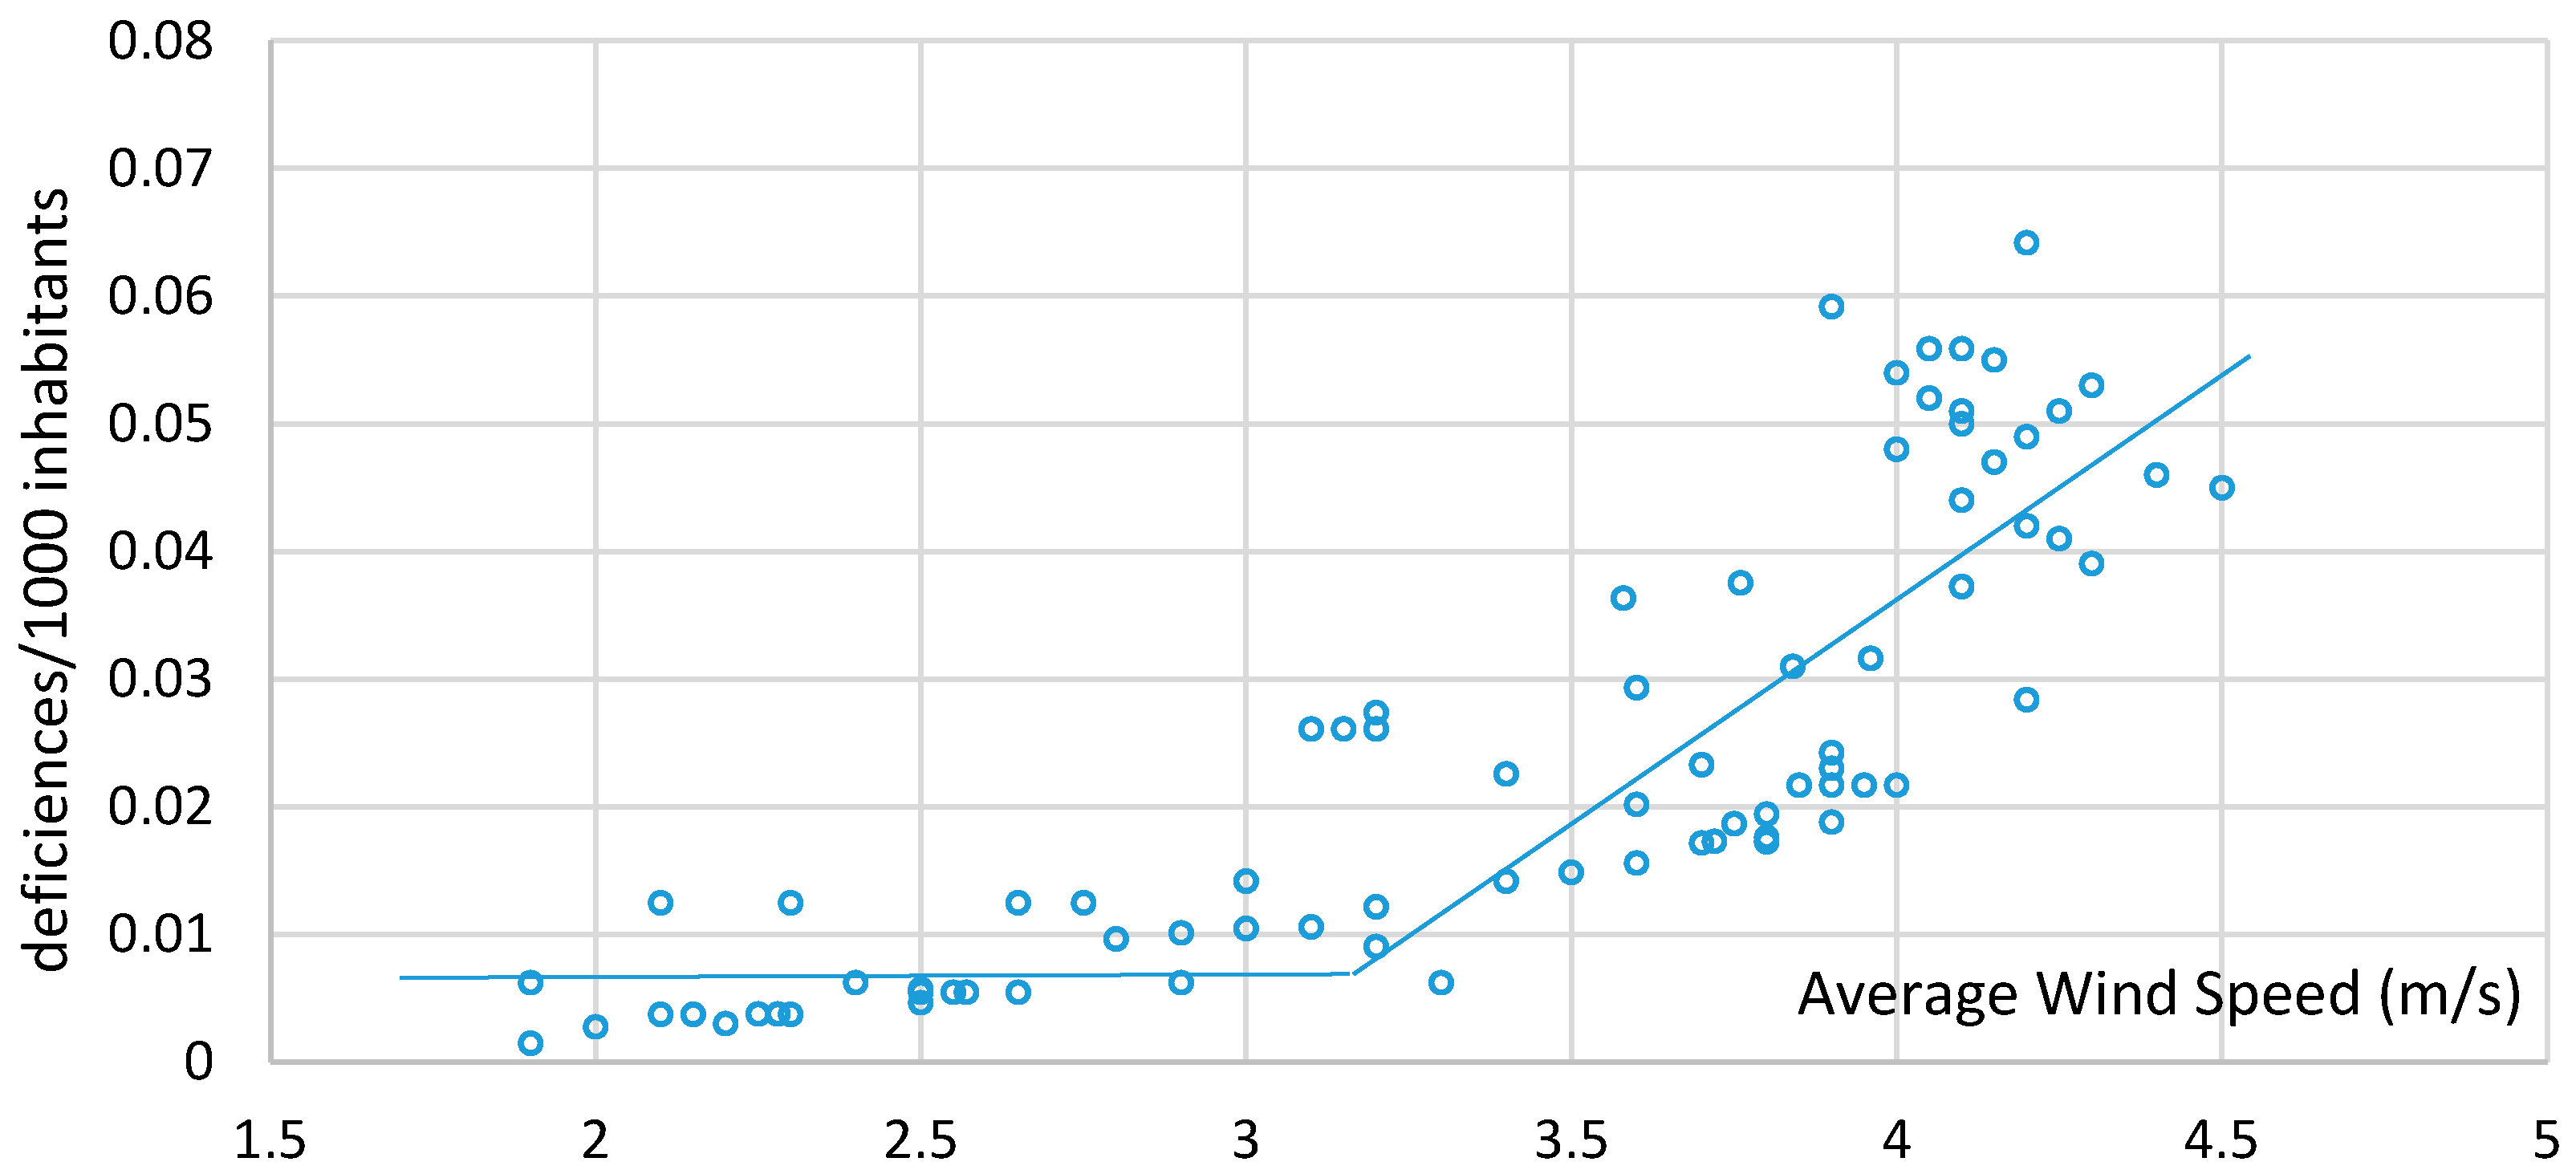
Figure 8 shows the trend analysis of the number of deficiencies per 1000 inhabitants by wind speed of the building location. It is found that an annual average wind speed greater than 3 m/s increases the probability of the appearance of deficiencies in roofs.
3.6. Statistical Analysis of Thermal-Hygrometric Conditions
To test the influence of climate conditions on building roofs, techniques based on inferential statistics were used to carry out a detailed statistical study via Analysis of Variance (ANOVA). The normality of the sample was verified by applying the Shapiro-Wilk test, calculating the mean and the sample variance. The Levene test was performed to evaluate the equality of the variances for the sample variables; an analysis of multiple comparisons (post hoc test) was carried out through the Fisher test, given the existence of these significant differences.
The null hypothesis indicates that there is no difference or association between variables of interest, so all means for the population are equal for all conditions. The p-value was compared to the significance level (95%) to test the null hypothesis, in order to seek statistical significance for mean differences. If the p-value was less than or equal to the significance level (p-value ≤ 0.05) then the null hypothesis could be rejected and it could be concluded that not all population means are equal.
Otherwise, a
p-value greater than the significance level would prove there is not enough evidence to reject the null hypothesis.
Table 6 shows the results for the
p-value corresponding to the ANOVA for deficiencies per 1,000 inhabitants, for a 0.05 level of significance.
This same table shows significant differences between the variable ‘deficiencies per 1000 inhabitants’ and the number of degree days and wind speed corresponding to the building location, which confirms what was found in the trend analyses indicated above.
4. Discussion
There are fewer deficiencies in geographical zone with an average thermal demand (of between 1800 and 2800 degree days). This may be due to the fact that geographical zones with lesser thermal demands are those wherein there is a higher ambient temperature (especially between June and September, which can record temperatures above 45 °C), which facilitates the thermal expansion of brick parapets, and their subsequent fissuration.
On the other hand, there is a higher percentage of deficiencies in geographical zones with an average cooling demand (between 450 and 700 degree-days). This may be due to the fact that geographical zones that do not need cooling in the summer are usually those with great climate severity in the winter, requiring heating during those times. This leads to great thermal differences between the inside and outside of buildings, leading to condensation moisture in certain construction points, with thermal bridges and in divisions with low levels of ventilation [
28].
All deficiencies, other than ‘Fissures in gable-walls and slab faces’ (TCD5) are more prevalent with wind speeds greater than 3 m/s. This can be due to the fact that the greater pressure exerted on the brick veneers applied over the slabs and pillars leads to them being pressed against the structure, thus reducing the opening for this type of fissures, while it could also be due to the lack of movement joints that allow expansion/contraction due to temperature, moisture or damages caused by freezing/defreezing.
The maintenance of roofs is essential to preserve their insulation and water sealing [
29]. Should the waterproofing-sealing system be damaged as a result of unforeseen circumstances, and infiltrations take place, the damages in question should be immediately repaired. The cost of these repairs greatly influences decision-making, especially if they are regular [
30], given that building a new roof could end up being more cost-effective than successive repairs [
31]. It is considered that it is a good idea to increase frequency and the maintenance level in zones with a higher probability of construction deficiencies, which are those to the ‘North’, on the ‘Coast’ and in ‘Mediterranean’ climate.
For the above reasons, based on the results of this research (
Table 5), three maintenance strategies emerge from this paper and could be established for roofs according to the percentage of construction deficiencies in roofs (‘%RD’) and the defined climate-geographical areas. These strategies could be incorporated in building maintenance plans to optimize the frequency of preventive maintenance activities, and would be the following:
Modality 1: Frequency according to normally established criteria. Only applicable to the WHITE climate-geographical area (see
Table 5).
Modality 2: Frequent inspections and more intensive control of inspection points. This strategy would apply to buildings with roofs which simultaneously meet at least two of the following climate-geographic criteria: ‘Coastal’ situation, ‘North’ latitude, ‘Mediterranean’ climate and ‘Medium’ precipitation. This modality would be of mandatory application in the YELLOW climate-geographical area, and optional in WHITE. It should not be applied in the RED climate-geographical area.
Modality 3: Very frequent inspections, thorough follow-up and detailed control of inspection points. To be applied as determined by the designer and, necessarily, to those buildings that, in addition to meeting at least two of the criteria indicated for Modality 2, also met at least one of the following classes related to thermal-hygrometric conditions: ‘Medium’ heating degree days, ‘medium’ cooling degree days and ‘high’ wind speed. This modality would be of mandatory application in the RED climate-geographical area and optional in WHITE and YELLOW.
Another important aspect to take into account is the maintainability of roofs; in other words, the effort required to repair them once a deficiency is found [
32]. Maintainability is inversely related to the duration and effort required by maintenance activities, therefore it is an intrinsic characteristic of roof typologies and, is also affected by climate conditions.
As a design proposal, the authors consider that the Spanish regulation should be modified by increasing the slope of flat roof plans (≥2%) and gutters in pitched roofs (≥1.5%). Furthermore, bi-membrane waterproofing systems should be used in roofs located in zones with high precipitation, it should be mandatory for these construction units to be tested once completed, and the proposal of the three maintenance plans mentioned above should be included within the Spanish technical-legal framework.
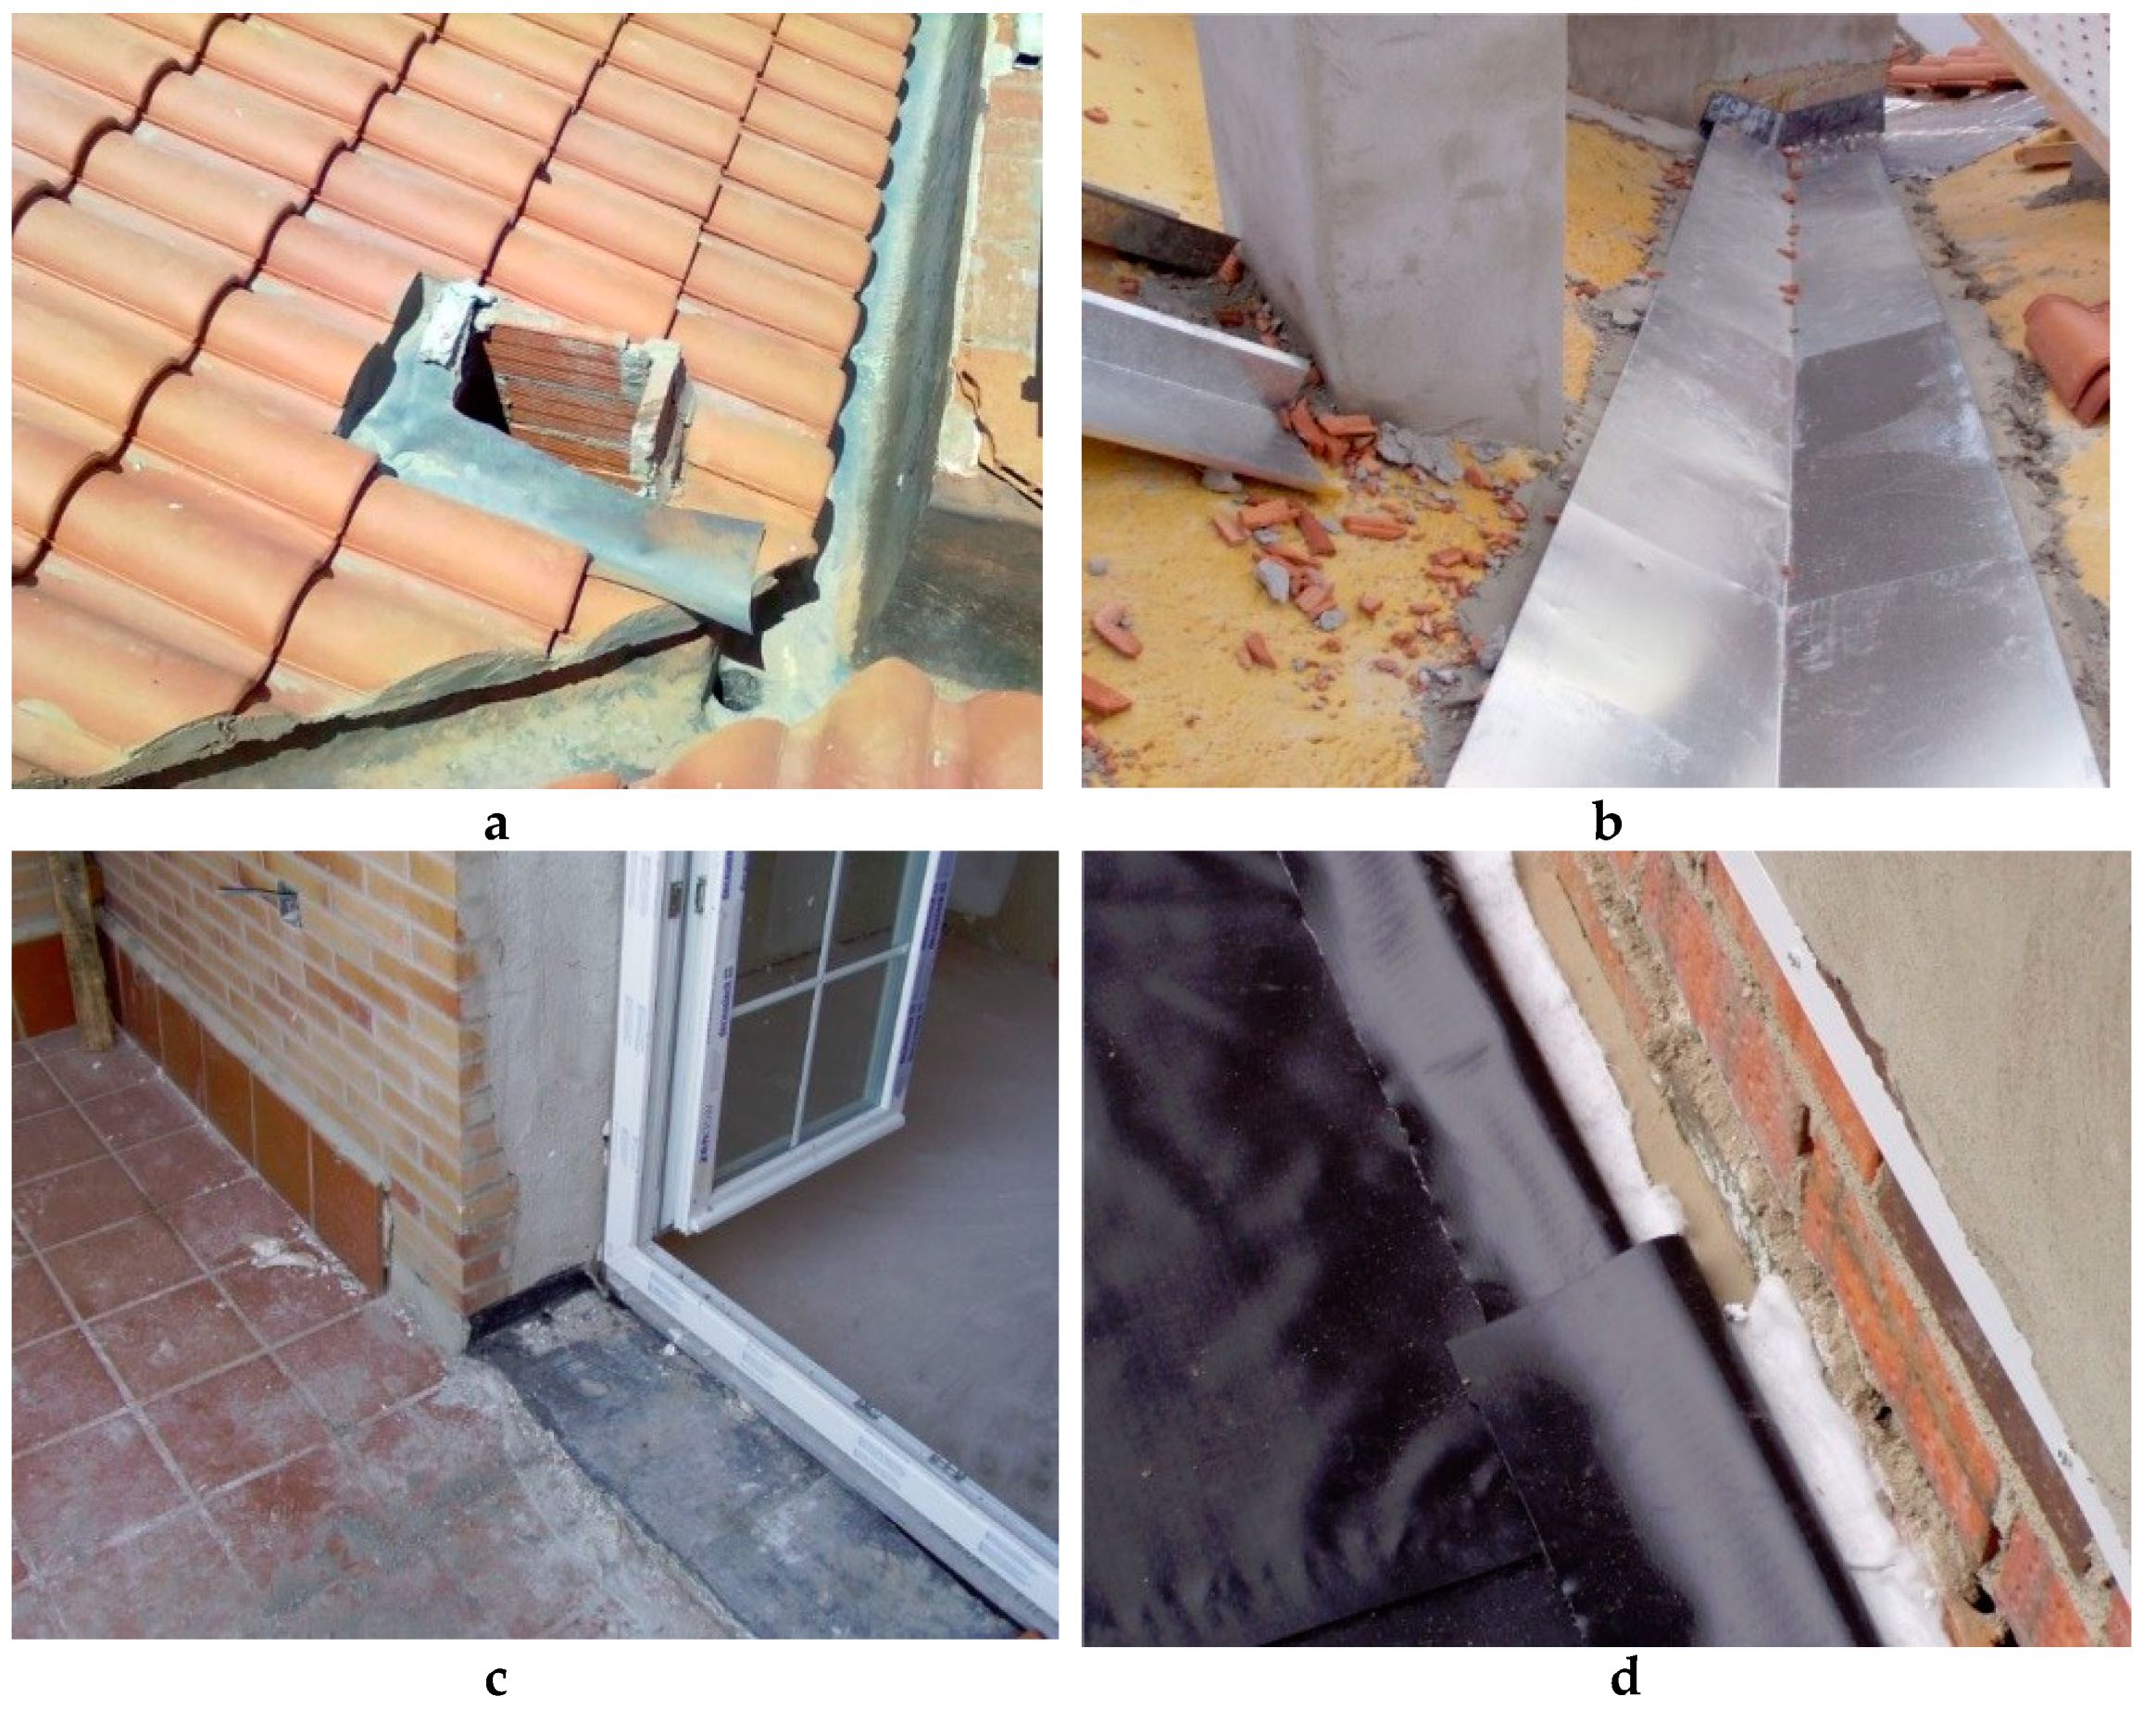
The above is not incompatible with the responsibility that designers have (e.g., by their lack of skill or knowledge) or with the poor quality conditions in the construction as factors that may intervene in the presence of deficiencies (
Figure 9 shows a number of examples). In fact, there is research evaluating the quality of designs [
13], though this is an unpredictable factor, specific to a given particular climate area and, as such, it cannot be ascribed to a rank of concentration of anomalies in the face of another rank.
On the other hand, there is not a significant difference in the construction of flat roofs [
33] and of pitched roofs [
34] between the different regions of Spain, given that the technical regulations are the same for the entire country [
27] and they are similarly constructed.
This paper contributes new knowledge to science through its identification and quantification of deficiencies related to climate conditions in a locality. This knowledge can be used as a tool to reduce the occurrence of these deficiencies in future buildings. With these results, technicians will be able to know the most significant types of deficiencies, as well as their recurrence, allowing them to improve the quality of the construction and maintenance of buildings.
Future work should focus on analyzing the influence of climate conditions in the maintainability of roofs, on ascertaining the results of the maintenance strategies proposed above, and on analyzing several of the causes that may predictably have an impact: deficient overlaps in the waterproofing membrane, design of very small slopes, incorrect resolution of the union with drains and outlets, inadequate tail-end with perimeter parapets, etc.
5. Conclusions
A direct relation was shown to exist between deficiencies in building roofs and their corresponding localization (latitude, situation, type of climate, precipitation, heating degree days, cooling degree days, and average wind speed).
In the general distribution by type of deficiency, there is a high presence of ‘localized infiltrations’ (TCD1 = 47%), followed by ‘moisture by infiltration’ (TCD2 = 34%). The results by building typology show that, most of the time, problems occurred in ‘apartment blocks’ (BT1 = 56.23%), with this typology being predominant in all types of deficiencies studied, except for ‘fissures in gable-walls and slab faces’ (TCD5), which are far more common in ‘detached houses’ (BT2): TCD5BT2 = 53.33%.
Four areas of concentration of anomalies were defined, according to the ranks by normalized frequencies (1.00; 0.59; 0.35 and 0.29). This allows us to evaluate the different combinations possible (sorted from higher to lower), for the climate-geographic conditions; based on this, different climate-geographical areas were created and named R, O, Y and W. In this manner, it was found that buildings localized in the ‘Coastal-Mediterranean’ and ‘Coastal-North’ climate segments accumulate over 40% of the percentage of presence of the construction deficiencies.
It was found that the deficiency most likely to occur in a building roof is TCD1 (localized infiltration), having the greatest importance if localized in a city close to the edge of the Cantabrian sea (Coastal-North-Oceanic: %RD >15), being more likely to result in a complaint by the users or owners. On the other hand, a building roof located inland, close to the southern Mediterranean area, has low chances of experiencing fissures in TCD5 (gable-walls and slab faces).
It was found, through techniques based on inferential statistics, that an average annual wind speed greater than 3 m/s increases the likelihood of deficiency in roofs. It was also found that there is a higher presence of deficiencies in those geographical zones where there is a thermal demand of between 1800 and 2800 heating degree days or between 450 and 700 cooling degree days.
Finally, significant differences were observed between the variable ‘deficiencies per 1000 inhabitants’ and the number of degree days and the wind speed of the building location, which confirms what was found in the trend analysis.
