SDD-CNN: Small Data-Driven Convolution Neural Networks for Subtle Roller Defect Inspection


Abstract
:
1. Introduction
2. Related Works
3. Materials and Methods
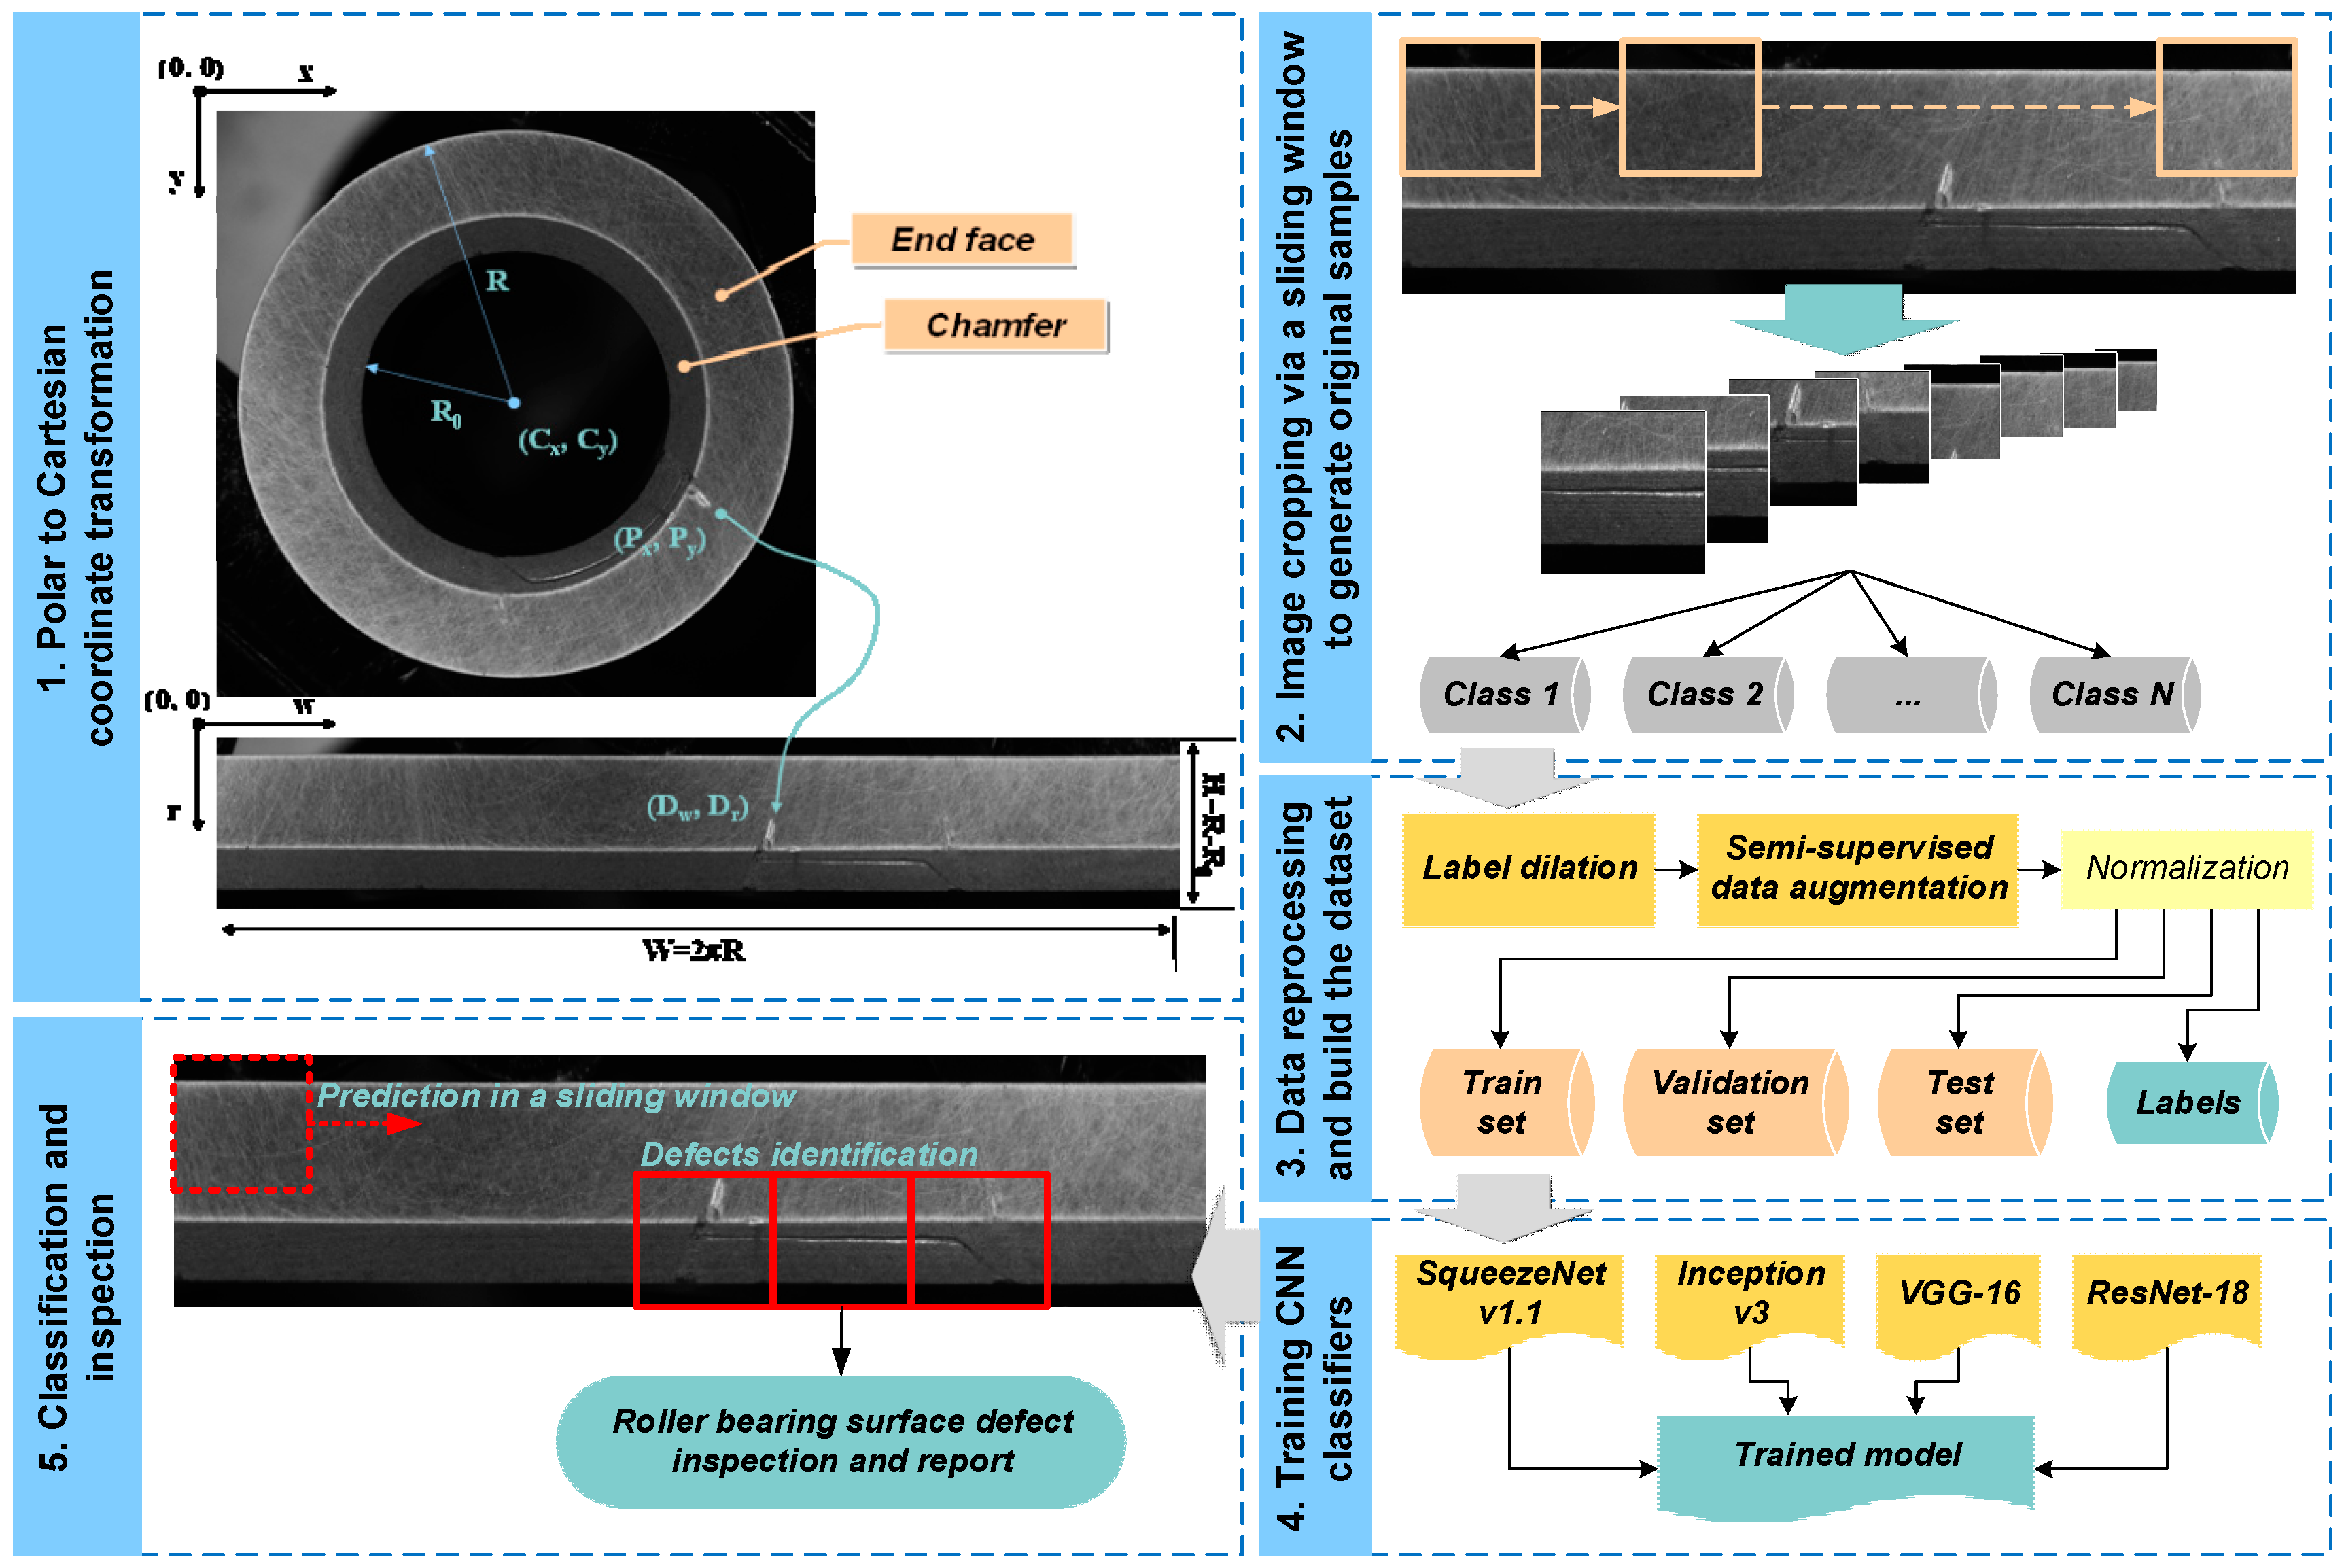
3.1. Overview of Proposed Method
3.2. Small Data Preprocessing
3.2.1. Label Dilation
3.2.2. Semi-Supervised Data Augmentation
3.3. CNN Architectures
3.3.1. SqueezeNet v1.1
3.3.2. Inception v3
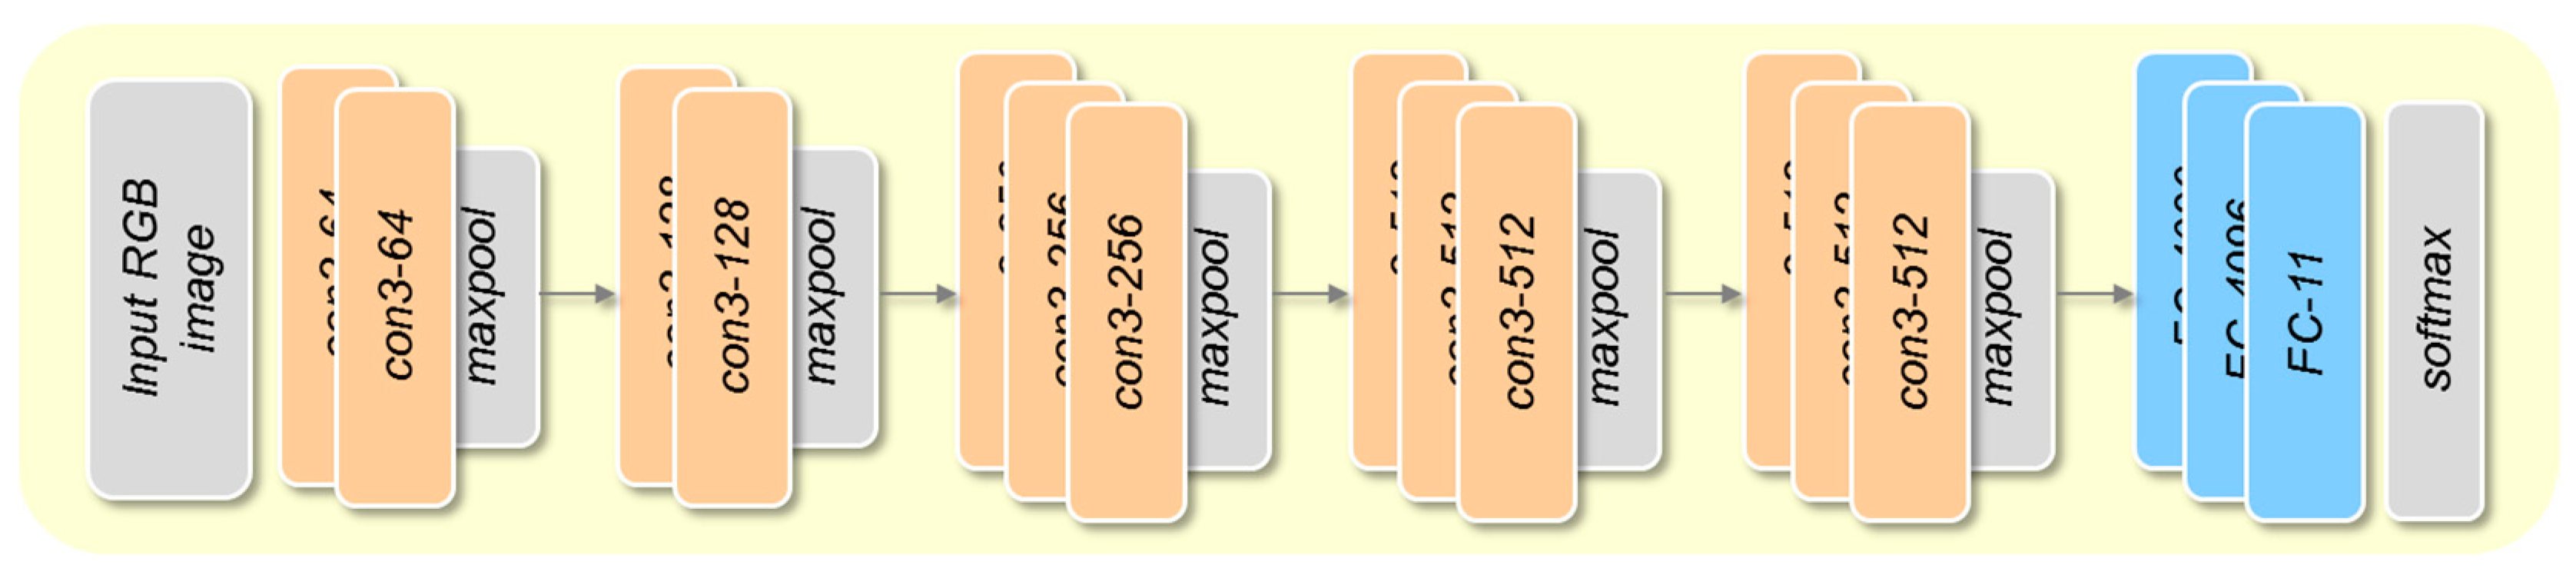
3.3.3. VGG-16
3.3.4. ResNet-18
4. Experiments and Results
4.1. Experimental Setup
- CPU: Intel E3-1230 V2*2 (3.30 GHz);
- Memory: 16 GB DDR3;
- GPU: NVIDIA GTX-1080Ti.
- The software platform used is the following:
- Ubuntu 16.04 LTS;
- Visual Studio Code with Python 2.7.
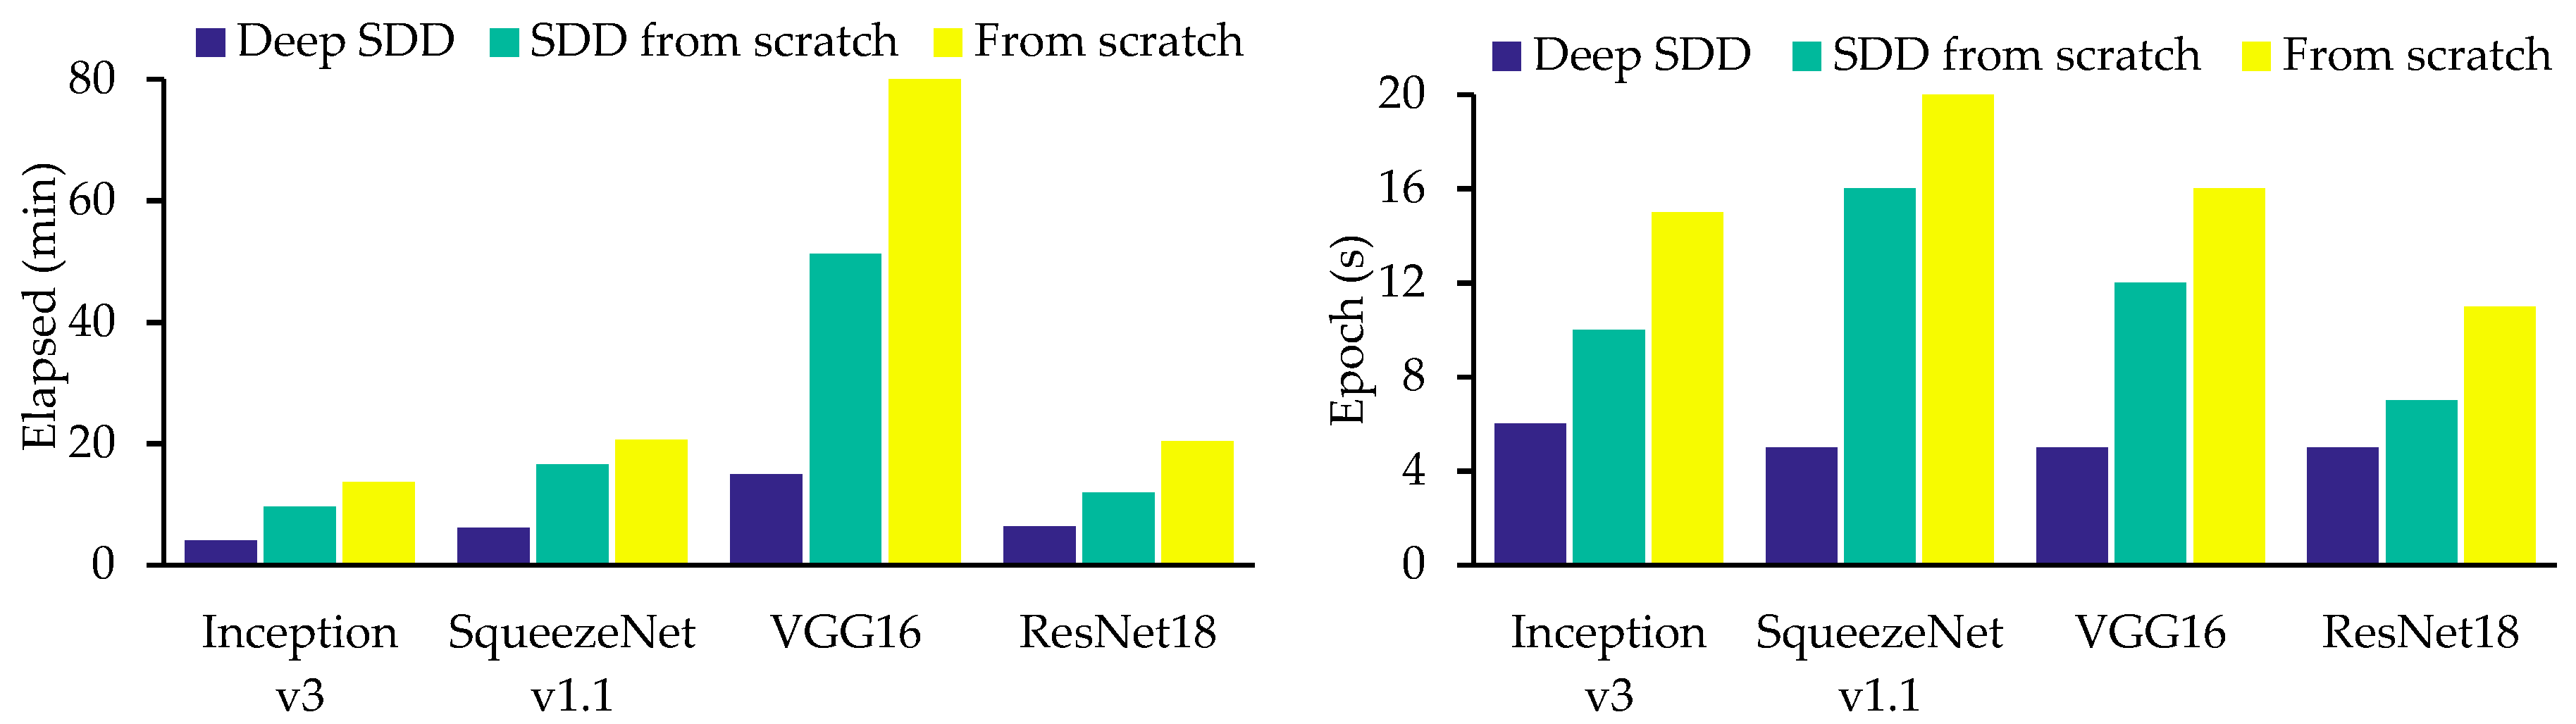
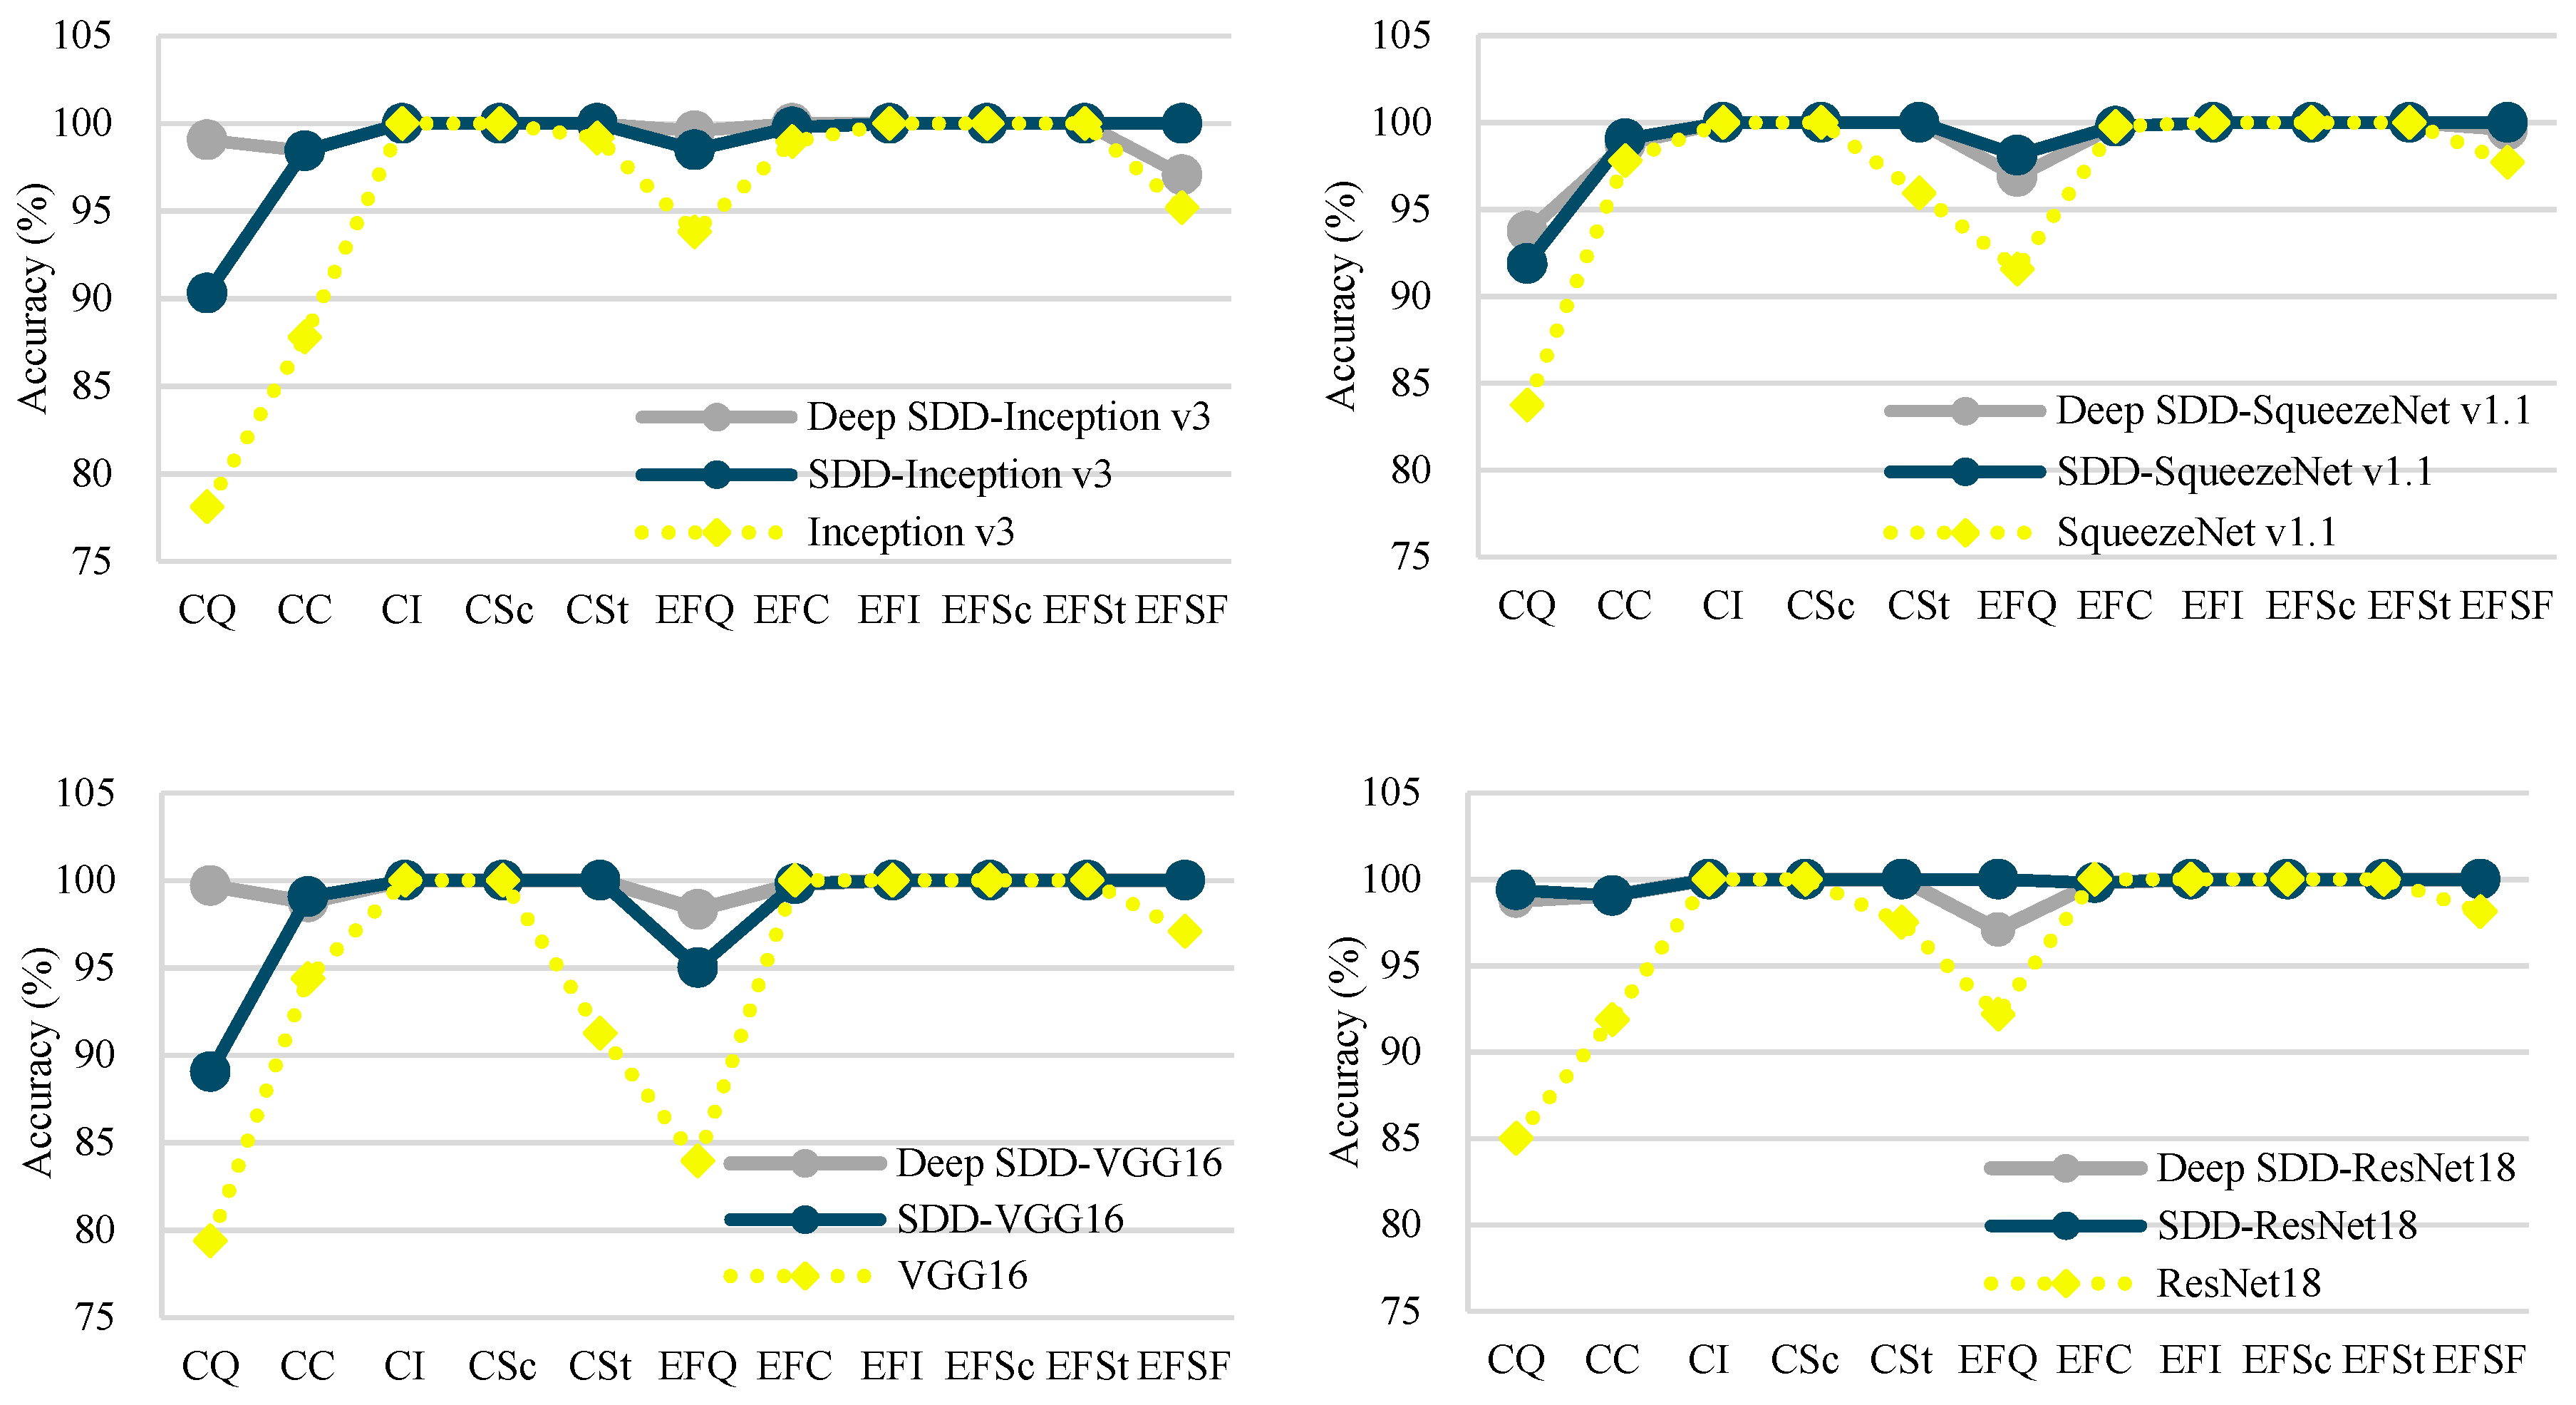
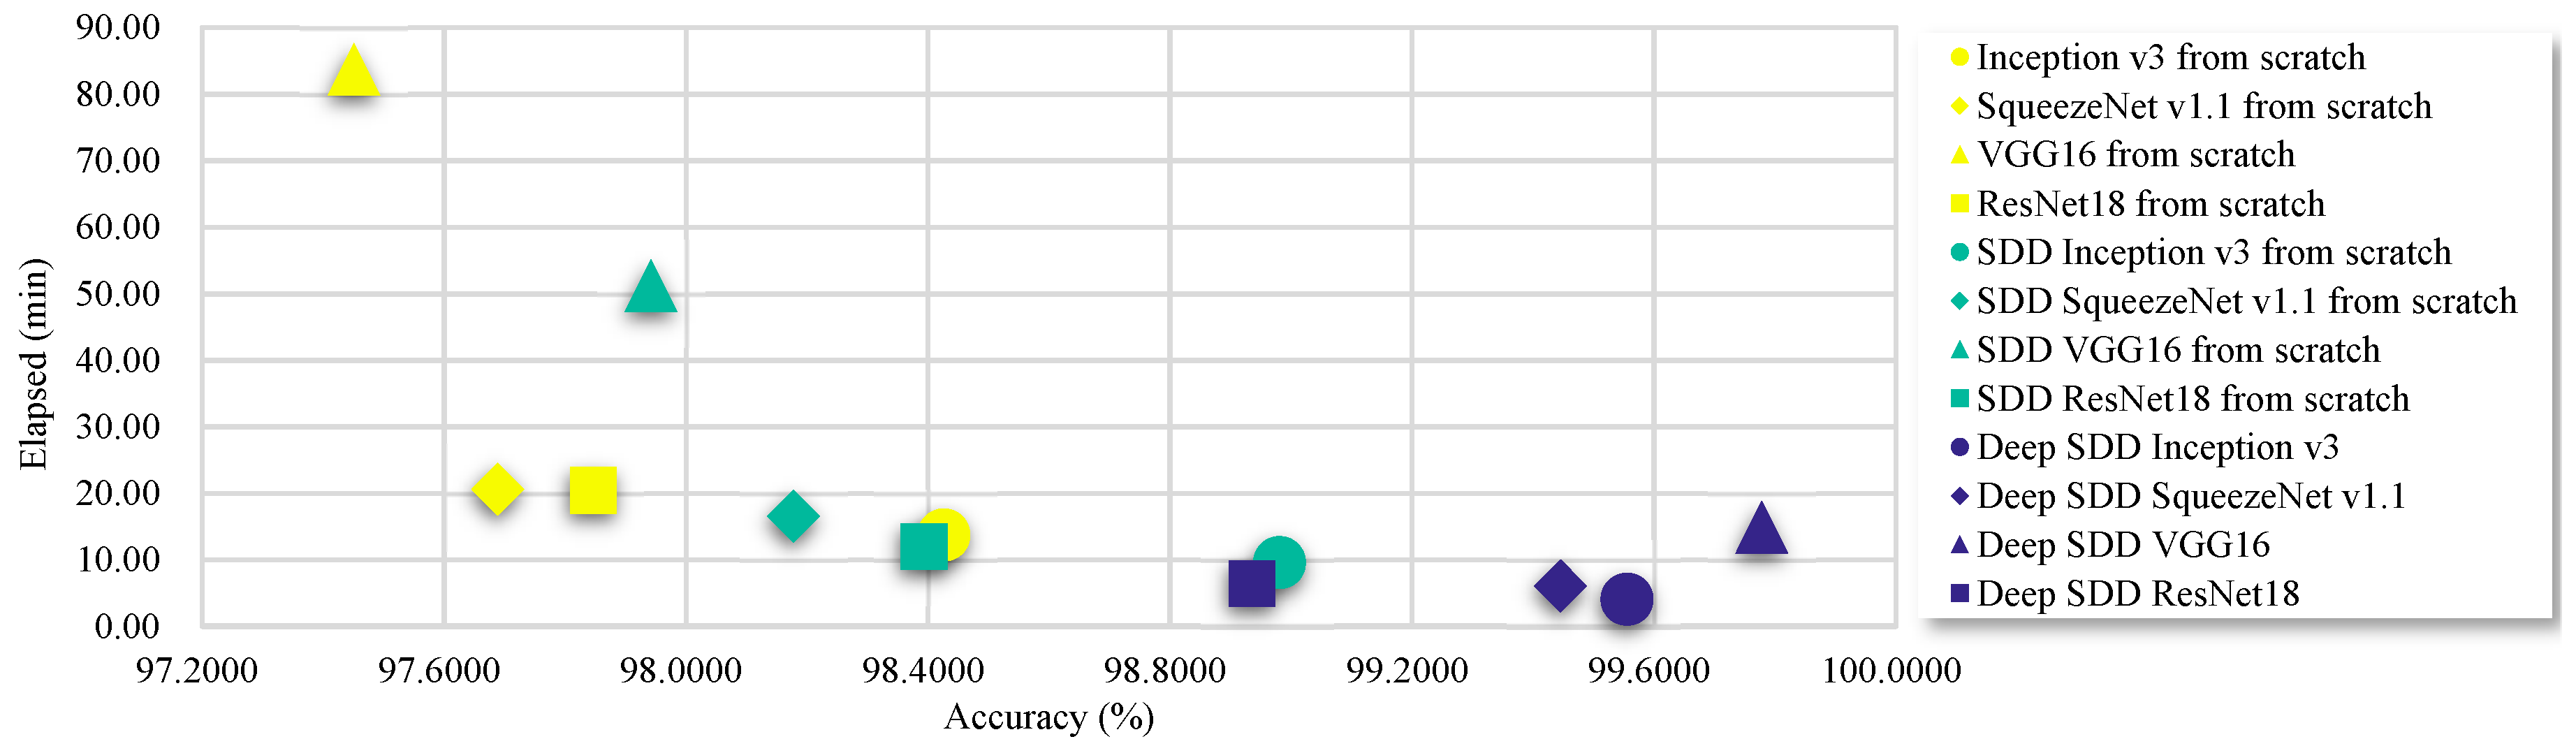
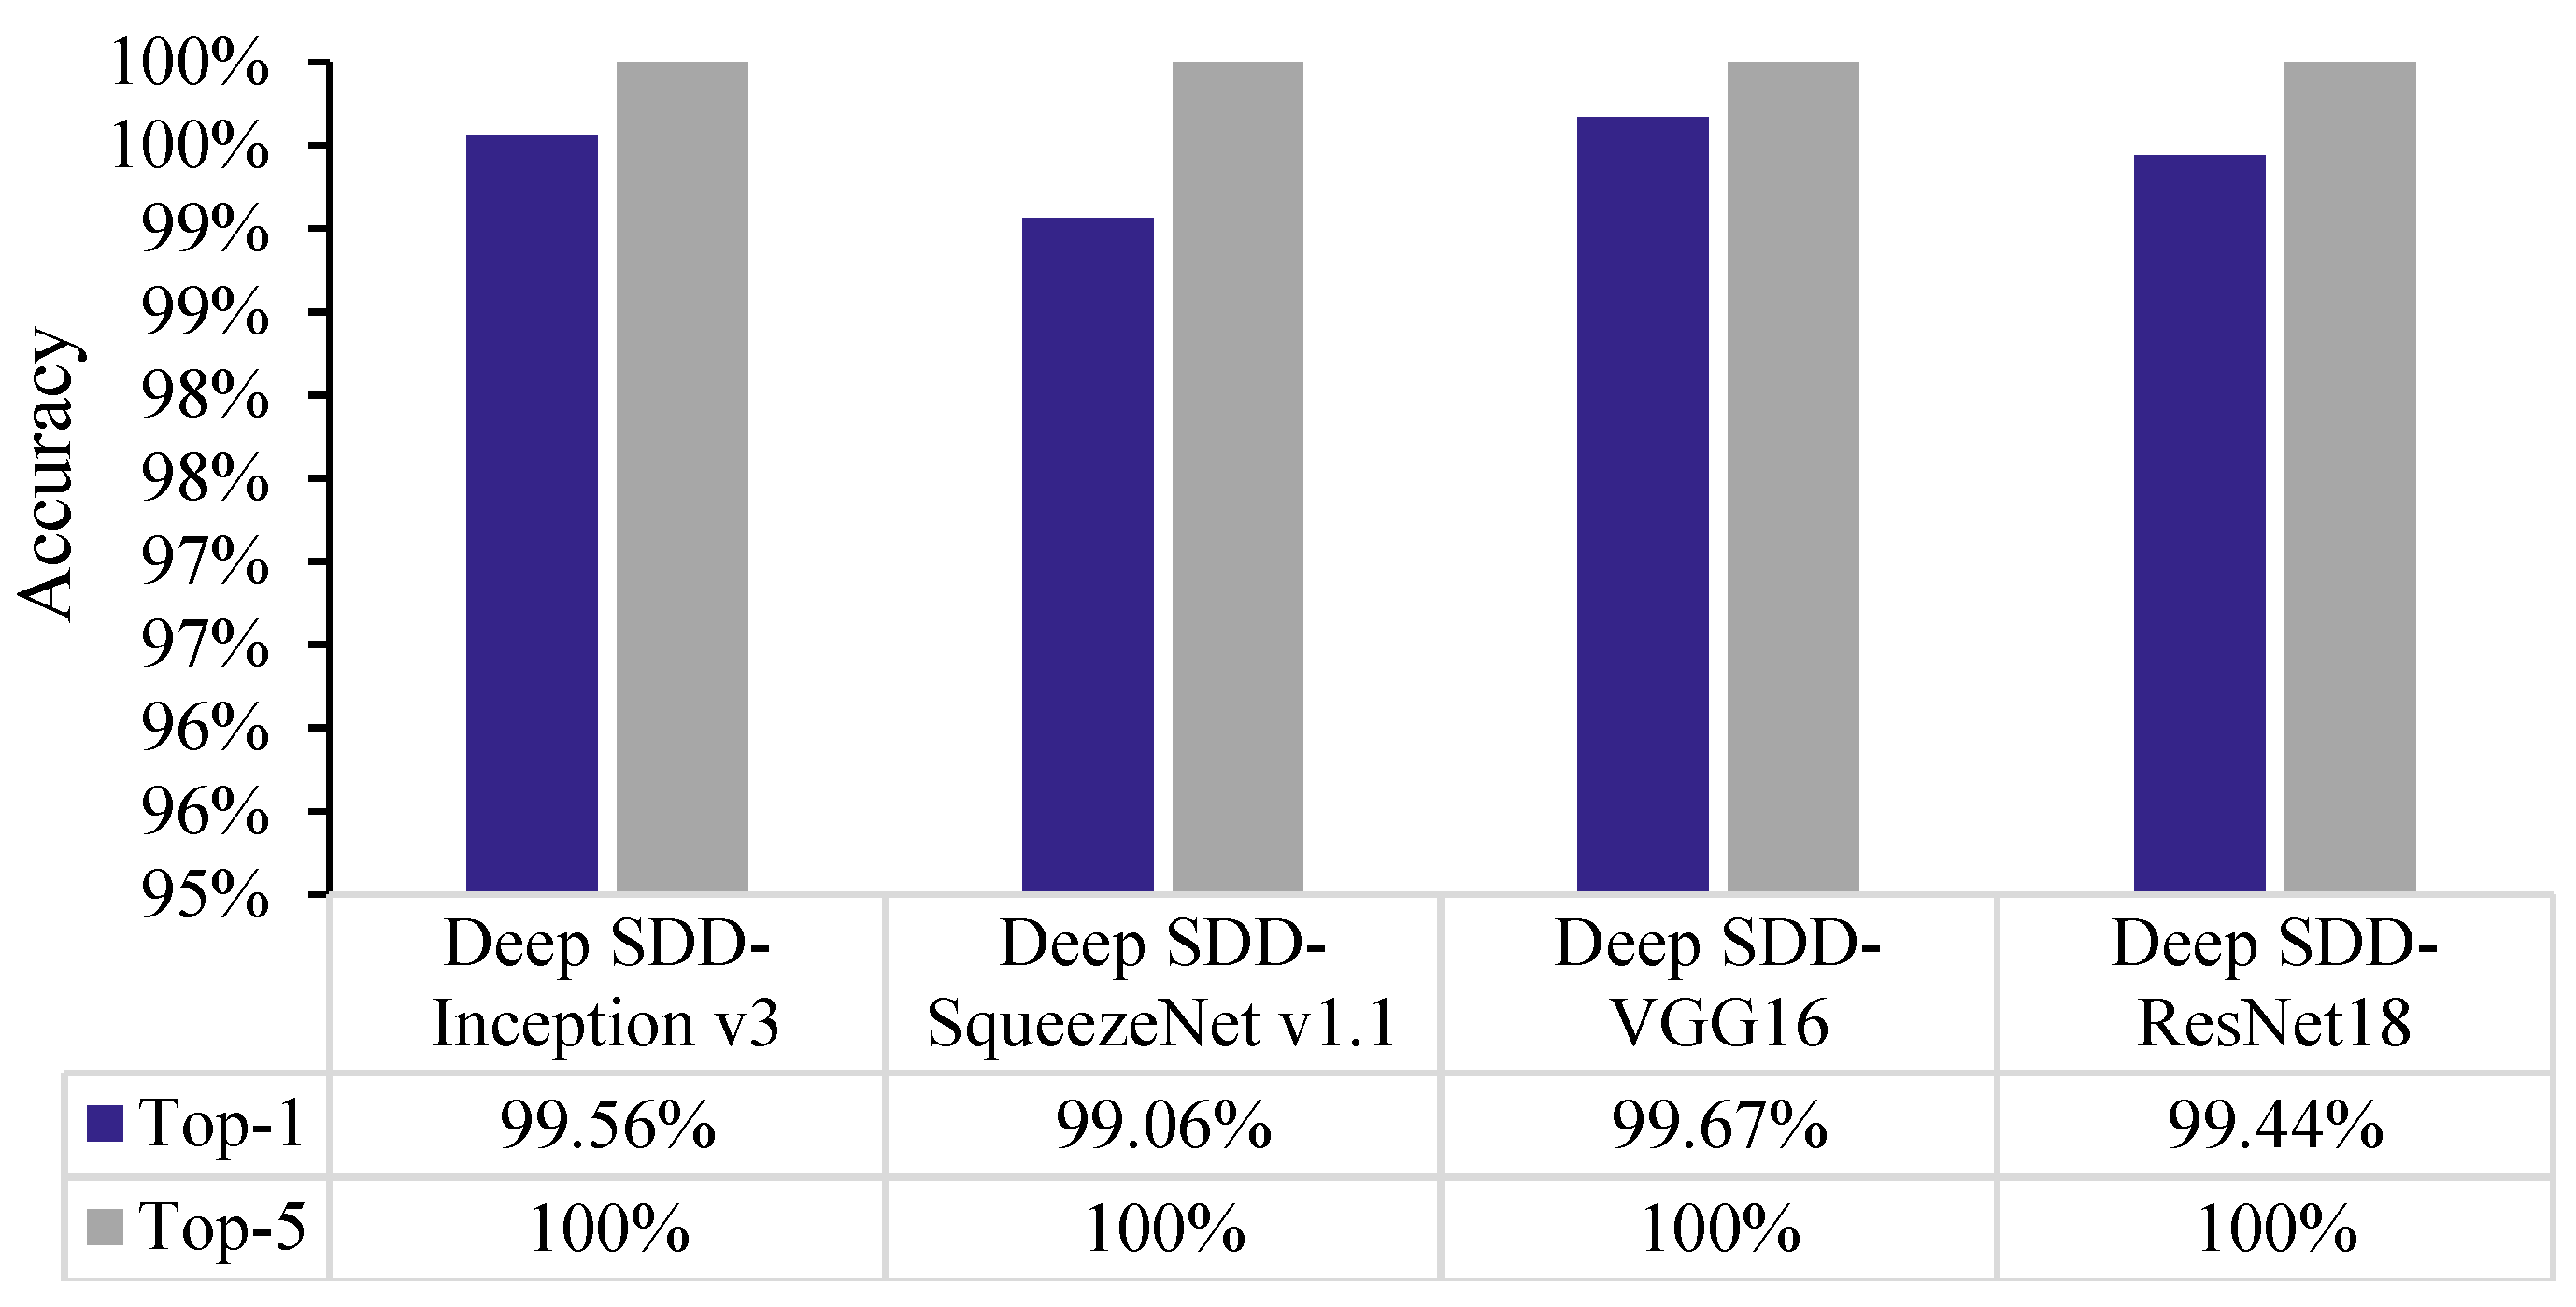
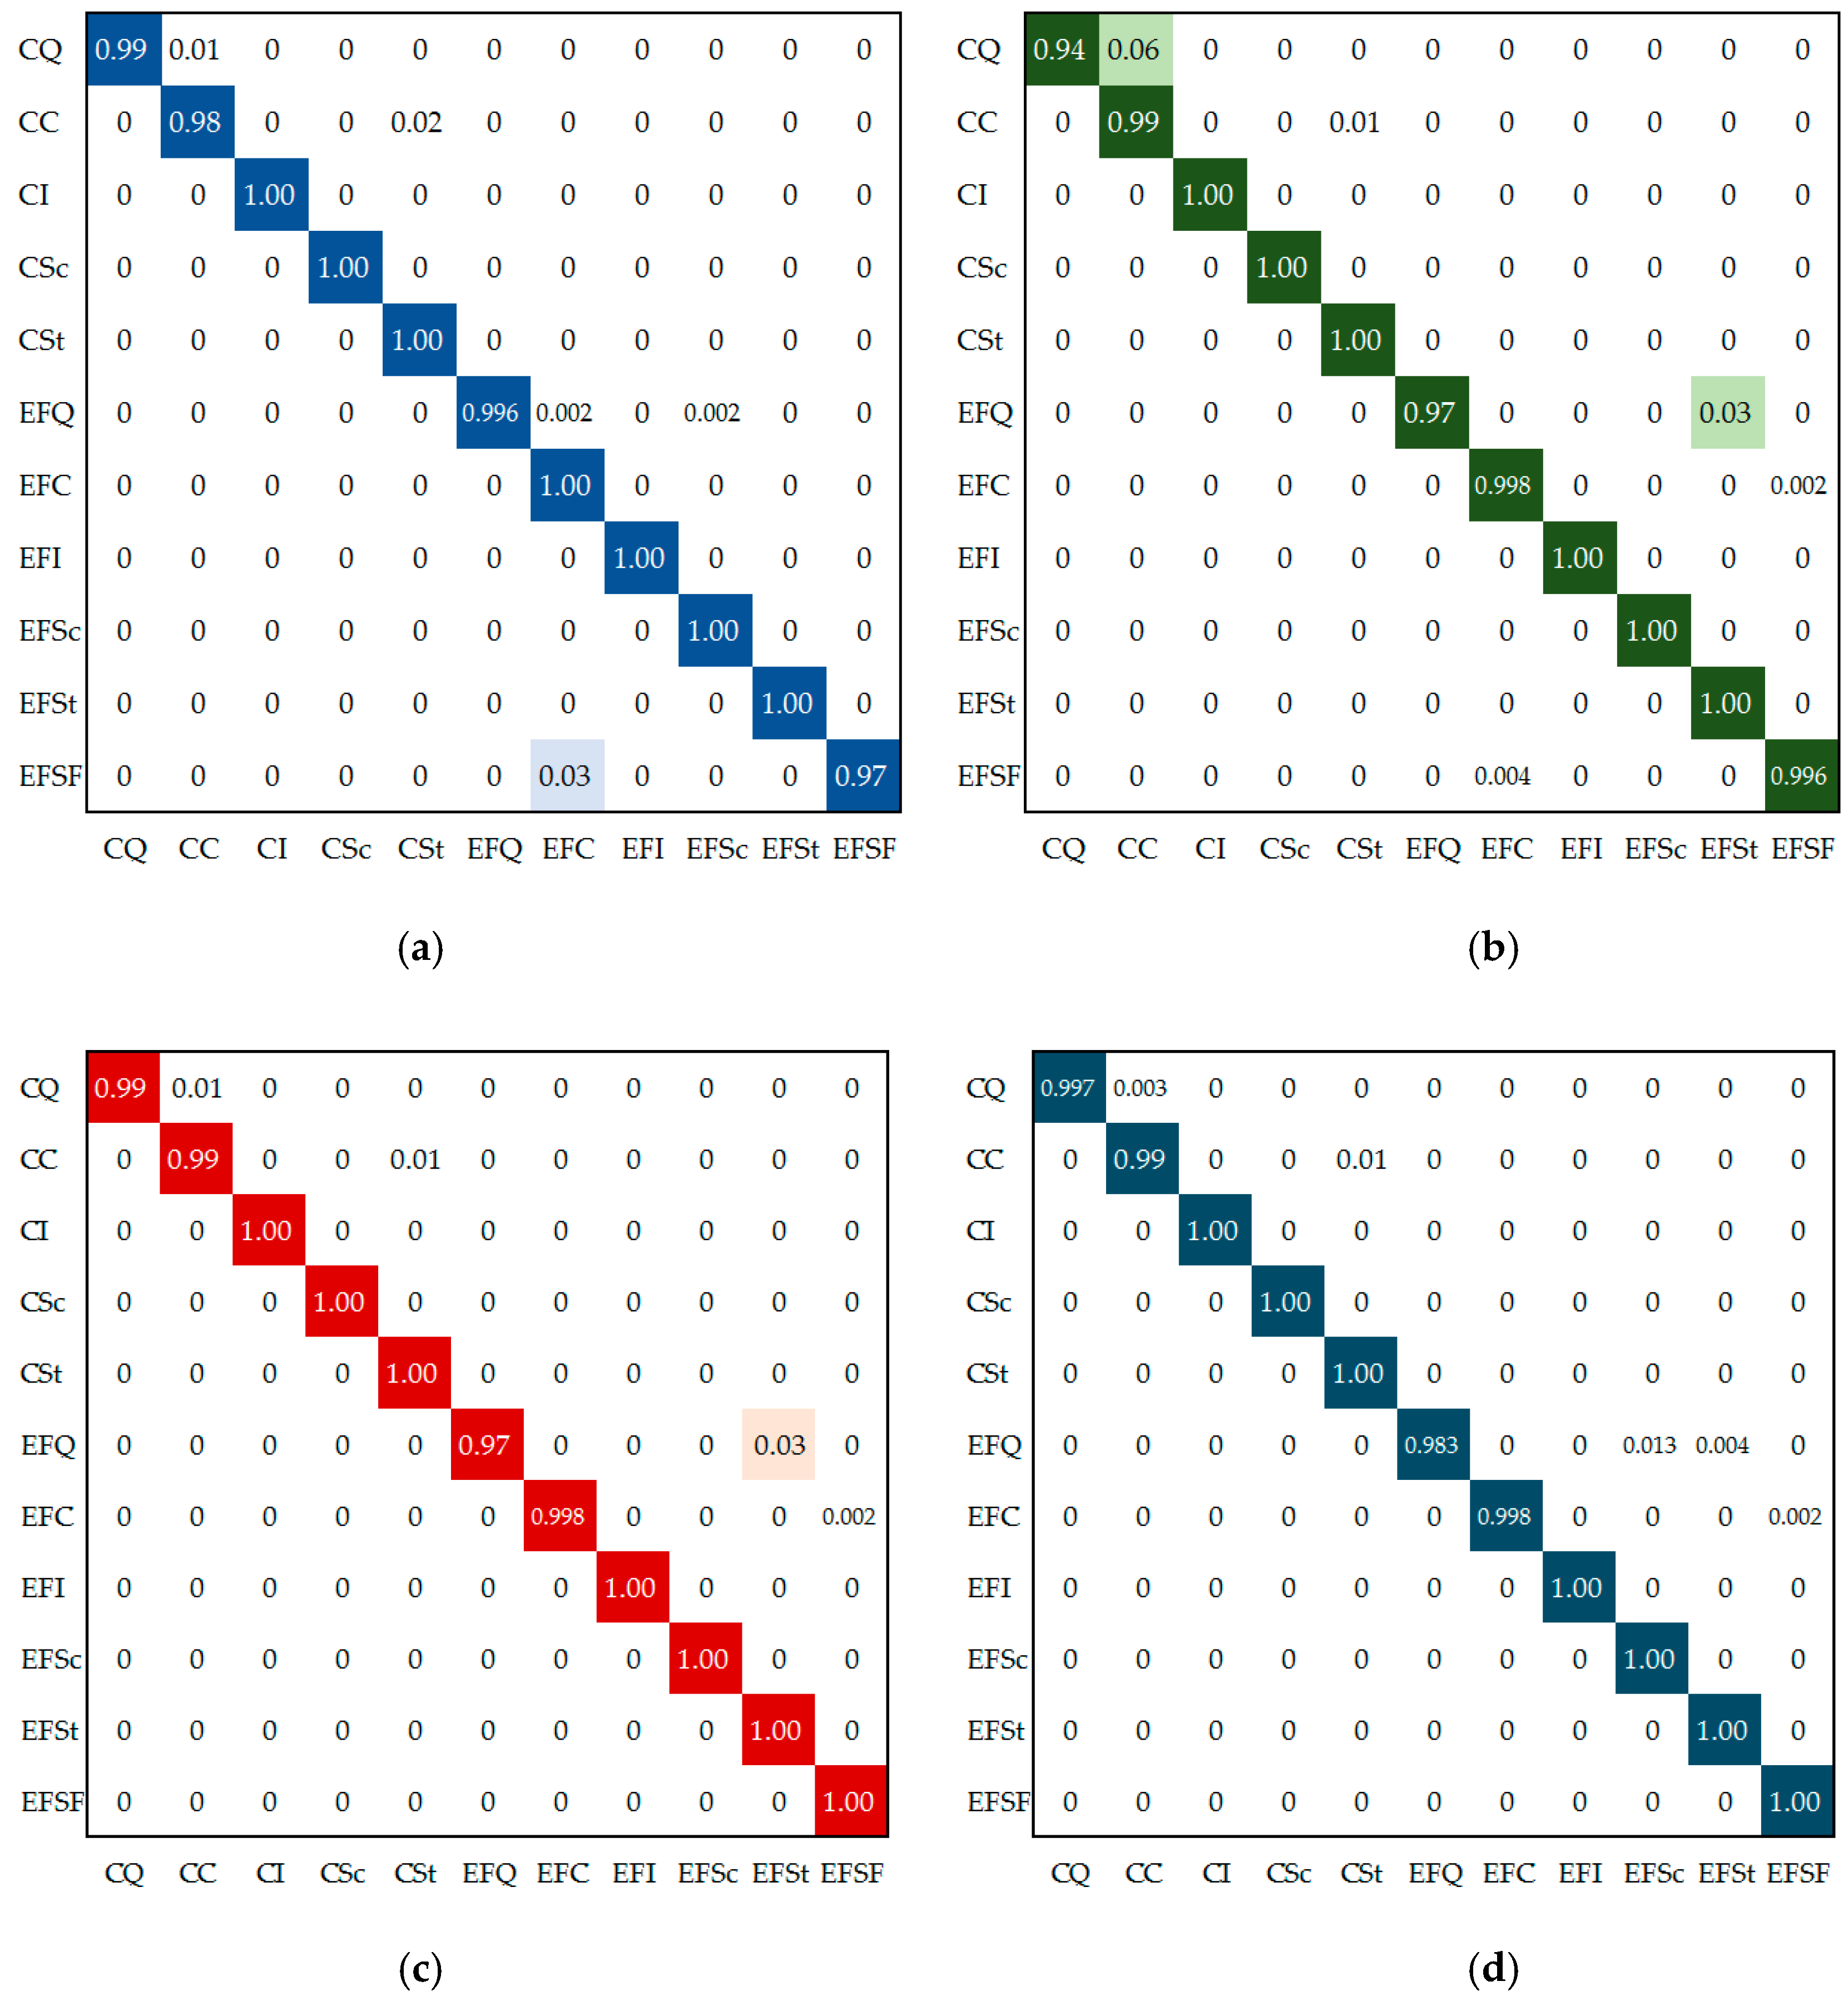
4.2. Network Training and Performance Metrics
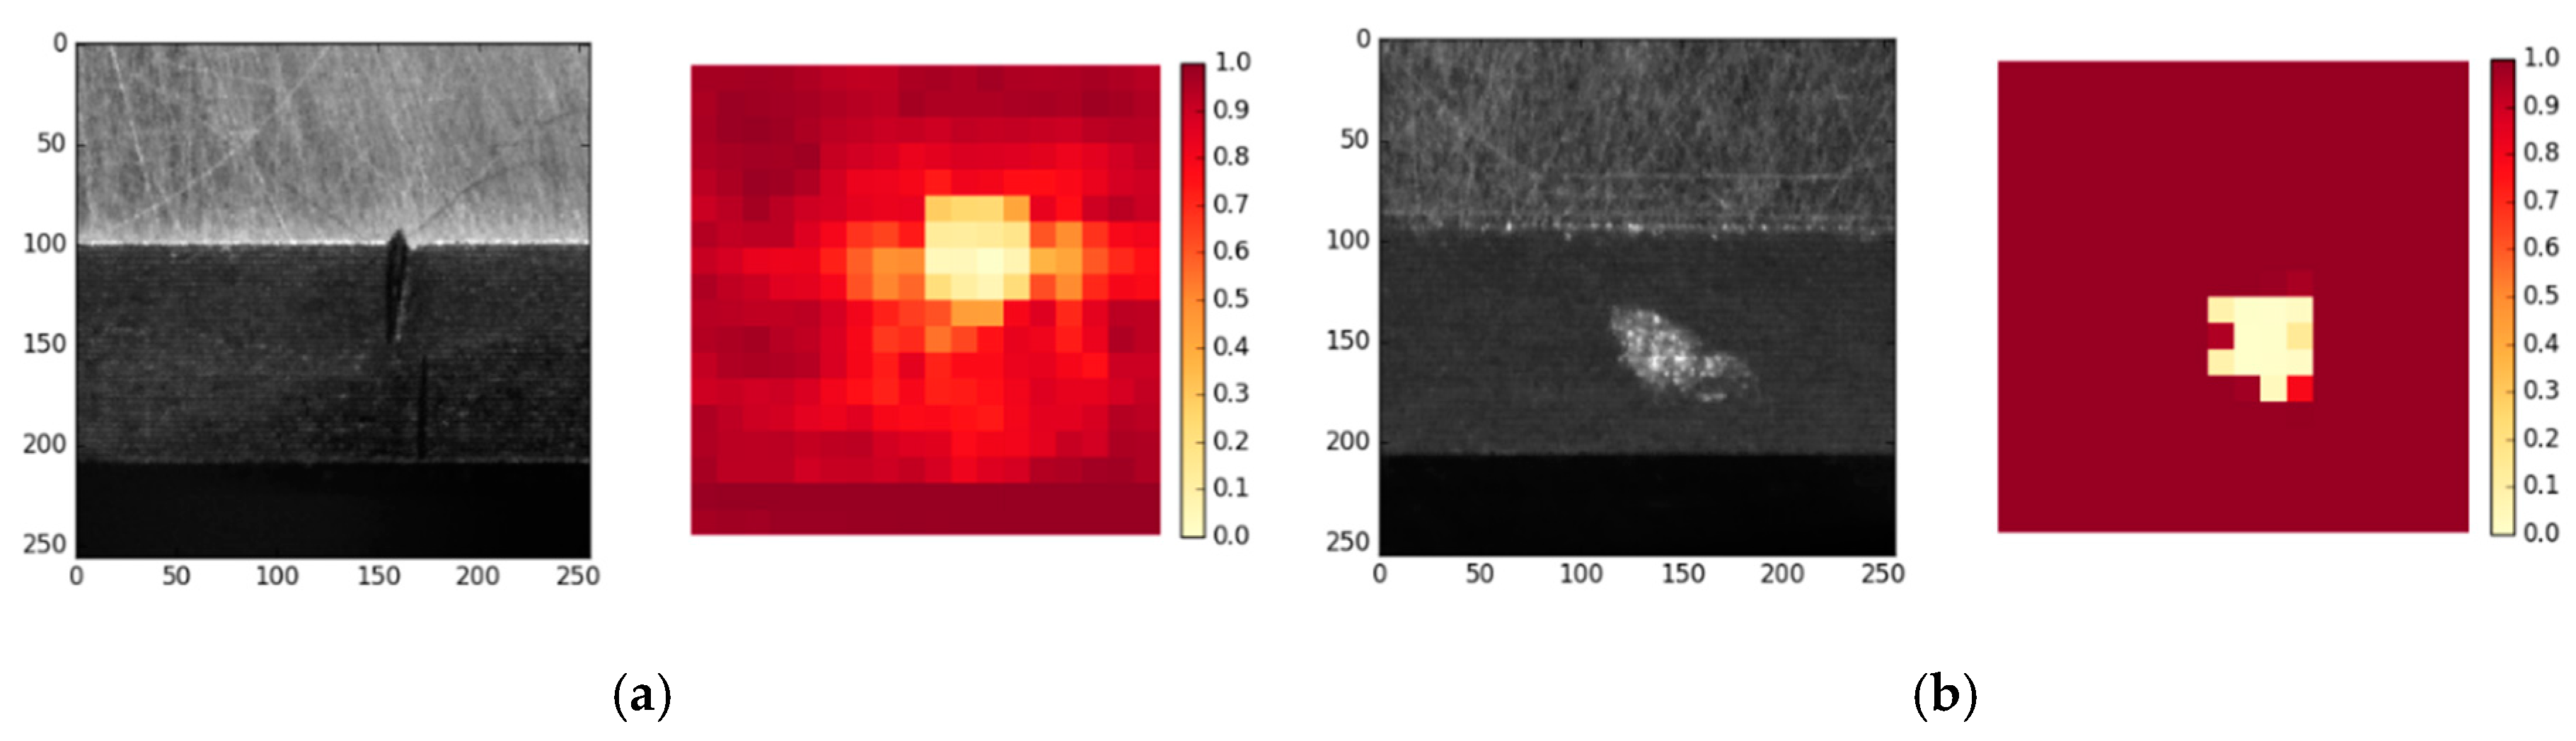
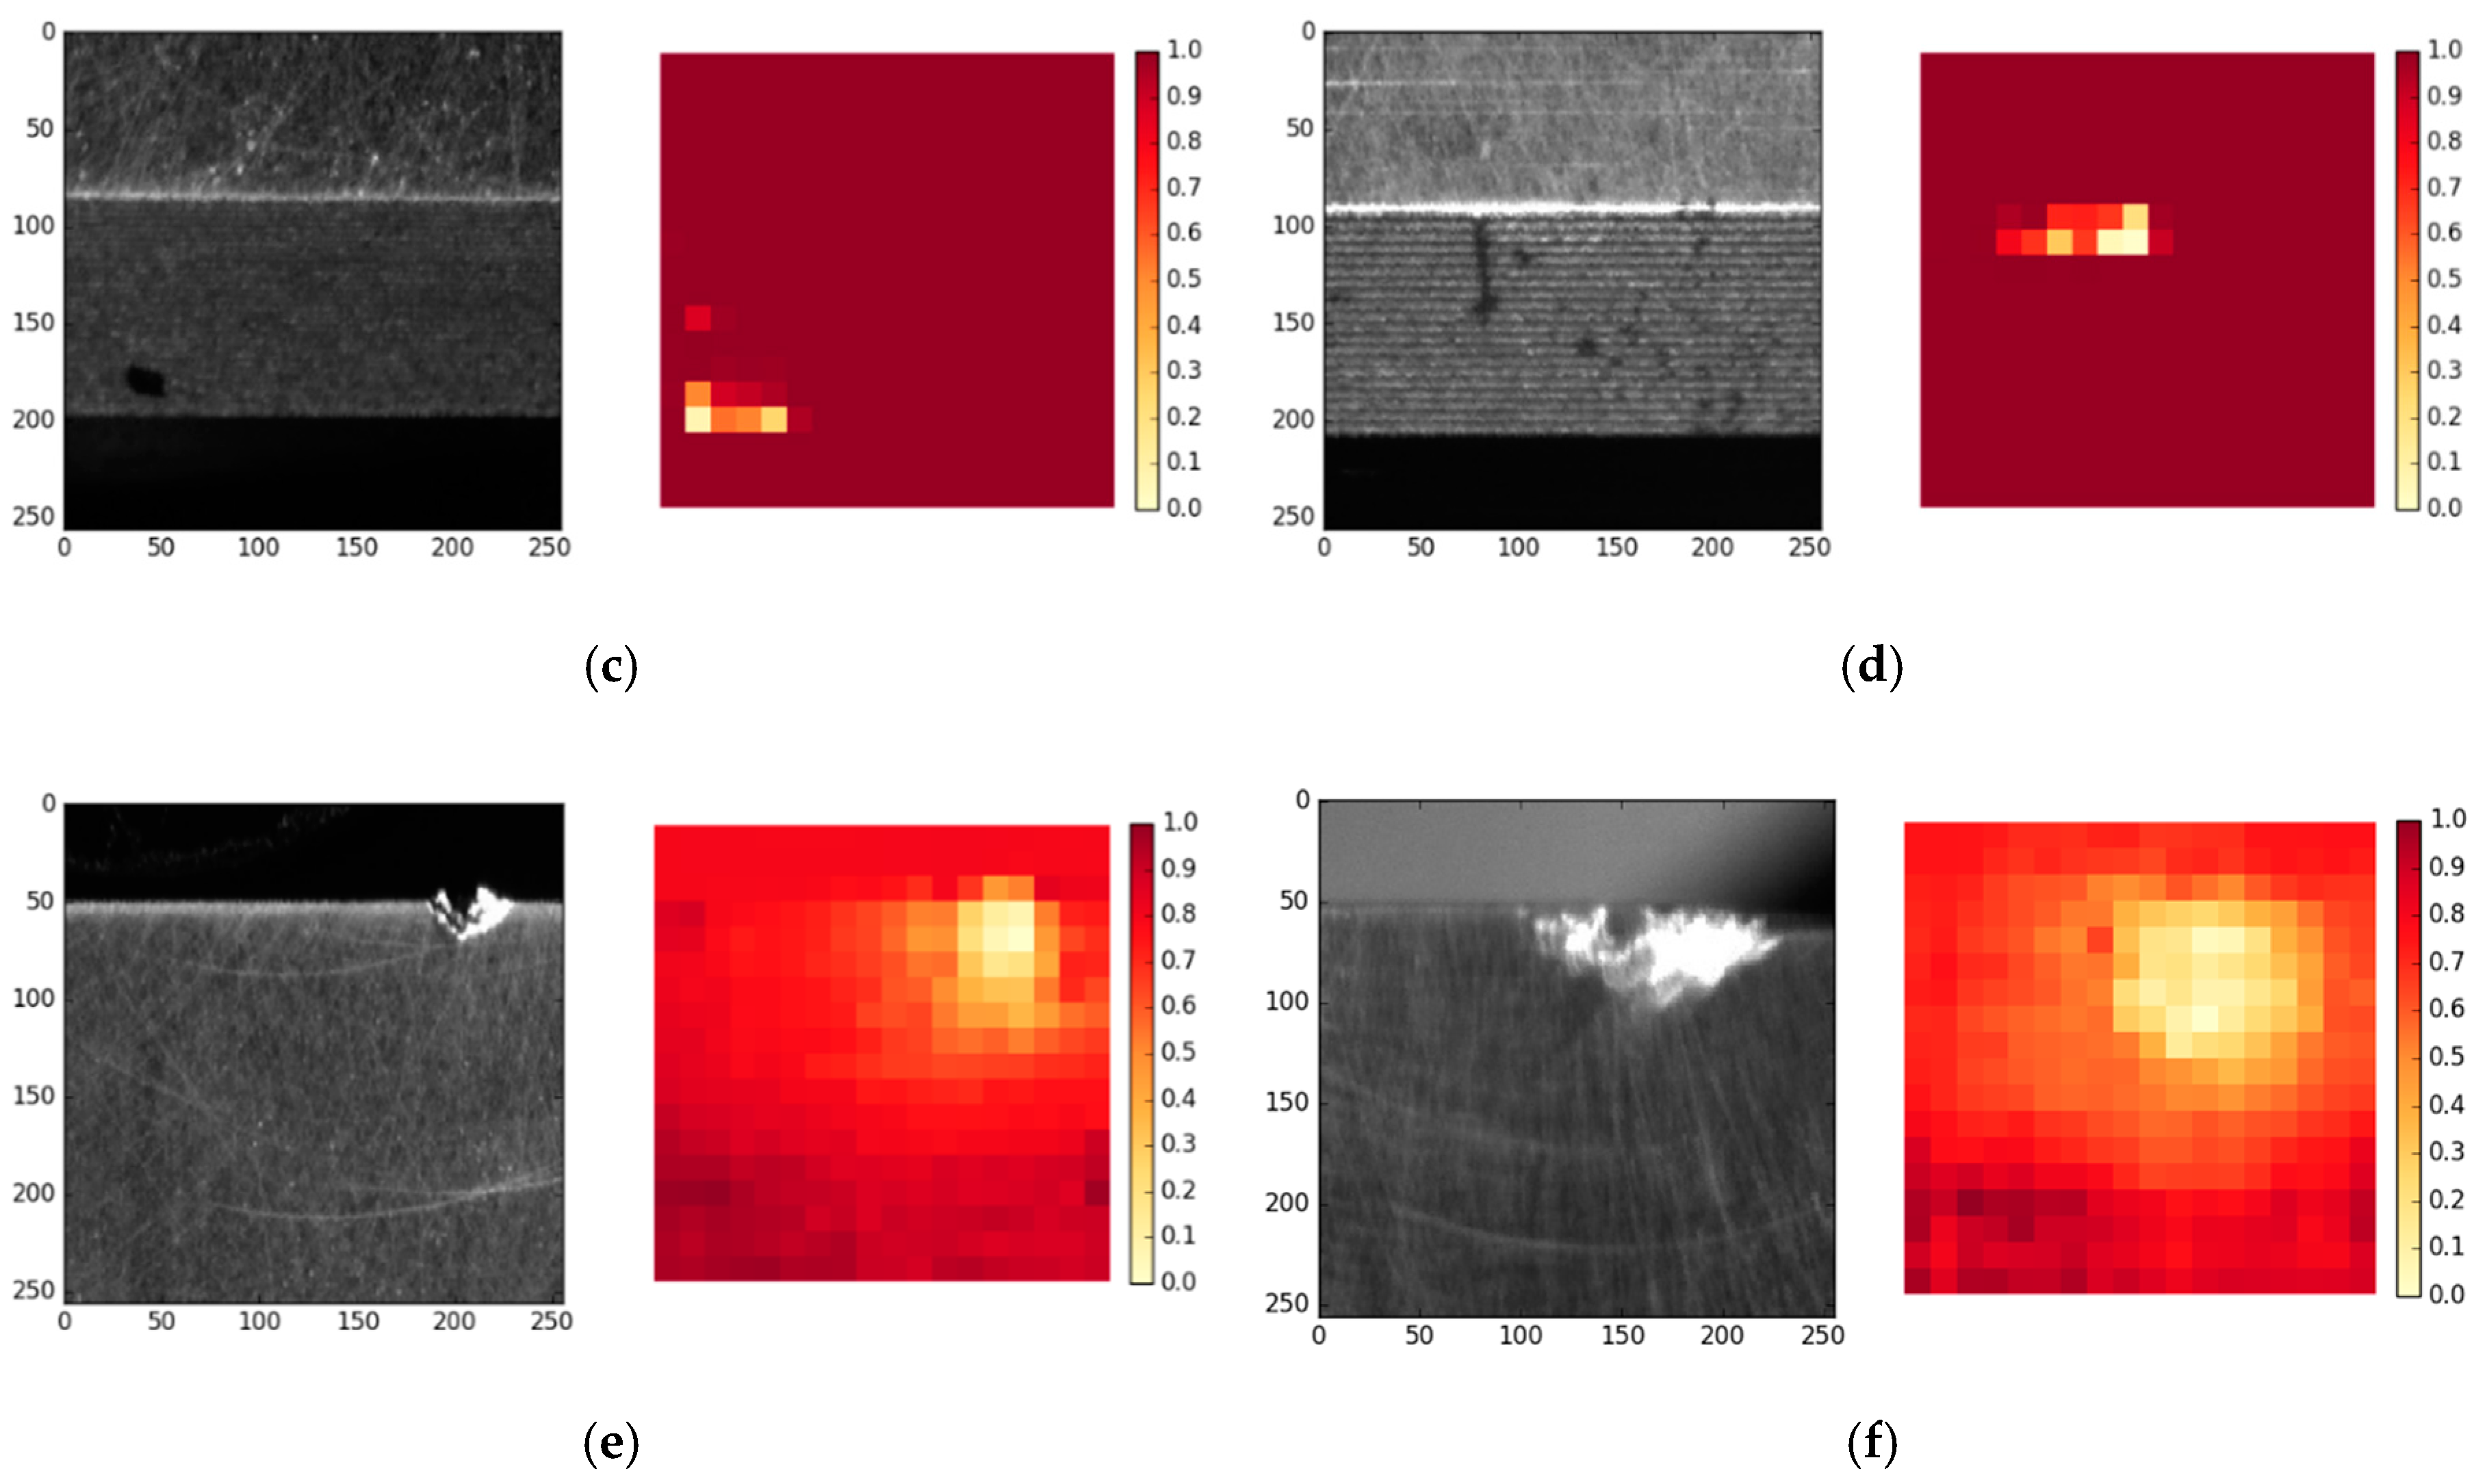
4.3. Model Visualizations
5. Conclusions
Author Contributions
Funding
Conflicts of Interest
References
- Zhang, B. Research on Surface Defect Detection of Bearing Roller Based on Machine Vision. Master’s Thesis, Nanchang Hangkong University, Nanchang, China, June 2018. [Google Scholar]
- Shen, H.; Li, S.; Gu, D.; Chang, H. Bearing defect inspection based on machine vision. Measurement 2012, 45, 719–733. [Google Scholar] [CrossRef]
- Zheng, Z.; Ma, Y.; Zheng, H.; Ju, J.; Lin, M. UGC: Real-time, ultra-robust feature correspondence via unilateral grid-based clustering. IEEE Access 2018, 6, 55501–55508. [Google Scholar] [CrossRef]
- Krizhevsky, A.; Sutskever, I.; Hinton, G.E. ImageNet classification with deep convolutional neural networks. In Proceedings of the 2012 International Conference on Neural Information Processing Systems, Lake Tahoe, ND, USA, 3–6 December 2012; pp. 1097–1105. [Google Scholar]
- Chen, Z.; Deng, S.; Chen, X.; Li, C.; Sanchez, R.; Qin, H. Deep neural networks-based rolling bearing fault diagnosis. Microelectron. Reliab. 2017, 75, 327–333. [Google Scholar] [CrossRef]
- Zhang, W.; Li, C.; Peng, G.; Chen, Y.; Zhang, Z. A deep convolutional neural network with new training methods for bearing fault diagnosis under noisy environment and different working load. Mech. Syst. Signal Process. 2018, 100, 439–453. [Google Scholar] [CrossRef]
- Shao, H.; Jiang, H.; Lin, Y.; Li, X. A novel method for intelligent fault diagnosis of rolling bearings using ensemble deep auto-encoders. Mech. Syst. Signal Process. 2018, 102, 278–297. [Google Scholar] [CrossRef]
- Li, X.; Zhang, W.; Ding, Q. A robust intelligent fault diagnosis method for rolling element bearings based on deep distance metric learning. Neurocomputing 2018, 310, 77–95. [Google Scholar] [CrossRef]
- Gan, M.; Wang, C.; Zhu, C. Construction of hierarchical diagnosis network based on deep learning and its application in the fault pattern recognition of rolling element bearings. Mech. Syst. Signal Process. 2016, 72–73, 92–104. [Google Scholar] [CrossRef]
- Zhong, R.Y.; Xu, X.; Klotz, E.; Newman, S.T. Intelligent manufacturing in the context of industry 4.0: A review. Engineering 2017, 3, 616–630. [Google Scholar] [CrossRef]
- Wang, J.; Ma, Y.; Zhang, L.; Gao, R.X.; Wu, D. Deep learning for smart manufacturing: Methods and applications. J. Manuf. Syst. 2018, 48, 144–156. [Google Scholar] [CrossRef]
- Weimer, D.; Scholz-Reiter, B.; Shpitalni, M. Design of deep convolution neural network architectures for automated feature extraction in industrial inspection. CIRP Ann. Manuf. Technol. 2016, 65, 417–420. [Google Scholar] [CrossRef]
- Ren, R.; Hung, T.; Tan, K.C. A generic deep-learning-based approach for automated surface inspection. IEEE Trans. Cybern. 2017, 99, 929–940. [Google Scholar] [CrossRef]
- Cha, Y.J.; Choi, W.; Suh, G.; Mahmoudkhani, S.; Büyüköztürk, O. Autonomous structural visual inspection using region-based deep learning for detecting multiple damage types. Comput. Aided Civ. Infrastruct. Eng. 2017, 33, 731–747. [Google Scholar] [CrossRef]
- Park, J.K.; Kwon, B.K.; Park, J.H.; Kang, D.J. Machine learning-based imaging system for surface defect inspection. Int. J. Precis. Eng. Manuf. Green Technol. 2016, 3, 303–310. [Google Scholar] [CrossRef]
- Chen, Z.Q.; Li, C.; Sanchez, R.V. Gearbox fault identification and classification with convolution neural networks. Shock Vib. 2015, 2015, 390134. [Google Scholar]
- Wang, P.; Ananya, Y.R.; Gao, R.X. Virtualization and deep recognition for system fault classification. J. Manuf. Syst. 2017, 44, 310–316. [Google Scholar] [CrossRef]
- Dong, H.; Yang, L.; Li, H. Small fault diagnosis of front-end speed controlled wind generator based on deep learning. WSEAS Trans. Circuits Syst. 2016, 15, 64–72. [Google Scholar]
- Janssens, O.; Slavkovikj, V.; Vervisch, B.; Stockman, K.; Loccufier, M.; Verstockt, S.; Walle, R.V.d.; Hoecke, S.V. Convolutional neural network based fault detection for rotating machinery. J. Sound Vib. 2016, 377, 331–345. [Google Scholar] [CrossRef]
- Zhao, R.; Wang, D.; Yan, R.; Mao, K.; Shen, F.; Wang, J. Machine health monitoring using local feature-based gated recurrent unit network. IEEE Trans. Ind. Electron. 2018, 65, 1539–1548. [Google Scholar] [CrossRef]
- Wu, Y.; Yuan, M.; Dong, S.; Lin, L.; Liu, Y. Remaining useful life estimation of engineered systems using vanilla LSTM neural networks. Neurocomputing 2017, 226, 853–860. [Google Scholar] [CrossRef]
- Zhao, R.; Yan, R.; Wang, J.; Mao, K. Learning to monitor machine health with convolution bi-directional LSTM networks. Sensors 2017, 17, 273. [Google Scholar] [CrossRef]
- Wang, P.; Gao, R.X.; Yan, R. A deep learning-based approach to material removal rate prediction in polishing. CIRP Ann. Manuf. Technol. 2017, 66, 429–432. [Google Scholar] [CrossRef]
- Deutsch, J.; He, M.; He, D. Remaining useful life prediction of hybrid ceramic bearings using an integrated deep learning and particle filter approach. Appl. Sci. 2017, 7, 649. [Google Scholar] [CrossRef]
- Zhang, W.; Duan, P.; Yang, L.T.; Xia, F.; Li, Z.; Lu, Q.; Gong, W.; Yang, S. Resource requests prediction in the cloud computing environment with a deep belief network. Softw. Pract. Exp. 2017, 47, 473–488. [Google Scholar] [CrossRef]
- Sun, W.; Shao, S.; Zhao, R.; Yan, R.; Zhang, X.; Chen, X. A sparse auto-encoder-based deep neural network approach for induction motor faults classification. Measurement 2016, 89, 171–178. [Google Scholar] [CrossRef]
- Yang, Z.; Wang, X.; Zhong, J. Representational learning for fault diagnosis of wind turbine equipment: A multi-layered extreme learning machines approach. Energies 2016, 9, 379. [Google Scholar] [CrossRef]
- Wang, L.; Zhao, X.; Pei, J.; Tang, G. Transformer fault diagnosis using continuous sparse auto encoder. SpingerPlus 2016, 5, 448. [Google Scholar] [CrossRef] [PubMed]
- Cha, Y.J.; Choi, W.; Büyüköztürk, O. Deep learning-based crack damage detection using convolutional neural networks. Comput.-Aided Civ. Infrastruct. Eng. 2017, 32, 361–378. [Google Scholar] [CrossRef]
- Mohanty, S.P.; Hughes, D.P.; Marcel, S. Using deep learning for image-based plant disease detection. Front. Plant Sci. 2016, 7, 1419. [Google Scholar] [CrossRef] [PubMed]
- Iandola, F.N.; Han, S.; Moskewicz, M.W. SqueezeNet: AlexNet-level accuracy with 50x fewer parameters and <0.5 MB model size. arXiv, 2016; arXiv:1602.07360. [Google Scholar]
- Szegedy, C.; Vanhoucke, V.; Ioffe, S.; Shlens, J. Rethinking the Inception Architecture for Computer Vision. In Proceedings of the 2016 IEEE Conference on Computer Vision and Pattern Recognition (CVPR), Las Vegas, NV, USA, 26 June–1 July 2016; pp. 2818–2826. [Google Scholar]
- Simonyan, K.; Zisserman, A. Very deep convolutional networks for large-scale image recognition. arXiv, 2014; arXiv:1409.1556. [Google Scholar]
- He, K.; Zhang, X.; Ren, S.; Sun, J. Deep residual learning for image recognition. In Proceedings of the 2016 IEEE conference on Computer Vision and Pattern Recognition (CVPR), Las Vegas, NV, USA, 26 June–1 July 2016; pp. 770–778. [Google Scholar]
- Shen, L.; Lin, Z.; Huang, Q. Relay backpropagation for effective learning of deep convolutional neural networks. In Proceedings of the 2016 European Conference on Computer Vision (ECCV), Amsterdam, The Netherlands, 8–16 October 2016; pp. 467–482. [Google Scholar]
- Zhou, B.; Khosla, A.; Lapedriza, A.; Oliva, A.; Torralba, A. Learning Deep Features for Discriminative Localization. In Proceedings of the 2016 IEEE Conference on Computer Vision and Pattern Recognition (CVPR), Las Vegas, NV, USA, 26 June–1 July 2016; pp. 2921–2929. [Google Scholar]
- Zeiler, M.D.; Fergus, R. Visualizing and understanding convolutional networks. In Proceedings of the 2014 European Conference on Computer Vision (ECCV), Zurich, Switzerland, 6–12 September 2014; pp. 1–16. [Google Scholar]
- Szegedy, C. Going deeper with convolutions. In Proceedings of the 2015 IEEE Conference on Computer Vision and Pattern Recognition (CVPR), Boston, MA, USA, 8–10 June 2015; pp. 1–9. [Google Scholar]
- Jia, Y.; Shelhamer, E.; Donahue, J.; Karayev, S.; Long, J.; Girshick, R.; Guadarrama, S.; Darrell, T. Caffe: Convolutional architecture for fast feature embedding. In Proceedings of the 2014 IEEE Conference on Computer Vision and Pattern Recognition (CVPR), Columbus, OH, USA, 24–27 June 2014; pp. 1–4. [Google Scholar]
- Maaten, L.V.d.; Hinton, G. Visualizing data using t-sne. J. Mach. Learn. Res. 2008, 9, 2579–2605. [Google Scholar]
- Maaten, L.V.d. Accelerating t-sne using tree-based algorithms. J. Mach. Learn. Res. 2014, 15, 3221–3245. [Google Scholar]


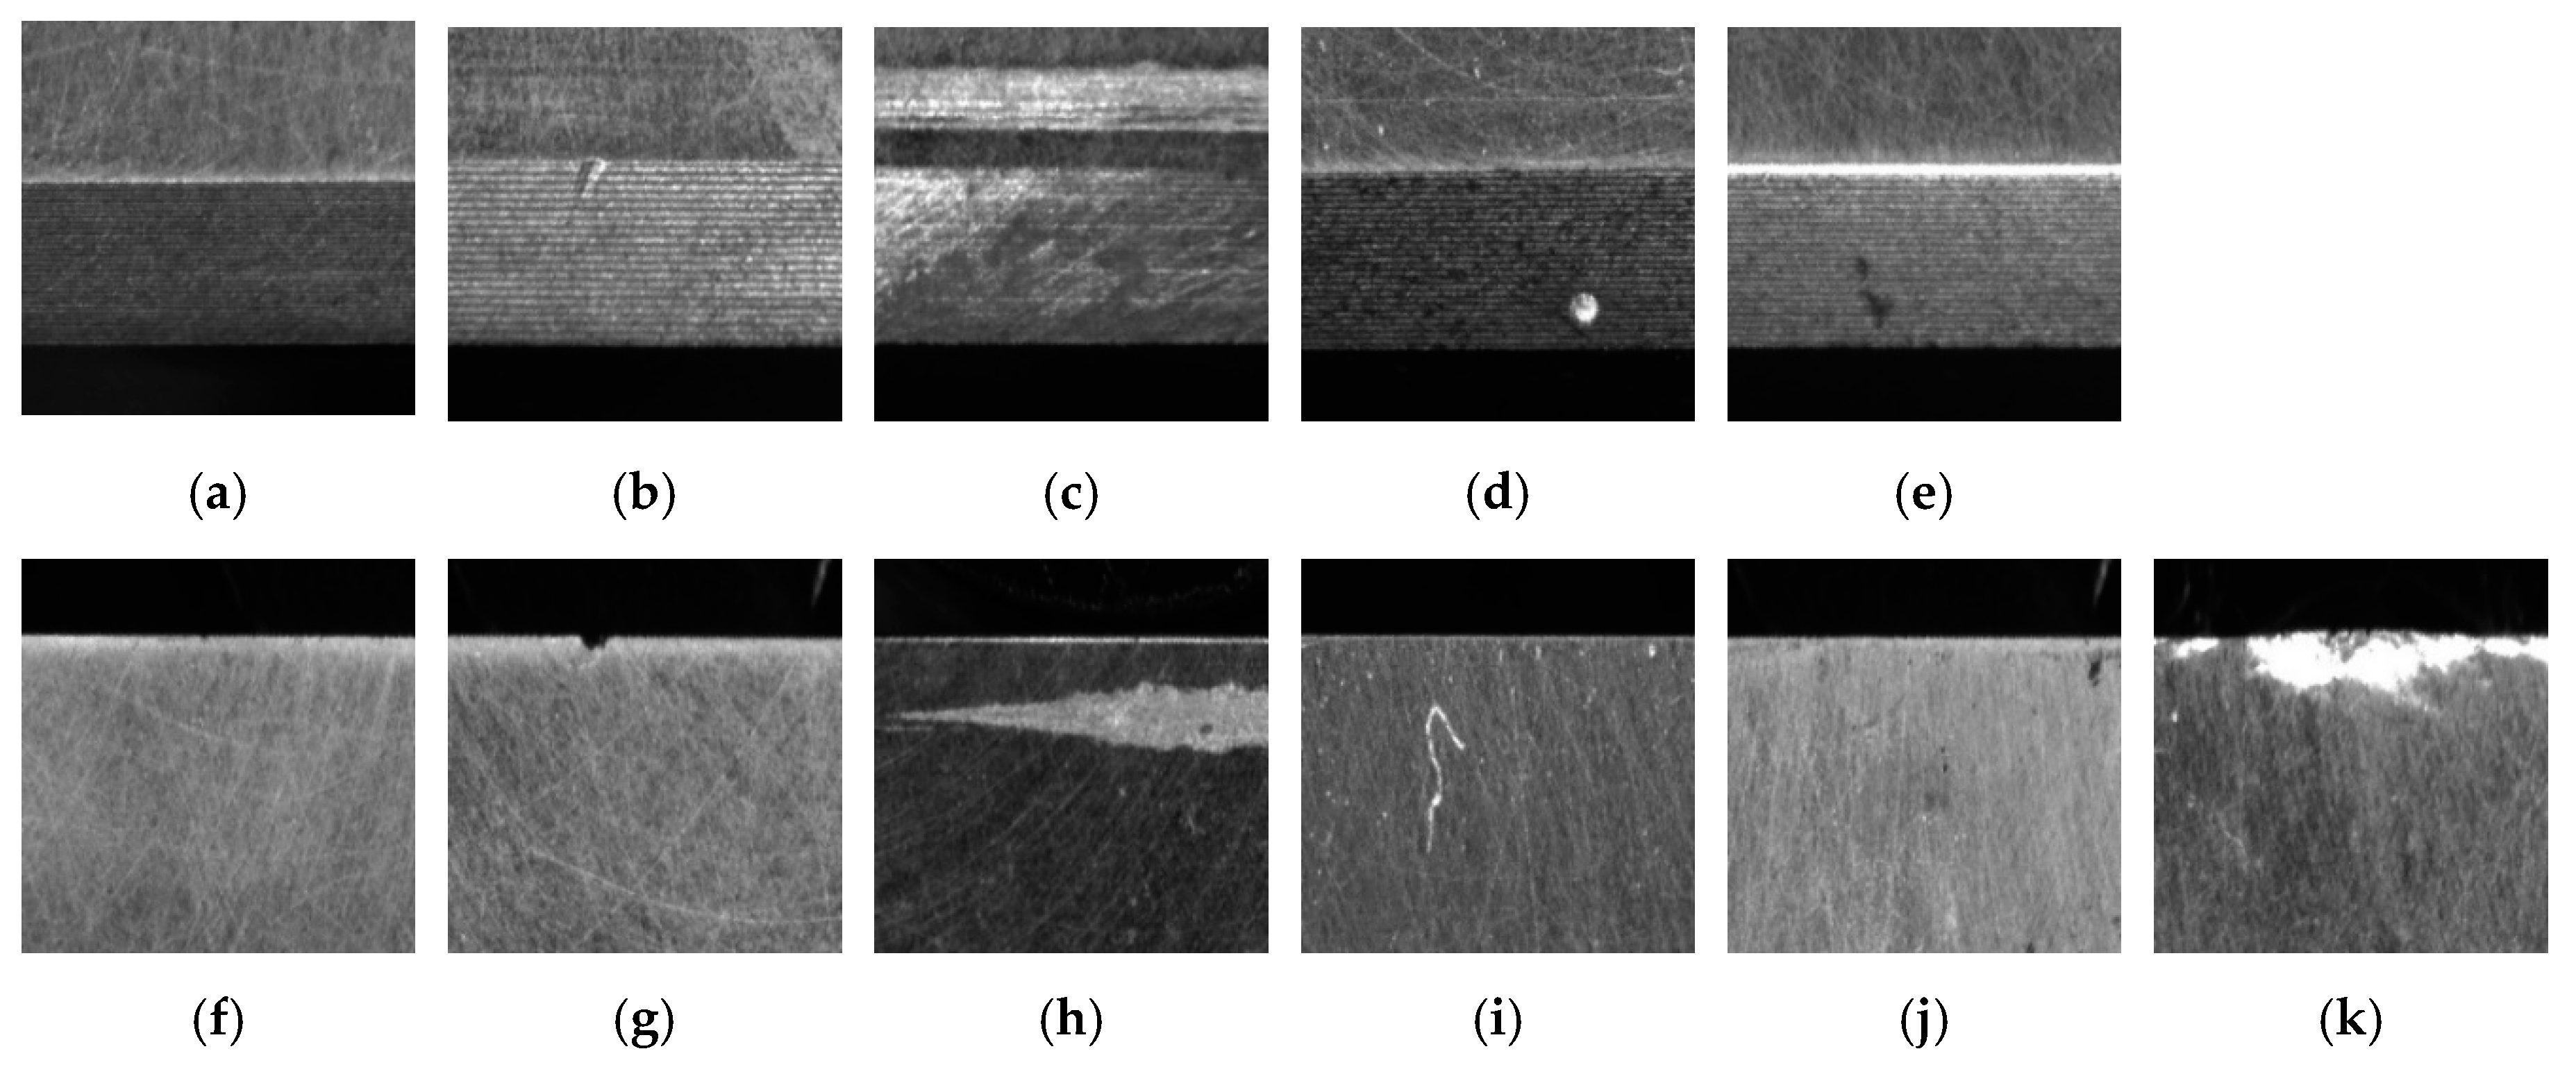
| Surface Type | EFQ | EFC | EFI | EFSc | EFSt | EFSF |
|---|---|---|---|---|---|---|
| Number of samples | 300 | 94 | 14 | 32 | 18 | 44 |
| Surface type | CQ | CC | CI | CSc | CSt | |
| Number of samples | 200 | 70 | 31 | 6 | 21 |
| Input: k categories of target samples: {C1, C2, …, Ck}, each of which has a number of {N1, N2, …, Nk}; Process: For the most numerous category Cm, the sample size is Nm, and the sample order is Pm0 = {1, 2, …, Nm}. Randomly scramble the sample order to Pm-rand = {p1, p2, …, pNm}. Output: For any other categories Ci (i = 1, 2, …, k, i ≠ m), the original sample order is Pi0 = {1, 2, …, Ni}, and the expanded sample order is Pi-LD = {p1 mod Ni, p2 mod Ni, …, pNm mod Ni}. |
| Type | EFQ/EFC/EFI/EFSc/EFSt/EFSF | CQ/CC/CI/CSc/CSt |
|---|---|---|
| Training set | 1440 | 960 |
| Validation set | 480 | 320 |
| Test set | 480 | 320 |
| Total number | 2400 | 1600 |
| Model Name. | Training Type | Number of Layers | Number of Parameters |
|---|---|---|---|
| SqueezeNet v1.1 | From scratch | 18 | 728,139 |
| SDD-SqueezeNet v1.1 | From scratch | ||
| SDD-SqueezeNet v1.1 | Deep transfer | ||
| Inception v3 | From scratch | 18 | 24,734,048 |
| SDD-Inception v3 | From scratch | ||
| SDD-Inception v3 | Deep transfer | ||
| VGG16 | From scratch | 16 | 134,305,611 |
| SDD-VGG16 | From scratch | ||
| SDD-VGG16 | Deep transfer | ||
| ResNet18 | From scratch | 18 | 11,196,107 |
| SDD-ResNet18 | From scratch | ||
| SDD-ResNet18 | Deep transfer |
© 2019 by the authors. Licensee MDPI, Basel, Switzerland. This article is an open access article distributed under the terms and conditions of the Creative Commons Attribution (CC BY) license (http://creativecommons.org/licenses/by/4.0/).
Share and Cite
Xu, X.; Zheng, H.; Guo, Z.; Wu, X.; Zheng, Z. SDD-CNN: Small Data-Driven Convolution Neural Networks for Subtle Roller Defect Inspection. Appl. Sci. 2019, 9, 1364. https://doi.org/10.3390/app9071364
Xu X, Zheng H, Guo Z, Wu X, Zheng Z. SDD-CNN: Small Data-Driven Convolution Neural Networks for Subtle Roller Defect Inspection. Applied Sciences. 2019; 9(7):1364. https://doi.org/10.3390/app9071364
Chicago/Turabian StyleXu, Xiaohang, Hong Zheng, Zhongyuan Guo, Xiongbin Wu, and Zhaohui Zheng. 2019. "SDD-CNN: Small Data-Driven Convolution Neural Networks for Subtle Roller Defect Inspection" Applied Sciences 9, no. 7: 1364. https://doi.org/10.3390/app9071364
APA StyleXu, X., Zheng, H., Guo, Z., Wu, X., & Zheng, Z. (2019). SDD-CNN: Small Data-Driven Convolution Neural Networks for Subtle Roller Defect Inspection. Applied Sciences, 9(7), 1364. https://doi.org/10.3390/app9071364