Land Subsidence Susceptibility Mapping Using Bayesian, Functional, and Meta-Ensemble Machine Learning Models


Abstract
1. Introduction
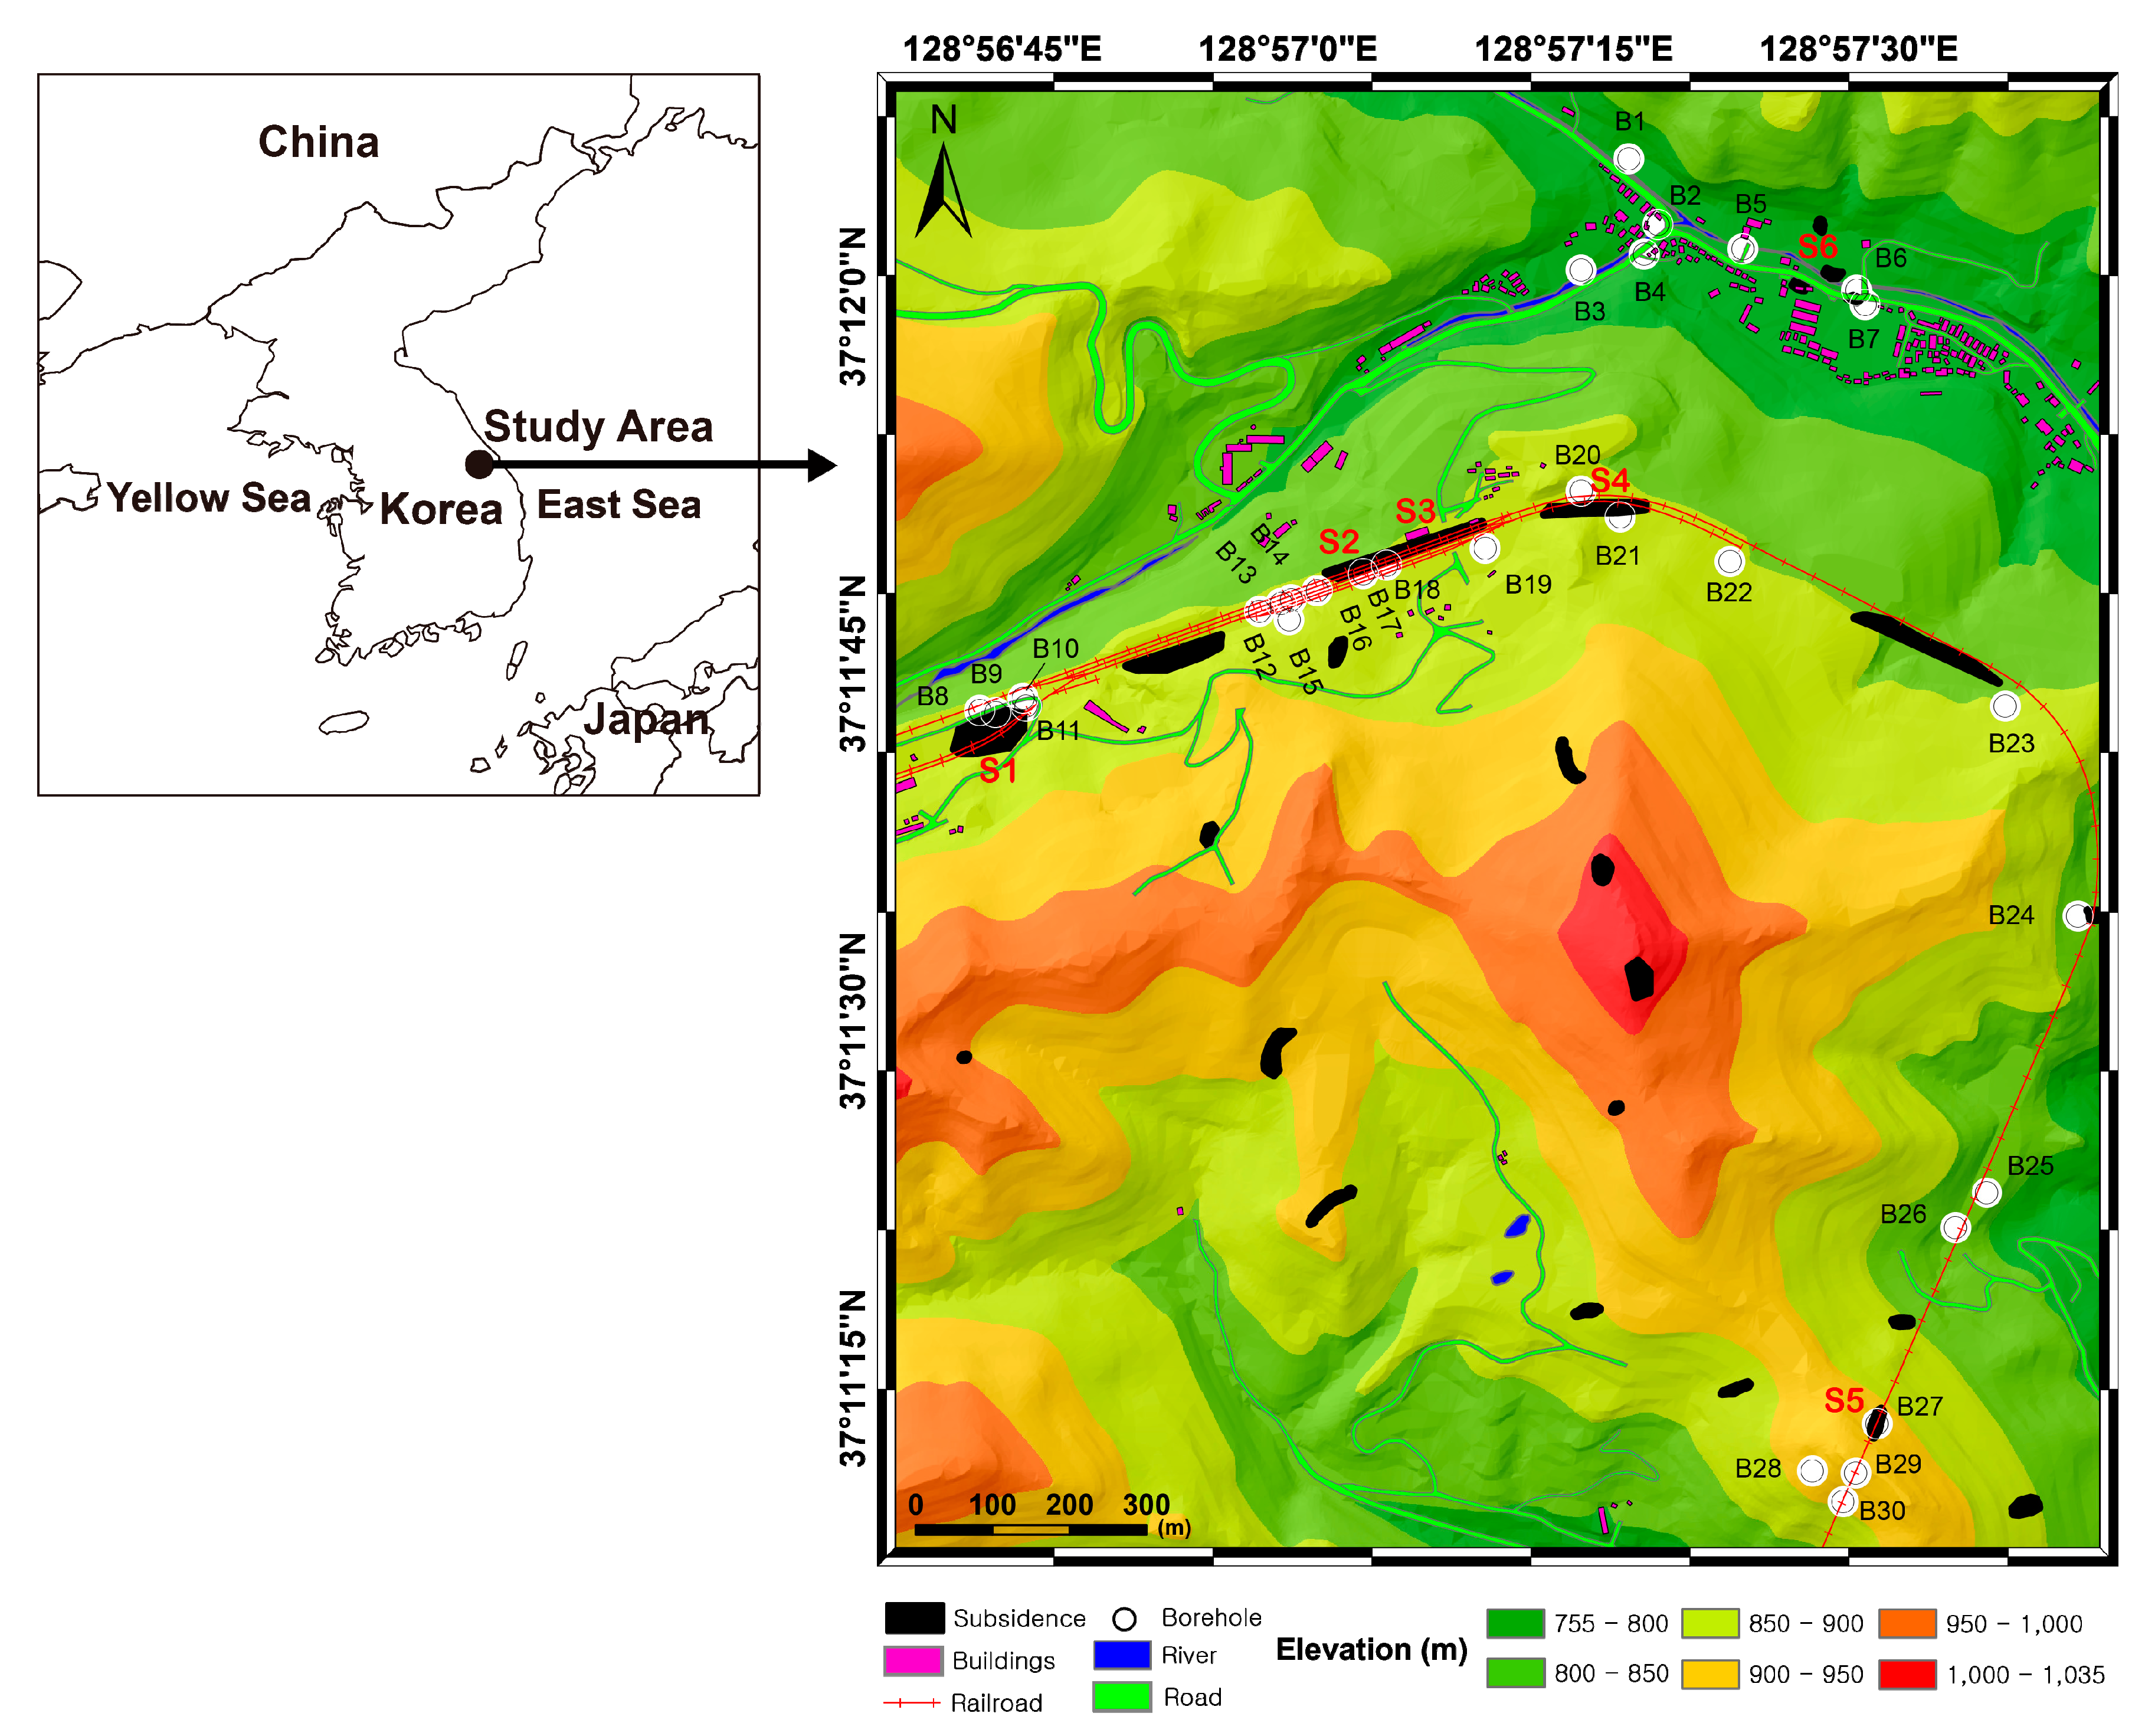
2. Land Subsidence in the Study Area
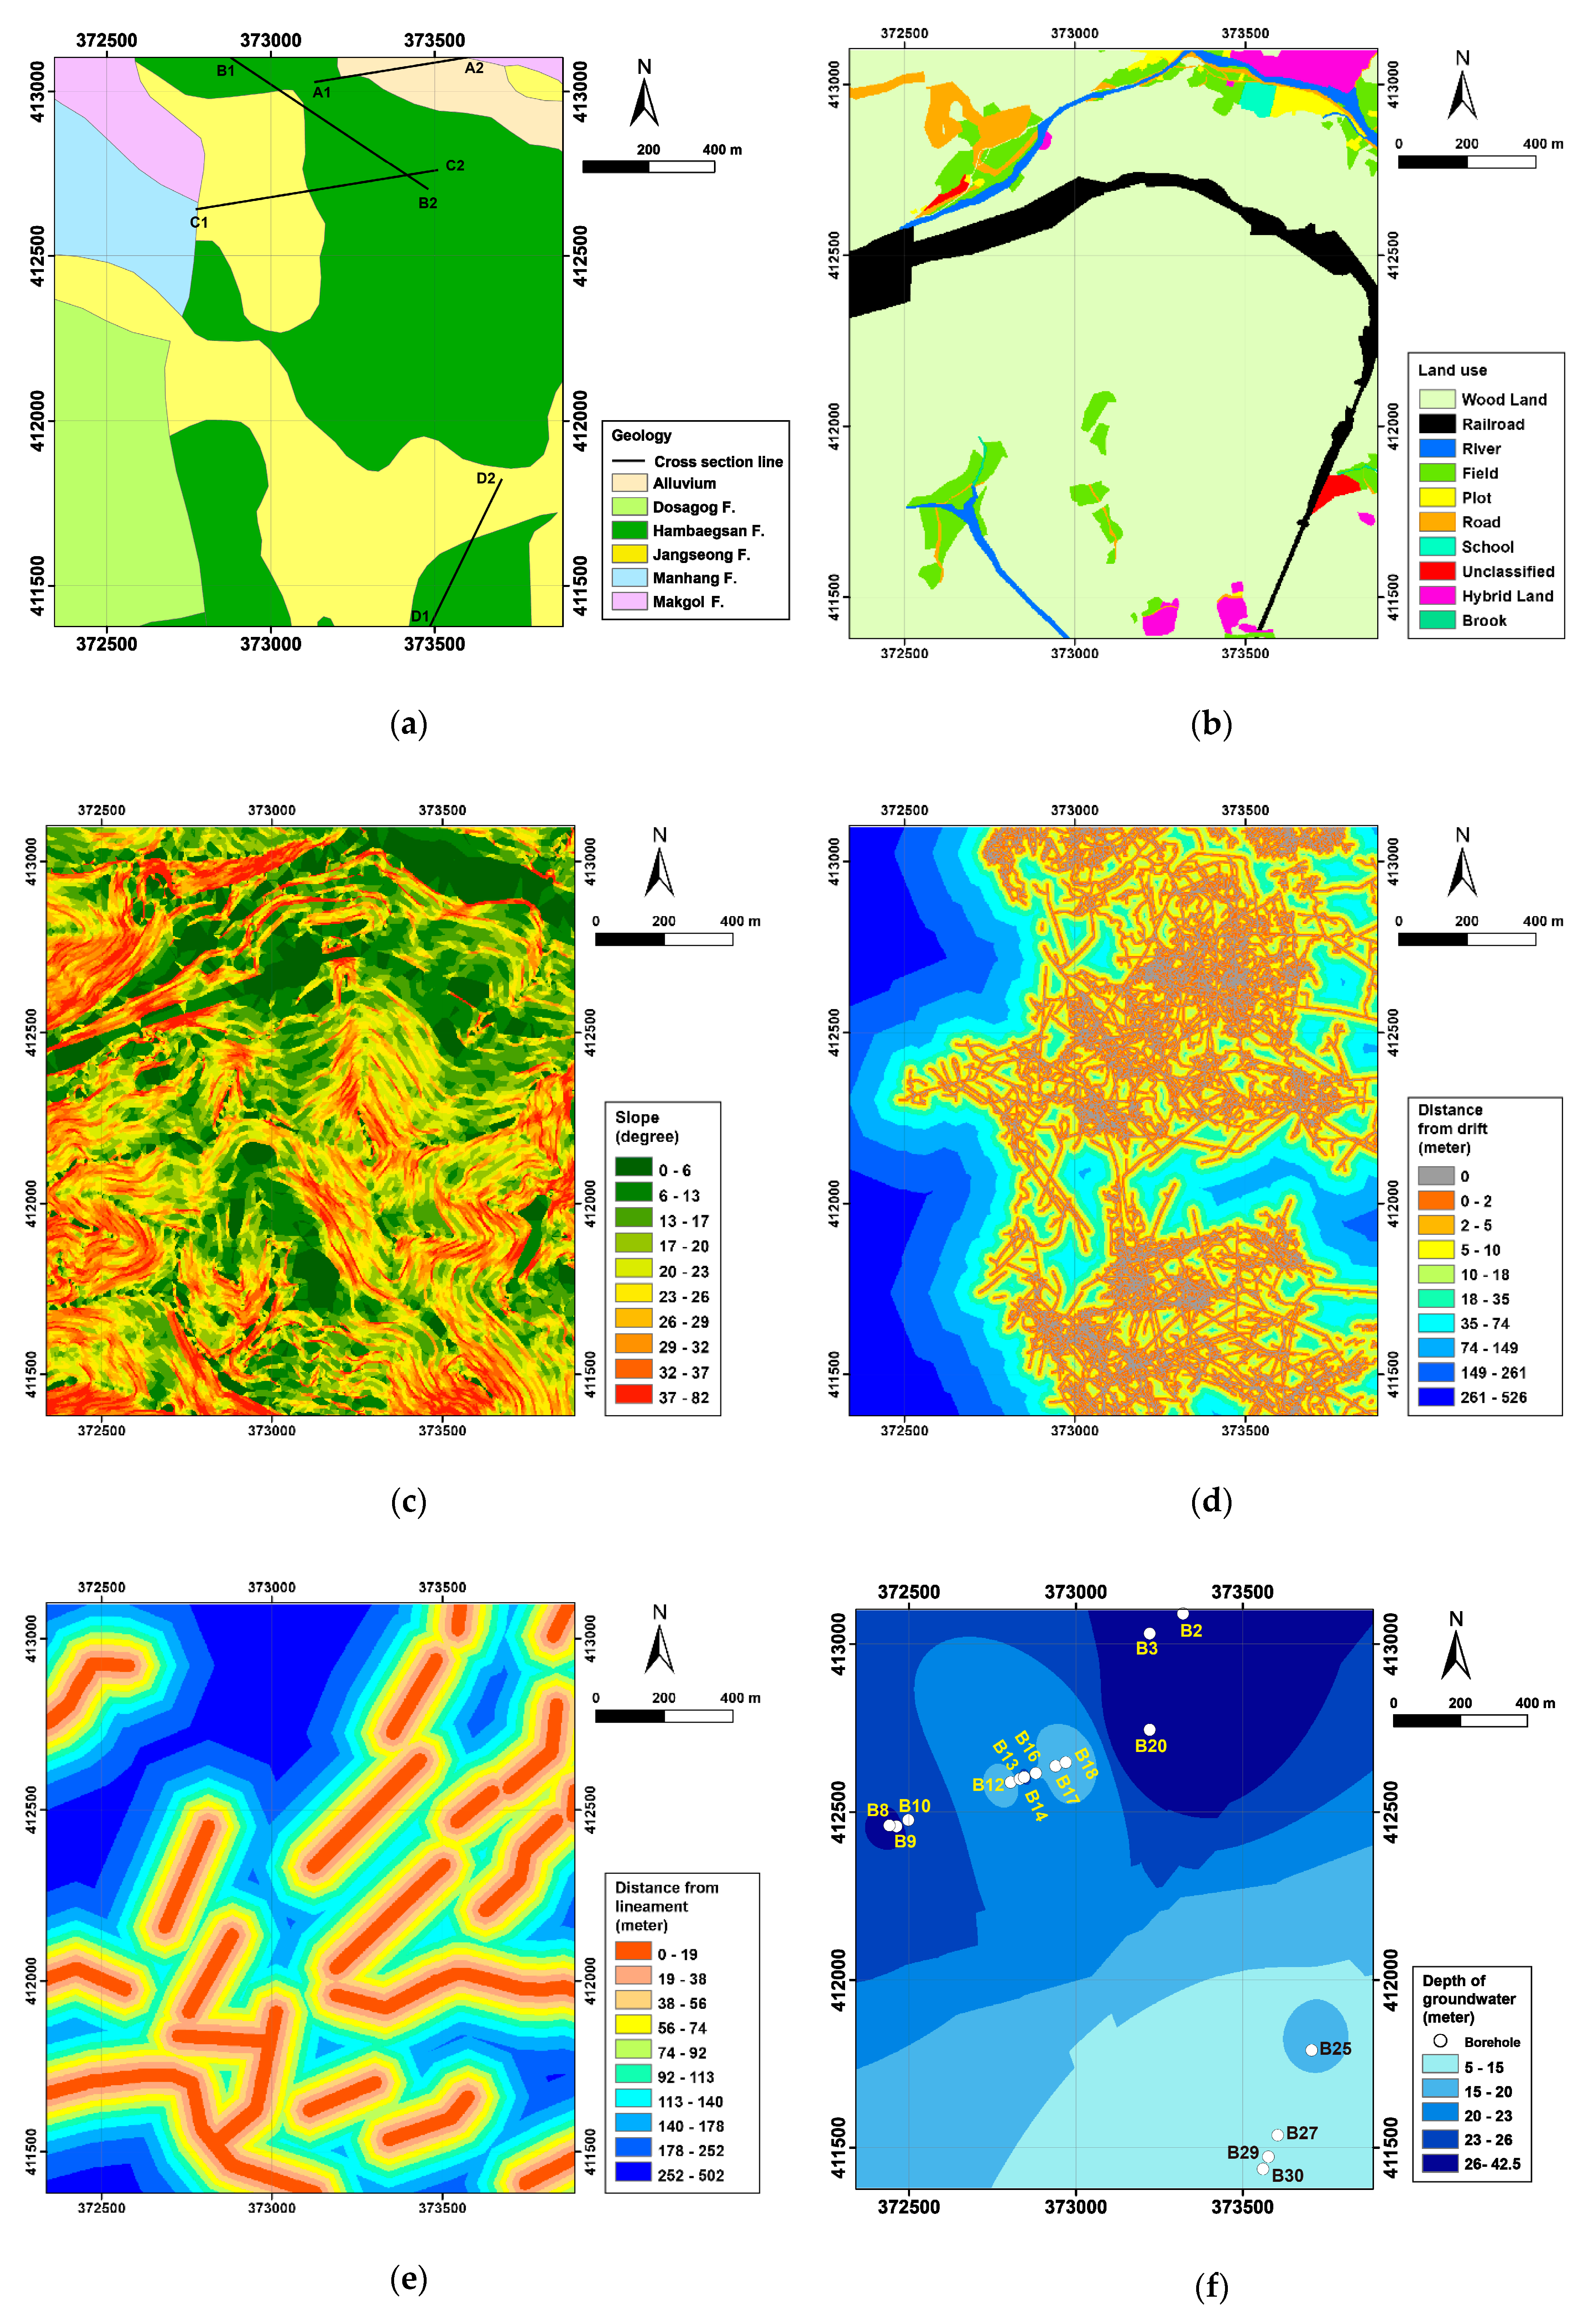
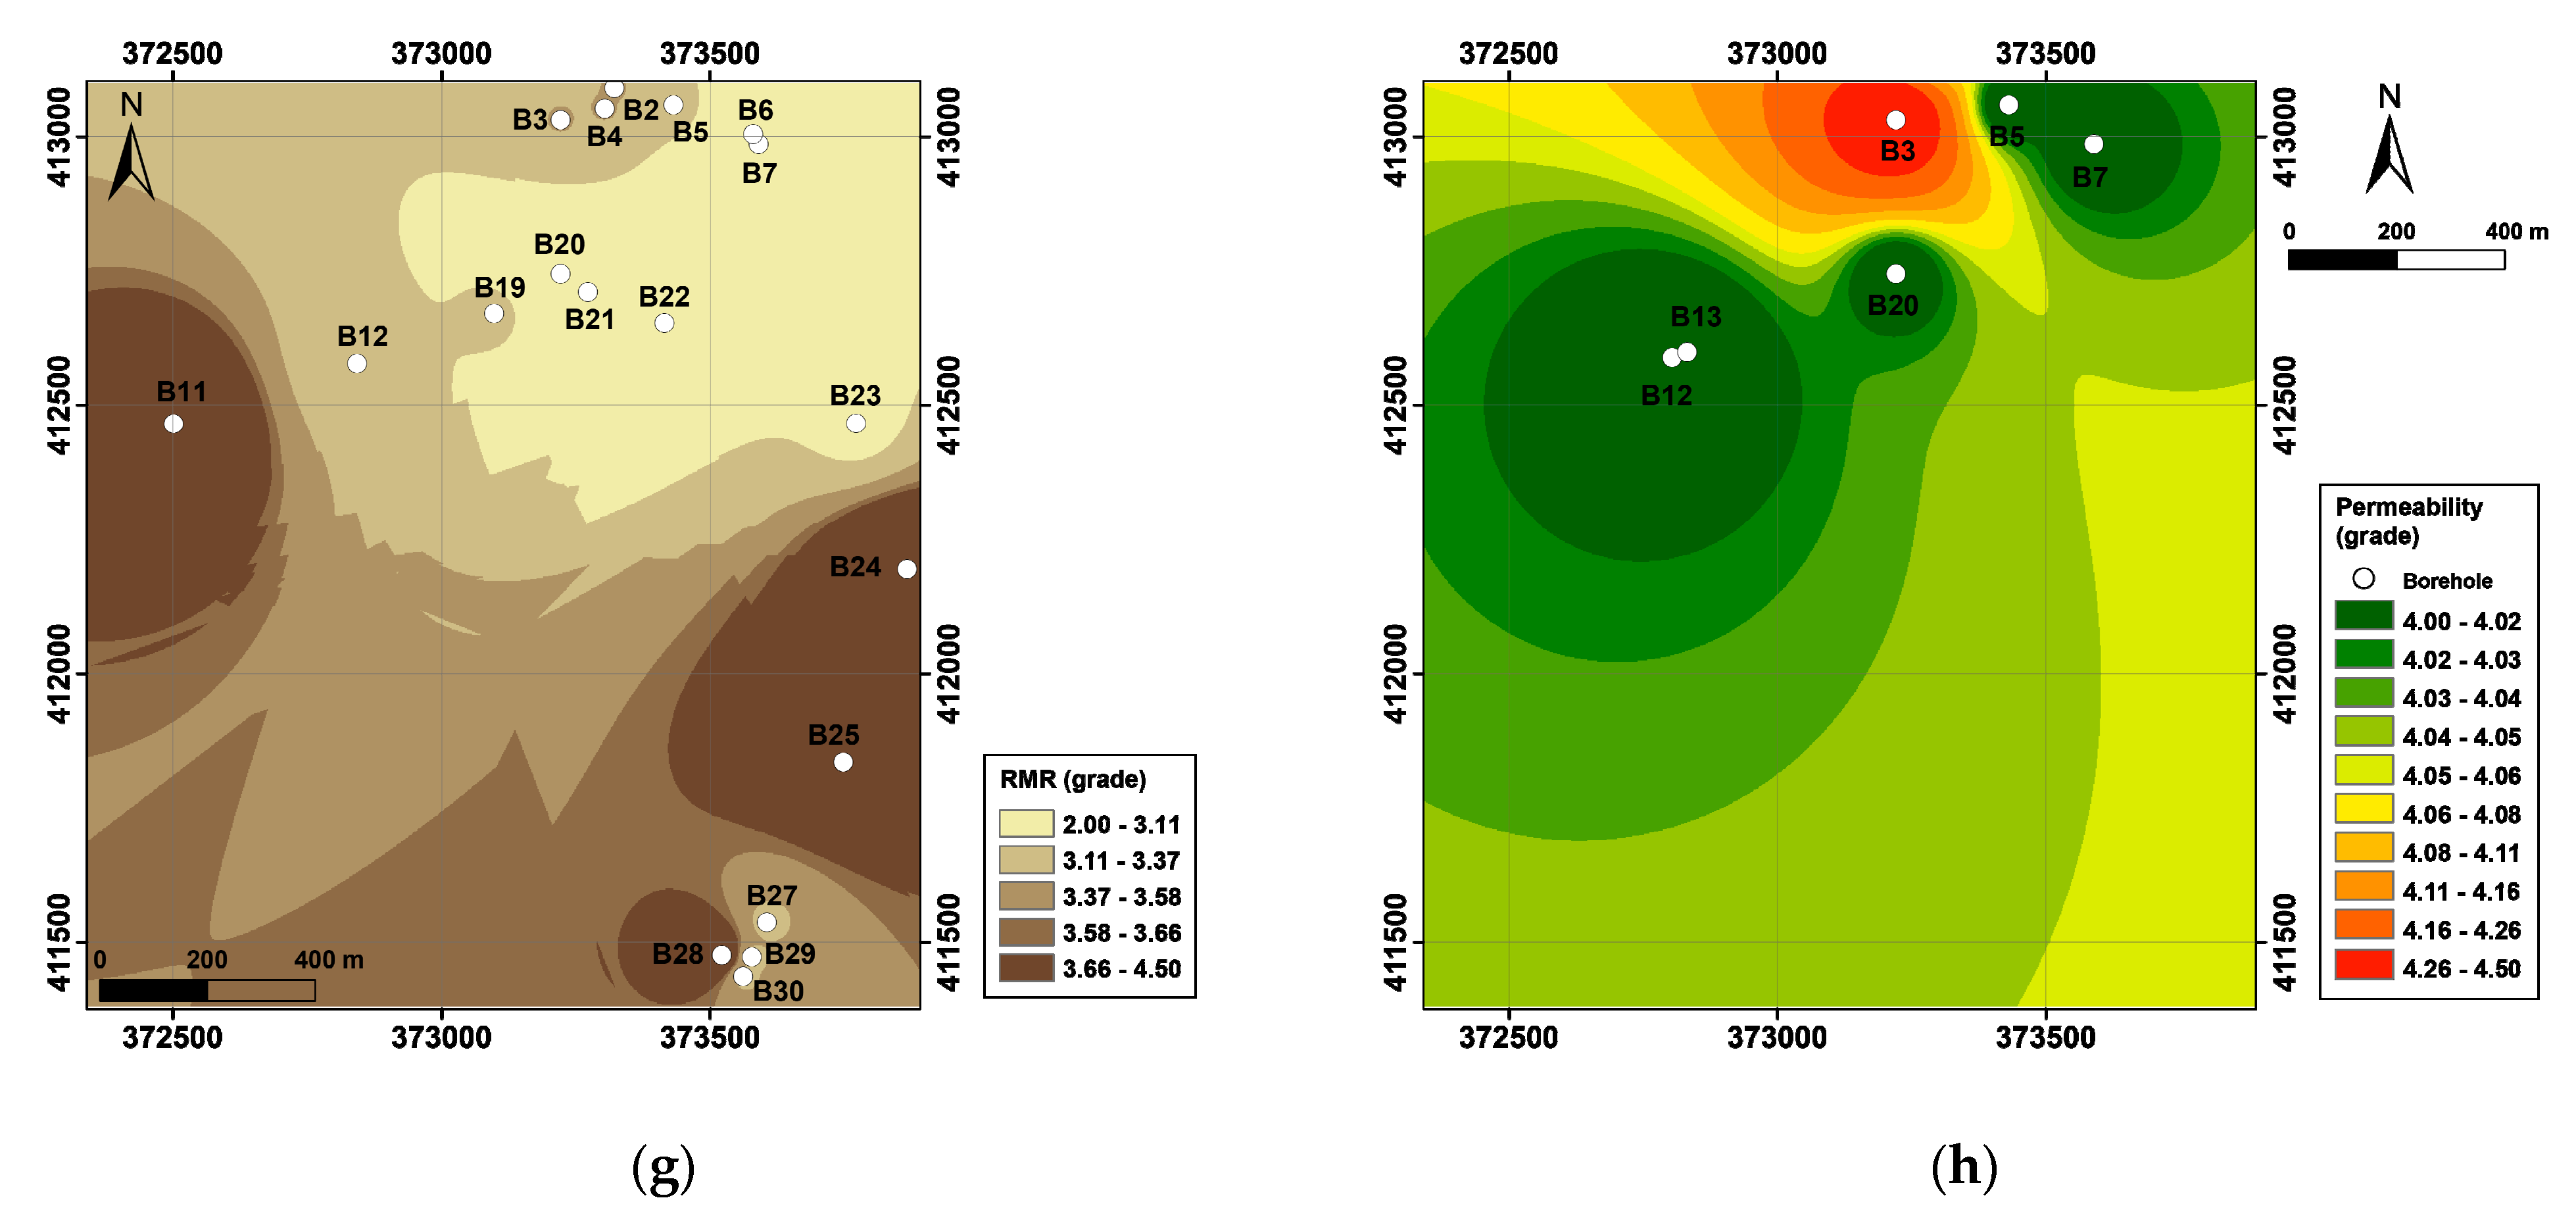
3. Construction of Spatial Database
4. Methods
4.1. Models
4.1.1. Bayes Net (BN)
4.1.2. Naïve Bayes (NB)
4.1.3. Logistic Regression (LR)
4.1.4. Multilayer Perceptron (MLP)
4.1.5. Logit Boost (LB)
- Assign weights and probability estimates
- For m = 1, 2, ..., m, repeat the following steps:
- Compute the working response and weights:
- Fit the function by weighted least-squares regression of to using weights .
- Update the function as:
- Output the classifier.
4.2. Model Evaluation and Comparison
5. Results
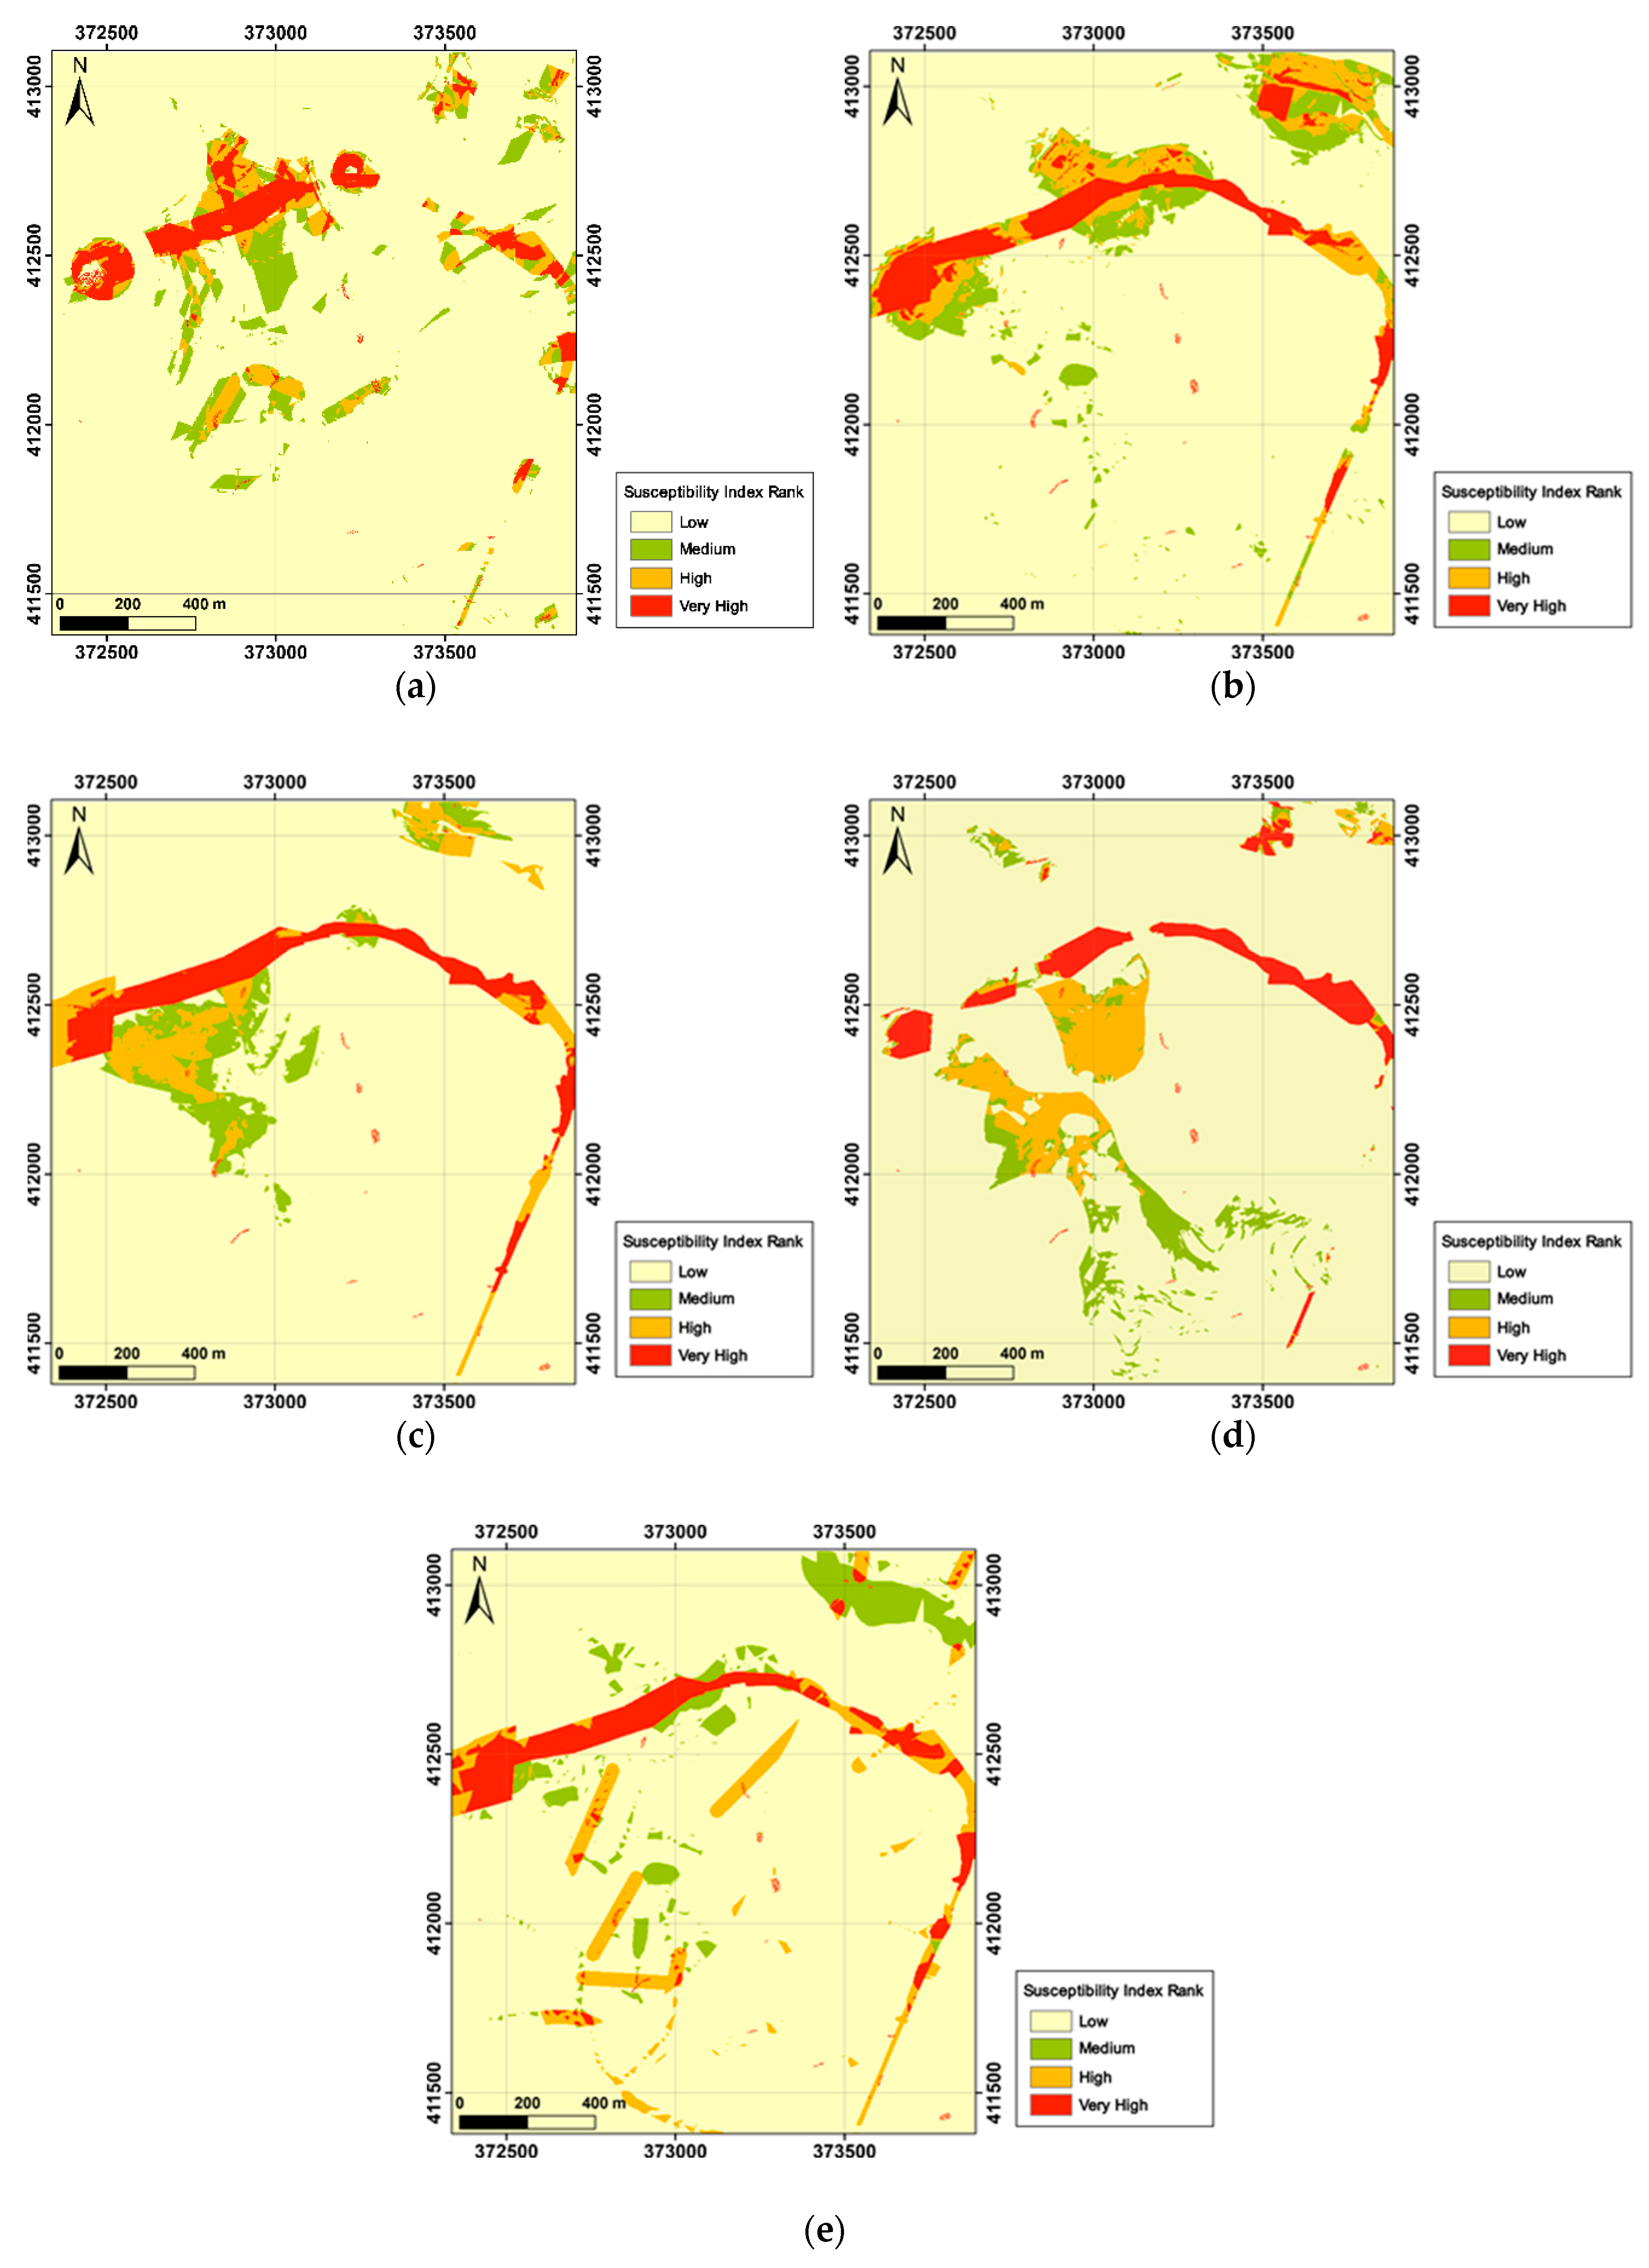
5.1. LSS Mapping
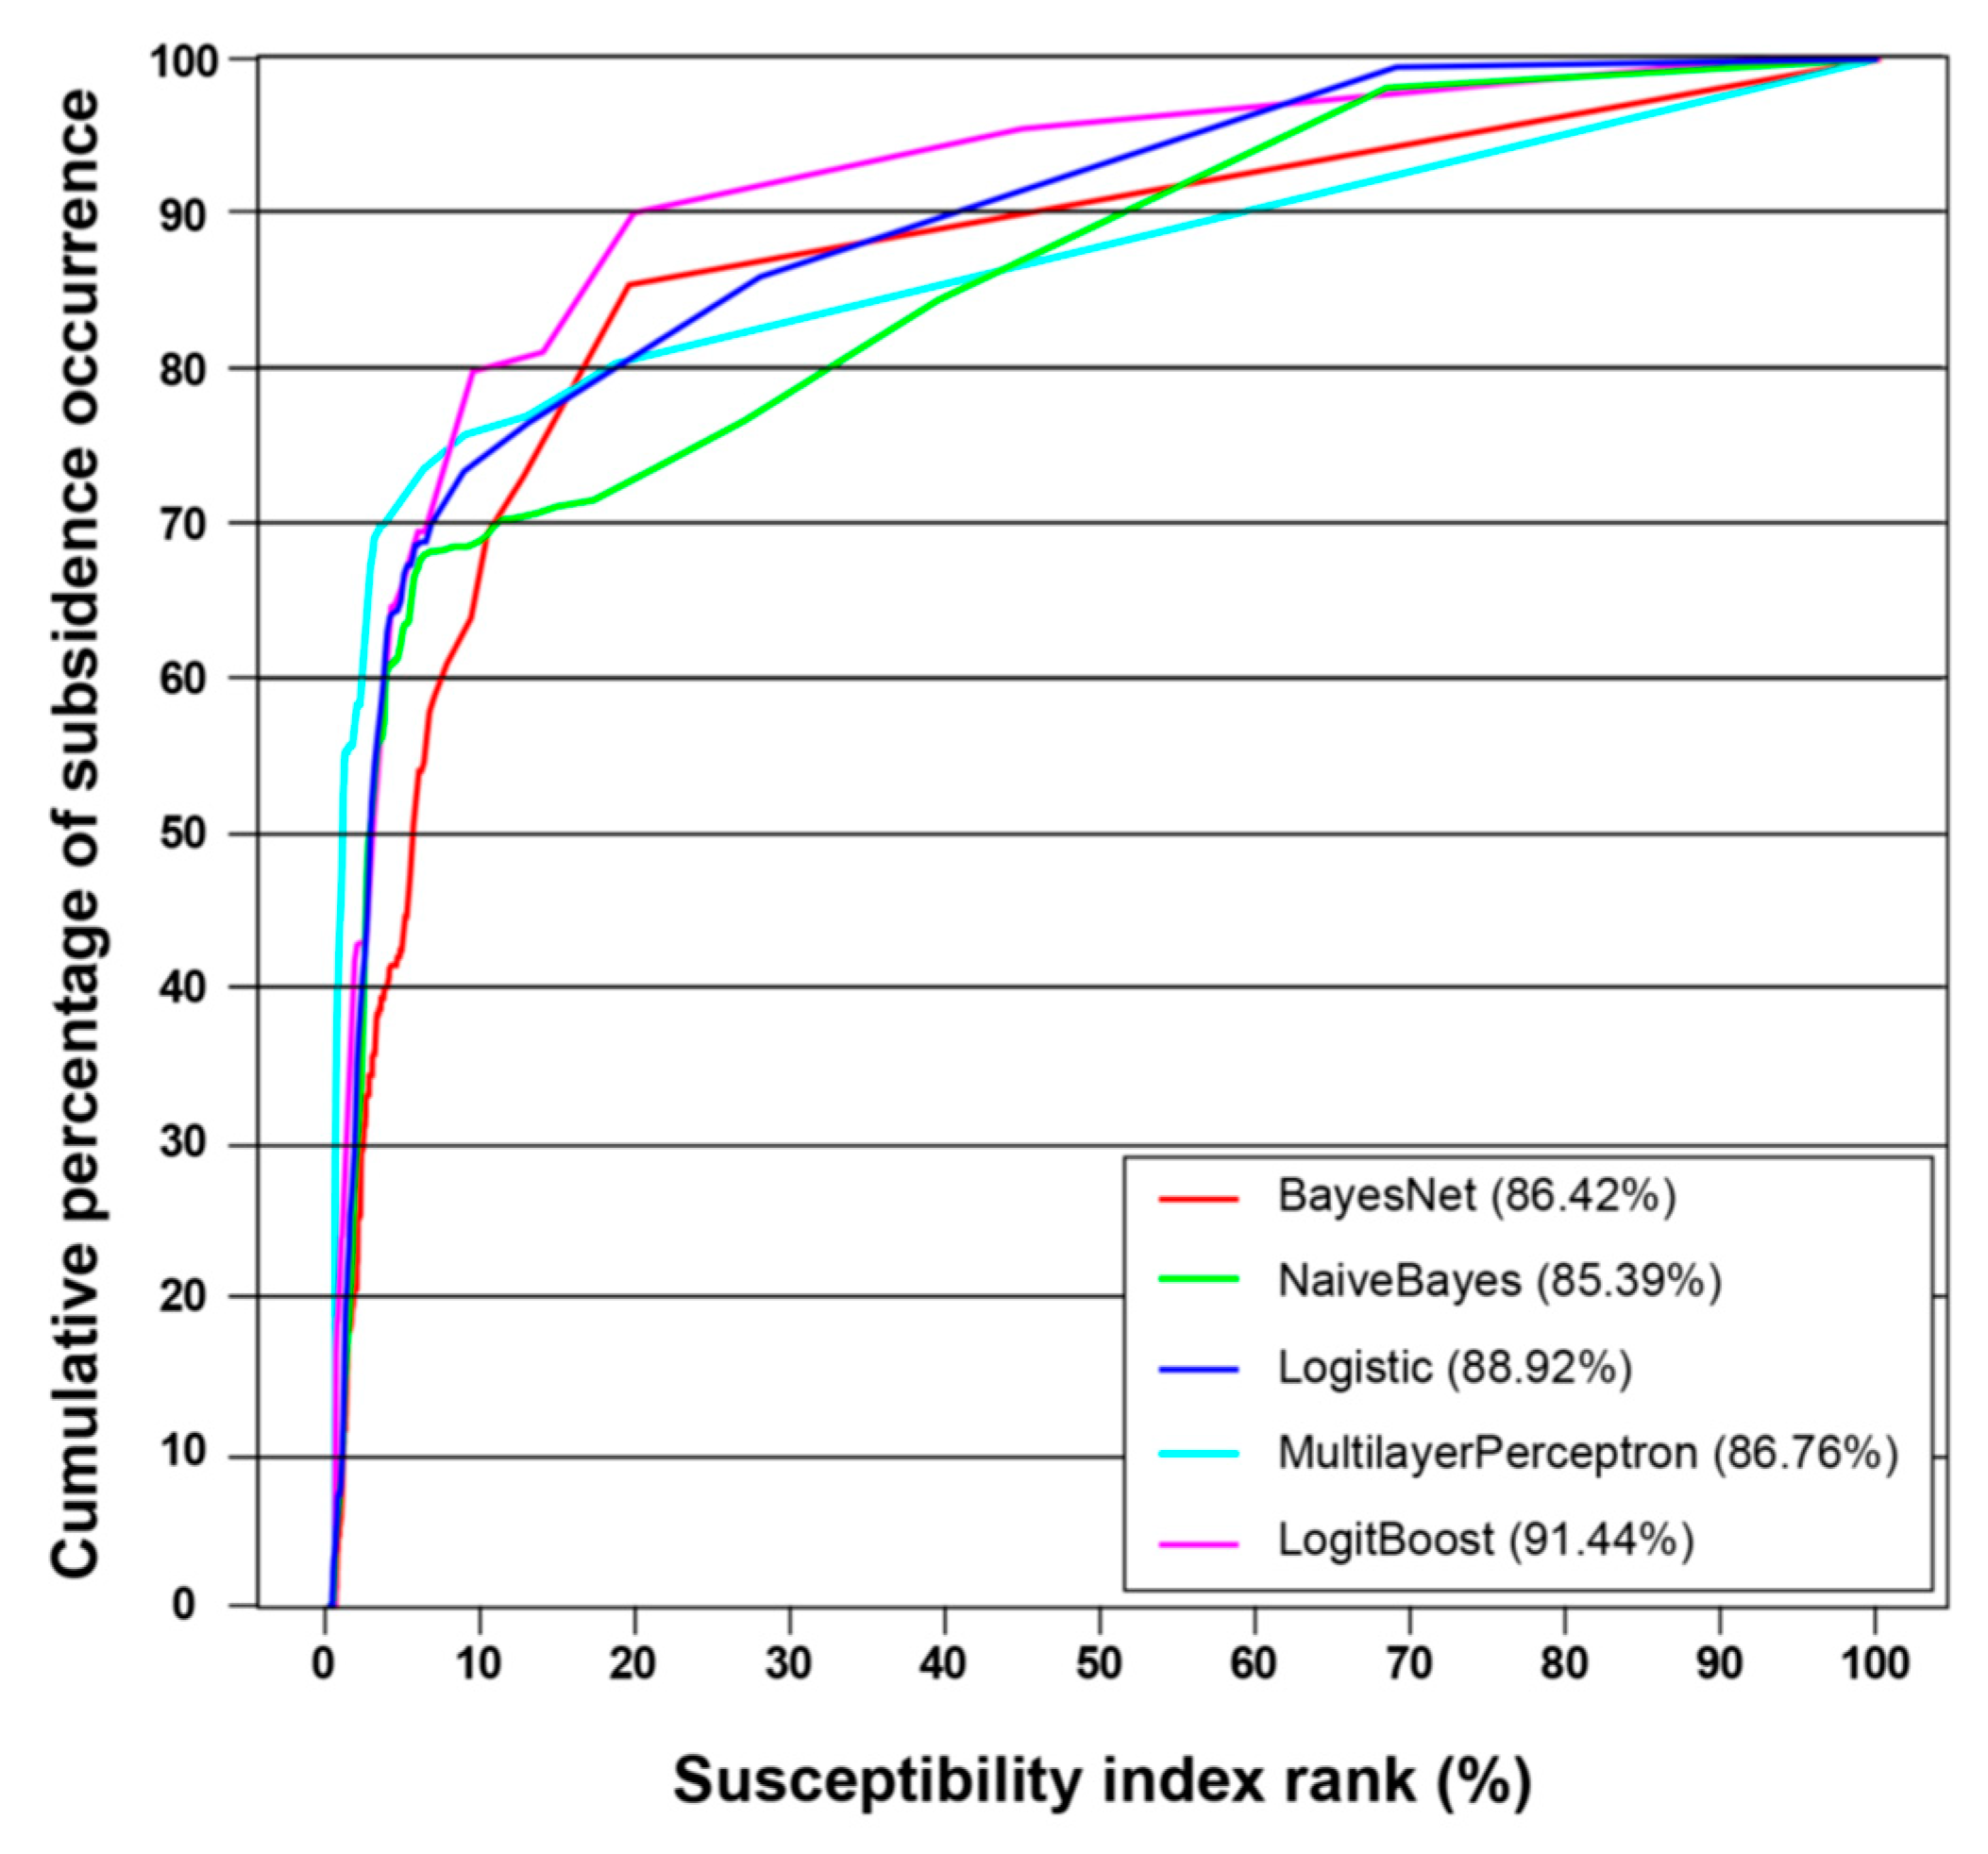
5.2. Validation
6. Discussion
7. Conclusions
Author Contributions
Funding
Conflicts of Interest
References
- Ghorbanzadeh, O.; Rostamzadeh, H.; Blaschke, T.; Gholaminia, K.; Aryal, J. A New Gis-Based Data Mining Technique Using an Adaptive Neuro-Fuzzy Inference System (Anfis) and K-Fold Cross-Validation Approach for Land Subsidence Susceptibility Mapping. Nat. Hazards 2018, 94, 497–517. [Google Scholar] [CrossRef]
- Lee, S.; Park, I. Application of decision tree model for the ground subsidence hazard mapping near abandoned underground coal mines. J. Environ. Manag. 2013, 127, 166–176. [Google Scholar] [CrossRef] [PubMed]
- Oh, H.-J.; Lee, S. Integration of ground subsidence hazard maps of abandoned coal mines in Samcheok, Korea. Int. J. Coal Geol. 2011, 86, 58–72. [Google Scholar] [CrossRef]
- Pradan, B.; Abokharima, M.H.; Jebur, M.N.; Tehrany, M.S. Land Subsidence Susceptibility Mapping at Kinta Valley (Malaysia) Using the Evidential Belief Function Model in Gis. Nat. Hazards 2014, 73, 1019–1042. [Google Scholar] [CrossRef]
- Lee, S.; Park, I.; Choi, J.K. Spatial prediction of ground subsidence susceptibility using an artificial neural network. Environ. Manag. 2012, 49, 347–358. [Google Scholar] [CrossRef] [PubMed]
- Oh, H.-J.; Ahn, S.-C.; Choi, J.-K.; Lee, S. Sensitivity analysis for the GIS-based mapping of the ground subsidence hazard near abandoned underground coal mines. Environ. Earth Sci. 2011, 64, 347–358. [Google Scholar] [CrossRef]
- Pishro, M.; Khosravi, S.; Tehrani, S.M.; Mousavi, S.R. Modeling and zoning of land subsidence in the southwest of Tehran using artificial neural networks. Int. J. Hum. Cap. Urban Manag. 2016, 1, 159–168. [Google Scholar]
- Rafie, M.; Samimi Namin, F. Prediction of subsidence risk by FMEA using artificial neural network and fuzzy inference system. Int. J. Min. Sci. Technol. 2015, 25, 655–663. [Google Scholar] [CrossRef]
- Tien Bui, D.; Shahabi, H.; Shirzadi, A.; Chapi, K.; Pradhan, B.; Chen, W.; Khosravi, K.; Panahi, M.; Bin Ahmad, B.; Saro, L. Land Subsidence Susceptibility Mapping in South Korea Using Machine Learning Algorithms. Sensors 2018, 18, 2464. [Google Scholar] [CrossRef]
- Ilia, I.; Loupasakis, C.; Tsangaratos, P. Land subsidence phenomena investigated by spatiotemporal analysis of groundwater resources, remote sensing techniques, and random forest method: The case of Western Thessaly, Greece. Environ. Monit. Assess. 2018, 190, 623. [Google Scholar] [CrossRef]
- Choi, J.-K.; Kim, K.-D.; Lee, S.; Won, J.-S. Application of a fuzzy operator to susceptibility estimations of coal mine subsidence in Taebaek City, Korea. Environ. Earth Sci. 2010, 59, 1009–1022. [Google Scholar] [CrossRef]
- Pham, B.T.; Tien Bui, D.; Prakash, I.; Dholakia, M.B. Hybrid integration of Multilayer Perceptron Neural Networks and machine learning ensembles for landslide susceptibility assessment at Himalayan area (India) using GIS. CATENA 2017, 149, 52–63. [Google Scholar] [CrossRef]
- Kanevski, M.; Parkin, R.; Pozdnukhov, A.; Timonin, V.; Maignan, M.; Demyanov, V.; Canu, S. Environmental data mining and modeling based on machine learning algorithms and geostatistics. Environ. Model. Softw. 2004, 19, 845–855. [Google Scholar] [CrossRef]
- Baillifard, F.; Jaboyedoff, M.; Sartori, M. Rockfall hazard mapping along a mountainous road in Switzerland using a GIS-based parameter rating approach. Nat. Hazards Earth Syst. Sci. 2003, 3, 435–442. [Google Scholar] [CrossRef]
- Samanta, S.; Pal, D.K.; Palsamanta, B. Flood susceptibility analysis through remote sensing, GIS and frequency ratio model. Appl. Water Sci. 2018, 8, 66. [Google Scholar] [CrossRef]
- Lee, S.; Pradhan, B. Landslide hazard mapping at Selangor, Malaysia using frequency ratio and logistic regression models. Landslides 2007, 4, 33–41. [Google Scholar] [CrossRef]
- Kadavi, P.R.; Lee, C.-W.; Lee, S. Application of Ensemble-Based Machine Learning Models to Landslide Susceptibility Mapping. Remote Sens. 2018, 10, 1252. [Google Scholar] [CrossRef]
- Pham, B.T.; Prakash, I.; Khosravi, K.; Chapi, K.; Trinh, P.T.; Ngo, T.Q.; Hosseini, S.V.; Bui, D.T. A comparison of Support Vector Machines and Bayesian algorithms for landslide susceptibility modelling. Geocarto Int. 2018, 1–23. [Google Scholar] [CrossRef]
- Darabi, H.; Choubin, B.; Rahmati, O.; Torabi Haghighi, A.; Pradhan, B.; Kløve, B. Urban flood risk mapping using the GARP and QUEST models: A comparative study of machine learning techniques. J. Hydrol. 2019, 569, 142–154. [Google Scholar] [CrossRef]
- Truong, X.L.; Mitamura, M.; Kono, Y.; Raghavan, V.; Yonezawa, G.; Truong, X.Q.; Do, T.H.; Tien Bui, D.; Lee, S. Enhancing Prediction Performance of Landslide Susceptibility Model Using Hybrid Machine Learning Approach of Bagging Ensemble and Logistic Model Tree. Appl. Sci. 2018, 8, 1046. [Google Scholar] [CrossRef]
- Park, I.; Choi, J.; Jin Lee, M.; Lee, S. Application of an adaptive neuro-fuzzy inference system to ground subsidence hazard mapping. Comput. Geosci. 2012, 48, 228–238. [Google Scholar] [CrossRef]
- Bang, G.M.; Choi, S.S.; Oh, S.H.; Sin, J.S.; Jeon, M.G.; Woo, S.U.; Heo, J.E.; Cheon, M.N.; Jo, N.S.; Kim, B.C.; et al. A Detailed Survey of Monitoring in Whajeon Region; Coal Industry Promotion Board: Seoul, Korea, 1999; p. 681. [Google Scholar]
- Kim, J.N. A Case Study on Stability Analysis of Ground Subsidence in Abandoned Mine Area—Focused on the Vicinity of the Chunjeon Station; Seoul National University of Science and Technology: Seoul, Korea, 2011. [Google Scholar]
- Canbulat, I.; Zhang, C.; Black, K.; Johnston, J.; McDonald, S. Assessment of Sinkhole Risk in Shallow Coal Mining. In Proceedings of the 10th Triennial Conference of Mine Subsidence: Adaptive Innovation for Managing Challenges, Pokolbin, Australia, 5–7 November 2017. [Google Scholar]
- Singh, K.B.; Dhar, B.B. Sinkhole subsidence due to mining. Geotech. Geol. Eng. 1997, 15, 327–341. [Google Scholar] [CrossRef]
- Board, C.I.P. Ground Stability Investigation for Hwajeon (Korean Edn); Coal Industry Promotion Board: Seoul, Korea, 1996; pp. 9–84. [Google Scholar]
- Sahu, P.; Lokhande, R.D. An Investigation of Sinkhole Subsidence and its Preventive Measures in Underground Coal Mining. Procedia Earth Planet. Sci. 2015, 11, 63–75. [Google Scholar] [CrossRef]
- Lee, F.T.; Abel, J.F. Subsidence from Underground Mining; Environmental Analysis and Planning Considerations; USGS: Reston, VA, USA, 1983. [CrossRef]
- The Geological Society of Korea. Geologic Altas of Taebaegsan Region: Homyeong Geological Sheet; The Geological Society of Korea: Seoul, Korea, 1962. [Google Scholar]
- Seo, H.K.; Kim, D.S.; Park, S.H.; Park, J.S.; Bae, D.J.; Yu, Y.S.; Lee, D.Y.; Im, S.B.; Jang, Y.H.; Jo, M.J. Geologic Atlas of the Samcheog Coalfield; Korea Institute of Geoscience and Mineral Resources: Daejeon, Korea, 1979; p. 22. [Google Scholar]
- National Geographic Information Institute. Digital Land Characteristics Map with 1:5000 Scale: No. of index: 37816018, 37816019, 37816028, 37816029; National Geographic Information Institute: Suwon, Korea, 1996.
- National Geographic Information Institute. Digital Topographical Map with 1:5000 Scale: No. of index: 37816018, 37816019, 37816028, 37816029; National Geographic Information Institute: Suwon, Korea, 1996.
- Tripathi, N.; Singh, R.S. Underground Coal Mine Subsidence Impacts Forest Ecosystem. 2010. Available online: https://www.researchgate.net/publication/275207695 (accessed on 25 January 2019).
- Öge, İ.F.; Çırak, M. Relating rock mass properties with Lugeon value using multiple regression and nonlinear tools in an underground mine site. Bull. Eng. Geol. Environ. 2017. [Google Scholar] [CrossRef]
- Marcot, B.; Steventon, J.; Sutherland, G.; McCann, R. Guidelines for Developing and Updating Bayesian Belief Networks Applied to Ecological Modeling and Conservation. Can. J. Forest Res. 2006, 36, 3063–3074. [Google Scholar] [CrossRef]
- Song, Y.; Gong, J.; Gao, S.; Wang, D.; Cui, T.; Li, Y.; Wei, B. Susceptibility assessment of earthquake-induced landslides using Bayesian network: A case study in Beichuan, China. Comput. Geosci. 2012, 42, 189–199. [Google Scholar] [CrossRef]
- Pham, B.T.; Pradhan, B.; Tien Bui, D.; Prakash, I.; Dholakia, M.B. A comparative study of different machine learning methods for landslide susceptibility assessment: A case study of Uttarakhand area (India). Environ. Model. Softw. 2016, 84, 240–250. [Google Scholar] [CrossRef]
- Tien Bui, D.; Pradhan, B.; Lofman, O.; Revhaug, I. Landslide susceptibility assessment in vietnam using support vector machines, decision tree, and nave bayes models. Math. Probl. Eng. 2012, 2012. [Google Scholar] [CrossRef]
- Erener, A.; Mutlu, A.; Sebnem Düzgün, H. A comparative study for landslide susceptibility mapping using GIS-based multi-criteria decision analysis (MCDA), logistic regression (LR) and association rule mining (ARM). Eng. Geol. 2016, 203, 45–55. [Google Scholar] [CrossRef]
- Ozdemir, A.; Altural, T. A comparative study of frequency ratio, weights of evidence and logistic regression methods for landslide susceptibility mapping: Sultan Mountains, SW Turkey. J. Asian Earth Sci. 2013, 64, 180–197. [Google Scholar] [CrossRef]
- Mertler, C.A.; Reinhart, R.V. Advanced and Multivariate Statistical Methods: Practical Application and Interpretation: Sixth Edition; Routledge: New York, NY, USA, 2016; pp. 1–374. [Google Scholar] [CrossRef]
- Hosmer, D.W., Jr.; Lemeshow, S.; Sturdivant, R.X. Applied Logistic Regression; John Wiley & Sons: Hoboken, NJ, USA, 2013; Volume 398. [Google Scholar]
- Haykin, S.S. Neural Networks and Learning Machines/Simon Haykin; Prentice Hall: New York, NY, USA, 2009. [Google Scholar]
- Pham, B.T.; Tien Bui, D.; Pourghasemi, H.R.; Indra, P.; Dholakia, M.B. Landslide susceptibility assesssment in the Uttarakhand area (India) using GIS: A comparison study of prediction capability of naïve bayes, multilayer perceptron neural networks, and functional trees methods. Theor. Appl. Climatol. 2017, 128, 255–273. [Google Scholar] [CrossRef]
- Bui, D.T.; Pradhan, B.; Revhaug, I.; Nguyen, D.B.; Pham, H.V.; Bui, Q.N. A novel hybrid evidential belief function-based fuzzy logic model in spatial prediction of rainfall-induced shallow landslides in the Lang Son city area (Vietnam). Geomat. Nat. Hazards Risk 2015, 6, 243–271. [Google Scholar] [CrossRef]
- Gardner, M.W.; Dorling, S.R. Artificial neural networks (the multilayer perceptron)—A review of applications in the atmospheric sciences. Atmos. Environ. 1998, 32, 2627–2636. [Google Scholar] [CrossRef]
- Friedman, J.; Tibshirani, R.; Hastie, T. Additive Logistic Regression: A Statistical View of Boosting (With Discussion and a Rejoinder by the Authors). Ann. Stat. 2000, 28, 337–407. [Google Scholar] [CrossRef]
- Zhang, G.; Fang, B. LogitBoost classifier for discriminating thermophilic and mesophilic proteins. J. Biotechnol. 2007, 127, 417–424. [Google Scholar] [CrossRef] [PubMed]
- Song, J.; Lu, X.; Liu, M.; Wu, X. Stratified Normalization LogitBoost for Two-Class Unbalanced Data Classification. Commun. Stat. Simul. Comput. 2011, 40, 1587–1593. [Google Scholar] [CrossRef]
- Fraz, M.M.; Remagnino, P.; Hoppe, A.; Uyyanonvara, B.; Rudnicka, A.R.; Owen, C.G.; Barman, S.A. An ensemble classification-based approach applied to retinal blood vessel segmentation. IEEE Trans. Biomed. Eng. 2012, 59, 2538–2548. [Google Scholar] [CrossRef]
- Cai, Y.-D.; Feng, K.-Y.; Lu, W.-C.; Chou, K.-C. Using LogitBoost classifier to predict protein structural classes. J. Theor. Biol. 2006, 238, 172–176. [Google Scholar] [CrossRef]
- Lutz, R.W. Logitboost with trees applied to the wcci 2006 performance prediction challenge datasets. In Proceedings of the 2006 IEEE International Joint Conference on Neural Network, Vancouver, BC, Canada, 16–21 July 2006; pp. 1657–1660. [Google Scholar]
- Pham, B.T.; Tien Bui, D.; Dholakia, M.B.; Prakash, I.; Pham, H.V. A Comparative Study of Least Square Support Vector Machines and Multiclass Alternating Decision Trees for Spatial Prediction of Rainfall-Induced Landslides in a Tropical Cyclones Area. Geotech. Geol. Eng. 2016, 34, 1807–1824. [Google Scholar] [CrossRef]
- Conforti, M.; Pascale, S.; Robustelli, G.; Sdao, F. Evaluation of prediction capability of the artificial neural networks for mapping landslide susceptibility in the Turbolo River catchment (Northern Calabria, Italy). CATENA 2014, 113, 236–250. [Google Scholar] [CrossRef]
- Ozdemir, A. Sinkhole susceptibility mapping using logistic regression in Karapınar (Konya, Turkey). Bull. Eng. Geol. Environ. 2016, 75, 681–707. [Google Scholar] [CrossRef]
- Zweig, M.H.; Campbell, G. Receiver-operating characteristic (ROC) plots: A fundamental evaluation tool in clinical medicine. Clin. Chem. 1993, 39, 561–577. [Google Scholar]
- Park, I.; Lee, S. Spatial prediction of landslide susceptibility using a decision tree approach: A case study of the Pyeongchang area, Korea. Int. J. Remote Sens. 2014, 35, 6089–6112. [Google Scholar] [CrossRef]
- Korup, O.; Stolle, A. Landslide Prediction from Machine Learning. Geol. Today 2014, 30, 26–33. [Google Scholar] [CrossRef]
- McGaughey, W.J.; Laflèche, V.; Howlett, C.; Sydor, J.L.; Campos, D.; Purchase, J.; Huynh, S. Automated, Real-Time Geohazard Assessment in Deep Underground Mines. In Proceedings of the Eighth International Conference on Deep and High Stress Mining; Wesseloo, J., Ed.; Australian Centre for Geomechanics: Perth, Australia, 2017; pp. 521–528. [Google Scholar]
- Tayfur, G.; Singh, V.P.; Moramarco, T.; Barbetta, S. Flood Hydrograph Prediction Using Machine Learning Methods. Water 2018, 10, 968. [Google Scholar] [CrossRef]
- Karpatne, A.; Ebert-Uphoff, I.; Ravela, S.; Babaie, H.A.; Kumar, V. Machine Learning for the Geosciences: Challenges and Opportunities. IEEE Trans. Knowl. Data Eng. 2018. [Google Scholar] [CrossRef]
- Canli, E.; Mergili, M.; Thiebes, B.; Glade, T. Probabilistic Landslide Ensemble Prediction Systems: Lessons to Be Learned from Hydrology. Nat. Hazards Earth Syst. Sci. 2018, 18, 2183–2202. [Google Scholar] [CrossRef]
- Mojaddadi, H.; Pradhan, B.; Nampak, H.; Ahmad, N.; Ghazali, A.H.B. Ensemble Machine-Learning-Based Geospatial Approach for Flood Risk Assessment Using Multi-Sensor Remote-Sensing Data and Gis. Geomat. Nat. Hazards Risk 2017, 8, 1080–1102. [Google Scholar] [CrossRef]
- Chen, W.; Sun, Z.; Han, J. Landslide Susceptibility Modeling Using Integrated Ensemble Weights of Evidence with Logistic Regression and Random Forest Models. Appl. Sci. 2019, 9, 171. [Google Scholar] [CrossRef]
- Bouckaert, R.R. Bayesian Network Classifiers in Weka for Version 3-5-7; The University of Waikato: Waikato, New Zealand, 2008; Volume 11, pp. 369–387. [Google Scholar]
- Mezaal, M.; Pradhan, B.; Shafri, H.; Md Yusoff, Z.; Al-Zuhairi, M. Optimized Neural Architecture for Automatic Landslide Detection from High-Resolution Airborne Laser Scanning Data. Appl. Sci. 2017, 7, 730. [Google Scholar] [CrossRef]
- Mira Geoscience. Geohazmap Workflow Earth Modelling Solutions for Mining. Montreal: Mira Geoscience; Mira Geoscience: Montreal, QC, Canada, 2007. [Google Scholar]


| Location | Structure | Elevation (m) | Mining Depth (m) | Thickness (m) and Slope of Coal Seam | Subsidence Depth (mm) | Other |
|---|---|---|---|---|---|---|
| S1 | Railway | 885 | 20–30 | 1–2 40–50° | 90 | -The coal seam is oblique to the railroad. -Shallow depth of mine -Sinkhole-type subsidence |
| S2 | Railway | 885 | 0 | – | 72 | -Progression of cavity by mining -Subsidence by limestone cavity |
| S3 | Railway | 885 | 30–50 | 1–2 20° | 329 | -Subsidence along railway |
| S4 | Railway | 885 | 40–65 | 2 20° | 223 | -Shallow depth of mine -Coal bonanza |
| S5 | Tunnel Railway | 810 | 30–260 | 105 50–70° | 65 | -The tunnel is located above the mine cavity. -Vertical cracks and leakage in tunnel |
| S6 | Road | 765 | 60–98 | 3 20° | 508 | -Residential area and elementary school -Differential subsidence |
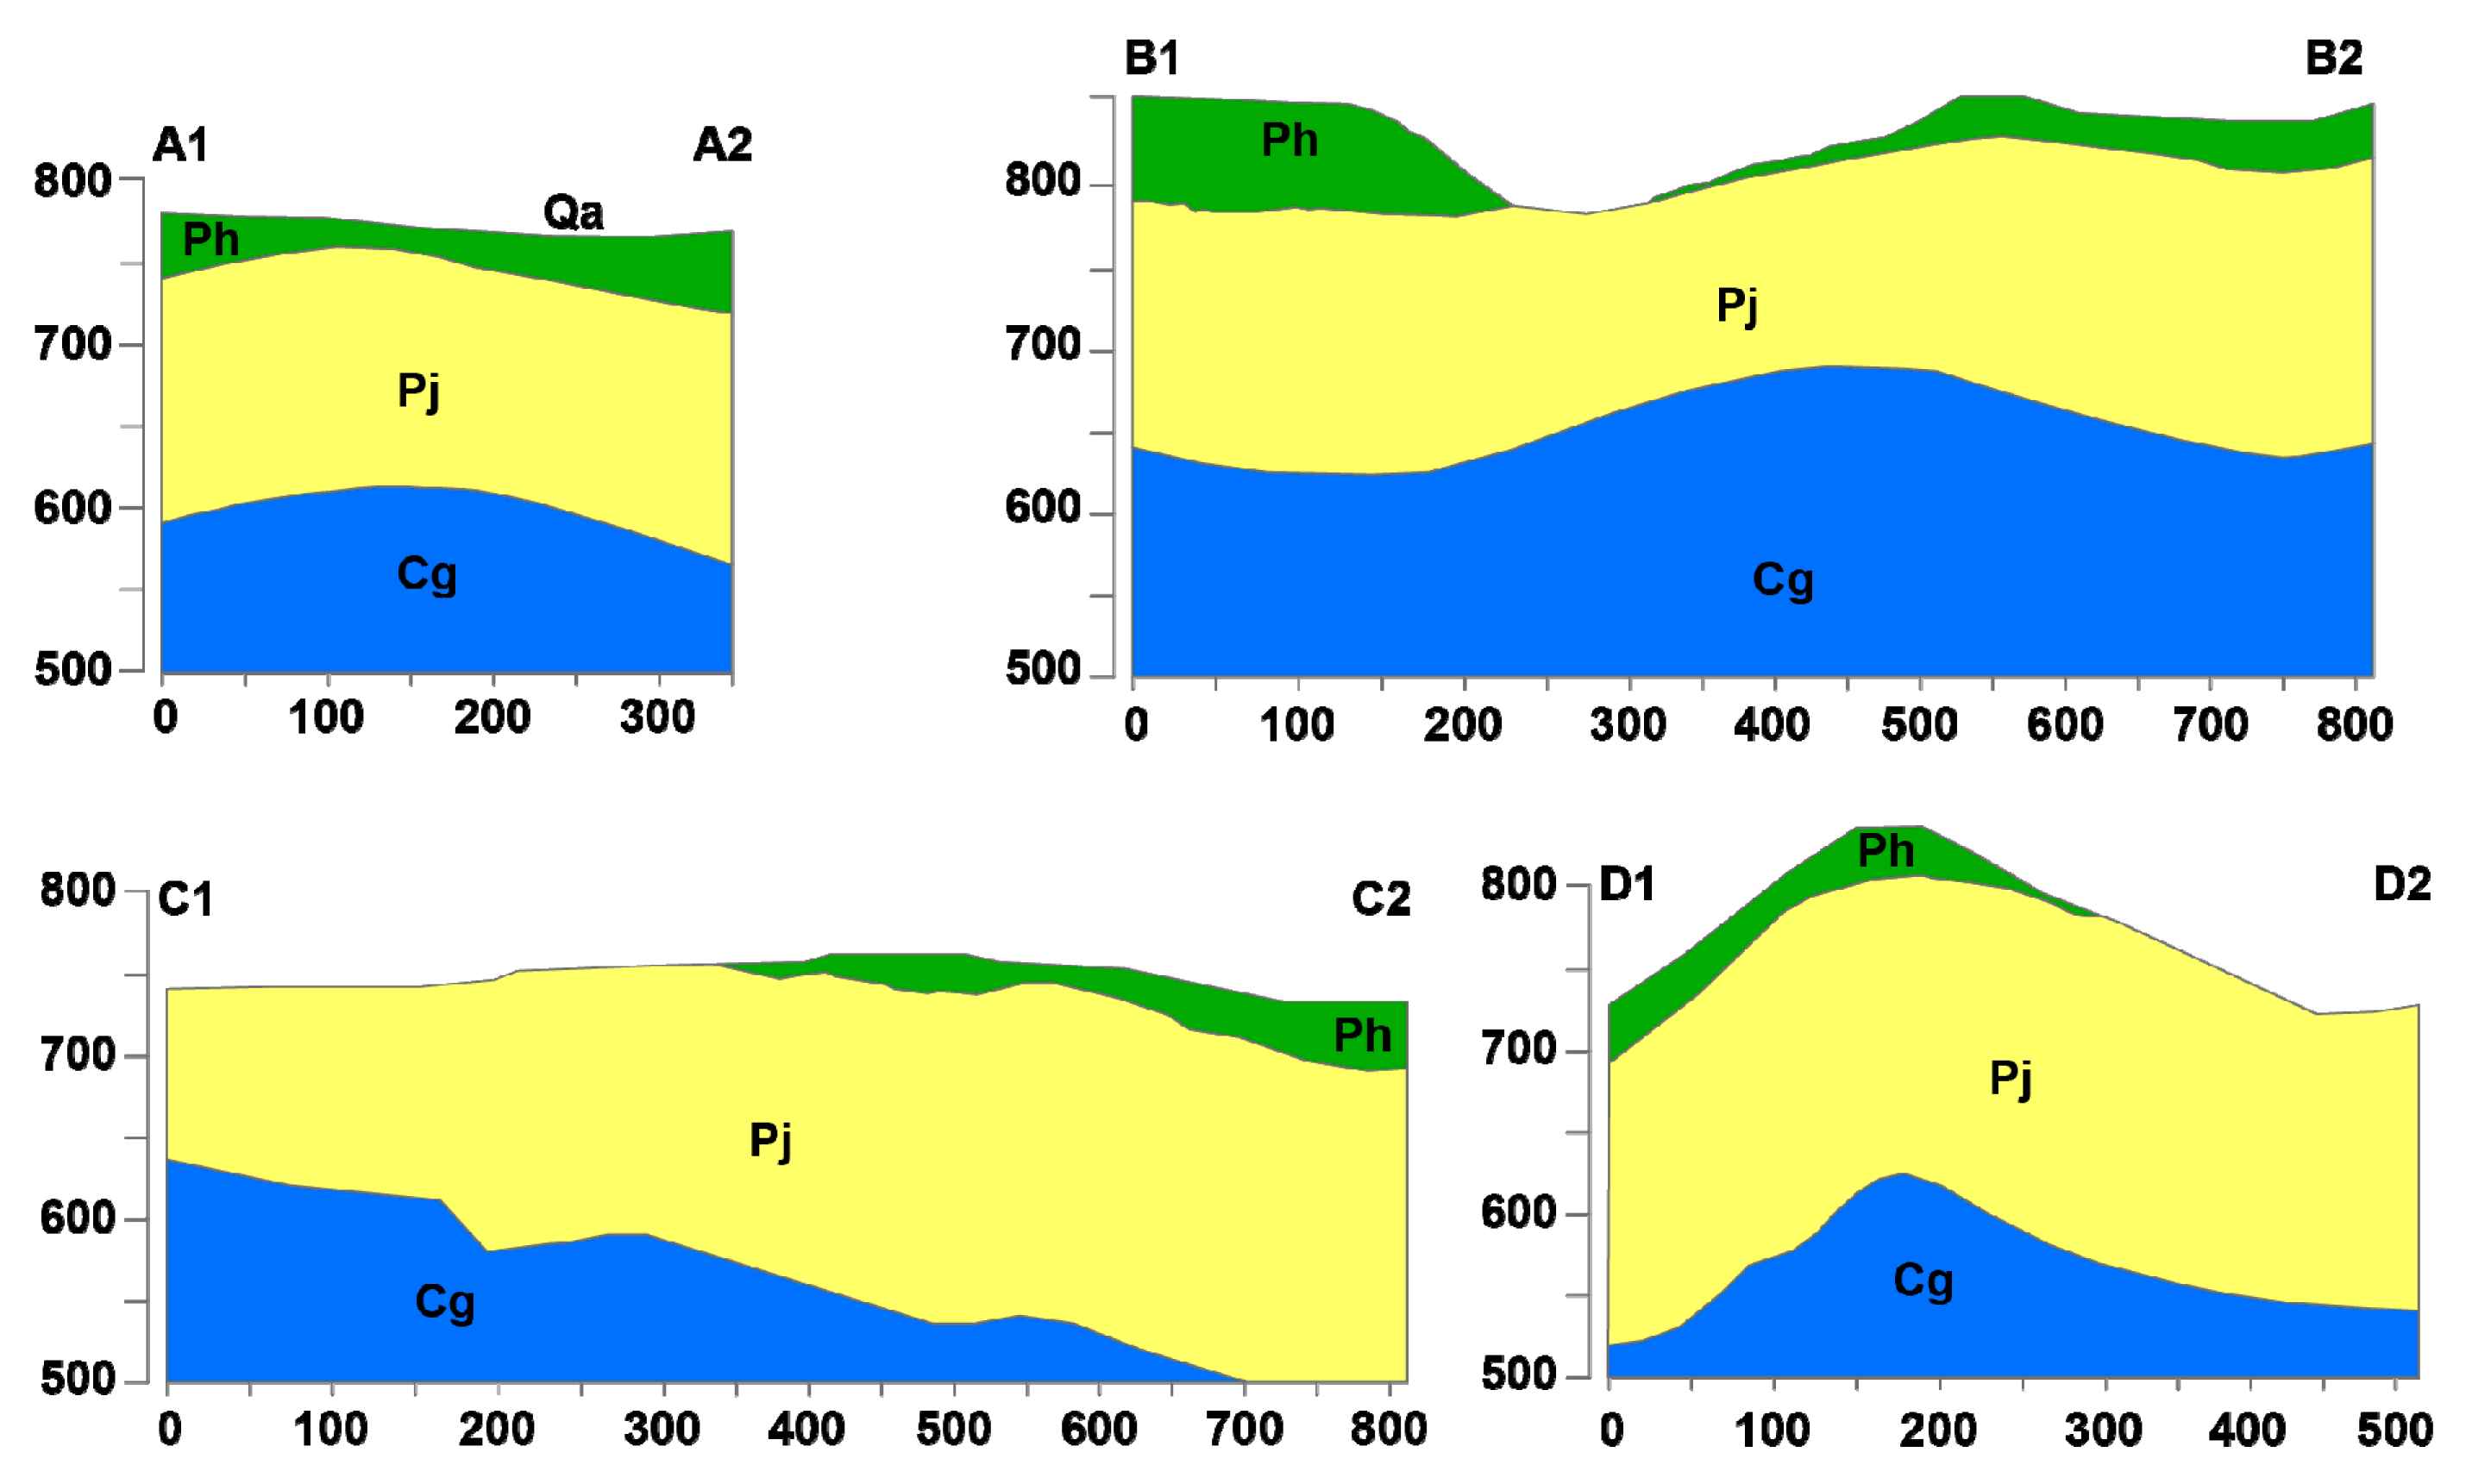
| Geological Aage | Formation | Thickness (m) | Description |
|---|---|---|---|
| Quaternary | Alluvium (Qa) | ~20 | - Gravel, sand, and clay |
| Permian | ⏝⏜⏝⏜⏝⏜⏝⏜⏝⏜⏝ | 250–350 | - Mainly milky white–light green coarse–very coarse sandstone with greenish-gray–gray shale interbeds. Intercalations of pinkish sandstone, purple shale, and grayish-green sandy shale in the upper part. The sandstone is less compact than that of the Hambaegsan Formation. |
| Dosagog (Pd) | |||
| Hambaegsan (Ph) | 70–250 | - Mainly milky white–light gray coarse sandstone with some interbeds of black shale with thickness of 2–3 m. Some pebbly sandstones occur at the base. | |
| Jangseong (Pj) | 80–150 | - Four–five cyclothems consisting of dark-gray sandstone, black shale, and coal seam. Abundant plant fossils occur in the shale above the coal seam, the most valuable anthracite bed, of the 3rd–4th cyclothem from the bottom. | |
| ⏝⏜⏝⏜⏝⏜⏝⏜⏝⏜⏝ | |||
| Carboniferous | Geumcheon (Cg) | 50–100 | - Mainly dark-gray–black shale and dark-gray fine sandstone intercalated with dark-gray limestone lenses and two to three thin coal seams |
| Manhang (Cm) | 250–300 | - Mainly purple, greenish-gray, or light-green shale and light-green–green or light-gray medium–very coarse sandstone intercalated with three–four limestone lenses. Conglomerates with a thickness of a few meters occur at the base in some places. | |
| ⏝⏜⏝⏜⏝⏜⏝⏜⏝⏜⏝ | |||
| Ordovician | Makgol (Om) | - In the upper part, gray–dark gray limestone intercalated with dolomite |
| ID | Depth of Borehole | Depth of Groundwater (m) | RMR (grade) | Permeability (grade) | Geology |
|---|---|---|---|---|---|
| B1 | 50.0 | 32.0 | 3.4 | - | Alluvium-Hambaegsan |
| B2 | 50.0 | 27.2 | 3.4 | 4.5 | Alluvium-Hambaegsan |
| B3 | 30.0 | - | 3.4 | - | Alluvium-Hambaegsan |
| B4 | 60.2 | - | 3.4 | 4 | Alluvium-Hambaegsan |
| B5 | 86.3 | - | 2.0 | - | Alluvium-Hambaegsan |
| B6 | 80.0 | - | 2.0 | 4 | Alluvium-Hambaegsan |
| B7 | 33.0 | 27.5 | - | - | Jangseong |
| B8 | 20.5 | 27.7 | - | - | Jangseong |
| B9 | 40.0 | 26.1 | - | - | Jangseong |
| B10 | 35.5 | - | 4.4 | - | Jangseong |
| B11 | 30.0 | 15.7 | - | 4 | Jangseong |
| B12 | 40.5 | 21.6 | - | 4 | Jangseong |
| B13 | 41.1 | 29.4 | - | - | Jangseong |
| B14 | 22.0 | - | 3.2 | - | Jangseong |
| B15 | 35.7 | 20.0 | - | - | Jangseong |
| B16 | 40.8 | 20.0 | - | - | Jangseong |
| B17 | 50.5 | 14.7 | - | - | Jangseong |
| B18 | 58.0 | - | 3.2 | - | Jangseong |
| B19 | 54.0 | 42.5 | 2.5 | 4 | Hambaegsan-Jangseong |
| B20 | 60.0 | - | 3.0 | - | Hambaegsan-Jangseong |
| B21 | 115.0 | - | 3.0 | - | Hambaegsan-Jangseong |
| B22 | 80.0 | - | 3.0 | - | Hambaegsan-Jangseong |
| B23 | 80.0 | - | 4.5 | - | Hambaegsan-Jangseong |
| B24 | 84.0 | - | 4.3 | - | Jangseong |
| B25 | 80.4 | 18.0 | - | - | Jangseong |
| B26 | 19.5 | 5.0 | 3.3 | - | Hambaegsan |
| B27 | 200.0 | - | 4.3 | - | Hambaegsan-Jangseong |
| B28 | 40.0 | 5.0 | 3.3 | - | Hambaegsan-Jangseong |
| B29 | 35.0 | 5.5 | 3.3 | - | Hambaegsan-Jangseong |
© 2019 by the authors. Licensee MDPI, Basel, Switzerland. This article is an open access article distributed under the terms and conditions of the Creative Commons Attribution (CC BY) license (http://creativecommons.org/licenses/by/4.0/).
Share and Cite
Oh, H.-J.; Syifa, M.; Lee, C.-W.; Lee, S. Land Subsidence Susceptibility Mapping Using Bayesian, Functional, and Meta-Ensemble Machine Learning Models. Appl. Sci. 2019, 9, 1248. https://doi.org/10.3390/app9061248
Oh H-J, Syifa M, Lee C-W, Lee S. Land Subsidence Susceptibility Mapping Using Bayesian, Functional, and Meta-Ensemble Machine Learning Models. Applied Sciences. 2019; 9(6):1248. https://doi.org/10.3390/app9061248
Chicago/Turabian StyleOh, Hyun-Joo, Mutiara Syifa, Chang-Wook Lee, and Saro Lee. 2019. "Land Subsidence Susceptibility Mapping Using Bayesian, Functional, and Meta-Ensemble Machine Learning Models" Applied Sciences 9, no. 6: 1248. https://doi.org/10.3390/app9061248
APA StyleOh, H.-J., Syifa, M., Lee, C.-W., & Lee, S. (2019). Land Subsidence Susceptibility Mapping Using Bayesian, Functional, and Meta-Ensemble Machine Learning Models. Applied Sciences, 9(6), 1248. https://doi.org/10.3390/app9061248