Article

Exploring the Optimal Safety Person–job Matching Method of Major Equipment Based on Human Reliability

School of Business, Dalian University of Technology, Panjin 124221, China
*
Author to whom correspondence should be addressed.
Appl. Sci. 2019, 9(6), 1219; https://doi.org/10.3390/app9061219
Submission received: 10 January 2019 / Revised: 15 March 2019 / Accepted: 17 March 2019 / Published: 22 March 2019
(This article belongs to the Section Computing and Artificial Intelligence)

Abstract

:
Under the background of intelligent manufacturing, this paper aims to develop a model for person–job safe matching that optimizes safety with consideration of major equipment operator competency and task complexity. Safe matching cost is minimized in the developed model and is measured by the equipment downtime, production defect rate, and operator labor costs oriented by human factors. Human reliability is calculated with the goal of best value individual competency and best admit task complexity with a hierarchical structure. The 0-1 integer programming person–job matching model minimizes the human factor safety and wage costs and satisfies the requirements of the production order, budget and operator quantity requirement. An improved genetic algorithm is designed to solve the model. The computational results of the proposed model based on a case study for a large iron and steel company evidently demonstrated its effectiveness. A new integrated model provides more realistic matches for person–job assignment.

1. Introduction

Major equipment mainly refers to intelligent manufacturing equipment for the aerospace, petroleum and petrochemical, nuclear power generation, steel metallurgy and other industries; and it is an important forces to lead the future social and economic development. The safe, reliable and cost saving operating of major equipment plays a significant role in survival in the new era of intelligent manufacturing. As new technologies start to pervade all areas of major equipment operation, major equipment operation has a higher and higher requirement for safety, reliability and money saving. As the levels of automation, informatics, robotics, sensors and mobile devices increase, it is particularly important to emphasize that human competency still remains essential for the safe operation of major equipment. In the new digital, networked and intelligent production environment, human operators face complex task environments in which the process and demand fluctuations are not well understood, failures are multidisciplinary, and the parameters are sudden and multiple and involve different technical aspects and interlinked effects. Human operators not only need to determine production rules, parameters, operation methods, and control instructions, predict equipment conditions, diagnose and troubleshoot problems, but also need to carry out inspection, commissioning, maintenance, repair tasks. In addition, new technologies are opening a new era in automation for manufacturers, in which human and machines will increasingly work side by side, it makes the operator tasks have different complexities from the traditional ones in the 5th industrial revolution. The key aspects of accurately operating of major equipment with adoption of digitization and intelligent automation safe, are how well we match human operators’ competency to tasks’ complexity with safety considerations; how we predict the first concerns of operating major equipment such as the rejection rate, downtime, and labor costs; how we address individual human operator’s strengths and weaknesses; and especially, how we minimize safety costs by matching human operators to tasks.
Many serious accidents occur in major equipment operations. Most of the accidents are caused by improper operation, and most improper operations are caused by improper person–job matches. To solve the challenge of an enterprise’s inability to consider both safe production and economic benefits, the process of major equipment production and operation is very dangerous. Taking large-scale petrochemical equipment as an example, the production relies on high-risk units of equipment. The production reaction involves heat transfer, storage, separation, and fluid transfer. Petrochemical equipment stores or uses high-energy, toxic, biologically hazardous, even radioactive materials. The production process is accompanied by violent chemical reactions such as chlorination, ammonization, and oxidative polymerization. There are lots of serious accidents happened during the major equipment production. For example, the aluminum dust explosion accident of the Kunshan Metal Products Factory in 2014 caused 97 deaths and 163 injuries, and the direct economic loss was 351 million yuan [1]. Safety accidents that involve major equipment are largely caused by lower competence and higher task complexity. When the competency of the human operator does not match the complexity of the task, operation errors, waste output, unplanned emergency shutdowns, and even major accidents occur. Therefore, under the dual consideration of task complexity and workers’ competence, which is valued by psychological and behavioral competence levels, the “person–job” matching method for the safe operation of major equipment is a challenging and urgent problem that should be solved in practice.
Safety means being safe from hurt, injury, or loss [2]. Reliable matching [3] means that the matching can guarantee safety, reliability and cost savings. Person–job matching refers to the allocation of the right person to the right job based on an individual’s competence strengths and weaknesses and job’s complexities. Person–job reliable matching refers to the person–job assignment that can guarantee the completion of the functions of major equipment production and operation under specified conditions within a specified time. Decisions concerning person–job matching in practice are made from qualitative methods through manuals or quantitative methods through mathematical modeling. The benefit of the manual method is that the match is based on individual behavior and psychology characteristics, but the disadvantage of the manual method is that it can only solve the small-scale matching problem. The quantitative matching method is roughly divided into three types for different premises. First, mathematical optimization methods are suitable for the case of a known mechanism, and the premise is that the system parameters are known and the assumptions are strict. Second, the artificial intelligence methods rely on expert systems, they are suitable for situations in which mathematical models cannot be exactly established, but they require mastery of much experience and knowledge. Third, the data-driven empirical approach obtains the psychological cause-effect function mechanism by mining the investigation data, however, this method cannot give matches. Overall, we identify the following research gaps: mathematical optimization methods have the limitation of unrealistic assumptions and inaccurate parameters, but it can give specific assignment plans. Empirical methods can guarantee the premises are right, but cannot provide to the executive specific assignment solutions for the enterprises to the executive. Our approach combines mathematical operation models with psychology empirical searches to take advantage of their complementary strengths. The optimization model supply the matches to safety person–job matching method of major equipment based on the empirical result of specific industrial human reliability. The empirical results provide the cause and effect of human reliability and operation safely. It provides competence and task complexity mechanisms to characterize major equipment and tune optimization parameter values. The combination can provide a solid foundation on which to determine the parameters determination and give a practical assignment solution. Competence and complexity measure models are key foundations for the successful application of matching solutions. It is necessary to combine the empirical study of psychological and behavioral analysis not only with an optimization modeling for quantitative analysis but also with integrating multidisciplinary theory and methods, the empirical-mathematical modelling approach can not only give person–job matches but also to solve the major equipment safety, reliability and cost paradoxes.
Furthermore, people’s psychology and behavior entail different competence strengths and weaknesses, and different tasks have different complexity characteristics. However, to our best knowledge, existing matching methods have not paid attention to the different competence and complexity of both matching subjects. It is contrary to the fact that every individual is different, they all function differently based on their competitive strengths and weaknesses. If mathematical modeling ignores the differences among individuals, the solutions will not make improve safety, reliability and cost saving. Fortunately, Eastwick et al. (2019) propose the research of best practices for testing the predictive validity of matching partner preference [4]. Musharrafa et al. (2018) introduced the concept of individual differentiation in human factor analysis and identified the vulnerable features of the analyzed objects based on the Bayesian network (BN) model [5]. However, the BN model cannot identify weaknesses. Furthermore, considering the impact of negative evaluations on human reliability, it is necessary to positively recognize the strengths and weaknesses. Therefore, we need to match jobs and operators according to the evaluation results of maximizing task complexity and operator competence.
In summary, the key contributions are 3 folds: (1) Matching modeling: maximizing operator competence will inevitably be welcomed by operators and mobilize their enthusiasm for work. Maximizing task complexity is a way to be cautious about safety in production and reliable operations. We introduce strengths and weaknesses of each object’s mathematical formula into major equipment downtime loss and loss on a defective product with the task complexity of different jobs. (2) Model solving method: this research gives an improved genetic algorithm method for solving the above nonlinear matching models. The algorithm integrates different strategies for genetic operators, crossover and mutation. The computational result shows that the integration of more strategies in a genetic framework leads to better results. Moreover, results are quite comparable to those obtained by the enterprise actual job matching situation. (3) Academic thinking: Through multidisciplinary crossover and changes in the concept of safety management, new ideas and methods are proposed to solve the person–job matching problems associated with the safe and reliable operation of major equipment. We solve complex socio-technical system person–job matching problems through by combining behavioral science and optimization and thus contribute to the reliable, economic and balanced development of major equipment operation. This paper is structured as follows. Section 1 presents the introduction; Section 2 describes the parameter determination method of the person–job safe matching model for major equipment operation. Section 3 constructs the safe person–job matching decision model and genetic algorithm according to major equipment operation characteristics. Section 4 presents an analysis of the example and a discussion of the results with a competency and complexity indicator system based on the empirical findings. Finally, the conclusions and subsequent research directions of this study are given.

2. Literature Review

2.1. Safe Matching Decision-Making

The 2012 Nobel Prize in Economics was awarded for the theory of stable matching and its market design practice, which emphasizes the important theoretical value of matching research. Based on the concept of stable assignment, existence and Pareto optimality proposed by Gale and Shapley [6], matching theories have been vigorously developed. Management science focuses mainly on the research concerning mathematical modeling, operation optimization, fuzzy mathematics, stochastic optimization, game theory, simulation experiments, numerical analysis, multiobjective decision-making and optimization plans. The research method is used to scientifically and systematically construct a bilateral matching model based on stability and satisfaction, and according to different indicator information, the matching model is classified into interaction matching, incomplete information matching, fuzzy matching, etc. Management science have studied random matching [7], many-to-many unilateral matching [8], marriage matching [9], integer-oriented graph matching [10], multiobjective matching based on triangular inequalities [11], stable matching of joint responses [12], graph matching [13], preference order matching, interval preference fuzzy set matching, the matching of psychological behavior based on prospect theory, and multi-index bilateral matching that considers the dissatisfaction of both subjects [14], the types of problems that consider the dynamic matching of preference information, fair matching, the matching of the largest assigned pair, perfect matching, intuitionistic fuzzy matching that considers willingness, interactive matching, incomplete information matching, etc. The scholars of organizational behavior focus mainly on the mechanism of matching the individual characteristics of employees, such as skills, knowledge and abilities to job the requirements. The factors usually considered include satisfaction, performance and human capital. Economics scholars have mainly achieved the design of the means for labor market person–job matching under different guidance based on game theory and model algorithms in contexts such as intern–hospital matching and student–university matching.
In terms of matching algorithms, the bilateral matching algorithm has been booming since it started with the deferred acceptance algorithm. The algorithms for solving bilateral matching can be divided into two types: a precise algorithm and an intelligent algorithm. Precise algorithms include delay acceptance algorithms and extension algorithms, enumeration methods, dynamic programming algorithms, national intern matching program algorithms and point pattern matching algorithms. In terms of intelligent algorithms, the heuristic algorithm has been a recent research focus, and it can realize precise and intelligent solutions. This algorithm can be roughly classified into genetic algorithms, tabu searches, particle swarm optimization algorithms, parameter algorithms and ant colony algorithms, deferred acceptance algorithms, first transaction loop algorithms, topology algorithms, first-served algorithms, etc. [15]. Furthermore, there has been a rapid growth of the use of genetic algorithms in the various areas of management. That there are only a handful of matching problem areas to which genetic algorithms have been applied as the solution approach. For example, Gopalakrishnan and Kosanovic (2015) solved an operational planning problem for combined heat and power plants through genetic algorithms and mixed 0–1 nonlinear programming [16]. Touat et al. (2017) constructed a hybridization of genetic algorithms and fuzzy logic for the single-machine scheduling with flexible maintenance problem under human resource constraints [17]. Metawa et al. (2017) proposed a genetic algorithm based model for optimizing bank lending decisions [18]. Zhang and Wong (2015) gave an object-coding genetic algorithm for integrated process planning and scheduling [19]. Painton and Campbell (1995) analyzed genetic algorithms in the optimization of system reliability [20]. Routledge et al. (2017) studied resource allocation for the LTE uplink based on genetic algorithms in mixed traffic environments [21]. Faia et al. (2018) studied genetic algorithms for portfolio optimization with a weighted sum approach [22]. Thus, it can be seen that genetic algorithms are widely used. Especially, in the assignment problem, efficient genetic algorithms for optimal assignment of tasks to teams of agents. We show that if the size of the problem is large, then standard crossover operators cannot efficiently find near-optimal solutions within a reasonable time. In general, the efficiency of the genetic algorithm depends on the choice of genetic operators (selection, crossover, and mutation) and the associated parameters [23]. Based on the major equipment person–job safe matching model characteristics, we use genetic algorithms to solve the matching model. The advantages of applying genetic algorithms are the following. We search parallels from a population of points. They can avoid being trapped in local optimally solutions. We use a fitness score, which is obtained from the major equipment human factors-oriented safety cost function, without other derivative or auxiliary information. Genetic algorithms work on the chromosome, which is an encoded version of the assignment solution’s parameters such as the person–job assignment caused rejection rate, downtime and wage costs. Safe person–job matching is based on the quantitative identification of individual strengths and weaknesses.
Human reliability is critical to ensuring the reliability of production and the safe operation of major equipment. It should be noted that the human factor perspective and the differentiation of individual characteristics have emerged as part of the matching decision. The preference matching decision-making method reflects the idea of matching according to the advantages of the matched resources and tasks. Problems of bilateral matching that considers psychological behavior has received attention. Most of the studies focus on the universal discipline of human psychology and behavior. Therefore, individual differences in psychological and behavioral strengths and weaknesses have not yet been considered. Different jobs have their own unique complexities which can cause dangers. It is thus necessary not only to introduce human-related reliability into the safety matching decision concerning major equipment but also to further consider the individual differences that affect human reliability in the process of job matching to obtain the person-job matching solutions with the lowest cost. This perspective transforms the concept of safety management through multidisciplinary interaction, we solve the matching problems concerning the safe and reliable operation of major equipment with combining behavioral science with mathematical optimization modeling. Such a perspective contributes to the reliable, economic and balanced development of major equipment manufacturing and provides support for the person–job matching method for the safe and reliable operation of major equipment.

2.2. Human Reliability Research

Human reliability is one of the important factors to ensure the safe and reliable operation of the industrial system [24]. Human reliability refers to people’s ability to complete specified tasks without error under specified times and conditions [25]. Human reliability is studied from the two perspectives of the person and the tasks [26]. The studies from operators’ perspective are mainly divided into two categories: first, mechanism of human error detection and diagnosis and decision-making under emergency conditions [27], which concerns the influencing factors and the human factor reliability model. Second, the methods for the analysis and prediction of human error [28]. Representative achievements of such research include the finding that human error can be due to perception errors concerning environmental information [29]. The brain makes a wrong decision when it senses and processes information, and an intended action is not completed [30]. The physiological aspects of human error refer to the limits of human ability, including human perception, feelings, reaction speed, physical strength, and biological rhythm, and human psychological aspects refer to temperament, character, emotions, and attention. Ribeiro and Sousa et al. (2016) proposed a human reliability analysis model that combines the features related to facility conditions to determine the probability of human error in the probabilistic safety analysis of a process plant and to prove that the human factor is the leading cause of accidents [31]. Erga et al. (2016) studied the framework for the classification and analysis of human factors related to accidents and events [32]. The main indicators involve task complexity, such as multiple faults occur simultaneously, multiple devices cannot be used at the same time, the memory requirements are large, the interdependence between devices is unclear, an indicator is misleading or missing, a single fault masks the symptoms of other faults, and the scale and scope of the task are large. There are many steps in the completion of a specific task. The relationship between elements and tasks is complex, and the task is dynamic and uncertain. There are many information interferences, the task structure is complex, the numerical control system is complicated, the completion time is tight, the knowledge width and depth are high, the human-machine interface is complex, the factors are interdependent, the tasks are unstandardized and unconventional, and there is a lack of understanding of tasks and difficulty in operation [33].
Human reliability analysis methods include mainly human error rate prediction technology, the operator action tree, accident initiation and evolution analysis, the successful likelihood index, pairwise comparisons, social-technical-human factor reliability analysis, maintenance person behavior simulations, the multisequence failure model, the cognitive event tree system, cognitive reliability and error analysis, fuzzy set analysis [34] and comprehensive evaluations [35]. A representative method is Zwirglmaier et al. (2016) Bayesian network(BN) model that uses additional and qualitative causal paths to provide traceability, and that combines expert probabilities with information from operator performance databases such as the scenario authoring, characterization, and debriefing application to quantify the model and enrich the quantitative approach to rein the last decade, Bayesian networks (BNs) have been identified as a powerful tool for human reliability analysis [36]. Qingji Zhou et al. (2018) constructed a cognitive reliability and error analysis methods model for human reliability analysis based on fuzzy Bayesian networks [37]. Xinyang Deng and Wen Jiang (2018) introduced a dependency-based and human error-based evidence network approach to the belief rule and uncertainty measurement [38]. Hu-Chen Liu et al. (2018) proposed a large-scale group decision-making method based on dependency-based human reliability [39]. In a word, it is necessary to deepen and refine the human factors of the major equipment operators with the new era of The Fifth Industrial Revolution, with the specific characteristics of major equipment safety operation.
Overall, based on the empirical research method, the competence and job complexity indicator system are studied according to the psychology and behavioral factors of key equipment safety operation. Then, we identify and evaluate each individual competence and complexity according to individual strengths and weaknesses. Second, combining strengths, weaknesses of each individual and job complexity, we build an assignment model with the purpose of cost minimization, which has the function of ensuring safety and making the best use of competence. Third, the person–job matching model is a non-convex combination optimization model. It is difficult to get an optimal solution by traditional optimization algorithms. Therefore, this paper uses a heuristic algorithm to solve the model. The genetic algorithm codes the operators, and the natural order of the number to represent the coding of the job. The simple coding rule completes the representation of the decision variables, reducing the number of symbols and improves the efficiency of the algorithm. The method of elite strategy and proportional selection is used to select individuals, which ensures the convergence of the algorithm. Evolutionary reversal operator effectively improves the local search ability of genetic algorithm. The algorithm can find an optimal matching scheme in a relatively short time. The research not only puts psychology and behavior into the optimization model but also data mines the strengths and weaknesses. It presents a new way to introduce the characteristics of strengths and weakness into the matching problem. It can help major equipment operation enterprises to balance safety and economic benefits while developing in a safe and efficient way.

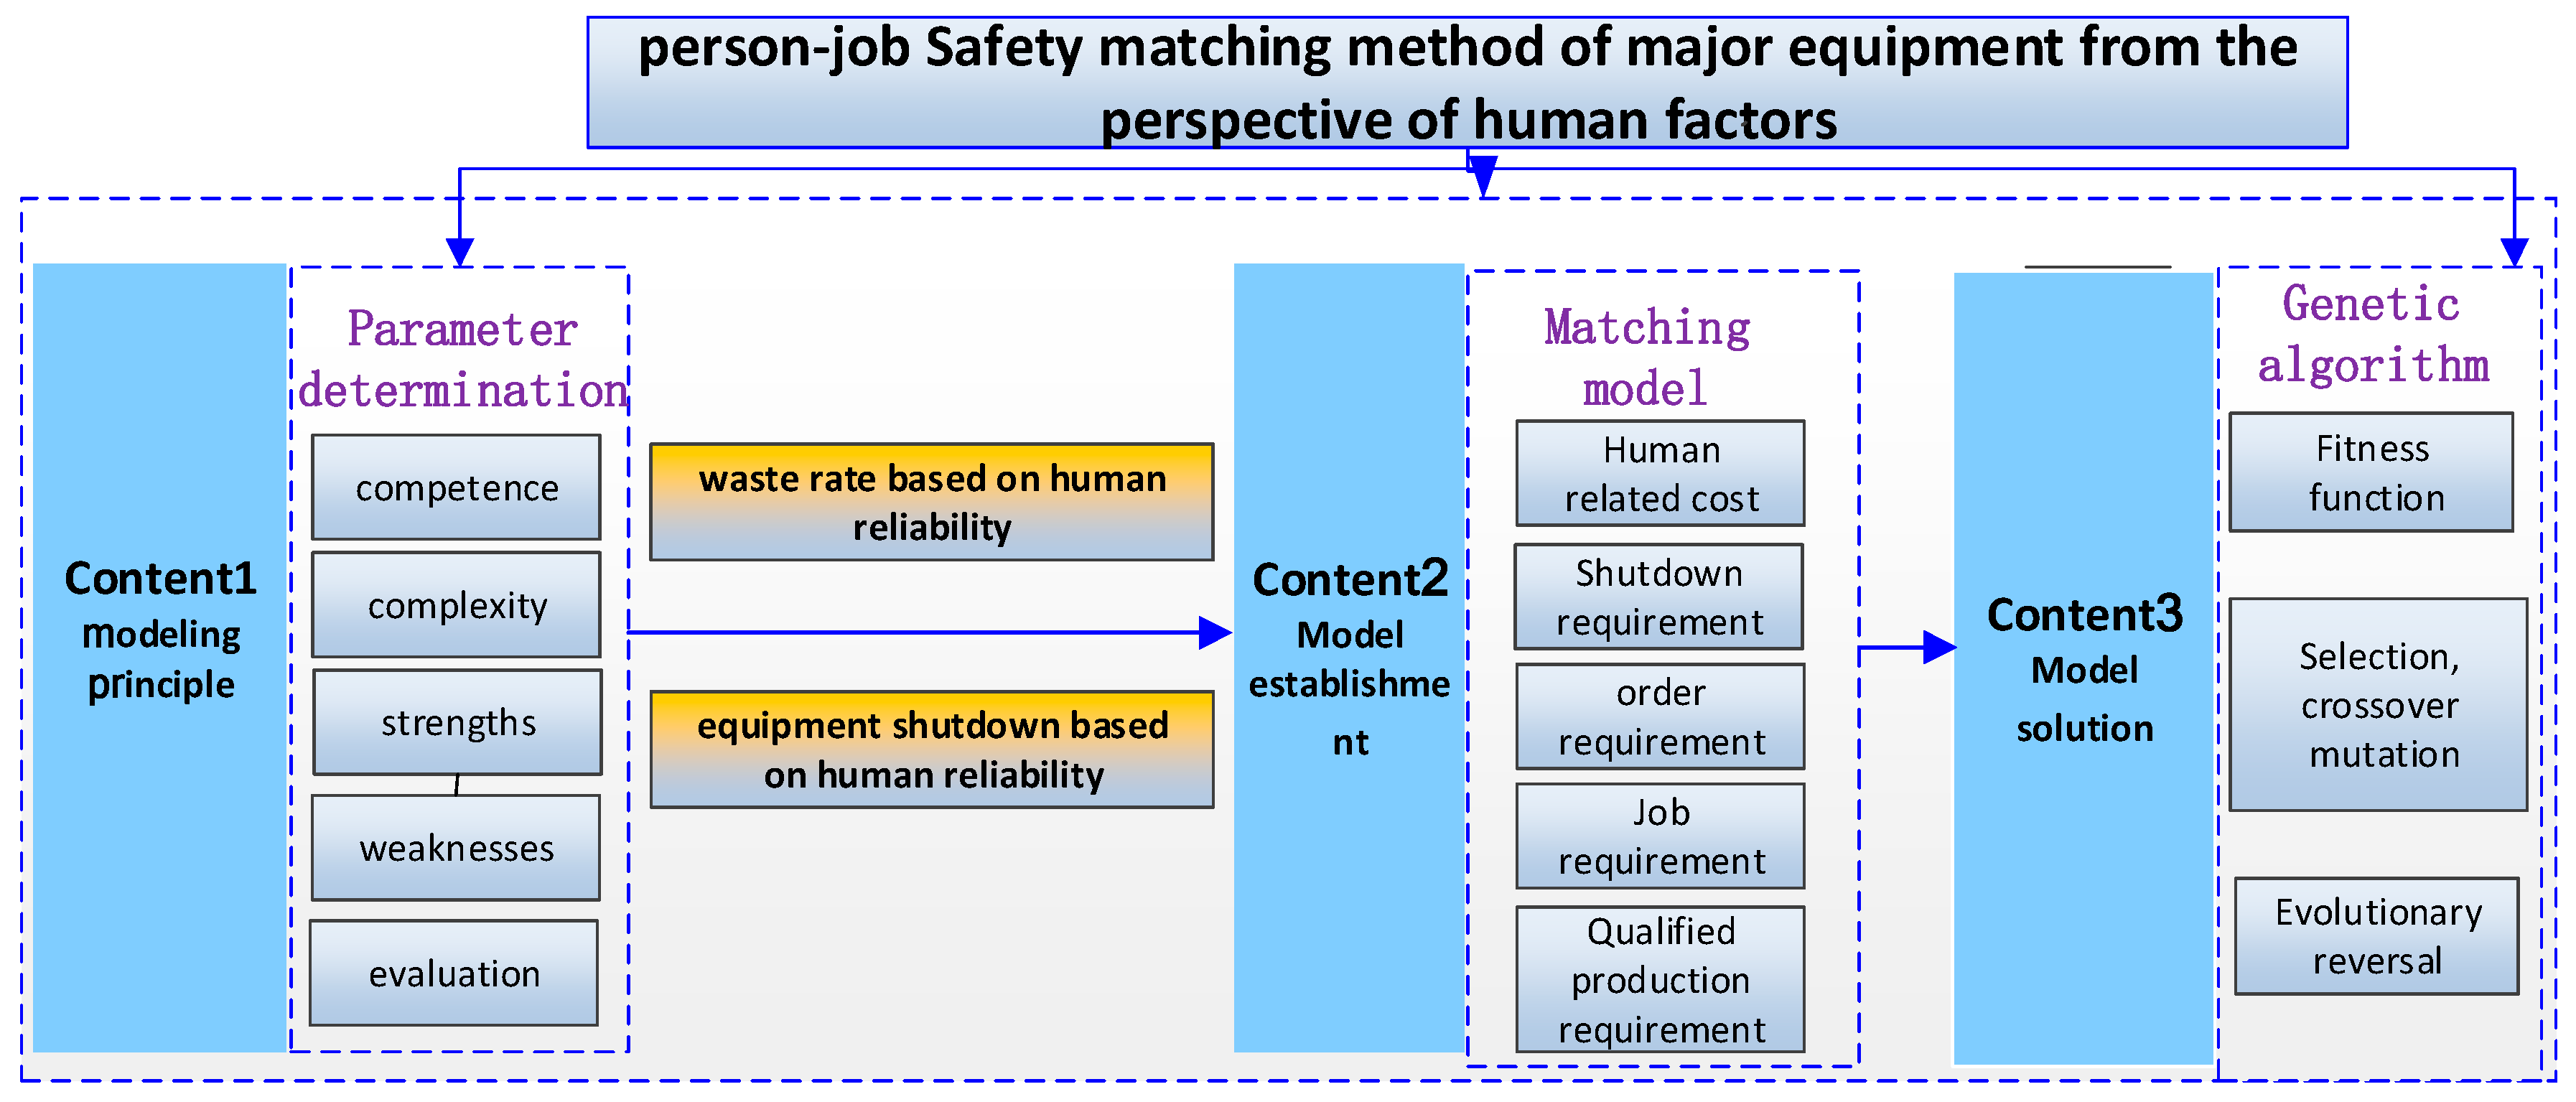
3. The Model of Safe Person–job Matching

3.1. Definition of the Variables

The research ideas are shown in Figure 1. According to Figure 1, based on the psychological and behavioral reliability of operators competence and job complexity factors, we establish relationships between each person–job match and major equipment emergency downtime, production rejection rate and labor cost according to the evaluation result base on strengths and weaknesses. Based on the cause and effect relationships, a person–job matching model is built with consideration of both minimize cost and many production operation management needs. We use the empirical research method of exploratory factor analysis and confirmatory factor analysis to build the competency model and complexity model of major equipment safety operation. In order to reflect the universality of this matching method, we put the competency and complexity of major equipment operation empirical study in the application parts.
The following Table 1 presents the definitions of the model variables:

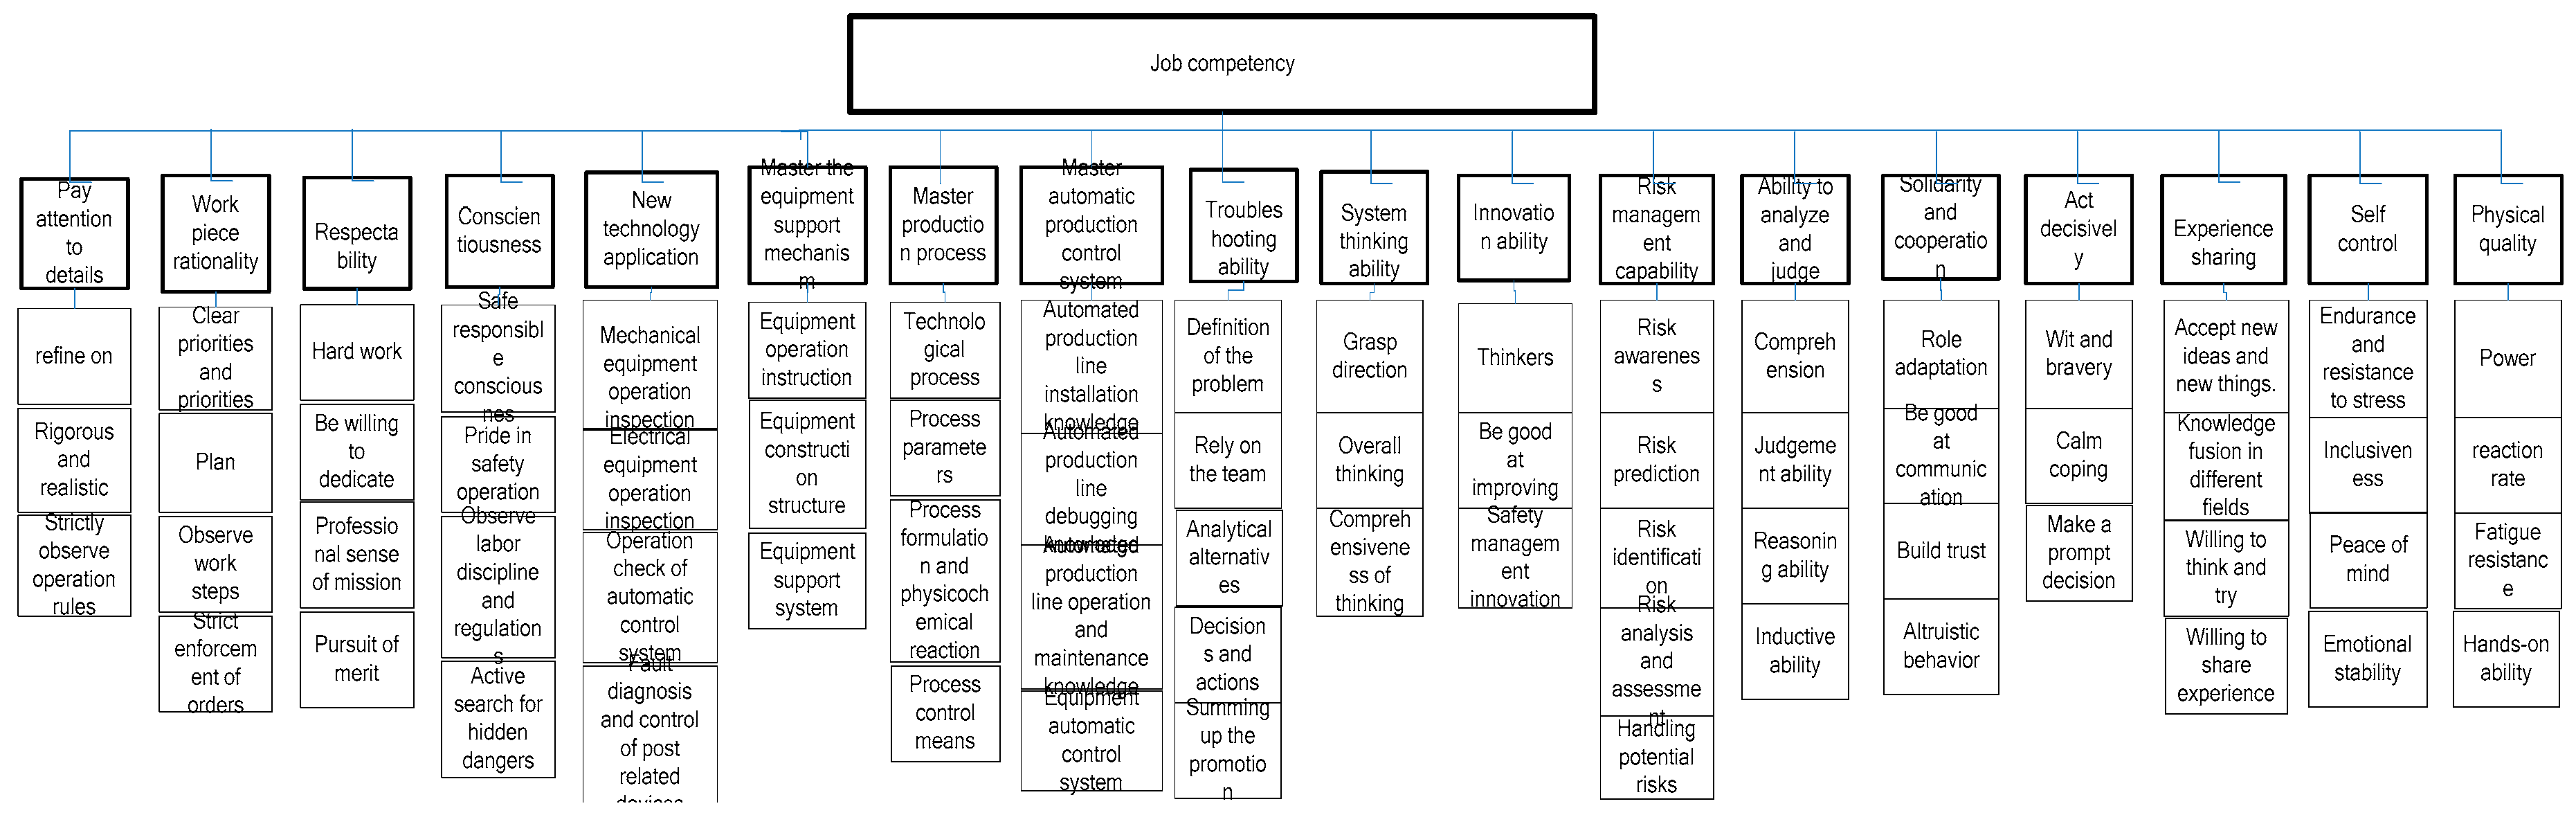
3.2. Matching Modelling Based on Competency and Complexity Strengths and Weaknesses

(1) Method for identifying strengths and weaknesses of competence and complexity [40,41]
As the complexity strengths and weaknesses identification method is the same as the competitive strengths and weaknesses identification model, we just built the complexity identification mathematical model as the example. Competency strengths and weaknesses identification model is all the same as competence identification model. Generally speaking, there are three layers in the competence measurement model. The three layers contain the basic layer, the middle layer and the top layer. The first step is to obtain the value of each basic indicator by expert opinions. The value of the middle layer indicator is calculated by the integration of basic indicator belonged to it. With a benchmarking guidance, with the goal of seeking the smallest distance from the ideal value, the weight of each middle layer factor is calculated by Equation (1). Since the larger the weight, the smaller distance between the basic indicator true value and ideal value, we define the weight as the mathematical expression of strengths and weaknesses.
Strengths and weaknesses in basic layers under t-th middle layer is identified by Equation (1):
d t ( i ) 2 λ   min ( x ( t , j ) x ( t , j ) ( i , k ) ) = j = 1 P t ( λ ( t , j ) ( i , k ) ) 2 ( x ( t , j ) x ( t , j ) ( i , k ) ) 2 s . t . :   j = 1 P t λ ( t , j ) ( i , k ) = 1   λ ( t , j ) ( i , k ) 0   j = 1 , 2 , , P t
where d t ( i , k ) 2 ( x ( t , j ) x ( t , j ) ( i , k ) ) represents the distance between the expert evaluation value x ( t , j ) ( i , k ) and its ideal value λ ( t , j ) ( i , k ) . The optimal solution of Model (1) is the index weight that makes the smallest distance function preferable, and the weight reflects the difference in the strength of each indicator.
The identification method for the highest-level factor strengths and weaknesses indicators. we obtain the indicator values of each middle layer according to the linear weighted evaluation method y t = j = 1 P t ( λ ( t , j ) ( i , k ) ) 2 ( x ( t , j ) x ( t , j ) ( i , k ) ) 2 . If a basic indicator of a middle layer indicator reaches the ideal value, the middle layer index reaches the ideal value. Therefore, the ideal value of the middle layer indicator is 0. Equation (2) is for strengths and weaknesses identification of middle layer factor.
d t ( i , k ) 2 μ   min ( y t y t ( i , k ) ) = d t ( i , k ) 2 ( 0 y t ( i , k ) ) = t = 1 m ( μ t ( i , k ) ) 2 j = 1 P t ( λ ( t , j ) ( i , k ) ) 2 ( x ( t , j ) x ( t , j ) ( i , k ) ) 2 s . t . :   t = 1 m μ t ( i , k ) = 1                              μ t ( i , k ) 0   t = 1 , 2 , , m .
The optimal solution μ t ( i , k ) of Equation (2) represents the strengths or weaknesses value of each middle-level factor.
The solutions of Equations (1) and (2) are the following.
According to the Kuhn-Tucker optimality principle (the K-T point), the solution of Equation (1) is the following:
① When there is an ideal value x ( t , j ) in x ( t , j ) ( i , k ) , the weight coefficient that corresponds to the indicator is 1. If there is more than one ideal value, the weighting coefficient value of the indicator that corresponds to the measurement indicator that does not reach the ideal value averages 0.
② When the indicator of the ideal value x ( t , j ) is not reached in x ( t , j ) ( i , k ) , the weight coefficient of each indicator is model (3):
1 j = 1 P t 1 ( x ( t , j ) x ( t , j ) ( i , k ) ) 2 ( x ( t , j ) x ( t , j ) ( i , k ) ) 2   .
Thus, the solution of Equation (2) can be obtained. Through the simple averaging method, the group recognition result of the structure of the strengths and weaknesses of the analyzed object is obtained.
Evaluation method based on strengths and weaknesses
The layer-by-layer recursive method is used to obtain the comprehensive value of the upper layer indicator.
① The comprehensive evaluation method for the middle layer indicators is as follows:
D k = 1 n i = 1 n d ik ( x ¯ k , x ¯ ) = 1 n i = 1 n j = 1 m ( ω ij ) 2 ( x j x kj ) 2   k = 1 , 2 , , n .
② The comprehensive evaluation method for the highest level indicators is as follows:
  G k = 1 n i = 1 n j = 1 m ( μ ij ) 2 ( D k D kj ) 2   k = 1 , 2 , , n .  
The above method is applied to the comprehensive analysis of job complexity and the operator’s psychological and behavioral competency. The evaluation values are expressed as z g and z r .
(2) The major equipment person–job matching model
1) Construction of the objective function
The safety cost is measured from the aspects of downtime and the reliability of the start-up operation.
① unplanned downtime safety cost.
The loss of human downtime is calculated as follows:
p × q × 12 × i = 1 m j = 1 n t ij x ij
② unreliable operation safety cost.
Human unreliability will directly impact the rate of scrap [42]. The scrap rate is determined by the factor of human error factor caused by the ability of the operators responsible for equipment maintenance and repair and the complexity of the job. We assume that scrap products go to the market at a certain price.
The non-qualified rate of the j-th person in the i-th job is:
θ i × r = 1 z ( 1 n j = 1 n ω jr ) 2 ( a r a rj ) 2 k = 1 l ω ki b ki   .
Thus, the cost of human waste is:
q × ( p   p ) ( T p T f 12 × i = 1 m j = 1 n t ij x ij ) × ( i = 1 m j = 1 n θ i × r = 1 z ( 1 n j = 1 n ω jr ) 2 ( a r a rj ) 2 k = 1 l ω ki b ki x ij ) .
③ Labor cost
The labor cost includes the fixed salary and variable salary paid by the enterprise to the operators. The variable salary depends on the difference between the downtime of the equipment failure assessment and the actual downtime of the job. The value is positive, and the enterprise pays the employee a bonus, while operators are required to pay a fine. The labor cost is as follows:
12 i = 1 m j = 1 n g ij x ij + δ × 12 × i = 1 m i = 1 n ( t i t ij ) x ij .
2) Constraints:
① Only one product is produced, production is demand driven, and the rigid production is determined by the annual order quantity.
q × ( T p T f 12 i = 1 m j = 1 n t ij x ij ) × ( 1 i = 1 m j = 1 n θ i × r = 1 z ( 1 n j = 1 n ω jr ) 2 ( a r a rj ) 2 k = 1 l ω ki b ki x ij ) 1 m M .
② The amount of waste produced cannot exceed the maximum amount of scrap specified by the enterprise:
q × ( T p T f 12 i = 1 m j = 1 n t ij x ij ) × ( 1 i = 1 m j = 1 n θ i × r = 1 z ( 1 n j = 1 n ω jr ) 2 ( a r a rj ) 2 k = 1 l ω ki b ki x ij ) 1 m B .  
③ The total labor cost cannot exceed the upper limit specified by the enterprise:
12 × i = 1 m j = 1 n g ij x ij + δ × 12 × i = 1 m j = 1 n ( t i t ij ) x ij C .
④ The total annual unplanned downtime cannot exceed the enterprise’s maximum limit:
12 × i = 1 m j = 1 n t ij x ij A .
⑤ In terms of operator assignment constraints, there are m operators in n jobs and m = n; that is, operators redundancy and operator shortages are not considered.
i = 1 m x ij = 1   j = 1 , 2 , , n
j = 1 n x ij = 1   i = 1 , 2 , , m
  x ij { 0 , 1 } .
According to the above analysis, the overall person–job matching optimization model for safety is expressed as follows:
= { p × q × 12 × i = 1 m j = 1 n t ij x ij + q × ( p   p ) ( T p T f 12 × i = 1 m j = 1 n t ij x ij ) × ( i = 1 m j = 1 n θ i × r = 1 z ( 1 n j = 1 n ω jr ) 2 ( a r a rj ) 2 k = 1 l ω ki b ki x ij ) 1 m + 12 i = 1 m j = 1 n g ij x ij + δ × 12 × i = 1 m i = 1 n ( t i t ij ) x ij }
s.t.
q × ( T p T f 12 i = 1 m j = 1 n t ij x ij ) × ( 1 i = 1 m j = 1 n θ i × r = 1 z ( 1 n j = 1 n ω jr ) 2 ( a r a rj ) 2 k = 1 l ω ki b ki x ij ) 1 m M
q × ( T p T f 12 i = 1 m j = 1 n t ij x ij ) × ( 1 i = 1 m j = 1 n θ i × r = 1 z ( 1 n j = 1 n ω jr ) 2 ( a r a rj ) 2 k = 1 l ω ki b ki x ij ) 1 m B
12 × i = 1 m j = 1 n g ij x ij + δ × 12 × i = 1 m j = 1 n ( t i t ij ) x ij C
12 × i = 1 m j = 1 n t ij x ij A
i = 1 m x ij = 1      j = 1 , 2 , , n
j = 1 n x ij = 1      i = 1 , 2 , , m
x ij { 0 , 1 } .

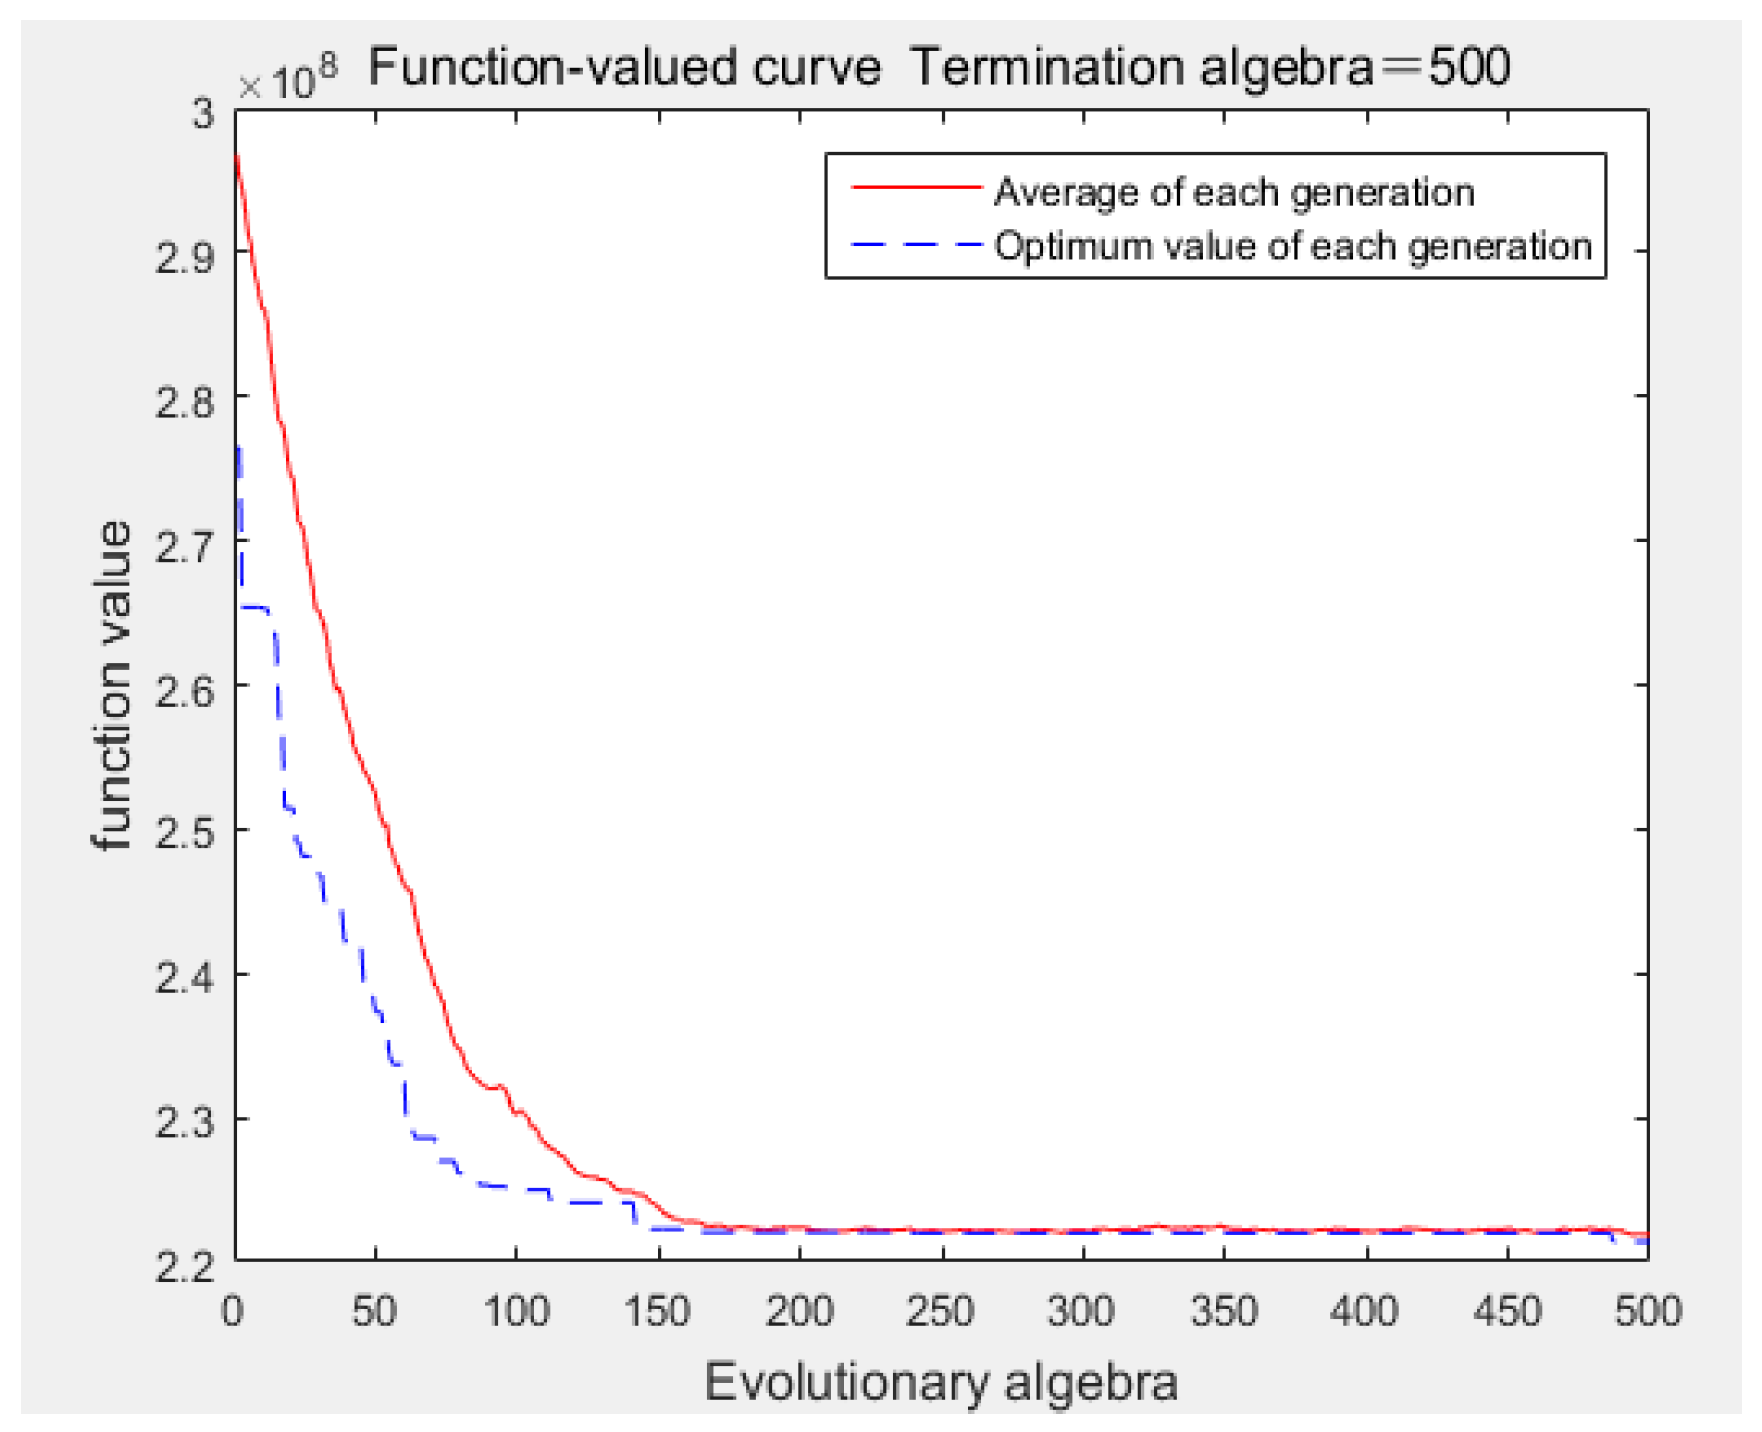
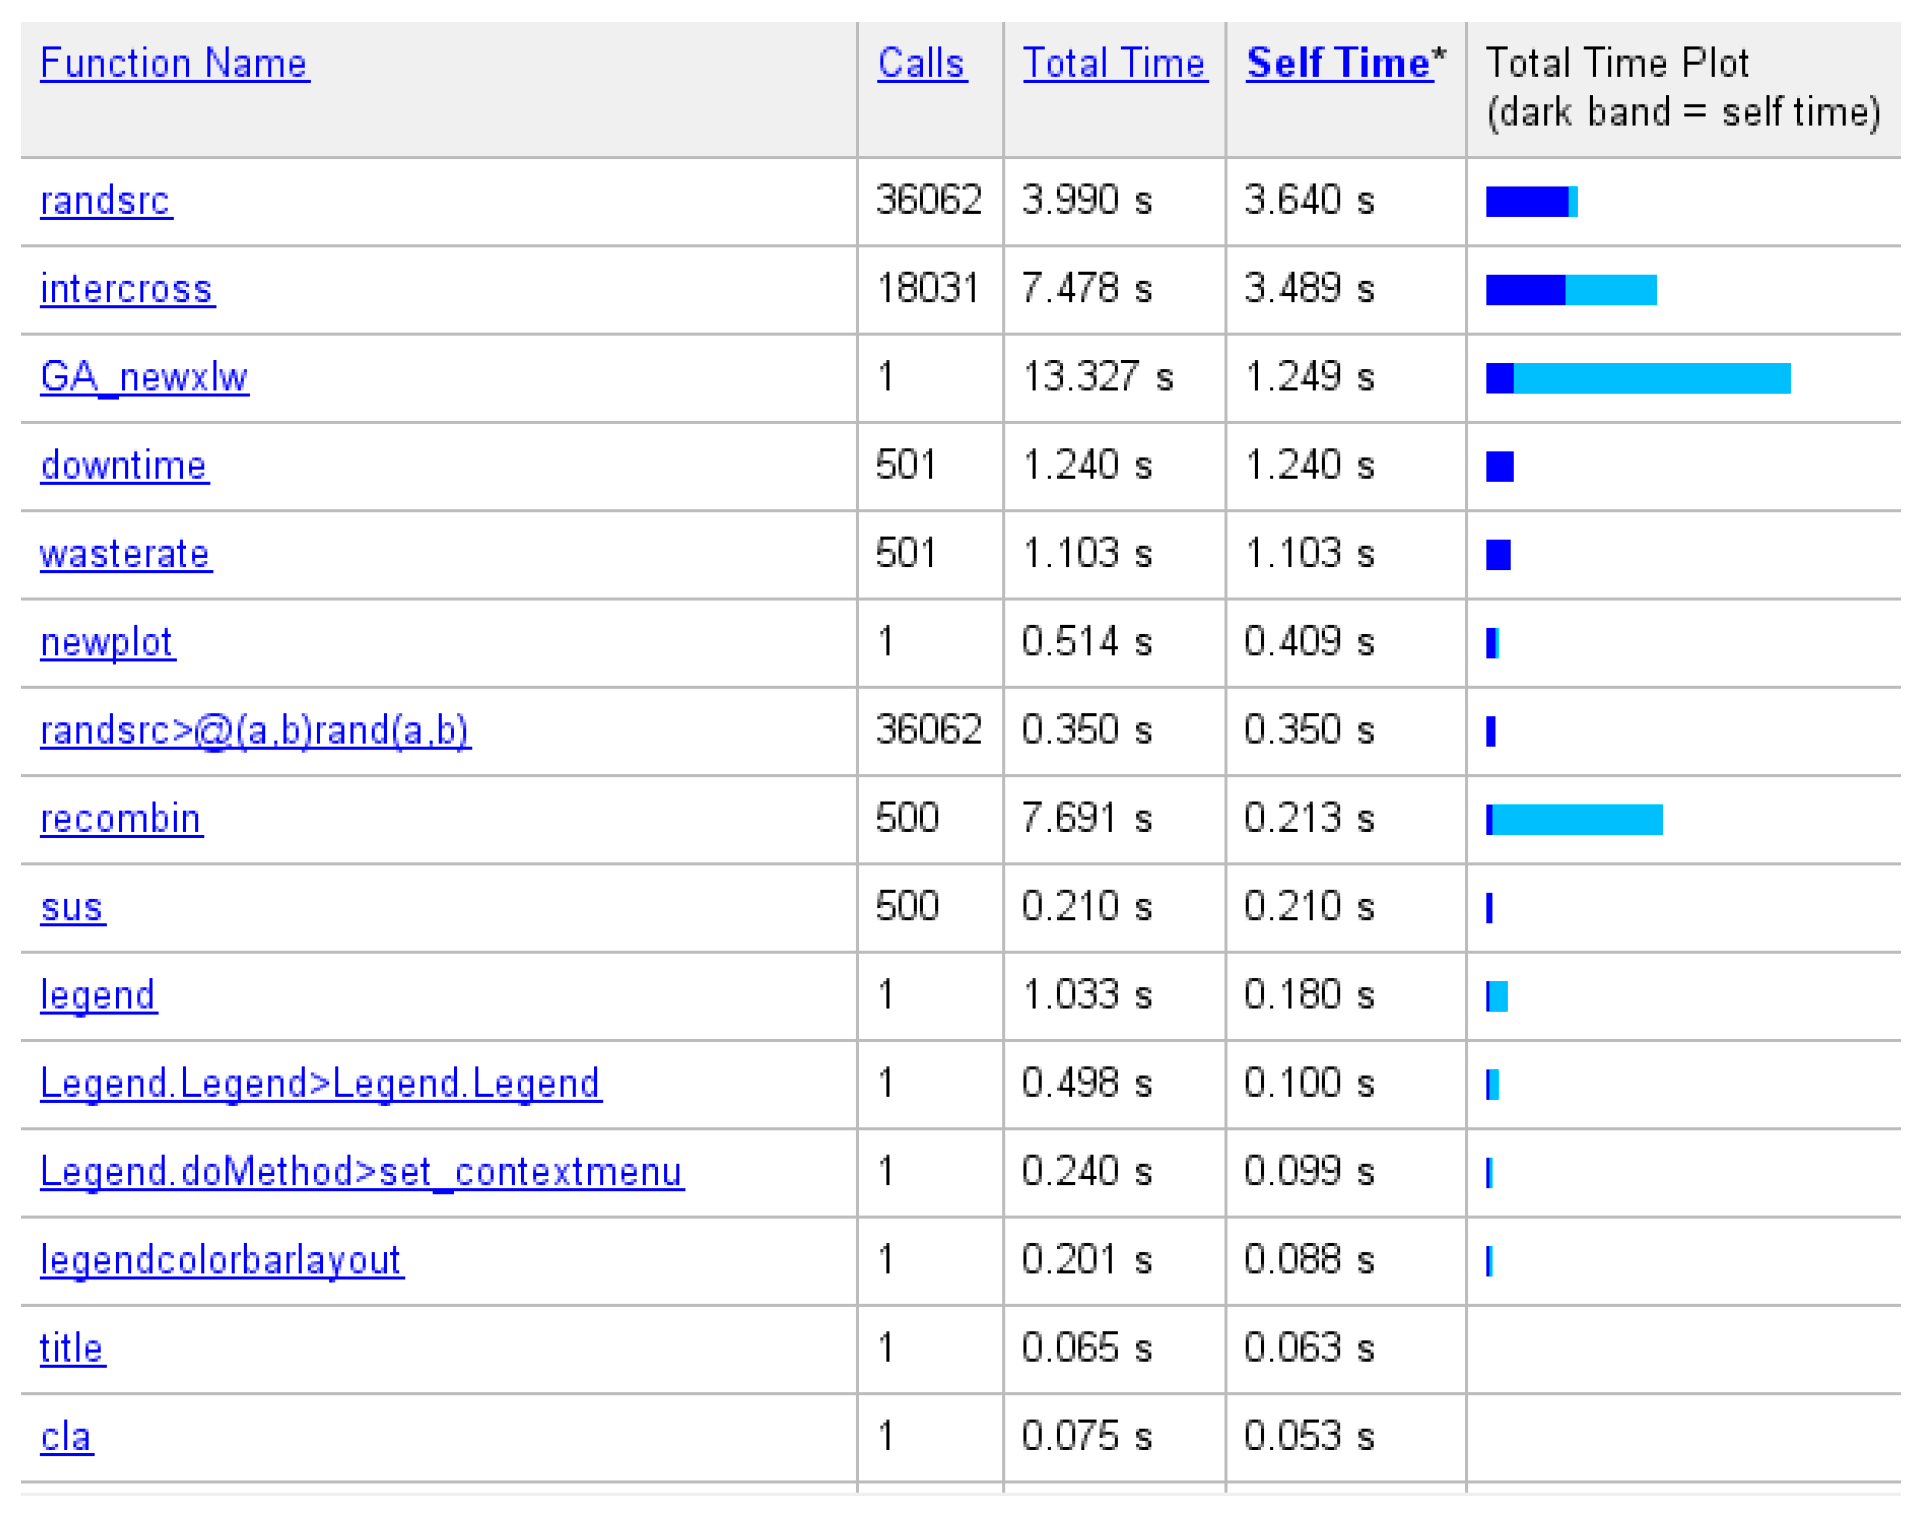
3.3. Genetic Algorithm

(1) Coding scheme
The genetic algorithm can not directly act on the decision variable parameters of the safety matching problem. Therefore, we need to represent a feasible solution to solve the problem as the chromosome of the genetic algorithm space. Then, we perform the genetic operation. Along with the coding principle of the genetic algorithm [43], this paper uses the integer arrangement coding method to construct the 0–1 programming mathematical model. The number of n candidates is 1, 2,..., n, and the chromosome is divided into n segments, with each segment corresponding to a person number, and the sequence of the number is the job matched to the person. If 9 persons are numbered {1, 2, 3, 4, 5, 6, 7, 8, 9}, then |7|4|5|1|3|9|8|2|6|. For a legal chromosome, the person configuration is as follows: the 7th person is in the 1st job, the 4th person is in the 2nd job, and so on, this configuration represents the person–job matching scheme according to the following chromosome:
x 17 = 1 , x 24 = 1 , x 35 = 1 , x 41 = 1 , x 53 = 1 , x 69 = 1 , x 78 = 1 , x 82 = 1 , x 96 = 1 .
(2) Fitness function. The genetic algorithm obtains the next search information by using the objective function value, and the use of the objective function value is reflected by the evaluation of the individual fitness value. The model solves for the minimum value of the enterprise cost. As the cost is non-negative, the reciprocal of the objective function value is used as the fitness evaluation function. When the objective function value is smaller, the individual fitness value is larger, and the individual is more suitable for the job the individual is. For the treatment of constraints, the penalty function method is used. When the algorithm generates an individual that is not a feasible solution, it applies a penalty value to its fitness, reduces the fitness, and reduces the probability of inheritance to the next generation. The objective function value is penalized by the following formula:
f ( x ) = { 1 F ( x )   ( x   meets   the   constraint ) 1 F ( x ) + C max   ( x   does   not   satisfy   the   constraint ) .
f ( x ) is the fitness evaluation function, and F ( x ) is the objective function. C max is the penalty term and is a suitably large job number, which is taken as 100.
(3) Genetic operator. In the selection operation, based on an individual’s fitness, a certain number of individuals from the parent to the children are selected according to certain rules. To ensure the convergence of the algorithm, the selection operator of in this example is combined with the elite strategy and proportional selection. First, the probability that an individual is selected is proportional to his fitness value. When the fitness value is greater, the probability of being selected is greater. If the fitness value of a person is M, the probability that he is selected is:
p = f i / i = 1 M f i   ( i = 1 , 2 , , M ) .  
Second, according to the elite strategy, that is, the individual with the highest fitness value of the parents, does not participate in the crossover and mutation operations but replaces the individual with the lowest fitness value due to the crossover and mutation operations. This ensures that the best individual among the children is never worse than the parent.
① Cross-operation: Cross-operation refers to the two pairs of chromosomes that are exchanged to obtain two new individuals. Considering that the coding method of this paper adopts the partial mapping crossover operator, after the intersection, different numbers in the same individual are retained, and the same number uses partial mapping to resolve the conflict. For example, two chromosomes of length 9 are randomly generated to produce random integers γ 1 = 3 and γ 2 = 6 in the interval [1, 9]; they determine two intersections, and they exchange data in the middle of the intersection. The numbers repeated between the nonintersecting part and the middle part are replaced by *, and the intersection of the intermediate part is used to map and eliminate the conflict. The “6” duplication of the uncrossed part of the first chromosome in the crossover and the “6” duplication of the intermediate segment requires partial mapping, “6” corresponds to 5 in the second chromosome, 5 in the first chromosome corresponds to 8, 8 in the first chromosome corresponds to 7, and there is no 7 in the first chromosome, so 6 in the uncrossed part becomes “7”, as shown in Table 2.
② Mutation operator: the mutation operation refers to replacing a certain gene in a locus in a chromosome coding sequence with its allele to form a new individual. The mutation strategy in this paper is to randomly generate two mutation points and exchange the genes at their loci. For example, two random integers A and B in the interval [1, 9] are randomly generated to determine the position of the mutation, and the genes above the two positions are crossed. That is, as shown in Table 3.
③ Evolutionary reversal operator: To improve local searchability of the genetic algorithm, the evolutionary reversal operator is introduced after selection, crossover and mutation, and the chromosome with improved fitness is reversed after reversal; otherwise, the reversal is invalid, as shown in Table 4.
(4) Algorithm solving process
The symbols involved in the algorithm are defined as follows,”NIND” represents population size, Maximum genetic termination algebra is represented by MAXGEN and GGAP by genetic generation gap.
Step 1: Input case-related data to select genetic algorithm parameters, including population size, chromosome coding string length N, maximum genetic termination algebra, cross probability Pc, mutation probability Pm and genetic generation groove. Step 2: Encode, by using the randperm (N) function to randomly generate the initial population. Step 3: Decode by first calculating the total downtime and total human factor rejection rate of each individual, then by calculating the individual objective function value is calculated to assign the minimum function value, and finally, by calculating the individual fitness with the fitness evaluation function. Step 4: Perform the selection, crossover, and mutation operations to obtain a sub-generation. The reinsertion reins function is used to replace the parent-optimized individual with the lowest fitness to form a new population. Step 5: Determine whether the genetic algebra is greater than the maximum genetic algebra MAXGEN; if it is established, then proceed to the next step, otherwise, gen = gen + 1 to Step 3. Step 6: Output the optimal chromosome and the objective function value, and the algorithm ends. The specific operation steps of the algorithm are given below, and the flow chart is shown in Figure 2.

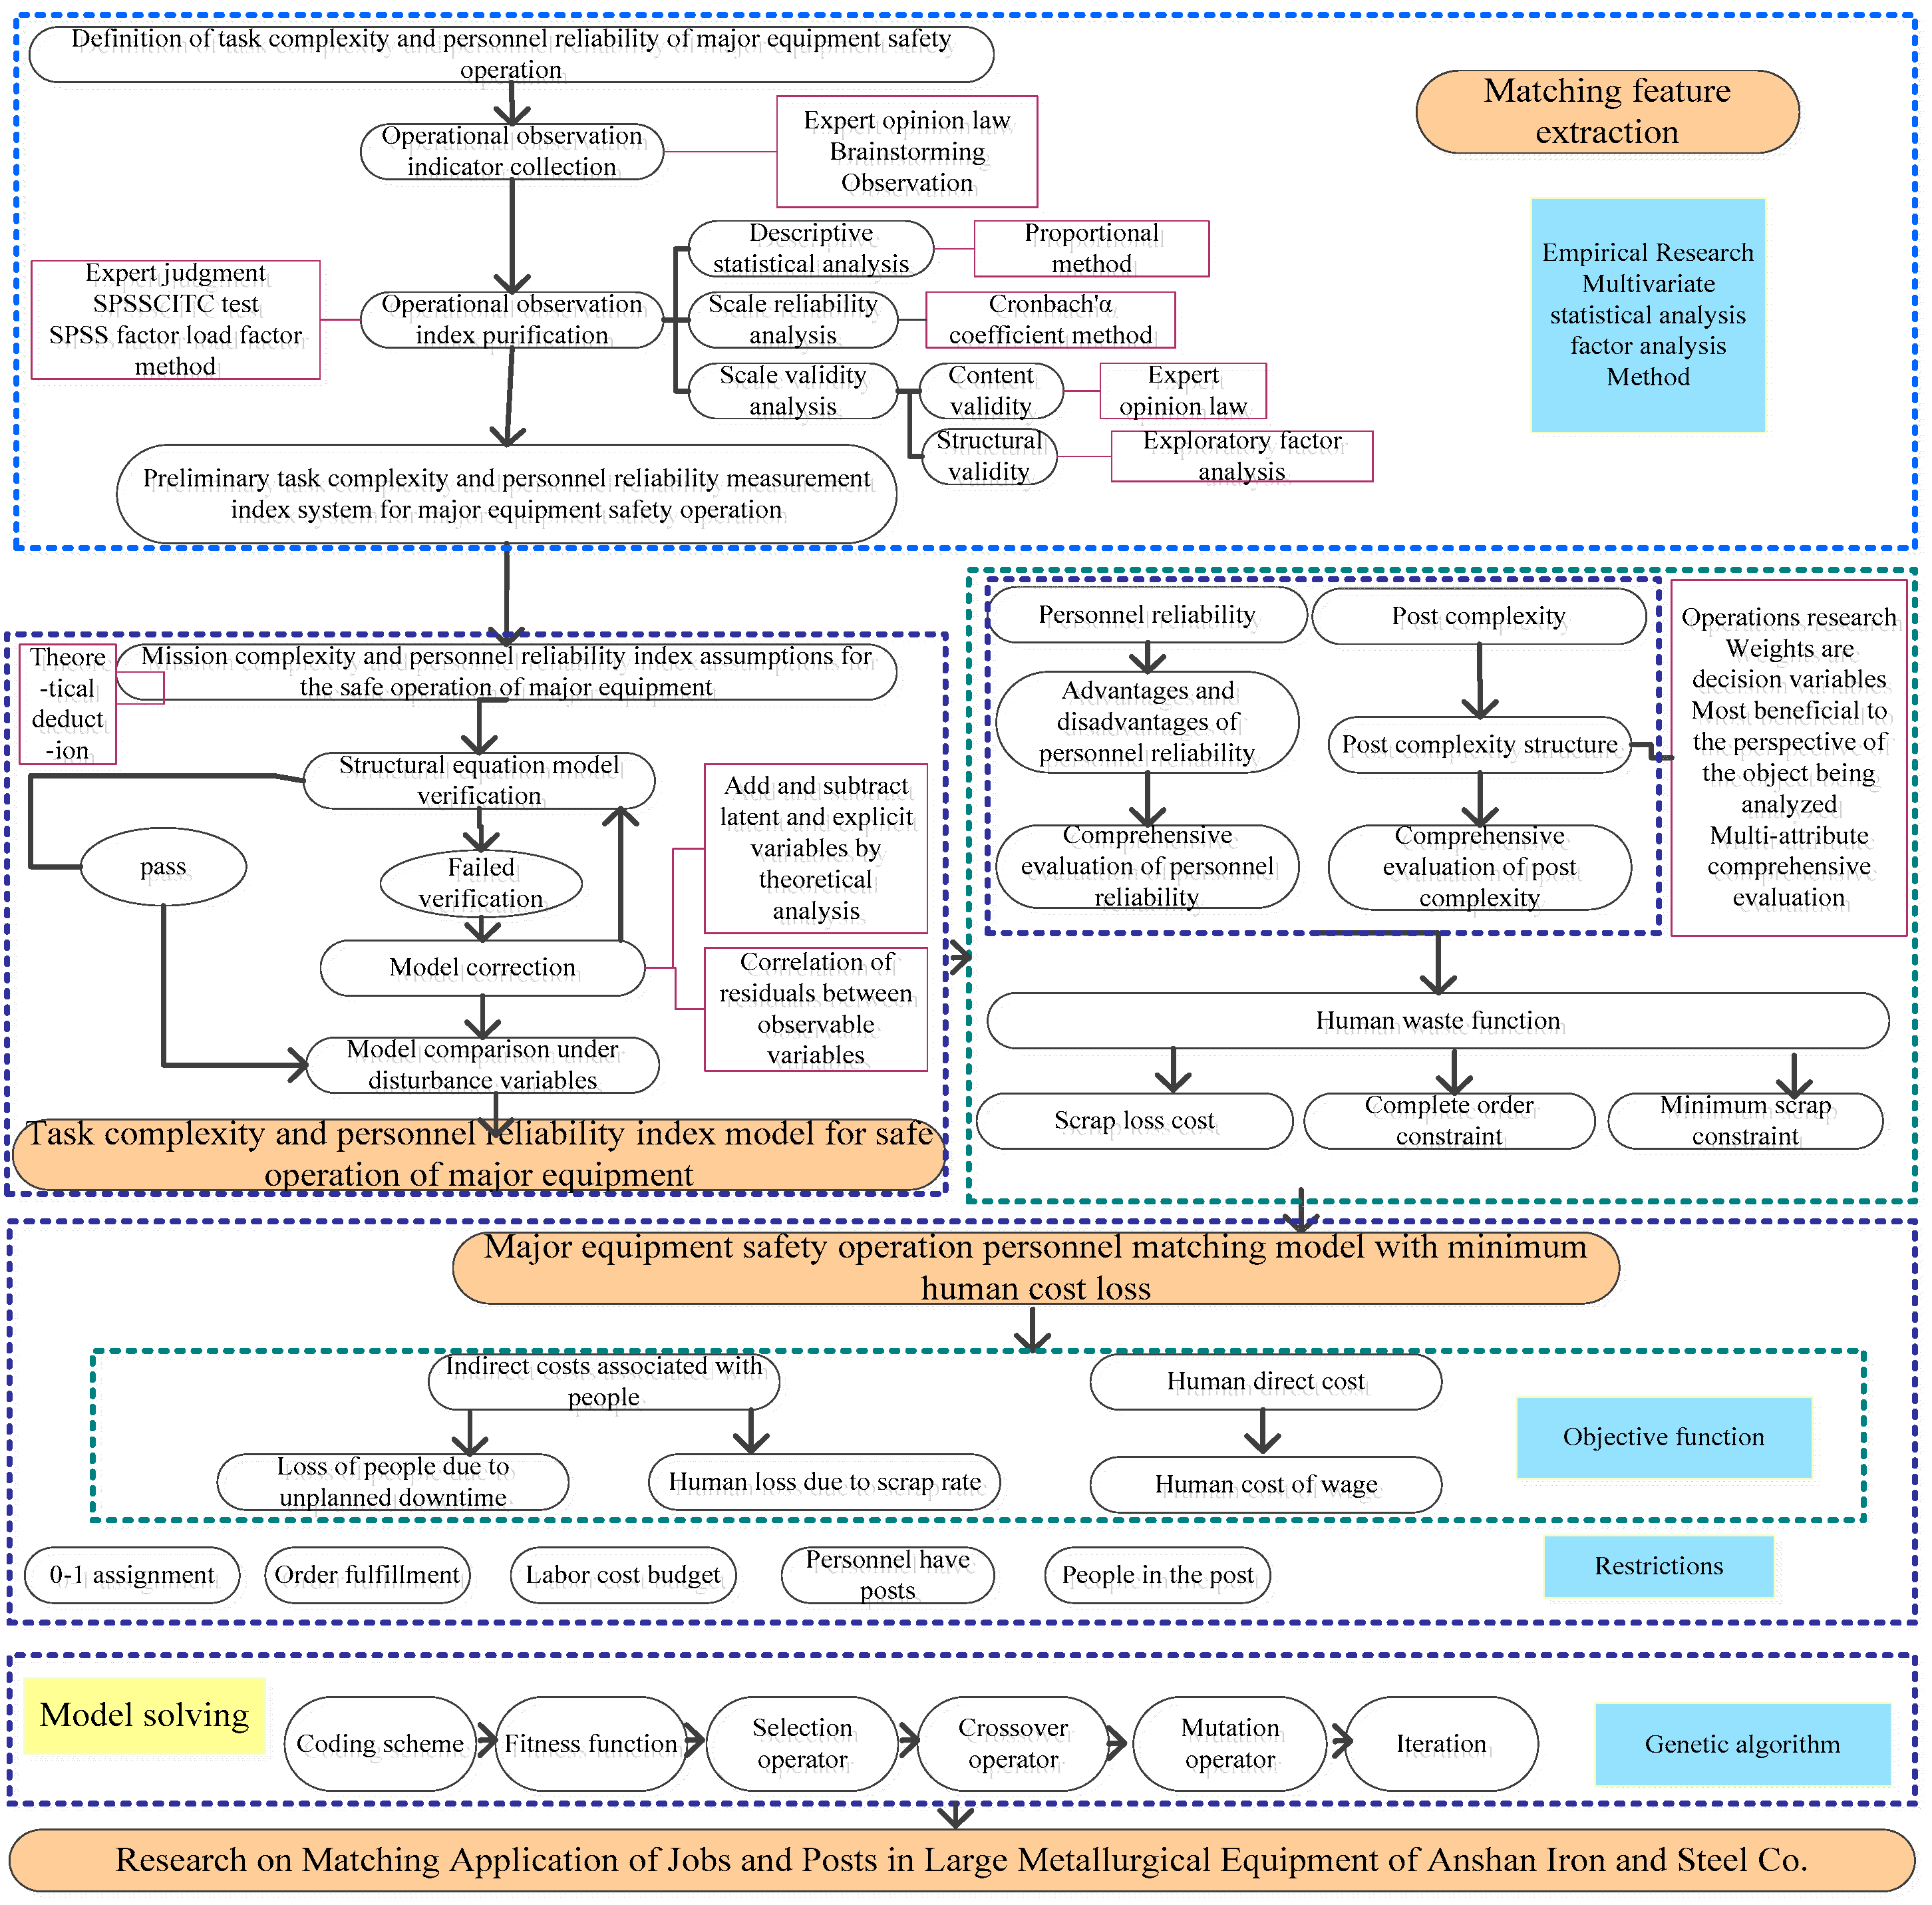
3.4. Proposed Analytical Procedures

Step 1: According to a specific type of major equipment, construct indicator systems to measure job complexity and an operator’s psychological and behavioral competency for the characteristics of a certain type of major equipment. Step 2: Collect the indicator values of each job and person to be assigned in terms of job complexity and operator competency. Step 3: According to Formulas (1) to (5) calculate the comprehensive values of job complexity and operator competency. Step 4: Input the results of Formula (5) into Formulas (6) to (26) to solve the optimization model of major equipment person configuration and obtain the person–job assignment scheme. Through the above analysis, the person–job safety matching process for major equipment according to the human factor perspective is shown in Figure 3.

4. Case Study

Case Information

The iron and steel industry is one of the most important industries all over the world. Hazards are ever-present in the steel plant environment, and a heightened awareness and emphasis on safety is a necessary priority for this industry. Safety is a great concern in steel mills. As the industry transforms to meet today’s current evolving challenges, there are three major challenges need to be solved: namely the volume of good-quality iron ore is not satisfactory. The unplanned equipment downtime always happens, and the labor cost is too high. How do we solve the above problems without the input of additional resources input? Furthermore, steel industry operators melt, mold, and form iron ore and other materials to make the iron and steel used in countless products. These workers operate furnaces, molding equipment, and rolling and finishing machines to make iron pipes, grates, steel slabs, bars, billets, sheets, rods, wires, and plates. Competency requirements for operators in iron and steel production machinery are challenging and include the need for the highest precision, reliability and productivity, even in harsh environments with high temperatures and energy transmission. The tasks that iron and steel industry operators face are very tricky. The work tasks involved in steel manufacturing often require strength, endurance and precision, and can expose workers to a number of recognized injury risks. Therefore, we choose the production equipment person-job matching in the iron and steel industry as an example.
Task complexity measurement model for major equipment operation.
Based on the literature on operator’s psychology and behavioral competency and according to expert opinions, an initial questionnaire of task complexity and operators psychological and behavioral competence was designed. From the design to the recovery of the responses, the questionnaire lasted for four months (January 2016– April 2016). Of the 1000 questionnaires sent out, 502 were collected after repeated emails and telephone calls. Eighty-four questionnaires were omitted because of significant missing data. A total of 418 valid questionnaires were eventually retained. Based on this set of questionnaire data, exploratory factor analysis and confirmatory factor analysis were conducted to obtain the task complexity and operators psychological and behavioral competence of the workers.
1) Exploratory factor analysis
Two hundred questionnaires were randomly selected for exploratory factor analysis. The job distribution was 78 mechanical, 29 automation, 61 metallurgy, 29 chemical, 19 electrical, and 24 materials. The city distribution was Liaoning, Hebei, Heilongjiang, Jilin, Shandong, Beijing, Hubei and other provinces and cities. The age distribution was 60 people were aged 28 to 40 years, 41 people were aged 41 to 50 years, 88 people were aged 51 years and over, and 11 people did not answer. The education distribution was 50 college students and below, 65 undergraduate students, 67 Master’s degree students, 14 doctoral students, and 4 people did not answer.
Exploratory factor analysis was applied with SPSS 22.0 software and showed that the Cronbach’s alpha for overall reliability was 0.981: (1) the knowledge Cronbach’s alpha coefficient was 0.845; (2) the Cronbach’s alpha for the target path was 0.924; (3) the Cronbach’s alpha for workload was 0.909; (4) the Cronbach’s alpha for uncertainty was 0.554; (5) the Cronbach’s alpha for interpersonal dependence was 0.944; (6) the Cronbach’s alpha for the factor relationship was 0.914; and (7) the Cronbach’s alpha for the human-machine interface was 0.904. This shows that the reliability of the questionnaire was very high. The overall validity according to the Kaiser-Meyer-Olkin value was 0.766, which satisfies the condition of being greater than 0.7 and shows that the questionnaire is suitable for exploratory factor analysis. Principal component analysis (PCA) by the maximum orthogonal rotation was used to extract seven factors whose eigenvalues were greater than 1. The explained cumulative variance explained rate was 68.564%, and the common factor explained most of the variance of the observed variables.
2) Confirmatory factor analysis
Confirmatory factor analysis (CFA) was used to test whether the number of factors and the factor load of the observed variables was consistent with the theoretical expectations. In the 218 samples of the CFA confirmatory factor analysis, the job distribution of the respondents was 40 in mechanical inspection, 36 in electrical inspections, 66 in control room operation, 30 in technical management, 21 in process design, and 6 in equipment maintenance. The city distribution was Hebei, Liaoning, Sichuan, Beijing, Guangdong, Guangxi, Hubei, Jiangsu, Shandong, Zhejiang and etc. The age distribution was 60 people were aged 28 to 40 years, 51 people were aged 41 to 50 years, 90 people were aged 51 and over, and 17 people did not answer. The distribution of educational background was 69 were college students and below, 80 were undergraduates, 41 were job graduates, 20were doctoral students, and 8 respondents did not answer.
To verify the validity of the preliminary index factor structure, the remaining 218 questionnaires were used for confirmatory factor analysis. The results of confirmatory factor analysis (Table 5) and path coefficients (Table 6) were obtained by using structural equation AMOS 22.0 software.
3) Competency measurement model for major equipment safety operators
By using the same exploratory factor analysis and confirmatory factor analysis, the operator’s competency model is obtained as shown in Figure 4.
4) Computation of the comprehensive evaluation value of personnel competence and post complexity
A total of 49 operators were selected. According to the established operator’s competency measurement model, the comprehensive evaluation value of competency was calculated by using the structural identification model given in Section 3.2 (1).
① Solving the Weight Value of the Personality Advantage Characteristic
By using formulas (1) and (2) to calculate the weight values of the personality advantages of 49 operators w i ( i = 1 , 2 , , 18 ) , a total of 49 groups of feature weight coefficients were obtained, of which the first nine are shown in Table 7:
② Comprehensive Evaluation Value Based on Strong-Weak Structural Recognition
Forty-nine sets of characteristic weight values are calculated and the integrated evaluation values of 49 operators are obtained by introducing them into Formulas (4), (5). The results are shown in Table 8.
According to the job setting the Anshan Iron and Steel Company, the complex characteristic weight values of 49 jobs were obtained by the same method ω i ( i = 1 , 2 , , 7 ) . Due to the limited space, only the characteristic weight values of the first nine jobs are listed here. The results are shown in Table 9:
Similarly, the comprehensive value of job complexity is calculated by Formulas (4) and (5). The comprehensive evaluation value of 49 jobs is shown in Table 10:
5) Results analysis
Through field research, we obtained the production data parameters of the safety operators of the Anshan Iron and Steel Corp (Table 11).
Due to the space limitations, the downtime matrix of the jth person in the ith position is only partially listed here, as shown in Table 12.
① Calculation of the Waste Rate
By combining the calculation results of job complexity and operators comprehensive competence (taking the percentage system as a calculation unit), the waste rate coefficient matrix of the jth individual in the i-th job is calculated by formula 7. The data are too large. Only parts of the data are listed here, as shown in Table 13.
② Analysis results
The genetic algorithm was programmed by the MATLAB2014a version. The running environment was a 2.0 Ghz, 4 GB memory and the Windows 10 operating system. The optimal iterative evolution diagram of the problem is obtained as shown in Figure 5.
From Figure 5, we can see that the objective function value of the 170 iterations tends to the optimal solution. The total cost of human factors has been greatly improved and maintained at approximately 221 million yuan. The average fitness of the population is basically the same as the optimal solution of the function value after the 200th generation. It fluctuates around the optimal solution in a certain range and does not converge to a fixed value. This is because the problem is a combinatorial optimization problem, and the objective function is not convex. Because of the particularity of the problem, a heuristic algorithm is chosen to solve it. From the running time of the algorithm in Figure 6, it can be seen that the genetic algorithm can obtain the near-optimal solution in a relatively short time, which shows that the genetic algorithm has a better solving ability when the objective function is not convex. The optimal solution of operators assignment is shown in Table 14:
Namely,
x 1 , 6 = 1 ,   x 2 , 2 = 1 ,   x 3 , 35 = 1 ,   x 4 , 27 = 1 ,   x 5 , 32 = 1 ,   x 6 , 49 = 1 ,   x 7 , 16 = 1 ,   x 8 , 4 = 1 ,   x 9 , 10 = 1 ,
The results indicate that the sixth person is assigned to the first job, the second person is assigned to the second job, the thirty-fifth person is assigned to the third job, the twenty-seventh person is assigned to the fourth job, the thirty-second person is assigned to the fifth job, the forty-ninth person is assigned to the sixth job, the sixteenth person is assigned to the seventh job, the fourth person is assigned to the eighth job, and the tenth person is assigned to the ninth job. By analogy, the remaining assignment schemes can be obtained.
In fully recognizing the value of the contribution of the operators, this paper considers the assignment of the operators with the minimum loss of heavy equipment downtime due to mission complexity and operators competence. According to the cost function of human factor loss and its main parameters, we select human factor downtime t i j , the human factor rejection rate i j and the human factor variable wage cost coefficient δ to change the value of one parameter within a certain range under the condition that the other parameters remain unchanged, then we observe the degree of its impact on the costs. The experimental results are shown in Table 15.
An analysis of the results revealed not only that 1) the change in human factor downtime t i j has a significant impact on costs and the rejection rate i j , and the artificial variable wage costing coefficient δ affects only the cost directly related to it, but also that 2) the human factor downtime t i j and the rejection rate i j have a greater impact on total cost, and the rejection rate i j has the most obvious impact. Therefore, in the process of controlling production costs, enterprises should minimize human failure due to downtime.

5. Implications

5.1. Theoretical Implications

Altogether, the theoretical contribution of this research to the literature on the matching problem and human resources management is fourfold.
First, this paper provides a research framework that promotes the combining of psychology, behavior and operation research. Regarding the research methodology, the key point of the research on the “person-job” safety matching method for major equipment is to consider the “integrated mode” of interdisciplinary theory and research methods. This consideration not only puts qualitative psychology and behavior into the quantitative optimization model, but also data mines the characteristics of strengths and weaknesses characteristics under the psychology and behavior data; It also finds a new way of introducing the characteristics of strengths and weaknesses characteristics into the optimization model.
Second, this research constructs a new model of human factor reliability. It constructs human factor reliability from two perspectives in contrast to the previous studies. Previous studies usually construct prediction factors from only one perspective. We consider two important perspectives in this study, namely, safety operation competency and task complexity. This approach provides a decision-making reference for human resources allocation from the perspective of safety management.
Third, this research broadens the utility of safety cost and gives a new mathematical formula to measure the safety costs in a broad sense. In the previous studies, safety costs are limited to accident costs. This research broadens the concept of safety operation, where safety operation means that when the rejection rate is less, unplanned downtime is less, and it is better to have less labor costs. In addition, we formulate the minimum cost of operator allocation in the scenario of major equipment operation. The person–job matching method based on the level of psychological behavior competency and task complexity, including human factor loss, human failure downtime loss and labor costs, is constructed based on the comprehensive evaluation of the structure of strengths.

5.2. Management Implications

Firstly, this research is a benefit to safety management and opens a new way for safety management. In practice, we therefore have to go beyond the traditional safety management approach, such as the safety production responsibility system, the fire accident management approach, and the early warning system. Indeed, the traditional ways are all important. However, approximately 80% of production accidents are mainly caused by a human error, while the remaining 20% almost always involve a human factors component. From the point of view of practical management instructions, one of the most important contributions of this research is that it provides a specific safety assignment plan. This plan is applicable and can predict future job safety cost.
Secondly, the approach in this paper is beneficial for improving a human resources evaluation system based on individual strengths and weaknesses. Many at-risk behaviors occur intuitively and are the result of a poor emotional status. One of the major reasons associated with a bad mood is the feeling that one is being treated unfairly. Operators hope to be evaluated by a maximization of his/her competency contribution and obtained achievements from their individual strengths’ characteristics standing out. The evaluation method given by this research is good for encouraging operators to behave better himself and to do a better, safer job.
Thirdly, this paper contributes to human resources allocation according to task complexity and individual competency. It is necessary to study the difference between allocating human resources; it is also necessary to study the particularity of human psychology and behavior and seek safety in the work. This approach is good for major equipment management to balance safety and benefits.
Lastly, operators should be taught according to their aptitude and individual characteristics. Training systems should be established in different categories and should be tailor-made to target the individual characteristics of the operators to strengthen their error correction and ability to improve. It is good for major equipment operators to develop in a healthy way.

6. Conclusions

The increasing large-sized integration and intellectualization of major equipment poses unprecedented challenges to safe person–job matching. Such challenges are due to the complexity of different tasks and the psychological and behavioral competencies of different people, by which poor person–job assignment solutions can lead to the waste of human factors, the loss from human-caused downtime and the increased cost of labor wages. To solve the safety matching problem, human reliability with a consideration of operator competency and task complexity is introduced into the 0–1 assignment optimization model. Based on the theory of behavioral science and operations research, this study describes the rate of the waste of human factors through the comprehensive evaluation of the structure of strengths and weaknesses and potential person–job combinations. The optimization model considers the minimum human factor safety and wage costs and satisfies the requirements of order, budget and assignment. An intelligent genetic algorithm is designed to solve the model and to realize the “person-job” assignment scheme that has the minimum cost and that ensures the safe operation of major equipment. This solution can improve the safety of the matching scheme and the reliability and scientific basis of the decision-making. Introducing the perspective of human factors into the staffing problem of the safe operation of major equipment in the process industry provides a solution for the safe and reliable production. This approach can promote the integration of multidisciplinary theories and research methods, such as the methods used in behavioral science, statistics and operations research.
The “person-job” matching decision for major equipment is a complex “social-technological-physical” system. This paper combines empirical research on the analysis of psychological and behavioral mechanisms with the optimization model algorithm for quantitative analysis. Theoretical principles and methods are introduced in the optimization modeling process of operations research. The use of a reliable human perspective resolves the contradiction between safe and reliable operation and resource input. Through the cross-integration of multidisciplinary theory and methods, we solve the problem of person–job matching decision-making for heavy equipment from the perspective of safety. This work can enrich and perfect the theory and method of resource matching decision-making under the guidance of safety and improve the scientific basis and effectiveness of matching decision-making. A mathematical modeling method combines scientific and practical psychological behavior with optimization is formed to realize the correct, robust and efficient optimization problem-solving algorithm. The cross-combination method of behavioral science and operations research can enrich the person–job matching theory.
The optimization of the person–job assignment scheme, which combines the reliability of human psychology and behavior with the complexity of the task, can indeed reduce the cost of the safe operation of equipment caused by the loss of rejection rate of the human factor and the duration of human factors in a broad sense. It can also reduce the wage cost of human factors. Moreover, the change in the duration of human factor downtime has a significant impact on the cost, and the rejection rate of the human factor and the variable wage cost coefficient have an impact only on the costs directly related to them. The impact of the duration of human factor downtime and the rejection rate of the human factor is relatively large. With the survey data from the Anshan Iron and Steel Group as an example, the influencing factors of the complexity and safe operation of major equipment are proved by exploratory factor analysis and confirmatory factor analysis. The influencing factors include seven main aspects of complexity, namely, knowledge, workload, interpersonal dependence, human-machine interface, target path, uncertainty, and the factor relationship. Operators reliability can be measured from the perspective of psychological behavior. The main dimensions include attention to detail, work order, dedication, responsibility, new technology application, mastery of equipment support mechanisms, mastery of production process technology, mastery of automatic production control system, problem handling ability, system thinking ability, innovation ability, risk management ability, analysis and judgment ability, teamwork, cooperation, decisive action, experience sharing, self-control and physical fitness.
The limitation of this study is that the principle of “person-job” matching for safe operation requires further empirical analysis with large sample data on multiple enterprises. Future research will concern the multilateral cooperation of major equipment operators and multitype collaborative work. A method for determining the indicators of the psychology and behavior of human factor reliability will be constructed. Based on the information recorded in the human resources database, such as individual education and work experience, work performance, and assessment records, the specific values of individual indicators are given by constructing a data mining method. Future research will require a team perspective to consider the safety, multitype collaboration, time urgency, multitask parallelism of major equipment operators, and the mixture of project tasks and conventional tasks. Future research will consider different types of tasks when building a matching model algorithm.

Author Contributions

Conceptualization and formal analysis, L.Z.; data curation, W.Y.; Writing—Original Draft preparation, Z.L.; Writing—Review and Editing, K.-J.W.

Funding

This work is supported by the National Natural Science Foundation of China, 71771036; Postdoctoral special funding project in China, 2018T110075; Postdoctoral Science Foundation of China, 2017M610831; the Fundamental Research Funds for the Central Universities, DUT17RW128; the National Natural Science Foundation of China, 71401023; the Social and Humanity Science Foundation of Education Ministry of China, 14YJC630191; and the Economic and Social Development Foundation of Liaoning 2017lslktyb-049.

Conflicts of Interest

The authors declare no conflict of interest.

References

  1. Li, G.; Yang, H.X.; Yuan, C.M.; Eckhoff, R.K. A catastrophic aluminium-alloy dust explosion in China. J. Loss Prev. Process Ind. 2016, 39, 121–130. [Google Scholar] [CrossRef]
  2. Jiang, L.; Lavaysse, L.M.; Probst, T.M. Safety climate and safety outcomes: A meta-analytic comparison of universal vs. industry-specific safety climate predictive validity. Work Stress 2019, 33, 41–57. [Google Scholar] [CrossRef]
  3. Huang, C.; Xu, L.D.; Cai, H.; Li, G.; Du, J.; Jiang, L. A context-based service matching approach towards functional reliability for industrial systems. Enterp. Inf. Syst. 2019, 13, 196–218. [Google Scholar] [CrossRef]
  4. Eastwick, P.W.; Finkel, E.J.; Simpson, J.A. Best practices for testing the predictive validity of ideal partner preference-matching. Personal. Soc. Psychol. Bull. 2019, 45, 167–181. [Google Scholar] [CrossRef]
  5. Musharraf, M.; Smith, J.; Khan, F.; Veitch, B.; MacKinnon, S. Incorporating individual differences in human reliability analysis: an extension to the virtual experimental technique. Saf. Sci. 2018, 107, 216–223. [Google Scholar] [CrossRef]
  6. Gale, D.; Shapley, L.S. College admissions and the stability of marriage. Am. Math. Mon. 1962, 69, 9–15. [Google Scholar] [CrossRef]
  7. Lowalekar, M.; Varakantham, P.; Jaillet, P. Online spatio-temporal matching in stochastic and dynamic domains. Artif. Intell. 2018, 261, 71–112. [Google Scholar] [CrossRef]
  8. Okumura, Y. A one-sided many-to-many matching problem. J. Math. Econ. 2017, 72, 104–111. [Google Scholar] [CrossRef]
  9. Boudreau, J.W.; Knoblauch, V. A marriage matching mechanism menagerie. Oper. Res. Lett. 2017, 45, 68–71. [Google Scholar] [CrossRef]
  10. Liu, Y.; Liu, X. Integer k-matchings of graphs. Discret. Appl. Math. 2018, 235, 118–128. [Google Scholar] [CrossRef]
  11. Gourvès, L.; Monnot, J.; Pascual, F.; Vanderpooten, D. Bi-objective matchings with the triangle inequality. Theor. Comput. Sci. 2017, 670, 1–10. [Google Scholar] [CrossRef]
  12. Zhang, D.; Wang, X. Understanding many-to-many matching relationship and its correlation with joint response. Transp. Res. Part B Methodol. 2018, 108, 249–260. [Google Scholar] [CrossRef]
  13. Bhattacharya, A.; Mondal, A.; Murthy, T.S. Problems on matchings and independent sets of a graph. Discret. Math. 2018, 341, 1561–1572. [Google Scholar] [CrossRef]
  14. Erdil, A.; Ergin, H. Two-sided matching with indifferences. J. Econ. Theory 2017, 171, 268–292. [Google Scholar] [CrossRef]
  15. Monge, A.E.; Elkan, C. The field matching problem: algorithms and applications. KDD 1996, 2, 267–270. [Google Scholar]
  16. Gopalakrishnan, H.; Kosanovic, D. Operational planning of combined heat and power plants through genetic algorithms for mixed 0–1 nonlinear programming. Comput. Oper. Res. 2015, 56, 51–67. [Google Scholar] [CrossRef]
  17. Touat, M.; Bouzidi-Hassini, S.; Benbouzid-Sitayeb, F.; Benhamou, B. A hybridization of genetic algorithms and fuzzy logic for the single-machine scheduling with flexible maintenance problem under human resource constraints. Appl. Soft Comput. 2017, 59, 556–573. [Google Scholar] [CrossRef]
  18. Metawa, N.; Hassan, M.K.; Elhoseny, M. Genetic algorithm based model for optimizing bank lending decisions. Expert Syst. Appl. 2017, 80, 75–82. [Google Scholar] [CrossRef]
  19. Zhang, L.; Wong, T.N. An object-coding genetic algorithm for integrated process planning and scheduling. Eur. J. Oper. Res. 2015, 244, 434–444. [Google Scholar] [CrossRef]
  20. Painton, L.; Campbell, J. Genetic algorithms in optimization of system reliability. IEEE Trans. Reliab. 1995, 44, 172–178. [Google Scholar] [CrossRef]
  21. da Mata, S.H.; Guardieiro, P.R. Resource allocation for the LTE uplink based on Genetic Algorithms in mixed traffic environments. Comput. Commun. 2017, 107, 125–137. [Google Scholar] [CrossRef]
  22. Faia, R.; Pinto, T.; Vale, Z.; Corchado, J.M.; Soares, J.; Lezama, F. Genetic algorithms for portfolio optimization with weighted sum approach. IEEE Symp. Ser. Comput. Intell. 2018, 18, 1823–1829. [Google Scholar]
  23. Younas, I.; Kamrani, F.; Bashir, M.; Schubert, J. Efficient genetic algorithms for optimal assignment of tasks to teams of agents. Neurocomputing 2018, 314, 409–428. [Google Scholar] [CrossRef]
  24. Jiang, J.; Wang, Y.; Zhang, L.; Wu, D.; Li, M.; Xie, T.; Li, P.; Dai, L.; Li, P.; Shi, X.; et al. A cognitive reliability model research for complex digital human-computer interface of industrial system. Saf. Sci. 2018, 108, 196–202. [Google Scholar] [CrossRef]
  25. Bevilacqua, M.; Ciarapica, F.E. Human factor risk management in the process industry: A case study. Reliab. Eng. Syst. Saf. 2018, 169, 149–159. [Google Scholar] [CrossRef]
  26. Kim, Y.; Park, J.; Jung, W.; Choi, S.Y.; Kim, S. Estimating the quantitative relation between PSFs and HEPs from full-scope simulator data. Reliab. Eng. Syst. Saf. 2018, 173, 12–22. [Google Scholar] [CrossRef]
  27. McDonnell, D.; Balfe, N.; Pratto, L.; O’Donnell, G.E. Predicting the unpredictable: Consideration of human and organisational factors in maintenance prognostics. J. Loss Prev. Process Ind. 2018, 54, 131–145. [Google Scholar] [CrossRef]
  28. Olivares, R.D.C.; Rivera, S.S.; Leod, J.E.N.M. A novel qualitative prospective methodology to assess human error during accident sequences. Saf. Sci. 2018, 103, 137–152. [Google Scholar] [CrossRef]
  29. Islam, R.; Khan, F.; Abbassi, R.; Garaniya, V. Human error assessment during maintenance operations of marine systems What are the effective environmental factors? Saf. Sci. 2018, 107, 85–98. [Google Scholar] [CrossRef]
  30. Park, J.; Jung, J.Y.; Heo, G.; Kim, Y.; Kim, J.; Cho, J. Application of a process mining technique to identifying information navigation characteristics of human operators working in a digital main control room–feasibility study. Reliab. Eng. Syst. Saf. 2018, 175, 38–50. [Google Scholar] [CrossRef]
  31. Ribeiro, A.C.; Sousa, A.L.; Duarte, J.P.; e Melo, P.F. Human reliability analysis of the Tokai-Mura accident through a THERP–CREAM and expert opinion auditing approach. Saf. Sci. 2016, 87, 269–279. [Google Scholar] [CrossRef]
  32. Ergai, A.; Cohen, T.; Sharp, J.; Wiegmann, D.; Shappell, S. Assessment of the human factors analysis and classification system (HFACS): Intra-rater and inter-rater reliability. Saf. Sci. 2016, 82, 393–398. [Google Scholar] [CrossRef]
  33. Rasmussen, M.; Standal, M.I.; Laumann, K. Task complexity as a performance shaping factor: A review and recommendations in Standardized Plant Analysis Risk-Human Reliability Analysis (SPAR-H) adaption. Saf. Sci. 2015, 76, 228–238. [Google Scholar] [CrossRef]
  34. Kabir, S.; Papadopoulos, Y. A review of applications of fuzzy sets to safety and reliability engineering. Int. J. Approx. Reason. 2018, 100, 29–55. [Google Scholar] [CrossRef]
  35. Wiegmann, D.A.; Shappell, S.A. A Human Error Approach to Aviation Accident Analysis: The Human Factors Analysis and Classification System; Routledge: Abingdon, UK, 2017. [Google Scholar]
  36. Zwirglmaier, K.; Straub, D.; Groth, K.M. Capturing cognitive causal paths in human reliability analysis with Bayesian network models. Reliab. Eng. Syst. Saf. 2017, 158, 117–129. [Google Scholar] [CrossRef]
  37. Zhou, Q.; Wong, Y.D.; Loh, H.S.; Yuen, K.F. A fuzzy and Bayesian network CREAM model for human reliability analysis—The case of tanker shipping. Saf. Sci. 2018, 105, 149–157. [Google Scholar] [CrossRef]
  38. Deng, X.; Jiang, W. Dependence assessment in human reliability analysis using an evidential network approach extended by belief rules and uncertainty measures. Ann. Nucl. Energy 2018, 117, 183–193. [Google Scholar] [CrossRef]
  39. Liu, H.C.; Li, Z.; Zhang, J.Q.; You, X.Y. A large group decision-making approach for dependence assessment in human reliability analysis. Reliab. Eng. Syst. Saf. 2018, 176, 135–144. [Google Scholar] [CrossRef]
  40. Zhao, X.; Zhu, C.; Wang, Y.; Jia, J. The Theory Method and Application of Competitive Evaluation; Science Press (China): Beijing, China, 2012. [Google Scholar]
  41. Zhao, X.; Wang, Q.; Lv, Y. Evaluation and judgement method of leader talent based on individual advantage analysis. Oper. Res. Manag. Sci. 2012, 21, 239–248. [Google Scholar]
  42. Kolus, A.; Wells, R.; Neumann, P. Production quality and human factors engineering: A systematic review and theoretical framework. Appl. Ergon. 2018, 73, 55–89. [Google Scholar] [CrossRef] [PubMed]
  43. Biajoli, F.L.; Chaves, A.A.; Lorena, L.A. A biased random-key genetic algorithm for the two-stage capacitated facility location problem. Expert Syst. Appl. 2019, 115, 418–426. [Google Scholar] [CrossRef]
Figure 1. Research ideas.
Applsci 09 01219 g001
Figure 2. Flow chart of the genetic algorithm for realizing safe person–job matching.
Applsci 09 01219 g002
Figure 3. Implementation process method.
Applsci 09 01219 g003
Figure 4. Competency index system for large metallurgical equipment workers.
Applsci 09 01219 g004
Figure 5. Evolution process of the solution.
Applsci 09 01219 g005
Figure 6. Running time graph.
Applsci 09 01219 g006
Table 1. Variable definitions.
SymbolDefinition
λ basic layer indicator weight, expressing degrees of strength or weakness
k the k-th operator or job
i the i-th expert who gives each basic indicator values
t : the t -th middle layer factor
d t ( i ) value of t-th factor of middle layer calculated according to i-th expert evaluation score
x ( t , j ) ideal value of the j-th basic indicator under the t -th middle layer factor
x ( t , j ) ( i , k ) the j -th basic layer index value of the t -th intermediate layer index of the k -the object to be analyzed by the i -th expert
j : j-th basic layer index of the t-th middle layer factor
P t the number of basic layer indicator under the t-th middle layer factor
x:value of complexity and competency at the grassroots level
  λ ( t , j ) ( i , k ) the j -th basic layer index weight of the t -th intermediate layer index of the k -th object to be analyzed by the i -th expert
y t t-th middle layer index value
y t ideal value of t-th middle layer factor
y t ( i , k ) t-th middle layer index value according to the i-th expert who gives each basic indicator values for the k-th operator or job
μ middle layer indicator weight expresses the degree of strength or weakness
m number of middle layer indicators
μ t ( i , k ) t-th middle layer indicator weight, which can express the degree of strength or weakness according to the i-th expert who gives each basic indicator values for the k-th operator or job
mm stands for the mth job
nn denotes the nth operator
z : evaluating indicator of highest level of complexity and competence
y : middle level evaluating indicator of complexity and competency
X:value of complexity and competency at the grassroots level
p m : number of measurement indicators that support the middle layer ym
P :profit from unit-qualified products
p :profit from scrap and defective products
q :production amount per hour
T p : calendar time
T f : planned maintenance time
t ij :j-th operator’s monthly stoppage at station i, ( i = 1 , 2 , , m ;   j = 1 , 2 , , n )
x ij : 0-1 decision variable that indicates that the j-th person takes 1 in the i-th job and is 0 otherwise
θ i :i-th job non-qualified product coefficient,
a r :r-th competence indicator ideal value, r = 1 , 2 , , z
a rj : actual value of the r-th competence indicator of the j-th person, j = 1 , 2 , ,   n
ω jr : weight coefficient of the r-th competence index of the j-th person
b ki : k-th indicator complexity value of the i-th job, k = 1 , 2 , ,   l
ω ki :i-th job k-th indicator complexity weight
g ij :fixed salary of the j-th person in the i-th job
δ :unit time evaluation coefficient
t i : downtime for the i-th job
A :annual total wage cost lower limit
B :annual scrap limit
C : total labor cost limit
M : annual order quantity
Table 2. Cross-operation examples.
Before CrossingCrossingAfter Crossing
6 3 7 8 5 1 2 4 9* 3 8 5 6 9 2 4 *7 3 8 5 6 9 2 4 1
7 2 8 5 6 9 4 1 3* 2 7 8 5 1 4 * 36 2 7 8 5 1 4 9 3
Table 3. Examples of mutation operations.
Before MutationAfter Mutation
6 3 7 8 5 1 2 4 96 3 1 8 5 7 2 4 9
Table 4. Example of the reversal operation.
Before ReversalAfter Reversal
6 3 7 8 5 1 2 4 96 3 1 5 8 7 2 4 9
Table 5. Confirmatory factor analysis model fitting index output.
Fitting Indexχ2 dfpχ2/dfNNFICFIRMSEA
Output results2426.58010200.0672.3790.9160.9070.071
Table 6. Path coefficient table for major equipment operational complexity.
Measurement Index FactorCOEFFICIENTC.R.PStandard CoefficientMeasurement Index FactorCoefficientC.R.PStandard Coefficient
Task structure
Task order
Knowledge1 0.61Ideal state multipathTarget path1 0.63
Knowledge1.117.872***0.61Multiple final states/targetsTarget path0.128.622***0.66
Task organizationKnowledge1.438.819***0.71Competition pathTarget path0.1610.194***0.82
Conflict rulesKnowledge1.679.128***0.74Multiple conflicting goalsTarget path0.127.715***0.58
Logical relationshipKnowledge1.558.85***0.71Path target conflictTarget path0.169.714***0.77
Structural diversityKnowledge1.027.001***0.53Error proneTarget path0.127.738***0.58
Domain knowledgeKnowledge1.27.985***0.62Target numberTarget path0.138.949***0.69
Depth of knowledgeKnowledge1.157.827***0.61Number of tasksTarget path0.147.724***0.58
Decision knowledgeKnowledge1.177.712***0.59Number of similar tasksTarget path0.178.925***0.69
Quantity of behaviorWorkload1 0.7Path/process and result uncertaintyUncertainty1 0.65
Number of stepsWorkload0.879.417***0.66Transcendental decision methodUncertainty0.119.429***0.75
Amount of inputWorkload0.364.54***0.51Known factor numberUncertainty0.118.118***0.63
Output quantityWorkload0.9710.412***0.73Known connection numbersUncertainty0.138.229***0.64
Number of programsWorkload1.0810.281***0.72Information/task transparencyUncertainty0.137.957***0.61
Number of actionsWorkload0.8710.249***0.72Information integrityUncertainty0.127.346***0.56
Time urgencyWorkload0.849.981***0.7Number of task elementsFactor relation1 0.63
Time lengthWorkload809.489***0.66Information prompt quantityFactor relation0.118.692***0.67
Number of personal interactionsInterpersonal dependence1 0.61Quantity of informationFactor relation0.1610.194***0.82
Amount of collective communicationInterpersonal dependence1.017.372***0.62Information intensityFactor relation0.127.715***0.58
Amount of collective communicationInterpersonal dependence1.238.319***0.69Size of question spaceFactor relation0.169.714***0.77
Everyone’s DependenceInterpersonal dependence1.779.425***0.75Subtask numberFactor relation0.127.738***0.58
MisleadingInterface1 0.71Number of variablesFactor relation0.138.949***0.69
Lack of informationInterface0.097.895***0.64Memory requirementsFactor relation0.147.724***0.58
HomogeneityInterface0.138.138***0.83Relationship between elementsFactor relation0.178.925***0.69
Logical presentationInterface0.170.6210.5350.05Input-output relationshipFactor relation0.157.954***0.65
Operation informationInterface0.16-0.760.447-0.06Element connection numberFactor relation0.119.429***0.75
Element connection strengthFactor relation0.118.118***0.63
Table 7. Weight coefficient of the personality advantage characteristics of the top 9 personnel.
Staffwi1wi2wi3wi4wi5wi6wi7wi8wi9wi10wi11wi12wi13wi14wi15wi16wi17wi18
10.100.10.100.100.10000.10.10.100.100.1
200.0590.0590.0590.0590.0590.0590.0590.0590.0590.0590.0590.0590.0590.0590.0590.0590.059
30.0450.0610.0610.0610.0610.0450.0610.0610.0760.0450.0450.0760.0610.0610.0450.0610.0610.015
40.0450.0610.0610.0610.0610.0450.0610.0610.0760.0450.0450.0760.0610.0610.0450.0610.0610.015
5000000000000010000
60000.12500000000.1250.1250.1250.1250.1250.1250.125
70000.500000000000000.5
80000.2500000.25000.250.2500000
90.100.10.1000.100.10.10.10000.10.100.1
Table 8. Comprehensive evaluation of operators.
StaffComprehensive Evaluation ValueStaffComprehensive Evaluation ValueStaffComprehensive Evaluation ValueStaffComprehensive Evaluation ValueStaffComprehensive Evaluation Value
10.09894110.06390210.04925310.05776410.10682
20.07366120.09514220.06598320.14674420.10682
30.10682130.08354230.05354330.09714430.10682
40.10682140.05849240.04965340.19529440.10682
50.11452150.10845250.08220350.16380450.06085
60.07960160.09040260.06492360.16247460.07375
70.11249170.07898270.07829370.10682470.05815
80.09658180.06101280.05269380.10682480.08033
90.08749190290.10964390.10682490.07277
100.08320200.03861300400.10682
Table 9. Top 9 job complexity characteristic weights.
JobFactor 1Factor 2Factor3Factor 4Factor 5Factor 6Factor 7
100.20.200.20.20.2
20.1430.1430.1430.1430.1430.1430.143
30.1670.1670.1670.16700.1670.167
40.1670.1670.1670.16700.1670.167
50.1430.1430.1430.1430.1430.1430.143
60.1670.1670.1670.1670.16700.167
70.20.20.2000.20.2
80.33300.333000.3330
90.200.200.20.20.2
Table 10. Job complexity composite value.
JobEvaluation ValueJobEvaluation ValueJobEvaluation ValueJobEvaluation ValueJobEvaluation Value
10.17936110.16418210.05073310.22105410.21493
20.10192120.21157220.09203320.26238420.11541
30.11950130.11247230.20843330.20488430.09867
40.16417140.20605240.10222340.21949440.16750
50.09918150.08890250.09201350.12193450.23186
60.11348160.11514260.20135360.14264460.05992
70.14171170.27778270.17924370.32119470.08991
80.21129180.24278280.22081380.25532480.21254
90.13527190.27888290.13795390.25957490.20469
100.18522200.04401300.11712400.25966
Table 11. Production data of the safety operators in an iron and steel enterprise.
Serial NumberCategoryNumerical Value
1Profit per unit product405 yuan
2Unit hour output500 ton
3Scrap profit−2370 yuan
4Calendar time8760 h
5Scheduled downtime588 h
6The first i job assessment downtime0.6 h
7The i job unreliable conversion into non-qualified product coefficient0.02
8 j man i job fixed salary3000 yuan
9Annual total fixed wages324,000 yuan
10Unit time assessment coefficient6000 yuan/hour
11Annual order quantity3,000,000 ton
12Annual total human shutdown ceiling70 h
13Annual maximum number of rejected items408,600 ton
14Total labor cost ceiling700,000 yuan
15 j the length of a person’s downtime in i jobTable 12
Table 12. Downtime data of some the j-th operator in the i-th job.
P J123456789101112
11.62941.81160.25401.82681.26470.19510.55701.09381.91501.92980.31521.9412
21.50940.55211.35941.31020.32520.23800.99671.91950.68081.17050.44761.5025
30.02380.67420.32441.58860.62241.05710.33131.20400.52591.30821.37841.4963
40.24660.36780.47990.83450.09931.80541.88960.98170.97850.67541.80010.7385
51.01701.02151.63531.58971.28860.75721.62321.06570.70151.87801.75191.1003
61.46070.97721.15710.47450.91771.92621.09361.04230.46320.97781.24811.3583
70.97980.33591.95741.42541.00090.94220.11921.36390.08490.14291.04330.1935
81.47570.53820.84571.09571.88550.83551.96610.60291.40221.33271.07831.3962
91.63550.52151.18870.04500.85050.62540.32300.35750.84580.18851.19700.9418
100.44811.33571.68880.68891.56101.35070.01341.20430.77351.83200.00230.9249
110.91751.32391.54060.70041.32400.83231.68391.66580.51291.22691.16451.0815
121.04010.69540.30001.17220.52430.08891.50990.48560.88481.37560.71851.4727
Table 13. Human waste rate matrix.
Staff Job123456789101112
10.01750.01560.01630.01730.01550.01610.01690.01790.01670.01760.01730.0179
20.01810.01670.01720.01800.01670.01710.01770.01840.01750.01820.01840.0170
30.01730.01530.01600.01710.01510.01580.01660.01770.01640.01740.01710.0177
40.01730.01530.01600.01710.01510.01580.01660.01770.01640.01740.01710.0177
50.01710.01490.01570.01690.01480.01550.01640.01760.01620.01720.01690.0176
60.01800.01650.01700.01780.01640.01680.01750.01830.01730.01810.01780.0183
70.01720.01500.01580.01690.01490.01550.01640.01760.01630.01730.01690.0176
80.01760.01570.01640.01730.01560.01620.01690.01790.01680.01760.01730.0179
90.01780.01610.01670.01760.01600.01650.01720.01810.01710.01790.01760.0181
100.01790.01630.01690.01770.01620.01670.01740.01820.01720.01800.01770.0182
110.01840.01720.01760.01820.01710.01750.01800.01860.01790.01840.01820.0186
120.01760.01580.01640.01740.01570.01620.01700.01800.01680.01770.01740.0180
Table 14. Optimal solution.
i12345678910111213141516171819202122232425262728293031323334353637383940414243444546474849
j
10000010000000000000000000000000000000000000000000
20100000000000000000000000000000000000000000000000
30000000000000000000000000000000000100000000000000
40000000000000000000000000010000000000000000000000
50000000000000000000000000000000100000000000000000
60000000000000000000000000000000000000000000000001
70000000000000001000000000000000000000000000000000
80001000000000000000000000000000000000000000000000
90000000001000000000000000000000000000000000000000
100000000000100000000000000000000000000000000000000
110000000000000000000000000000000000000001000000000
120000000100000000000000000000000000000000000000000
130000000000000000000010000000000000000000000000000
140000000000000000000000000000000000000000000010000
150000000000001000000000000000000000000000000000000
160000000010000000000000000000000000000000000000000
170000100000000000000000000000000000000000000000000
180000001000000000000000000000000000000000000000000
190000000000000000000000100000000000000000000000000
200000000000000000100000000000000000000000000000000
210000000000000000000000000000000000000000100000000
220010000000000000000000000000000000000000000000000
230000000000000000000000000000100000000000000000000
241000000000000000000000000000000000000000000000000
250000000000000000000000000000000000000000000100000
260000000000000000000000000000000000000000000000010
270000000000000000000000000100000000000000000000000
280000000000000000000000000000000000000000000001000
290000000000000010000000000000000000000000000000000
300000000000000000000000010000000000000000000000000
310000000000000000000000000000000000000000001000000
320000000000000000000000000000000000000000010000000
330000000000000000000000000000000000000000000000100
340000000000000000000100000000000000000000000000000
350000000000000000000001000000000000000000000000000
360000000000000000000000001000000000000000000000000
370000000000000000000000000000010000000000000000000
380000000000000000000000000001000000000000000000000
390000000000000000000000000000000000000010000000000
400000000000000000000000000000000000000100000000000
410000000000000000000000000000000000010000000000000
420000000000000000010000000000000000000000000000000
430000000000000000000000000000000001000000000000000
440000000000000000000000000000001000000000000000000
450000000000000000001000000000000000000000000000000
460000000000000100000000000000000000000000000000000
470000000000000000000000000000000001000000000000000
480000000000000000000000000000000010000000000000000
490000000000010000000000000000000000000000000000000
Table 15. The influence of parameter changes on the optimal solution of the system (sensitivity analysis).
Parameter t i j i j δ
Parameter Change Rate (%)−50/0/+50−50/0/+50−50/0/+50
The corresponding cost of different parameter changes (10,000 yuan)Human failure downtime cost1469/3034/37412974/3034/30453034/3034/3034
Cost of defective products18,882/18,837/19,0639493/18,837/28,19718,837/18,837/18,837
Labor cost345/298/277298/298/298240/298/347
Total cost20,696/22,169/23,08112,765/22,169/31,54022,043/22,169/22,432

