Article

Optimization of Cyanidin-3-O-galactoside Production from Aronia melanocarpa Elliot from Nonthermal Ultrasonic Extraction Process by Response Surface Methodology

Department of Food Science and Engineering, Seowon University, Cheongju 28674, Korea
Appl. Sci. 2019, 9(6), 1203; https://doi.org/10.3390/app9061203
Submission received: 25 February 2019 / Revised: 9 March 2019 / Accepted: 19 March 2019 / Published: 21 March 2019
(This article belongs to the Section Applied Biosciences and Bioengineering)

Abstract

:
As a nonthermal process, ultrasonic extraction was optimized to obtain 13.21 mg/g of highly bioactive but extremely heat-sensitive cyanidin-3-O-galactoside (C3G) from Aronia melanocarpa Elliot under the following conditions; 75 kHz input frequency, 18.8 °C for the temperature, and 6.0 h process time. This yield was higher than 10.01 mg/g from a conventional juice extraction and was also higher than those from other reported sources. This concentration was proved to be very close to the predicted value of 13.70 mg/g from the quadratic model, with a regression coefficient of 0.969. This model also showed highly significant effects from changing frequency and time, and less significant effects from changing temperature. The extract from the optimized process showed 89.5% of higher DPPH radical scavenging activity than 71.3% from the conventional process. It was also found that the antioxidant activity of the extract was higher than that of using 13 µg/mL of C3G alone, possibly due to the synergistic effects of C3G with the other bioactive substances in the extract. Therefore, this optimized nonthermal process will be applied to obtain fairly high amounts of a thermally unstable and expensive C3G with fewer purification steps.

1. Introduction

Various cultivars of Aronia melanocarpa (Aronia), the so-called black chokeberry, have been cultivated and consumed all around the world, as this plant contains high amounts of anthocyanins, which have various biological activities such as anti-inflammation, anticancer, immunomodulation, and antiaging abilities, due to the strong antioxidant activities of these compounds [1,2,3]. In particular, Eastern European countries like Poland have produced substantial amounts of aronia fruits and consumed them with various types of by-products, such as aronia extract in the forms of functional juices and cordial liqueurs, fruit powders, and teas from its leaves [4,5]. Among various anthocyanins, cyanidin-3-O-galactoside (C3G) has the highest concentration in aronia, followed by cyanidin-3-O-glucoside, cyanidin-3-O-arabinoside, and other phenolic compounds, in the ranges of 0.5% (w/w) to 2.5% (w/w) depending on the varieties, culture conditions, etc. [6,7]. Aronia has been studied to utilize the efficacies of C3G and other anthocyanins in the fields of functional foods, cosmetics, medicines and other bioindustries [8,9,10]. However, because most anthocyanins found in nature, including C3G, are extremely unstable and particularly heat-sensitive, the application of extracting C3G from aronia has been greatly restricted. Moreover, due to the ease in damaging C3G during the purification process, this process requires several additional steps that are labor-intensive and requires many pieces of equipment for purification, the results of which lead to a high cost for obtaining pure C3G, thus limiting its industrial applications [11,12,13]. Most studies on C3G from aronia have been performed on the crude extracts, juice extracts, and/or partially purified extracts obtained by various types of pressing processes at room temperature or lower [3,14,15,16], so as not to break down C3G with high temperature. Especially, at higher than 60 °C for 8–10 h, 30–40% of total anthocyanins in the juice extracts were broken along with more than 50% loss of its biological activities [11,14]. However, these processes could not yield sufficient concentrations of C3G and other anthocyanins in the extracts to guarantee the efficacy of the extracts for use in applications, since pressing processes are not generally known to yield high extraction efficiencies compared to those of other solvent extraction processes [14,15,17,18]. Because of these limitations, the applications of C3G and/or extracts of aronia have been limited in industrial fields, even though various drying and production processes have been employed [11,18,19]. Therefore, several nonthermal extraction processes to obtain high amounts of C3G in the extracts from aronia have been carried out under low-temperature conditions, such as ultrasonic or ultrahigh pressure extraction processes [20,21,22,23,24]. Among those nonthermal processes, ultrasonic extraction processes have shown some promising results for extracting relatively higher amounts of C3G at low temperature than for those of traditional pressing processes, yielding 7–11 mg/g of relatively high amounts of C3G from various combined extraction processes [20,25]. However, ultrasonic extraction for processing aronia still has several hurdles to overcome; for example, the process must be operated under proper conditions to maintain efficiency and to obtain high yields with less input energy, which should be an important consideration for scaling up for industrial applications. Moreover, in general, low-temperature extraction has been considered to have relatively low yields, but this is a critical consideration for industrial scale-up of the production processes even though ultrasonic processes have been successfully scaled up to 5 ton of a working volume with more efficient ultrasonic generators [17]. Besides these limitations, the optimization of proper ultrasonic extraction parameters has not intensively been studied to maximize the production yields and to provide the economic feasibility of ultrasonic processes by effectively inducing cell wall crushing through high energy cavitation even at low temperatures, even though this process must have a good merit of processing aronia [17,26,27]. Moreover, detail analysis of ultrasonic extraction has not been much considered by correlating with each process parameter such as in put frequency, process time, and temperature associated with its yields and also biological activities. Therefore, in this work, a more comprehensive study on optimizing the ultrasonic extraction parameters, such as process temperature, time, and input frequency, was carried out to obtain very high amounts of intact C3G from aronia, and the efficacies of the extracts obtained from the optimized process were studied to assess the superiority of the optimized ultrasonic extraction for processing aronia.

2. Materials and Methods

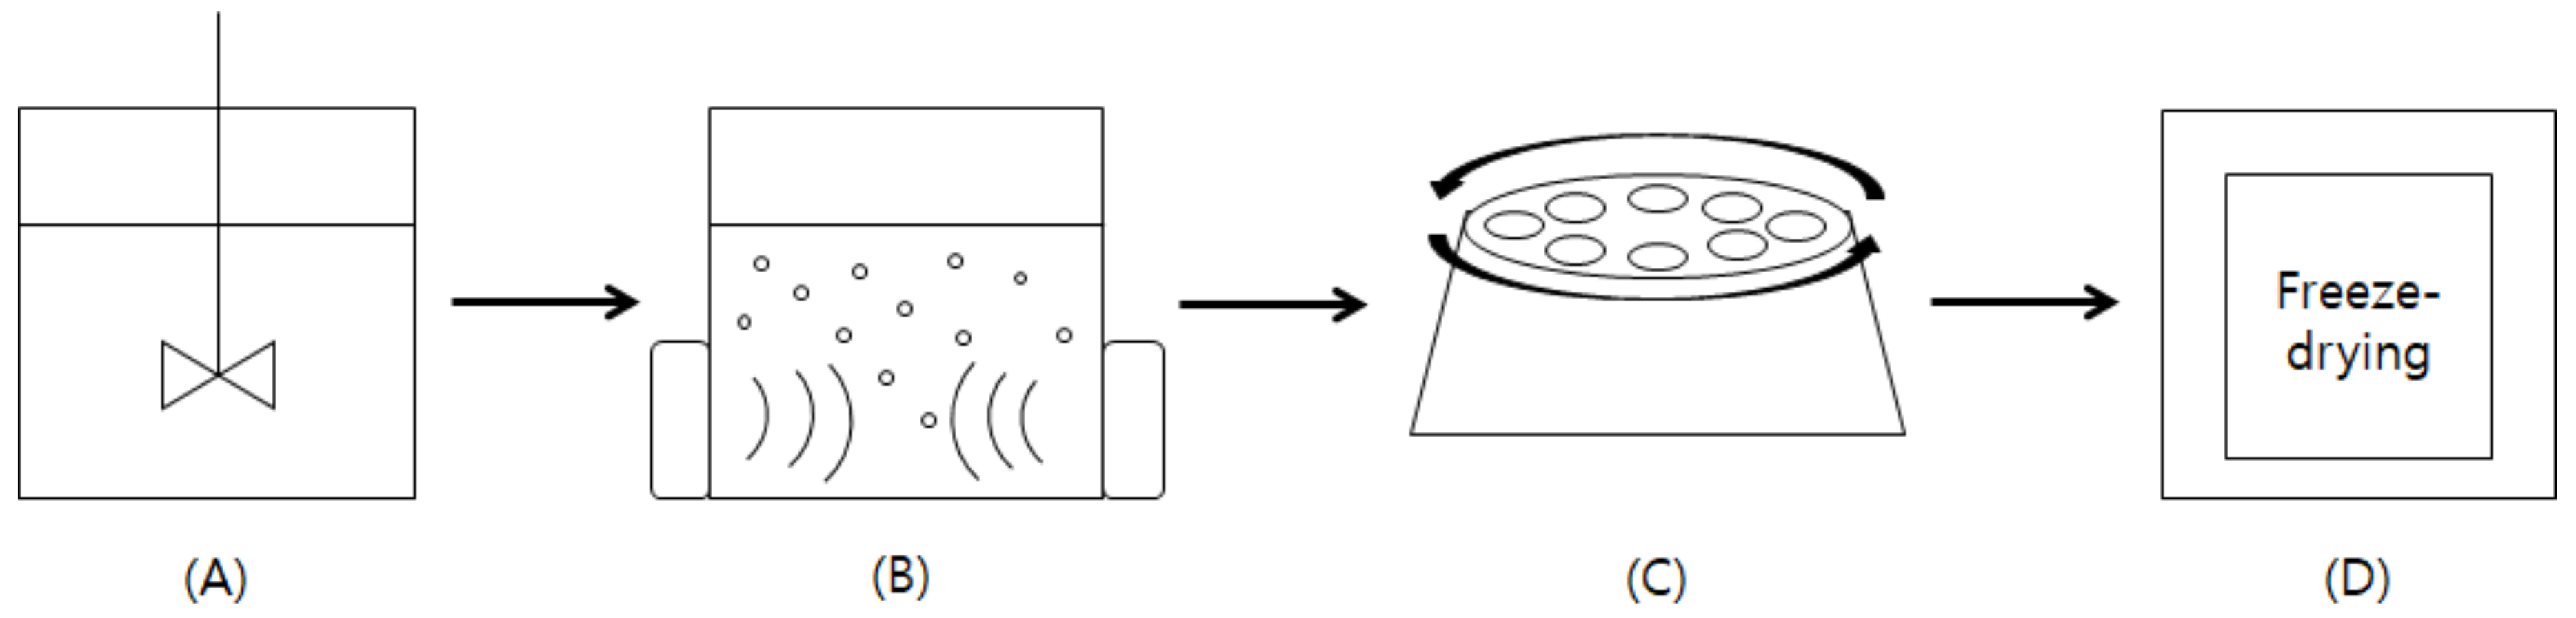
2.1. Preparation of the Samples

One kilograms of the dried fruits of Aronia melanocarpa Elliot (cultivated with organic farming method and harvested, and also dried in the shade in Danyang, a mountain area of central Korea in 2017) was mixed with 100 mL of 70% ethanol for 1 h and pressed at room temperature by a juice extractor (10 L working volume, KP-32, Shinil, Seoul, Korea) equipped with an oil pump screw type presser (DB-23, Donbo, Incheon, Korea) and a 30 µm pore size stainless steel filter for ~15 min. The filtrated cake was pressed again by a juice extractor to get more extracts from the residues, and then two filtrates from each process were mixed together to make the final control extract. After that, the filtrates were separated by a centrifuge (CF-1R, Ilshin, Dongducheon, Korea) at 4200 g for 10 min. Then, the extracts were further concentrated using a vacuum evaporator (N series, Eyela, Tokyo, Japan) at room temperature and freeze-dried using a lyophilizer (PVTFA, Ilshin, Dongducheon, Korea) to make the juice extract powder which served as a control. For the ultrasonic extraction, 1 kg of dried fruit was mixed with 10 L of 70% ethanol and placed into an ultrasonic extractor (20 L total working volume, AUG-900, Asia Ultrasonic co., Gyeonggi, Korea) with a multicontroller that can allow for the varying of the frequency and temperature, and the extraction was performed under the following conditions; a frequency range of 20–100 kHz at fixed input power of 120 W, a temperature range of 15–35 °C, and an extraction time range of 2–6 h. The ranges of these parameters were determined from preliminary experiments. After ultrasonic extraction, the extracts were maintained for 6 h at room temperature to extract more C3G. Then, the extracts were filtered through filter paper and made into a powder by following the same procedures used to prepare the juice extract powder. Powders were stored at −4 °C until the experiments were performed. A schematic diagram of the ultrasonic extraction process is shown in Figure 1.

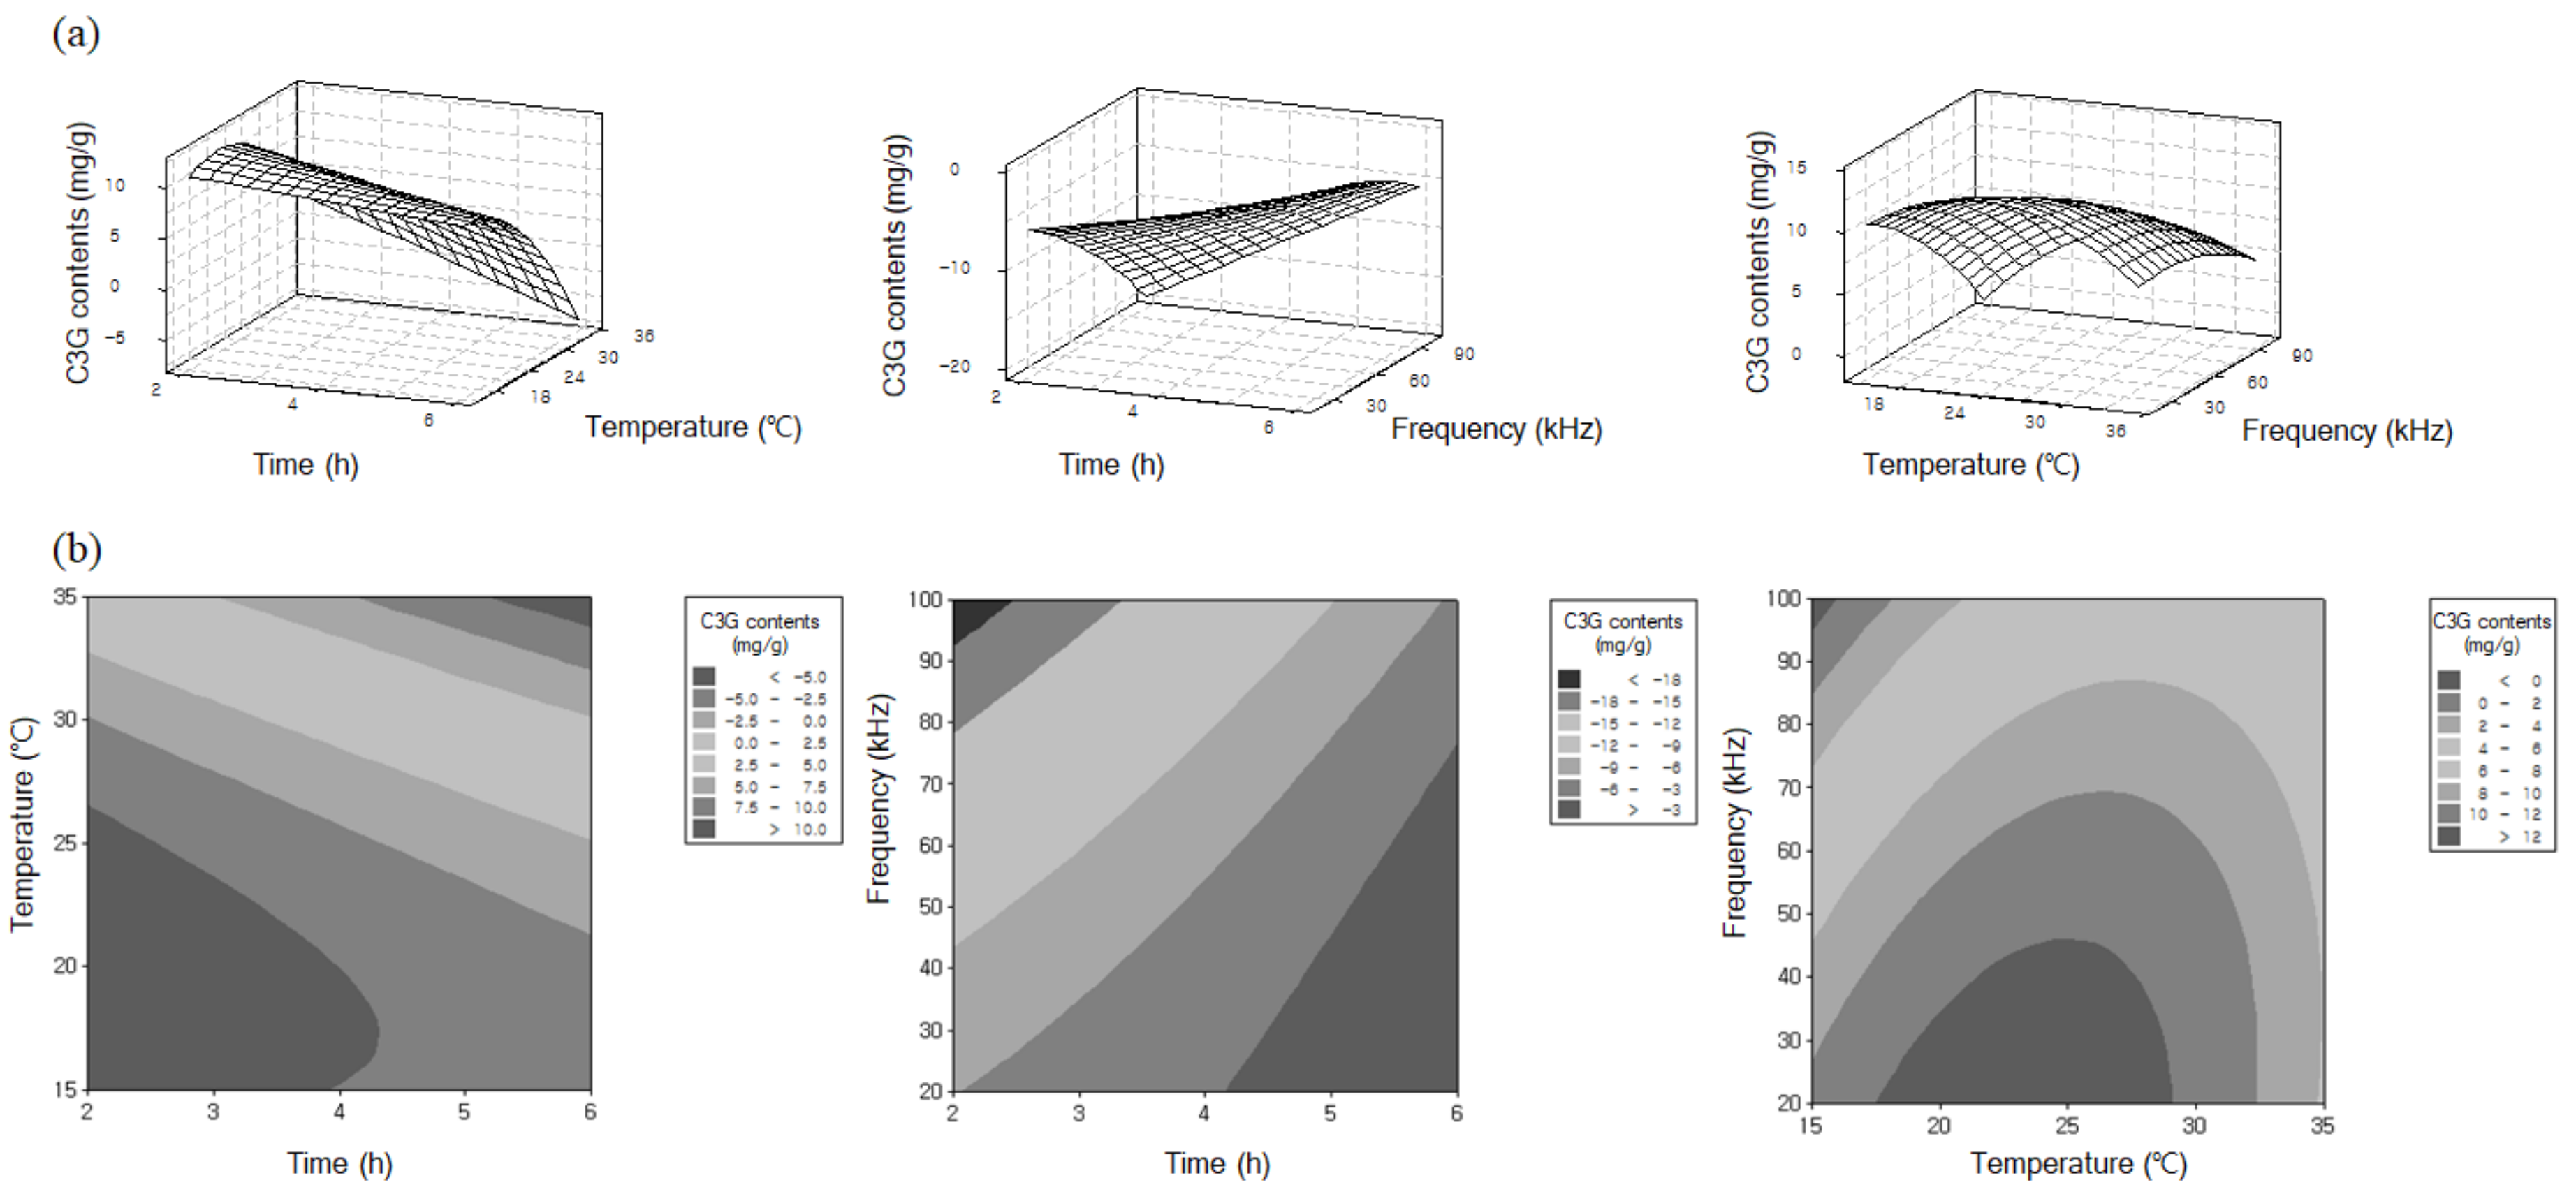
2.2. Experimental Design

The extraction of C3G from aronia was optimized by the Response Surface Methodology (RSM). Table 1 shows the coded and uncoded values of the three independent variables—extraction time (X1, 2–6 h), temperature (X2, 15–35 °C), and ultrasonic frequency (X3, 20–100 kHz)—defined by central composite design (CCD) at 5 levels with 20 experimental runs and three replicates. A mathematical model was designed as follows
Y =   β 0 + i = 1 k β i X i + i = 1 k β i i X i 2 + i = 1 k 1 i = 2 k β i j X i X j Y =   β 0 + i = 1 k β i X i + i = 1 k β i i   X i 2 + i = 1 k = 1 i = 2 k β i j X i X j
where Y is an independent variable of the C3G content in the extracts, β0 is the constant coefficient, βi is the linear coefficient for the main effect, βii is the quadratic coefficient, and βij is the interaction coefficient. The adequacy of the proposed quadratic model was evaluated by the regression coefficient R2, between that of the experimental and predicted data [28]. Antioxidant effects of the extracts from the optimized ethanol and conventional juice extraction processes were also compared to confirm the validity of the experimental model.

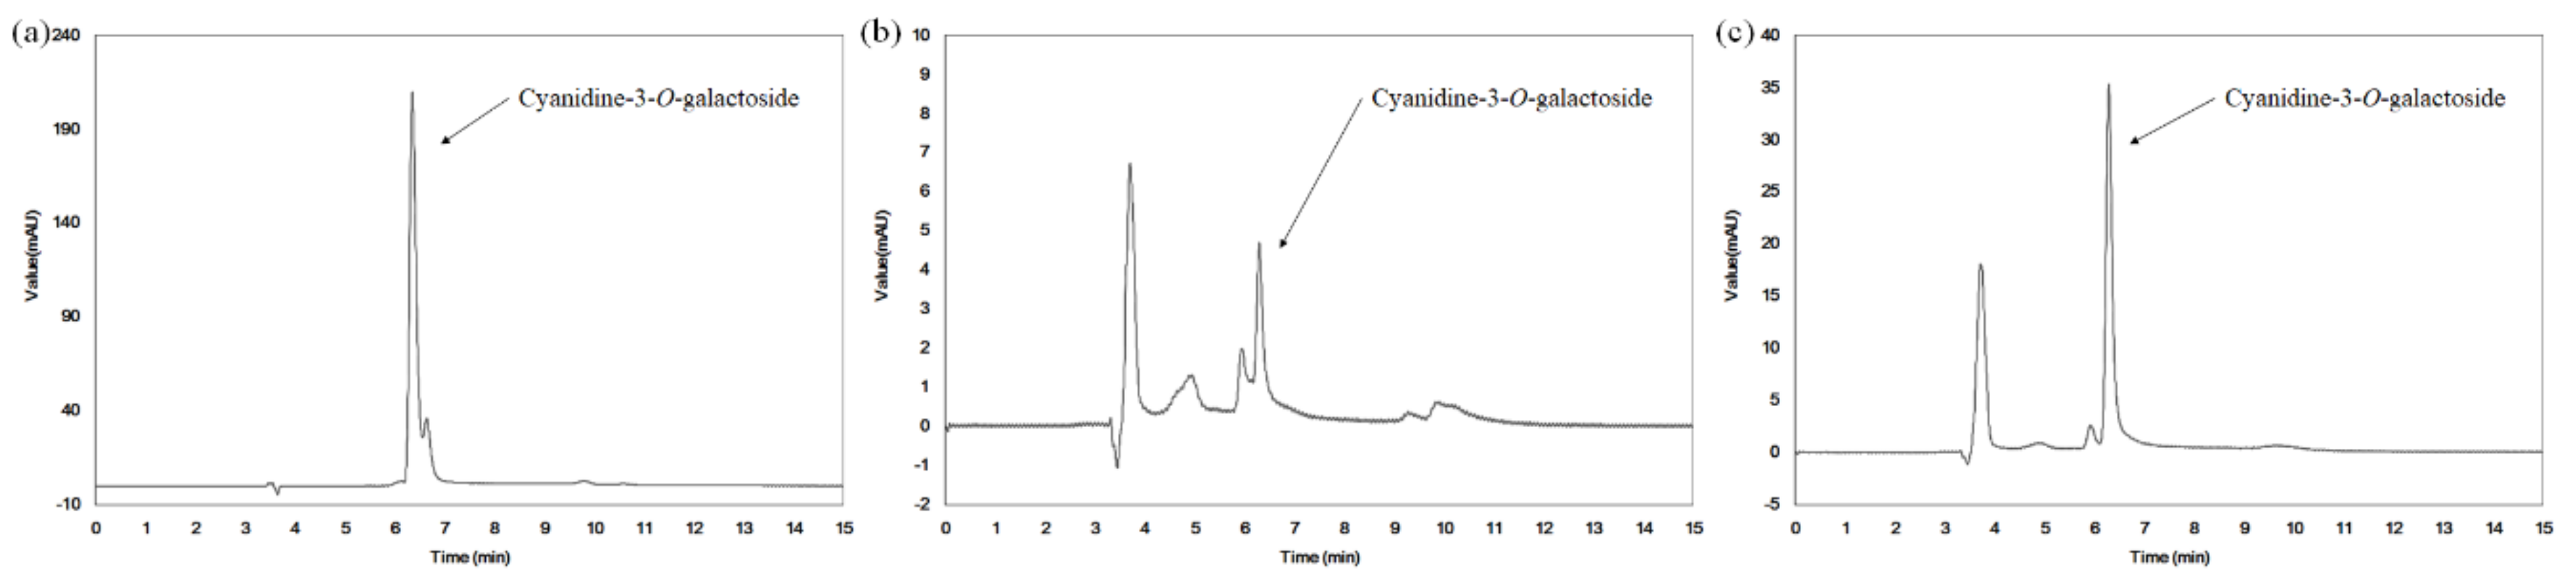
2.3. Determination of the C3G Contents in the Extracts

To measure the concentrations of C3G in the extracts, High-Pressure Liquid Chromatography (HPLC, Surveyor, Thermo Finnigan, San Jose, CA, USA) was used with a C18 column (4.6 × 150 mm, 5 μm, Luna, Phenomenex, Torrance, CA, USA) at 25 ºC and 1.0 mL/min of flow rate under the following conditions; elution solvent was 1% formic acid and mobile phase of (A) water and (B) acetonitrile with the following gradient; 0% B at 0–2 min, 0–100% B at 2–10 min, 100–70% B at 10–12 min, and 70–0% B at 12–15 min. Sample injection volume was 10 μL after being diluted with 1:50 (v/v) of elution solvent, only to show a main peak of C3G in the chromatograms. The absorbance was measured by a UV detector (Alts-10, Waltham, MA, USA) at 520 nm and compared with the peak areas of 100 ppm of a standard C3G (Sigma, St. Louis, MO, USA) [29].

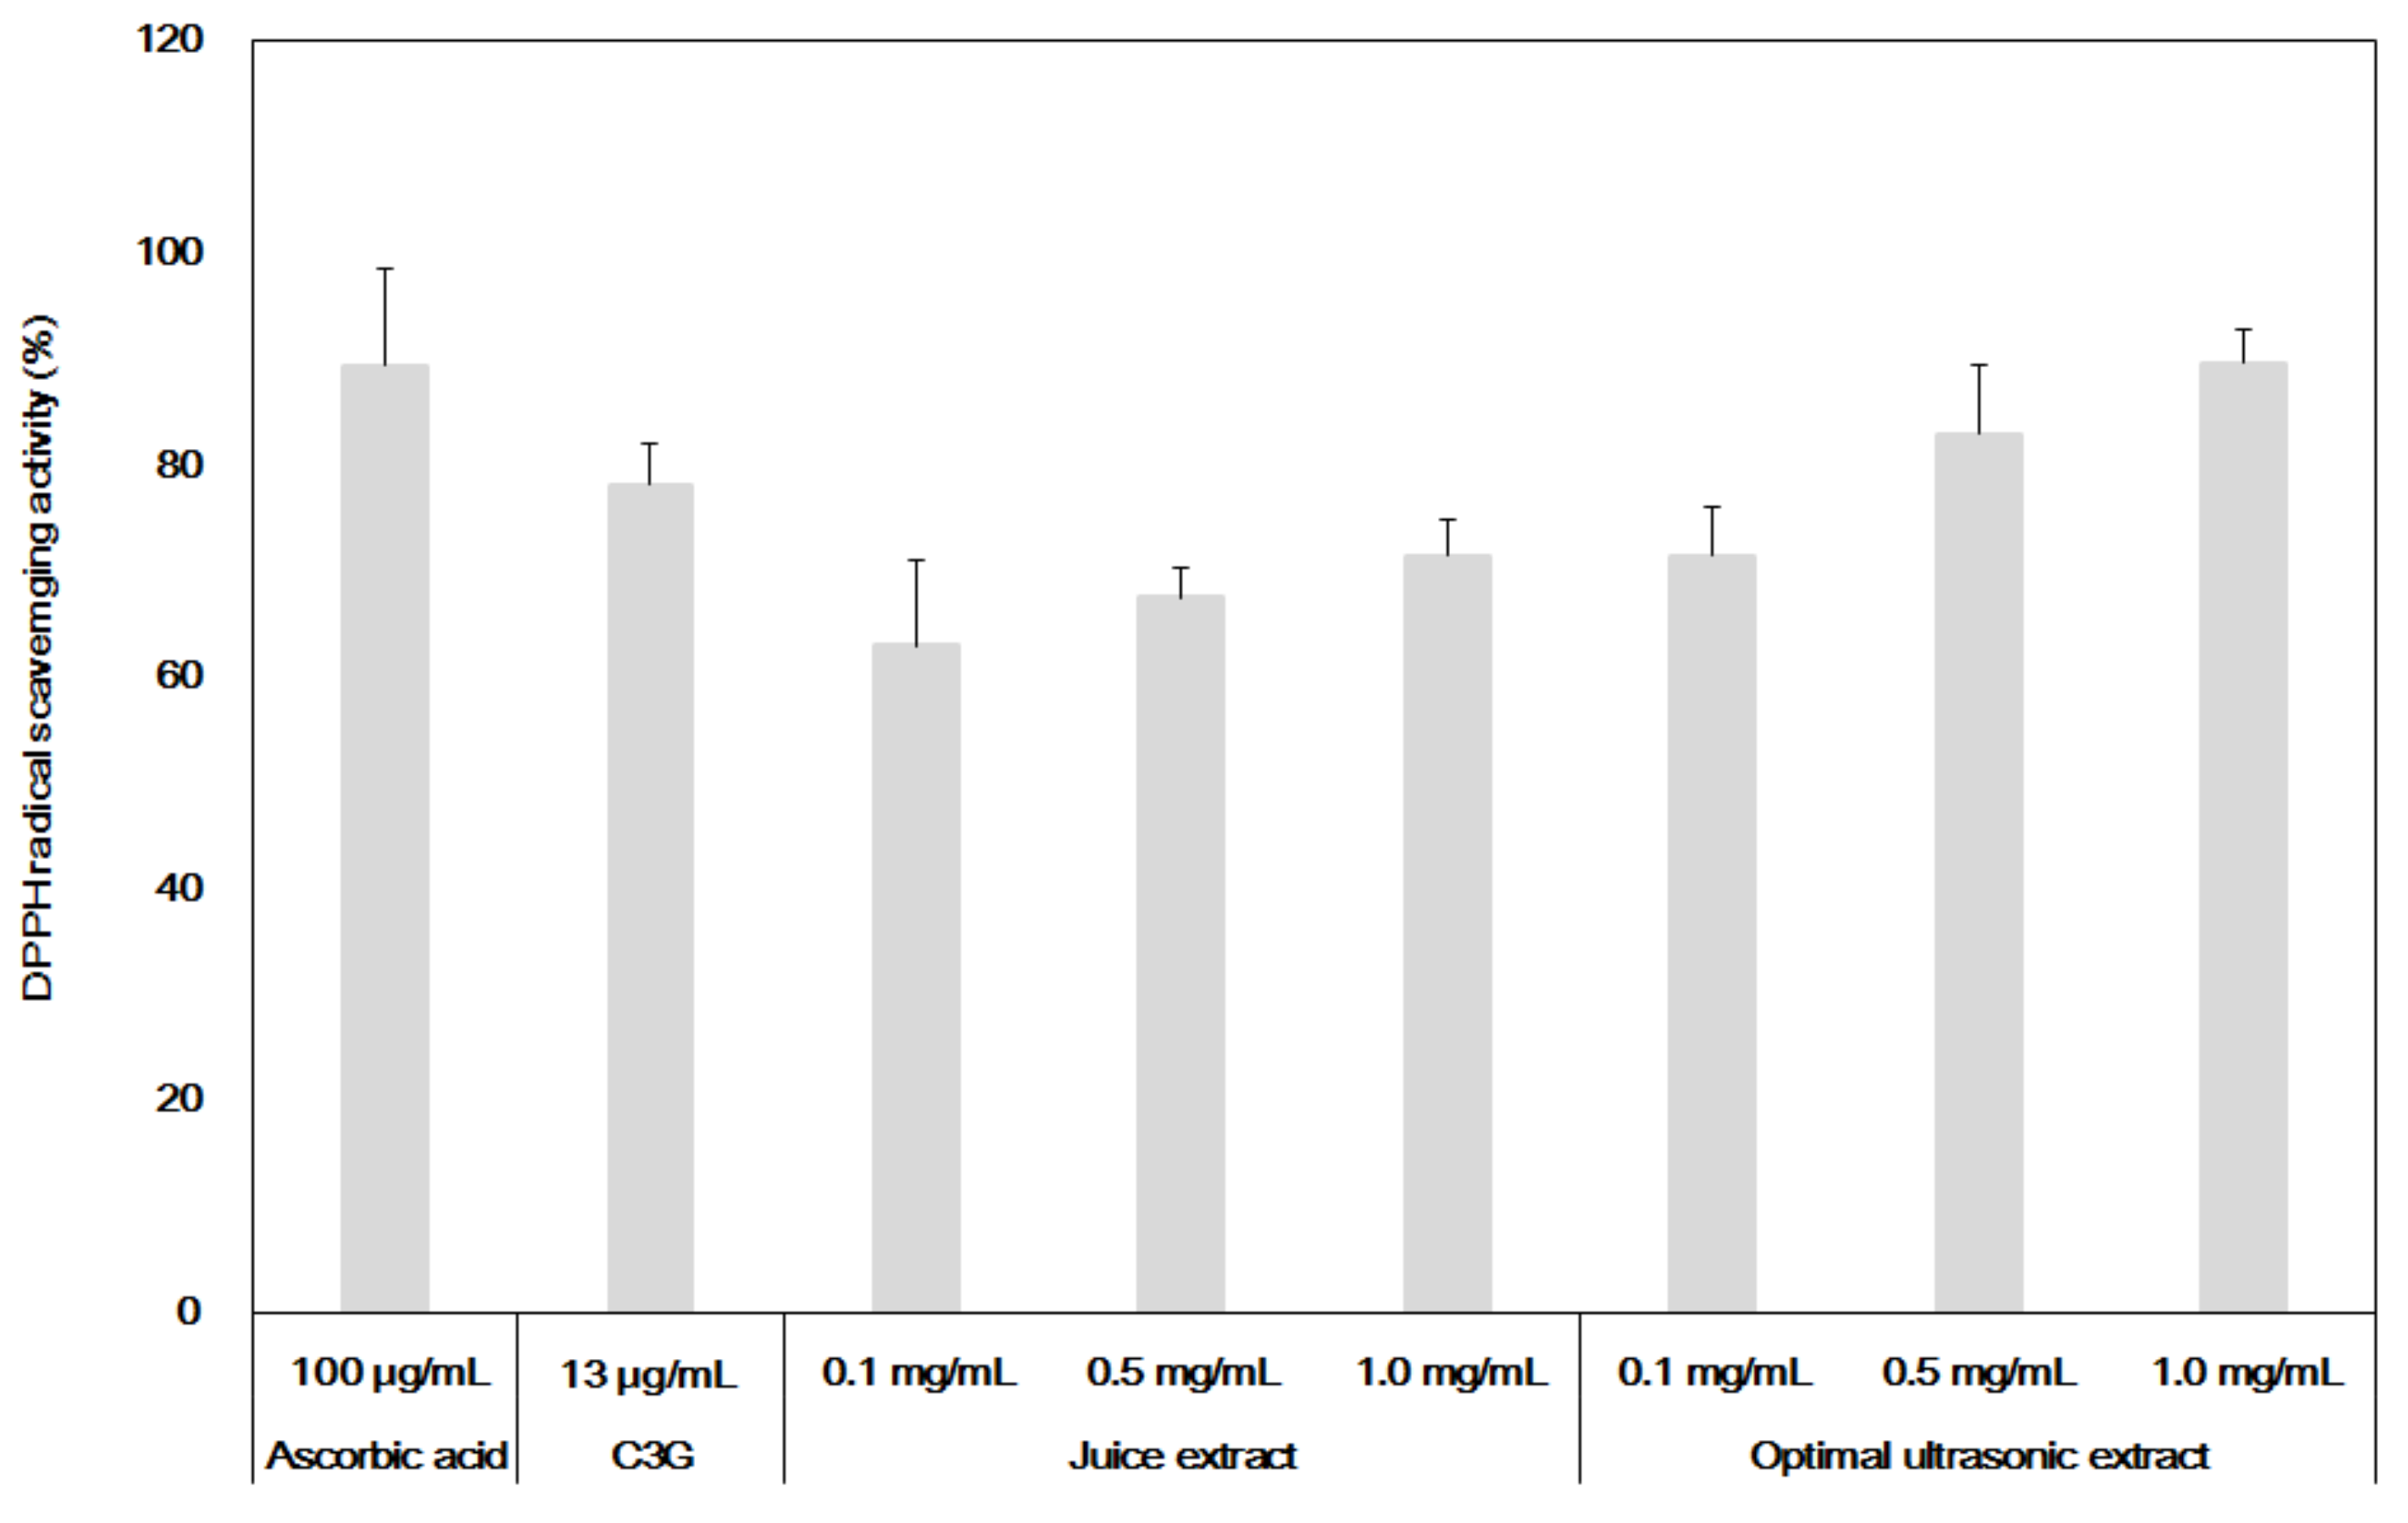
2.4. Measurement of Antioxidant Activities of the Extracts

To evaluate the antioxidant activities of the extracts, the α,α-diphenyl-β-picrylhydrazyl (DPPH) free-radical scavenging activity was measured by the Dietz method [30]: After mixing 150 μL of 0.1 mM DPPH solution prepared with methanol as the solvent with either 150 μL of the extract or 13 μg/mL of C3G, then the mixture was wrapped in foil to block light and left unattended for 30 min at room temperature. Thereafter, the absorbance was measured at a wavelength of 517 nm by a microplate reader (Thermo Fisher Scientific, Waltham, MA, USA). The relevant values were estimated as percent DPPH radical scavenging activity (%).

2.5. Statistical Analysis

All experiments were performed three times and expressed as the mean ± SD. Data were analyzed by the generalized linear model (GLM) procedure of the Statistical Analysis System (SAS, version 9.1, SAS Institute, Cary, NC). The data were also analyzed by the one-way Analysis of Variance (ANOVA) test and significantly difference was set to p < 0.05.

3. Results and Discussion

Table 1 shows the results for estimating the content of C3G (Y) for each experiment under the various extraction conditions as independent variables (X1, X2, and X3), as designed by the CCD. In general, the amount of C3G in the extracts was increased the most by an increase in the ultrasonic frequency, followed by an increase in the process time, while the yield of C3G was sharply decreased as the temperature was increased. This result confirmed the susceptibility of C3G to heat, with serious destruction occurring at 35 °C. The highest C3G content, 12.88 mg/g, was obtained from the extraction at 60 kHz and 20 °C for 5 h, and this value was much higher than the 10.01 mg/g C3G in the juice extract powder reportedly obtained from a conventional method of processing aronia [11,13,31]. Similarly, the concentration of C3G in the extract from the optimized process was also found to be higher than 3.0–10.5 mg/g from other extraction processes with water or 70% ethanol, even though some of the results showed exceptionally high concentrations of above 15 mg/g in their extracts, values of which were not often reproducible [32]. This result strongly implies that the ultrasonic extraction is an effective process for extracting C3G from aronia at low temperatures, and this optimized process can yield high amounts of intact C3G. Table 2 and Table 3 show the results of the ANOVA and the RSM model, resulting in the following quadratic Equation (2).
Y = −6.19705 + 0.94378X1 + 1.81871X2 − 0.12436X3 − 0.00673X12 − 0.04127X22 − 0.00083X32 − 0.09196X1X2 + 0.02641X1X3 + 0.00522X2X3
where the regression coefficient (R2) of this quadratic model was estimated as 0.956, which tells us this model was a good fit. The linear, quadratic, and total model regressions were also highly significant (p < 0.05), except for the cross-products, such as X1X2 (p < 0.01), X1X3 (p < 0.01), and X2X3 (p < 0.05).
Figure 2 also illustrates the three-dimensional response surfaces and contour plots for the C3G contents as a function of the three variables ultrasonic frequency, process temperature, and extraction time. The saddle point of each plot well represented the optimal conditions that can obtain the highest concentration of C3G in the extract, considering each of two processes.
As shown in Table 1, the amount of C3G in the extracts was most significantly increased by an increase in the frequency in the range of 20 to 60 kHz, but the extraction was not much more effective at frequencies above 80 kHz. The contents of C3G were also increased as the process time increased from 3 to 6 h, which shows that longer process times can be helpful to increase the yield of C3G. However, the concentrations of C3G in the extracts were significantly decreased by an increase in the temperature from 30 to 35 °C. This result could have been due to the breakdown of C3G in the extracts at higher temperatures, as similar results have been reported elsewhere [11,14].
The results imply that ultrasonic treatment is an effective process to obtain heat-labile components from natural sources with a lower temperature and shorter time than those of conventional methods. To validate the model of Equation (2), Table 4 compares the contents of C3G from experimental results with the predictive model, operated under the optimal conditions determined by ridge analysis (Minitab release ver. 14.12.1, Minitab Inc., State College, PA, USA, 2015). The model estimated a concentration of 13.70 mg/g of C3G under optimal conditions, and from the experiment with those same conditions, 13.01 mg/g of C3G was obtained, which is within ca. 95% similarity. Therefore, this result clearly confirms that the proposed quadratic model was well designed. The amount of C3G from this optimal extraction condition was also the highest concentration obtained from aronia, as compared to the concentrations estimated in Table 1. This concentration was similar to or even higher than other reported data from various extraction conditions [6,33].
Figure 3 compares the HPLC chromatograms of C3G in the extracts from the conventional juice extraction process and this optimized ultrasonic process. It was very clear that higher amounts of C3G were obtained from the optimal extraction process than from conventional juice extraction even though the minor tailing of the peaks of the standard C3G was observed in Figure 3a, which would not much affect the measurement of actual concentrations of C3G in the extracts. Therefore, it can be concluded that this optimized process can be employed to yield a high quality extract containing high amounts of intact C3G, which can possibly reduce the production costs of purifying C3G and increase the efficacy of the extract itself. To confirm this hypothesis, Figure 4 compares the antioxidant activities of the extracts from the two different processes. The activities were also compared with the data from adding 13 μg/mL of C3G alone as a positive control, whose concentration was equivalent to the amount of C3G present in 1.0 mg/mL of the extracts, based on the results of Table 4. In general, the higher the concentration of C3G used in the treatment, the better the antioxidant activity. Specifically, even at the same dose of 1.0 mg/mL, the extract from the optimal conditions had higher activity than that from a conventional juice extraction, 89.5% vs. 71.3%, respectively. This difference in antioxidant activity between the two extracts could well reflect the difference of C3G content under the same treatment concentration of the extracts, with 13.01 mg/g vs. 10.01 mg/g of C3G in the extracts from the optimal and conventional processes, respectively.
Interestingly, adding 13 μg/mL of C3G alone did not show the same the antioxidant activity as that of adding 1.0 mg/mL of the extract from the optimal process, even though the extract contained the same amount of C3G. However, the antioxidant activity of adding 13 μg/mL of C3G alone was better than that of adding 1.0 mg/mL of the juice extract that contained a lower C3G concentration of 10.01 mg/g. These results clearly indicate that the antioxidant activities of the extracts from aronia were mainly due to the amount of C3G but that the higher antioxidant activity of the extract from the optimized process might have been due to synergistic effects of C3G with other biologically active substances in the extracts, since the optimized process can yield higher contents of both C3G and other components. Taken together, these results suggest that aronia extract from an optimized ultrasonic extraction process could be used as a high quality, functional food that has strong antioxidant activities and that it is not necessary to prepare a highly purified C3G from the extracts.

4. Conclusions

This work was the first to show that high contents of extremely heat-labile C3G from A. melanocarpa Elliot can be obtained by optimizing ultrasonic process parameters such as input frequency, process time, and temperature. This process was found that the ultrasonic frequency and process time are very important for C3G extraction, and it is clearly shown that at higher process temperatures, C3G was greatly degraded. It was also confirmed that the extracts from the optimized ultrasonic process have higher C3G concentrations and show higher antioxidant activity than those from a conventional juice extractor, a common process with less efficiency so far. The antioxidant activity of C3G alone was lower than that of the extract containing the same concentration of C3C, possibly due to synergistic effects of C3G with other biologically active components extracted from the optimized process. However, further investigation should also be carried out to confirm more detail mechanism of its synergistic effects. In this work, strong antioxidant activities of the extracts were attributed mainly to the C3G content of the extracts. In conclusion, this optimal ultrasonic extraction process can yield high-quality aronia extracts containing very high amounts of intact C3G, and fewer purification steps reduces the production cost needed to obtain high purity and yield of C3G. In conclusion, this optimal ultrasonic extraction process can yield high-quality aronia extracts containing very high amounts of intact C3G, which could also reduce purification steps to obtain high purity and yield of C3G. The results also suggest that by optimizing ultrasonic parameters at low temperatures, high extraction yields of heat-sensitive substances from many various natural sources including aronia can be expected.

Author Contributions

H.Y.L. designed the whole experiment and drafted the manuscript. The author read and approved the final manuscript.

Conflicts of Interest

The author declares no conflicts of interest.

References

  1. Jaroniewski, W. Aronia czarnoowocowa w lecznictiwie i dietetyce. Wiad. Zielar. 1998, 40, 20–25. [Google Scholar]
  2. Korkiewicz, A.; Jaremicz, Z.; Luczkiewicz, M. Aronia plants: A review of traditional use, biological activities, and perspectives for modern medicine. J. Med. Food. 2010, 13, 255–269. [Google Scholar] [CrossRef]
  3. Valcheva-Kuzmanova, S.; Kuzumanov, K.; Tancheva, S.; Belcheva, A. Hypoglycemic and hypolipidemic effects of Aronia melanocarpa fruit juice in streptozotocin-induced diabetic rats. Methods Flin. Exp. Clin. 2007, 29, 101–105. [Google Scholar] [CrossRef] [PubMed]
  4. Gonzalez-Molina, E.; Moreno, D.A.; Garcia-Viguera, C. Aronia-enriched lemon juice: A new highly antioxidant beverage. J. Agric. Food. Chem. 2008, 23, 11327–11333. [Google Scholar] [CrossRef] [PubMed]
  5. McKay, S.A. Demand increasing for aronia and elderberry of commercial red fruit juice concentrates as ingredients for antioxidant functional juice. N. Y. Berry News. 2004, 11, 4–6. [Google Scholar]
  6. Choi, K.H.; Oh, H.J.; Jeong, Y.; Lim, E.J.; Han, J.; Kim, H.; Kim, O.Y.; Lee, H.S. Physico-chemical analysis and antioxidant activities of Korea Aronia melanocarpa. J. Korean Soc. Food Sci. Nutr. 2015, 44, 1165–1171. [Google Scholar] [CrossRef]
  7. Oszmianski, J.; Sapis, J.C. Anthocyanin in fruits of Aronia melanocarpa (chokeberry). J. Food Sci. 1988, 53, 1241–1242. [Google Scholar] [CrossRef]
  8. Wojdylo, A.; Oszmianski, J.; Bober, I. The effect of addition of chokeberry, flowering quince fruits and rhuharb juice to strawberry jams on their polyphenol content, antioxidant activity and color. Eur. J. Res. Technol. 2008, 227, 1043–1051. [Google Scholar] [CrossRef]
  9. Bridle, P.; Thimberlake, C.F. Anthocyanins as natural food colors-selected aspects. Food Chem. 1997, 58, 103–109. [Google Scholar] [CrossRef]
  10. Joo, S.Y.; Ryu, H.S.; Choi, H.Y. Quality characteristics of jelly added with aronia juices. Korean J. Food Cook. Sci. 2015, 31, 456–464. [Google Scholar] [CrossRef]
  11. Kasparvicience, G.; Briedis, V. Stability and antioxidant activity of black currant and balck aronia berry juices. Medicina 2003, 39, 65–69. [Google Scholar]
  12. Denev, P.N.; Kratchanov, C.G.; Ciz, M.; Lojek, A.; Kratchanova, M.G. Bioavailability and antioxidant activity of black chokeberry (Aronia melanocarpa) polyphenols: In vitro and in vivo evidence and possible mechanisms of action: A review. Compr. Rev. Food Sci. Food Saf. 2012, 11, 471–489. [Google Scholar] [CrossRef]
  13. Wolski, T.; Kalisz, O.; Prasal, M.; Rolski, A. Black chokeberry-Aronia melanocarpa Elliot-the rich source of antioxidants. Post. Fitoter. 2007, 3, 145–154. [Google Scholar]
  14. Oszmianski, J. Stabilization and application on anthocyanin chokeberry dye to colouring of beverages. Acta Sci. Pol. 2002, 1, 37–45. [Google Scholar]
  15. Plocharski, W.; Zbroszczyk, J.; Lenartowicz, W. Aronia fruit colouranst. 2. The stability of the color of aronia juices and extracts. Fruit Sci. Rep. 1989, 16, 41–50. [Google Scholar]
  16. Saruwatari, A.; Isshiki, M.; Tamsru, I. Inhibitory effect of various beverages on the sulfoconjugation of 17 b-estradiol in human colon carcinoma Caco-2 cells. Biol. Pharm. Bull. 2008, 31, 2131–2136. [Google Scholar] [CrossRef] [PubMed]
  17. Wang, L.; Weller, C.L. Recent advances in extraction of nutraceuticals from plants. Trends Food Sci. 2006, 17, 300–312. [Google Scholar] [CrossRef]
  18. Bermudez-Soto, M.J.; Thomas-Barberan, F.A. Evaluation of commercial red fruit juice concentrations as ingredient for antioxidant functional juices. Eur. Food Res. Technol. 2004, 219, 133–141. [Google Scholar] [CrossRef]
  19. Balcerek, M.; Szopa, J.S. Optimization of the technology of aronia spirit production. Disch. Lebensm Rundsch. 2005, 101, 16–19. [Google Scholar]
  20. Leandro, G.A.; Krasimir, D.; Peggy, V.; Iordan, N. Kinetics of ultrasound assisted extraction of anthocyanins from Aronia melanocarpa (black chokeberry) wastes. Chem. Eng. Res. Des. 2014, 92, 1818–1826. [Google Scholar] [CrossRef]
  21. Pool-Zobel, B.L.; Bub, A.; Schroder, N.; Rechkemmer, G. Anthocyanins are potent antioxidants in model systems but do not reduce endogenous oxidative DNA damage in human colon cells. Eur. J. Nutr. 1999, 38, 227–234. [Google Scholar] [CrossRef]
  22. Kim, N.Y.; Lee, J.M.; Lee, J.Y.; Lee, H.Y. Enhancement of anti-obesity activities of Aronia melanocarpa Elliot extracts from low temperature ultrasonification process. Korean J. Med. Crop Sci. 2016, 24, 309–316. [Google Scholar] [CrossRef]
  23. Toma, M.; Vinatoru, M.; Paniwnyk, L.; Masona, T.J. Investigation of the effects of ultrasound on vegetal tissues during solvent extraction. Ultrason. Sonochem. 2001, 8, 137–142. [Google Scholar] [CrossRef]
  24. Choi, W.Y.; Choi, W.S.; Kwon, H.S.; Lee, H.Y. Enhancement of low molecular weight ginsenosides from low-quality ginseng through ultra-high-pressure and fermentation processes. Eur. Food Res. Technol. 2013, 237, 429–440. [Google Scholar] [CrossRef]
  25. Kim, N.Y.; Kim, J.H.; Choi, G.P.; Lee, H.Y. Comparison of anti-skin wrinkle activities of Aronia melanocarpa extracts by extraction methods. Korean J. Med. Crop. Sci. 2014, 22, 217–222. [Google Scholar] [CrossRef]
  26. Chung, K.W.; Kim, W.I.; Hong, I.K.; Park, K.A. Ultrasonic energy effects on squalene extraction from amaranth seed. Appl. Chem. 2000, 4, 149–152. [Google Scholar]
  27. Oh, S.H.; Ahn, J.H.; Kang, D.H.; Lee, H.Y. The effect of ultrasonificated extracts of Spirulina maxima on the anticancer activity. Mar. Biotechnol. 2011, 13, 205–214. [Google Scholar] [CrossRef] [PubMed]
  28. Kim, Y.H.; Kim, W.S.; Kim, J.M.; Choi, S.; Jung, T.D.; Lee, J.H.; Kim, J.D.; Lim, J.K.; Lee, O.H. Optimization of extraction conditions for mixture of Camellia sinensis L. and Artemisia argyi by response surface methodology. J. Food Hyg. Saf. 2016, 31, 278–285. [Google Scholar] [CrossRef]
  29. Marie, B.; Rune, S.; Helle, W.; Cato, B.; Karl, E.M.; Hidle, B. Extracts, anthocyanins and procyanidins from Aronia melanocarpa as radical scavengers and enzyme inhibitors. Nutrients 2013, 5, 663–678. [Google Scholar] [CrossRef]
  30. Dietz, B.M.; Kang, Y.H.; Liu, G.; Eggler, A.L.; Yao, P.; Chadwick, L.R.; Pauli, G.F.; Farnsworth, N.R.; Mesecar, A.D.; Breeman, R.B.; Bolton, J.L. Xanthohumol isolated from Humulus lupulus inhibits menadione-induced DNA damage through induction of quinone reductase. Chem. Res. Toxicol. 2005, 18, 1296–1305. [Google Scholar] [CrossRef]
  31. Stoczynska, A.; Jeddrychowska, I.; Poreba, R.; Affelska-Jercha, A.; Turczyn, B.; Wojakowska, A.; Andrejak, R. Influence of chokeberry juice on arterial blood pressure and lipid parameters in men with mild hypercholesterolemia. Pharmacol. Rep. 2007, 59, 177–182. [Google Scholar]
  32. Wu, X.; Gu, L.; Prior, R.L.; McKay, S. Characterization of anthocyanins and proanthocyanins in some cultivars of ribes, aronia and sanbucus and their antioxidant capacity. J. Agric. Food Chem. 2004, 52, 7846–7856. [Google Scholar] [CrossRef] [PubMed]
  33. Strigl, A.W.; Leitner, E.; Pfannhauser, W. Qualitative and quantitative analyses der anthocyane in Schwarzen apfelbeeren (Aroina melanocarpa Michx. Ell.) mittels TLC, HPLC and UV/VIS-specktometric. Eur. Food Res. Technol. 1995, 201, 266–268. [Google Scholar] [CrossRef]
Figure 1. A schematic diagram of ultrasonic extraction process. (A) Mixing the aronia fruits with 70% ethanol solvent; (B) ultrasonic extraction with various variables in the range of 20 to 100 kHz of input frequency, 2–6 h of process time and 15–35 °C of process time; (C) centrifugation of the extract at 4200 g for 10 min to remove the solids; and (D) freeze-drying the supernatants.
Applsci 09 01203 g001
Figure 2. 3-D response surfaces (a) and contour plots (b) as a function of ultrasonic frequency, process temperature and time.
Applsci 09 01203 g002
Figure 3. Comparison of High-Pressure Liquid Chromatography (HPLC) chromatograms of C3G in the extract from three different extraction conditions: (a) standard C3G, (b) conventional extraction by a juice extractor, and (c) optimal extraction condition.
Applsci 09 01203 g003
Figure 4. Comparison of antioxidant activities of the extracts from optimized ultrasonic process, juice extraction, and pure C3G, along with ascorbic acid as a positive control.
Applsci 09 01203 g004
Table 1. Results of estimating C3G contents in the extracts by the central composite experimental design.
VariablesLevel
−2−1012
Extraction Time X1 (h)23456
Temperature X2 (°C)1520253035
Frequency X3 (kHz)20406080100
VariablesCoded VariablesUncoded Variables
X1X2X3X1X2X3Y (mg/g)
11105206012.88 ± 1.07
2111530809.19 ± 2.31
31225351006.32 ± 1.50
40−104206012.55 ± 3.45
501−1430408.75 ± 2.04
60−2−24152010.23 ± 3.73
7−11−1330408.38 ± 1.52
8−1013258010.23 ± 2.50
9−1223351006.01 ± 2.82
10−2−2−22152010.89 ± 2.77
11−2122301008.02 ± 3.38
12−2−102206010.48 ± 3.39
132226351006.45 ± 0.71
142−2261510011.82 ± 3.85
1520−1625409.99 ± 1.17
161−2−25152010.16 ± 2.02
170224351005.35 ± 2.88
18−1−2−23152011.32 ± 3.00
19−22−1235405.4 ± 1.09
202−1−26202010.92 ± 4.28
Table 2. Results of analysis of variance for C3G contents in the extracts of aronia.
Factor 1DF 2Sum of SquaresF-Value
X111.3530.63
X21889.0851.47 **,3
X313691.54.07 *,3
1X1, Process time (hr); X2, Temperature (°C); X3, Frequency (kHz). 2 DF: degree of freedom. 3* Significant at p < 0.05, ** Significant at p < 0.001.
Table 3. The results of estimating regression coefficients of the second order polynomials for C3G contents in the extracts.
Parameter 1DF 2Coefficientt-Valuep-Value
Intercept1−6.19705−0.9220
X110.943781.0610.014
X211.818712.2720.005
X31−0.12436−0.9960.009
X1·X11−0.00673−0.0580.001
X2·X21−0.04127−2.7220.087
X3·X31−0.00083−1.6020.370
X1·X21−0.09196−1.7030.819
X1·X310.026411.9820.126
X2·X310.005221.7600.109
R2 = 0.956
1X1, Process time (hr); X2, Temperature (°C); X3, Frequency (kHz). 2 DF: degree of freedom
Table 4. Comparison of predicted and experimented values of response variables operated under an optimal extraction condition.
Dependent VariablesResponse Variables
Time
(h)
Temperature
(°C)
Frequency
(kHz)
Predicted Value
(mg/g)
Experimental Value
(mg/g)
6.018.875.013.7013.01 ± 2.62

