Altitudinal Shift of Tetrao urogallus in an Alpine Natura 2000 Site: Implications for Habitat Restoration

 ,
,  ,
,  ,
,
Abstract
:Featured Application
Abstract
1. Introduction
2. Materials and Methods
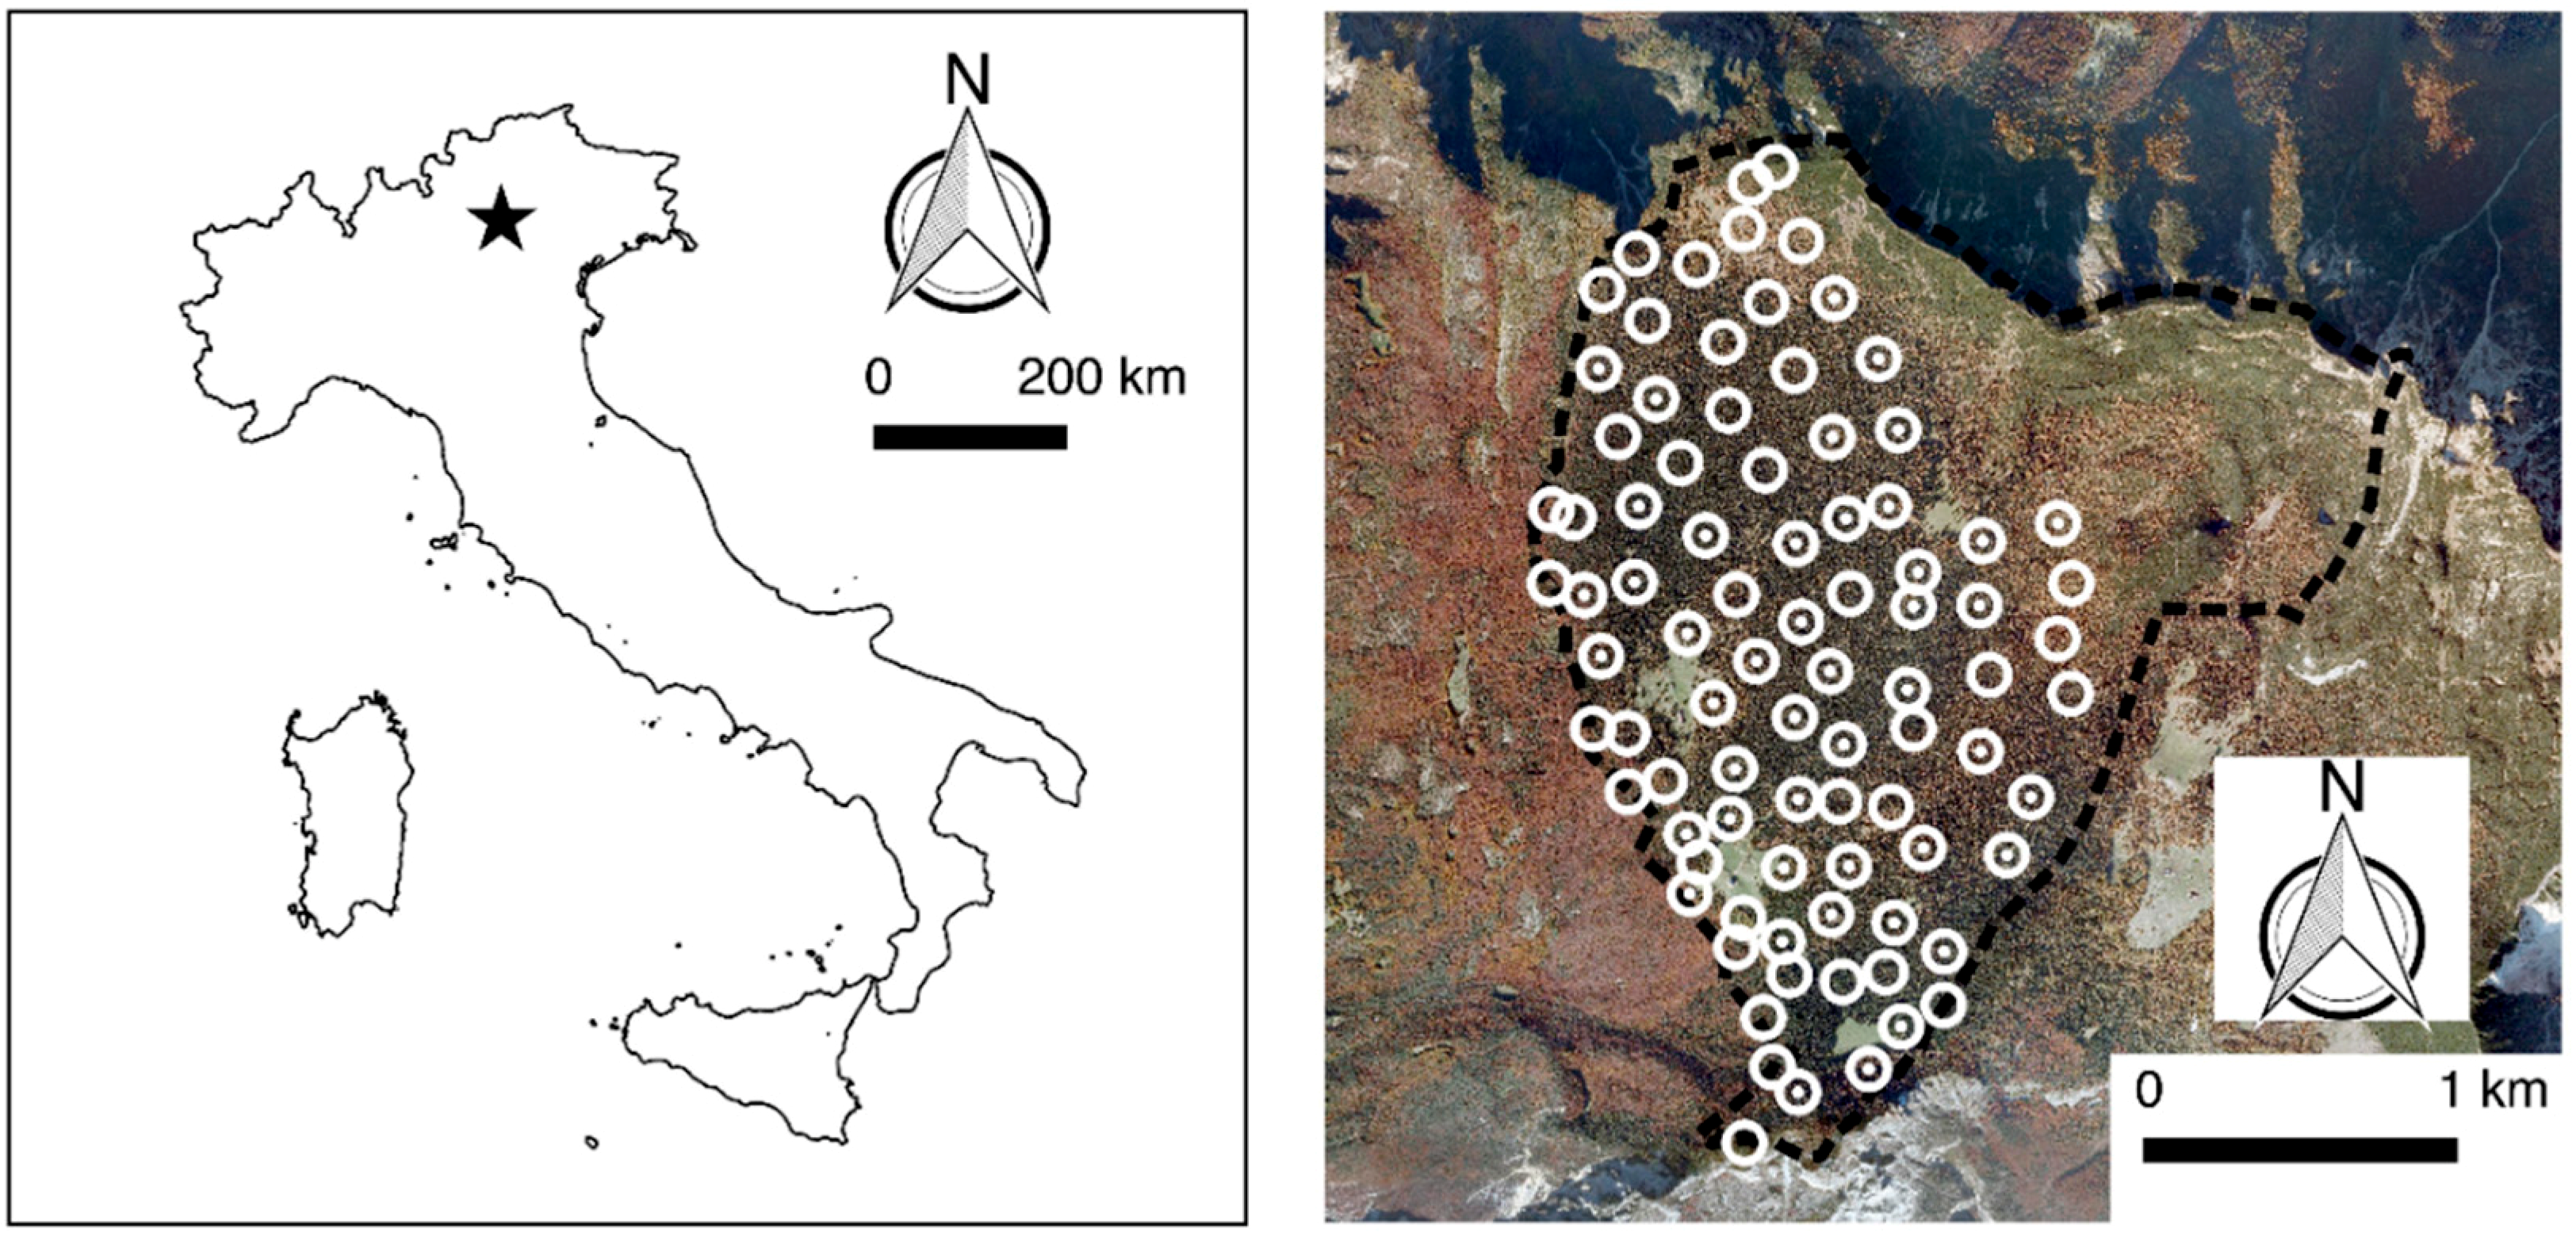
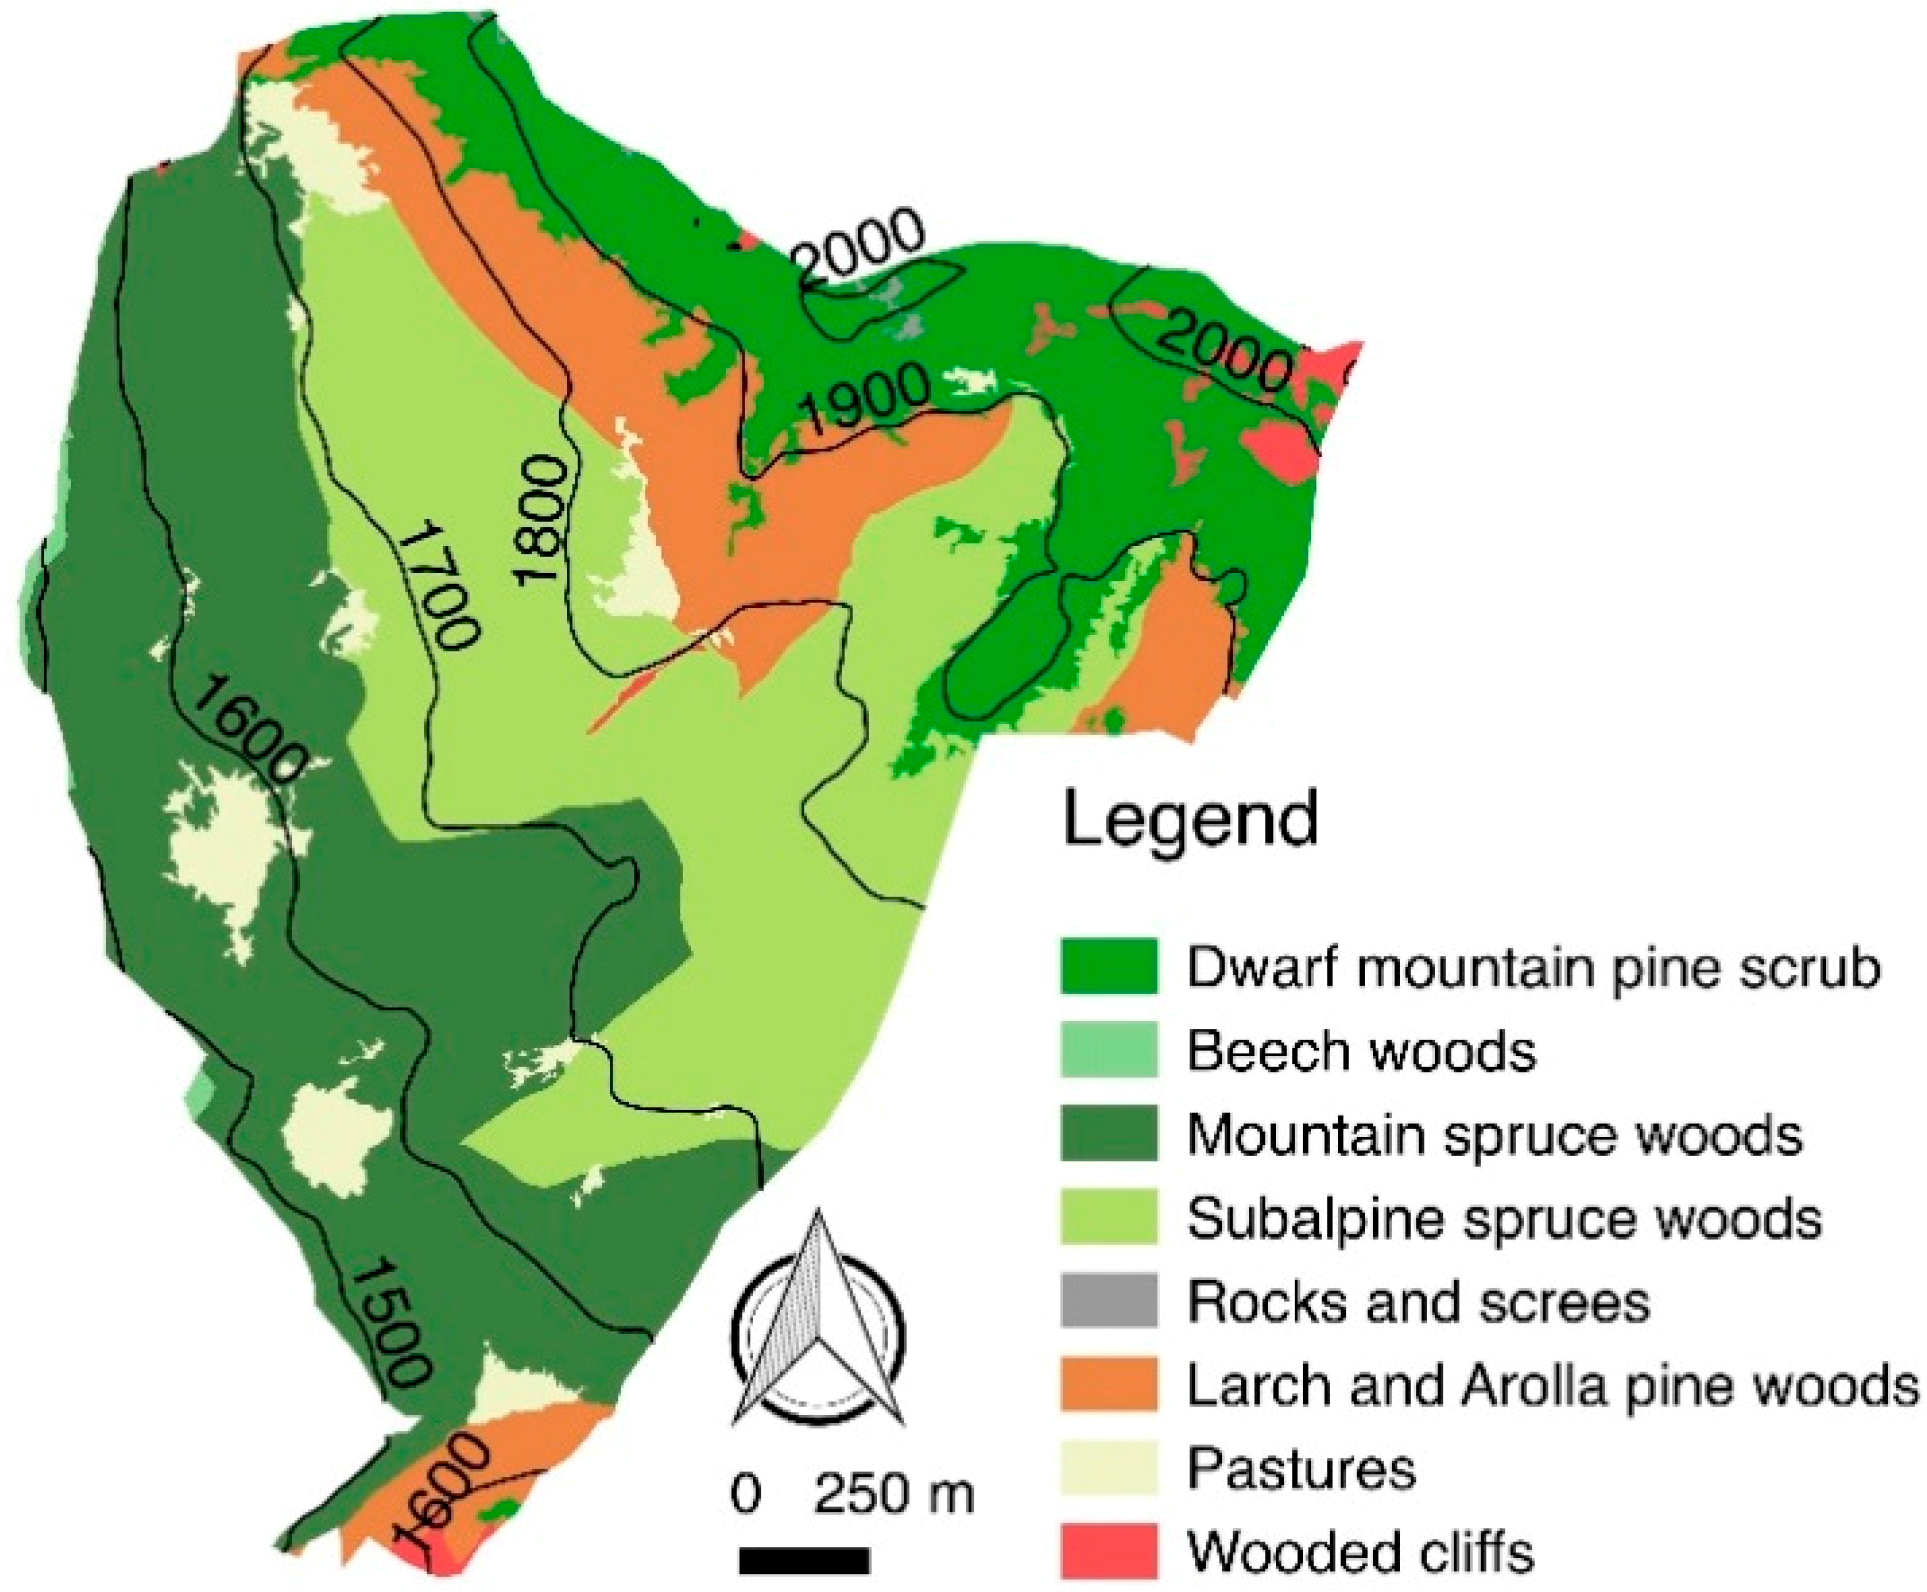
2.1. Study Area
2.2. Data Collection
2.3. Data Analysis
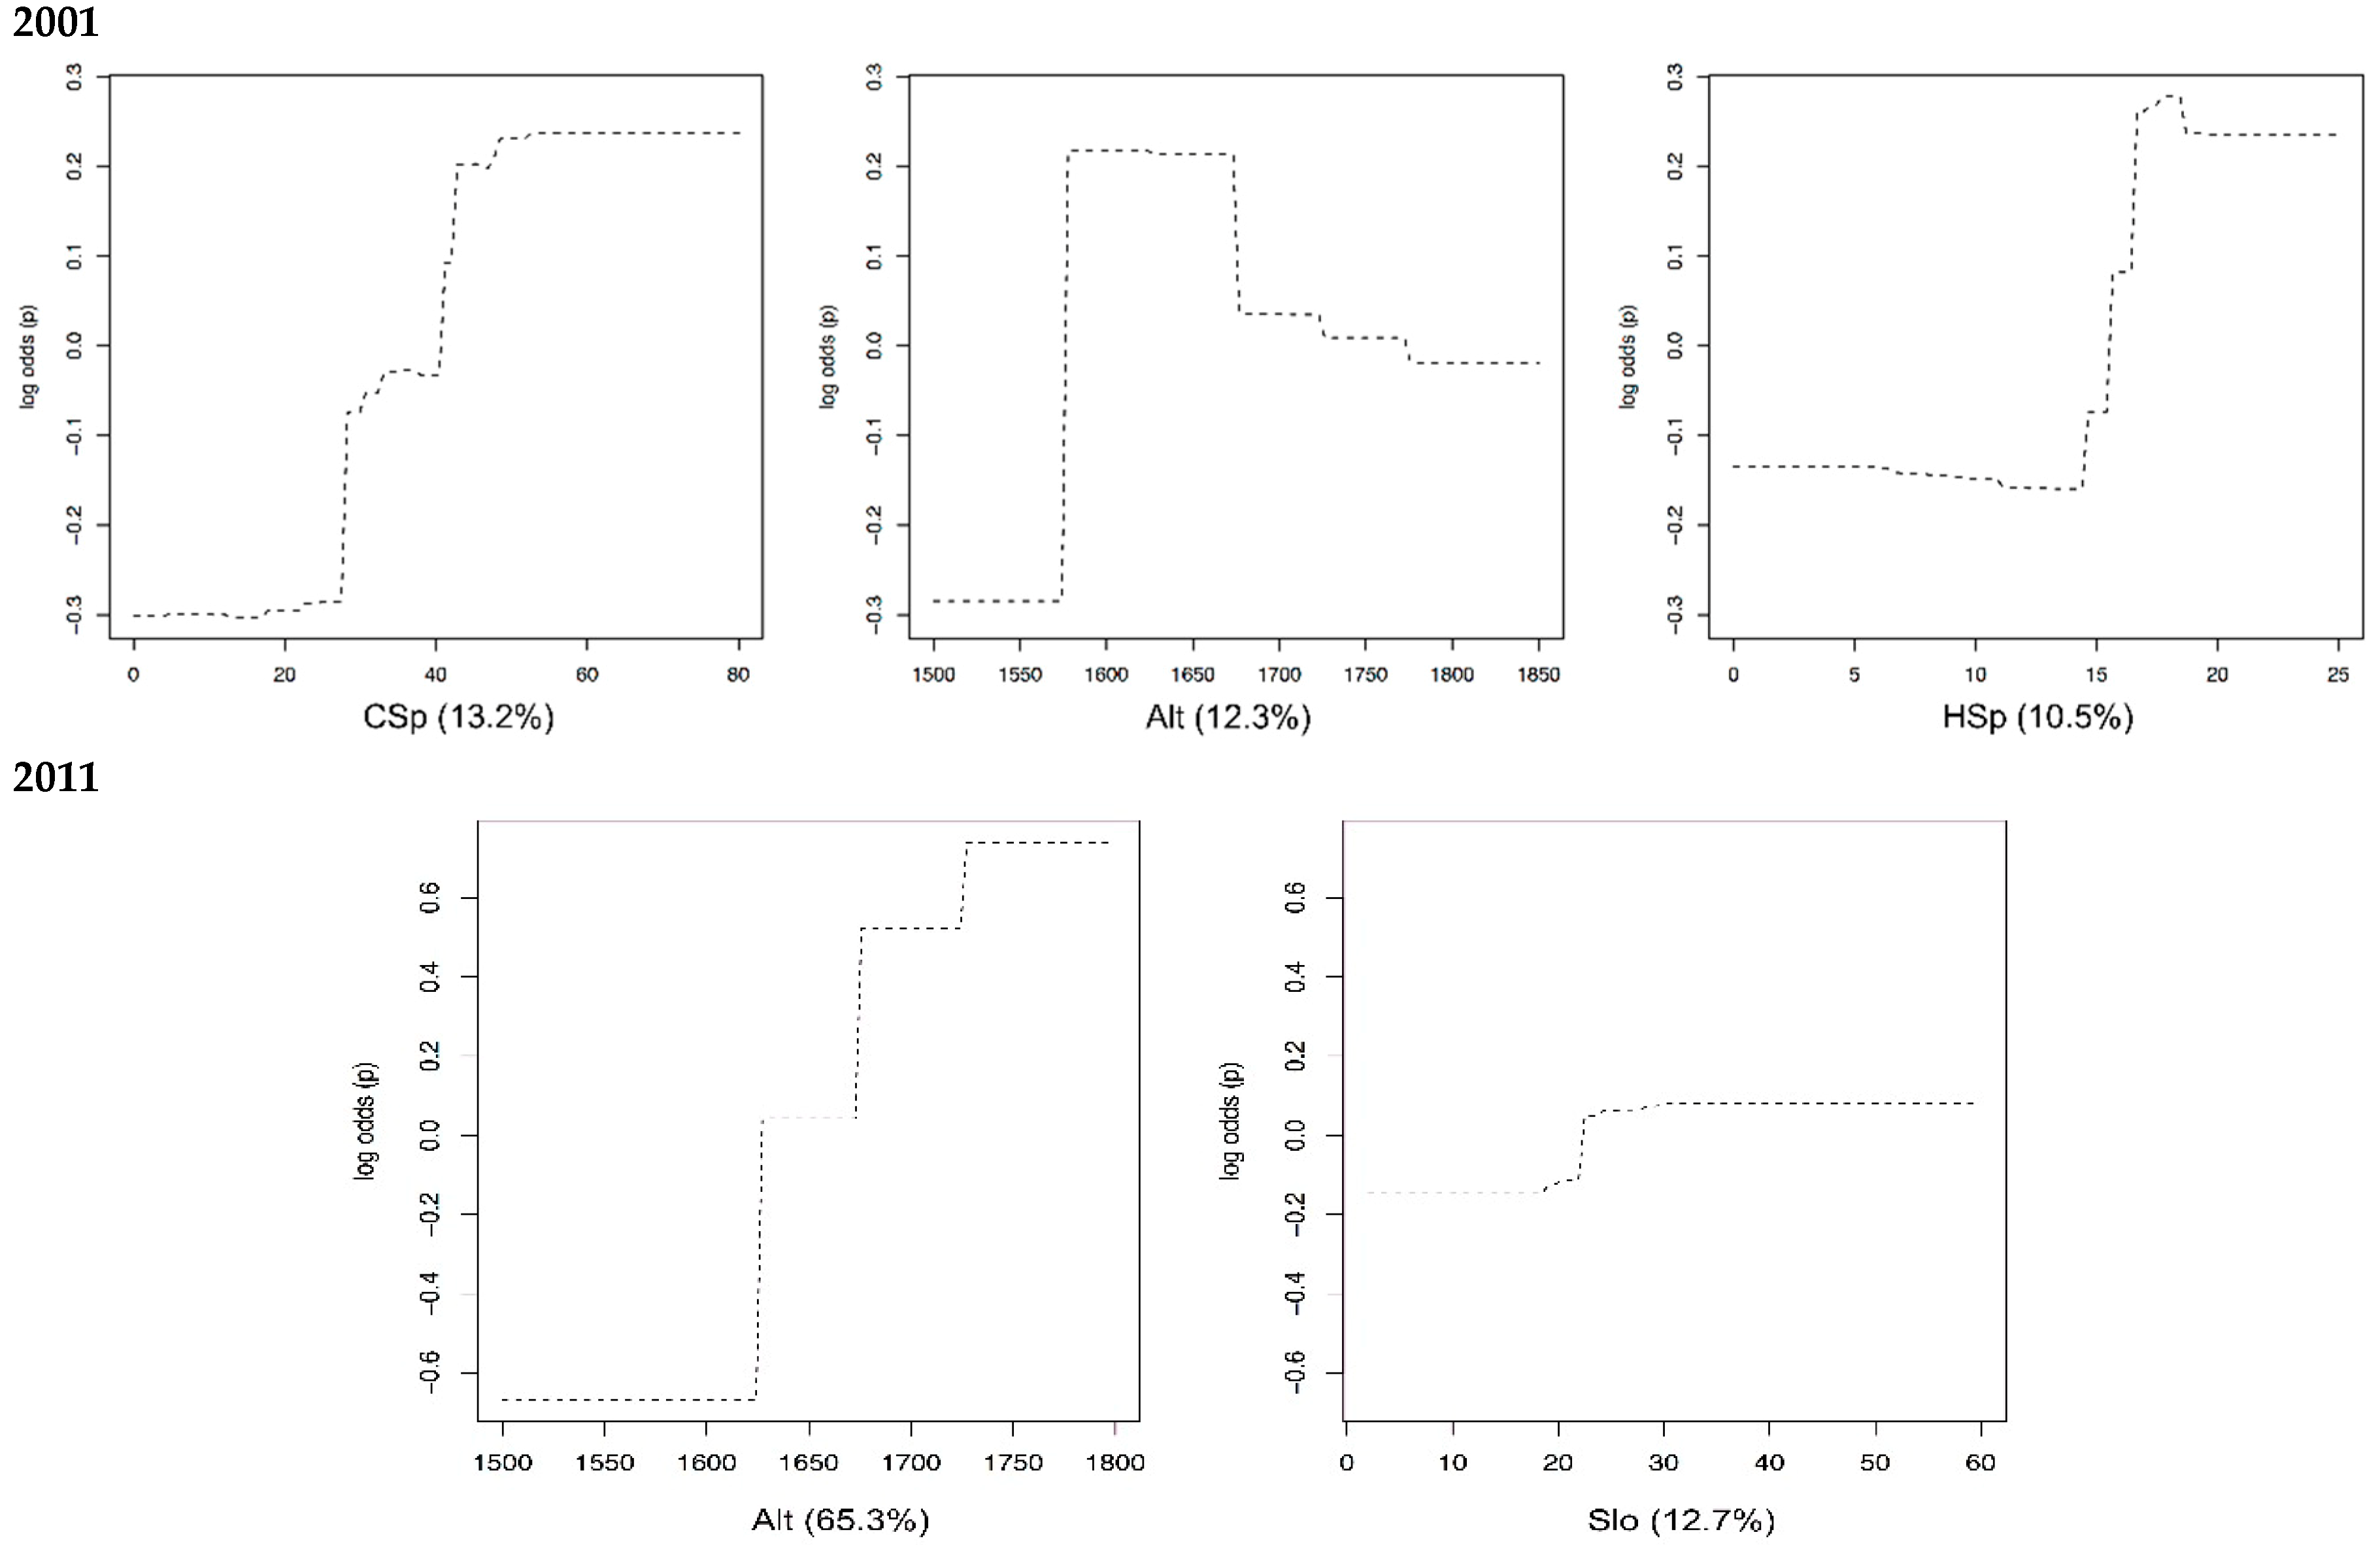
3. Results
4. Discussion
4.1. Species-Habitat Relationships
4.2. Management Implications
4.3. Conclusions and Further Research
Author Contributions
Funding
Acknowledgments
Conflicts of Interest
References
- Hulme, P.E. Adapting to climate change: Is there scope for ecological management in the face of a global threat? J. Appl. Ecol. 2005, 42, 784–794. [Google Scholar] [CrossRef]
- Lehsten, V.; Sykes, M.T.; Scott, A.V.; Tzanopoulos, J.; Kallimanis, A.; Mazaris, A.; Verburg, P.H.; Schulp, C.J.E.; Potts, S.G.; Vogiatzakis, I. Disentangling the effects of land-use change, climate and CO2 on projected future European habitat types. Glob. Ecol. Biogeogr. 2015, 24, 653–663. [Google Scholar] [CrossRef]
- Gehrig-Fasel, J.; Guisan, A.; Zimmermann, N.E. Tree line shifts in the Swiss Alps: Climate change or land abandonment? J. Veg. Sci. 2007, 18, 571–582. [Google Scholar] [CrossRef]
- Körner, C. The use of ‘altitude’ in ecological research. Trends Ecol. Evol. 2007, 22, 569–574. [Google Scholar] [CrossRef] [PubMed]
- Sitzia, T.; Semenzato, P.; Trentanovi, G. Natural reforestation is changing spatial patterns of rural mountain and hill landscapes: A global overview. For. Ecol. Manag. 2010, 259, 1354–1362. [Google Scholar] [CrossRef]
- Campagnaro, T.; Frate, L.; Carranza, M.L.; Sitzia, T. Multi-scale analysis of alpine landscapes with different intensities of abandonment reveals similar spatial pattern changes: Implications for habitat conservation. Ecol. Indic. 2017, 74, 147–159. [Google Scholar] [CrossRef]
- Suter, W.; Graf, R.F.; Hess, R. Capercaillie (Tetrao urogallus) and avian biodiversity: Testing the umbrella-species concept. Conserv. Biol. 2002, 16, 778–788. [Google Scholar] [CrossRef]
- Storch, I. Annual home ranges and spacing patterns of capercaillie in Central Europe. J. Wildl. Manag. 1995, 59, 392–400. [Google Scholar] [CrossRef]
- Bollmann, K.; Jenni, L.; Perrin, N.; Suter, W. Naturschutzforschung am Auerhuhn in der Schweiz: Eine Übersicht. Der Ornithologische Beobachter 2008, 105, 5–16. [Google Scholar]
- Rolstad, J.; Wegge, P. Capercaillie Tetrao urogallus populations and modern forestry—A case for landscape ecological studies. Finn. Game Resour. 1989, 46, 43–52. [Google Scholar]
- Graf, R.F.; Bollmann, K.; Suter, W.; Bugmann, H. The importance of spatial scale in habitat models: Capercaillie in the Swiss Alps. Landsc. Ecol. 2005, 20, 703–717. [Google Scholar] [CrossRef]
- Bollmann, K.; Weibel, P.; Graf, R.F. An analysis of central Alpine capercaillie spring habitat at the forest stand scale. For. Ecol. Manag. 2005, 215, 307–318. [Google Scholar] [CrossRef]
- Storch, I. Habitat and survival of capercaillie Tetrao urogallus nests and broods in the Bavarian Alps. Biol. Conserv. 1994, 70, 237–243. [Google Scholar] [CrossRef]
- Summers, R.W.; Proctor, R.; Thorton, M.; Avey, G. Habitat selection and diet of the Capercaillie Tetrao urogallus in Abernethy Forest, Strathspey, Scotland. Bird Study 2004, 51, 58–68. [Google Scholar] [CrossRef]
- Bollmann, K.; Graf, R.F.; Suter, W. Quantitative predictions for patch occupancy of capercaillie in fragmented habitats. Ecography 2011, 34, 276–286. [Google Scholar] [CrossRef]
- Storch, I. Habitat selection by capercaillie in summer and autumn: Is bilberry important? Oecologia 1993, 95, 257–265. [Google Scholar] [CrossRef] [PubMed]
- Angelstam, P. Habitat thresholds and effects of forest landscape change on the distribution and abundance of black grouse and capercaillie. Ecol. Bull. 2004, 51, 173–187. [Google Scholar]
- Baines, D.; Aebischer, N.J.; Macleod, A. Increased mammalian predators and climate change predict declines in breeding success and density of Capercaillie Tetrao urogallus, an old stand specialist, in fragmented Scottish forests. Biodivers. Conserv. 2016, 25, 2171–2186. [Google Scholar] [CrossRef]
- Mikoláš, M.; Tejkal, M.; Kuemmerle, T.; Griffiths, P.; Svoboda, M.; Hlásny, T.; Leitão, P.J.; Morrissey, R.C. Forest management impacts on capercaillie (Tetrao urogallus) habitat distribution and connectivity in the Carpathians. Landsc. Ecol. 2017, 32, 163–179. [Google Scholar] [CrossRef]
- Wegge, P.; Rolstad, J. Clearcutting forestry and Eurasian boreal forest grouse: Long-term monitoring of sympatric capercaillie Tetrao urogallus and black grouse T. tetrix reveals unexpected effects on their population performances. For. Ecol. Manag. 2011, 261, 1520–1529. [Google Scholar] [CrossRef]
- Tudoroiu, M.; Eccel, E.; Gioli, B.; Gianelle, D.; Schume, H.; Genesio, L.; Miglietta, F. Negative elevation-dependent warming trend in the Eastern Alps. Environ. Res. Lett. 2016, 11, 044021. [Google Scholar] [CrossRef]
- Cattadori, I.; Hudson, P. Are grouse populations unstable at the southern end of their range? Wildl. Biol. 2000, 6, 213–218. [Google Scholar] [CrossRef]
- Segelbacher, G.; Storch, I. Capercaillie in the Alps: Genetic evidence of metapopulation structure and population decline. Mol. Ecol. 2002, 11, 1669–1677. [Google Scholar] [CrossRef] [PubMed]
- Campagnaro, T.; Sitzia, T.; Bridgewater, P.; Evans, D.; Ellis, E.C. Half earth or whole earth: What can natura 2000 teach us? BioScience 2019, 69, 117–124. [Google Scholar] [CrossRef]
- P.A.T. Piano di assestamento dei beni silvo-pastorali—Riserva Naturale Guidata della Scanuppia, validità 2006–2015; Ufficio Pianificazione e Selvicoltura, Provincia Autonoma di Trento: Trento, Italy, 2007. [Google Scholar]
- Sitzia, T.; Trentanovi, G. Maggengo meadow patches enclosed by forests in the Italian Alps: Evidence of landscape legacy on plant diversity. Biodivers. Conserv. 2011, 20, 945–961. [Google Scholar] [CrossRef]
- Poggenburg, C.; Nopp-Mayr, U.; Coppes, J.; Sachser, F. Shit happens … and persists: Decay dynamics of capercaillie (Tetrao urogallus L.) droppings under natural and artificial conditions. Eur. J. Wildl. Res. 2018, 64, 29. [Google Scholar] [CrossRef]
- Zwickel, F.; Bendell, J. Blue Grouse: Their Biology and Natural History; National Research Council of Canada: Ottawa, ON, Canada, 2004.
- Wilkinson, N.I.; Langston, R.H.W.; Gregory, R.D.; Gibbons, D.W.; Marquiss, M. Capercaillie Tetrao urogallus abundance and habitat use in Scotland, in winter 1998–99. Bird Study 2002, 49, 177–185. [Google Scholar] [CrossRef]
- Thiel, D.; Ménoni, E.; Brenot, J.-F.; Jenni, L. Effects of recreation and hunting on flushing distance of capercaillie. J. Wildl. Manag. 2007, 71, 1784–1792. [Google Scholar] [CrossRef]
- Compton, T.J.; Bowden, D.A.; Roland, P.C.; Hewitt, J.E.; Ellis, N. Biophysical patterns in benthic assemblage composition across contrasting continental margins off New Zealand. J. Biogeogr. 2013, 40, 75–89. [Google Scholar] [CrossRef]
- Fern, R.R.; Morrison, M.L. Mapping critical areas for migratory songbirds using a fusion of remote sensing and distributional modeling techniques. Ecol. Inform. 2017, 42, 55–60. [Google Scholar] [CrossRef]
- Bae, S.; Reineking, B.; Ewald, M.; Mueller, J. Comparison of airborne lidar, aerial photography, and field surveys to model the habitat suitability of a cryptic forest species—The hazel grouse. Int. J. Remote Sens. 2014, 35, 6469–6489. [Google Scholar] [CrossRef]
- Elith, J.; Leathwick, J.R.; Hastie, T. A working guide to boosted regression trees. J. Anim. Ecol. 2008, 77, 802–813. [Google Scholar] [CrossRef] [PubMed]
- Miettinen, J.; Helle, P.; Nikula, A.; Niemelä, P. Large-scale landscape composition and capercaillie (Tetrao urogallus) density in Finland. Annales Zoologici Fennici 2008, 45, 161–173. [Google Scholar] [CrossRef]
- Trentanovi, G.; Campagnaro, T.; Rizzi, A.; Sitzia, T. Synergies of planning for forests and planning for Natura 2000: Evidences and prospects from northern Italy. J. Nat. Conserv. 2018, 43, 239–249. [Google Scholar] [CrossRef]
- Dormann, C.F.; Elith, J.; Bacher, S.; Buchmann, C.; Carl, G.; Carré, G.; Marquéz, J.R.G.; Gruber, B.; Lafourcade, B.; Leitão, P.J.; et al. Collinearity: A review of methods to deal with it and a simulation study evaluating their performance. Ecography 2013, 36, 27–46. [Google Scholar] [CrossRef]
- Elith, J.; Graham, C.H.; Anderson, R.P.; Dudík, M.; Ferrier, S.; Guisan, A.; Hijmans, R.J.; Huettmann, F.; Leathwick, J.R.; Lehmann, A.; et al. Novel methods improve prediction of species’ distributions from occurrence data. Ecography 2006, 29, 129–151. [Google Scholar] [CrossRef]
- Ridgeway, G. Gbm: Generalized Boosted Regression Models. R Package Version 2.1.1. 2015. Available online: http://CRAN.R-project.org/package=gbm (accessed on 21 July 2015).
- R Core Team. R: A Language and Environment for Statistical Computing; R Foundation for Statistical Computing: Wien, Austria, 2013. [Google Scholar]
- Spidsø, T.K.; Stuen, O.H. Food selection by capercaillie chicks in southern Norway. Can. J. Zool. 1988, 66, 279–283. [Google Scholar] [CrossRef]
- Broome, A.; Connolly, T.; Quine, C.P. An evaluation of thinning to improve habitat for capercaillie (Tetrao urogallus). For. Ecol. Manag. 2014, 314, 94–103. [Google Scholar] [CrossRef]
- Borgo, A. Gallo cedrone Tetrao urogallus. In Carta Delle Vocazioni Faunistiche del Veneto; Bon, F., Mezzavilla, F., Scarton, F., Eds.; Regione del Veneto e Associazione Faunisti Veneti: Venezia Mestre, Italy, 2013; pp. 373–384. [Google Scholar]
- Montané, F.; Guixé, D.; Camprodon, J. Canopy cover and understory composition determine abundance of Vaccinium myrtillus L., a key plant for capercaillie (Tetrao urogallus), in subalpine forests in the Pyrenees. Plant Ecol. Divers. 2016, 9, 187–198. [Google Scholar] [CrossRef]
- Baines, D.; Wilson, I.A.; Beeley, G. Timing of breeding in Black Grouse Tetrao tetrix and Capercaillie Tetrao urogallus and distribution of insect food for the chicks. Ibis 1996, 138, 181–187. [Google Scholar] [CrossRef]
- Mikoláš, M.; Svitok, M.; Tejkal, M.; Leitão, P.J.; Morrissey, R.C.; Svoboda, M.; Seedre, M.; Fontaine, J.B. Evaluating forest management intensity on an umbrella species: Capercaillie persistence in central Europe. For. Ecol. Manag. 2015, 354, 26–34. [Google Scholar] [CrossRef]
- Campagnaro, T.; Trentanovi, G.; Sitzia, T. Identifying habitat type conservation priorities under the Habitats Directive: Application to two Italian biogeographical regions. Sustainability 2018, 10, 1189. [Google Scholar] [CrossRef]
- De Franceschi, P.F. Pianificazione e gestione delle risorse faunistiche; Ministero dell’Ambiente, Azienda Regionale delle Foreste del Veneto: Padova, Italy, 1993. [Google Scholar]
- De Franceschi, P.F. Strategie di gestione dei Tetraonidi sulle Alpi Italiane: Il Fagiano di monte (Tetrao tetrix). Supplemento alle Ricerche di Biologia della Selvaggina 1995, 22, 725–738. [Google Scholar]
- Odasso, M.; Mayr, S.; De Franceschi, P.F.; Zorzi, S.; Mattedi, S. Miglioramenti ambientali a fini faunistici: Localizzazione delle zone, priorità e modalità gestionali per interventi a favore di Lepre comune, Fagiano di monte, Coturnice e Re di quaglie; Provincia, Assessorato all’ Agricoltura e alla Montagna, Servizio Faunistico: Trento, Italy, 2002. [Google Scholar]
- Masutti, L.; Battisti, A. La gestione forestale per la conservazione degli habitat della Rete Natura 2000; Regione del Veneto, Accademia Italiana di Scienze Forestali: Venezia, Italy, 2007. [Google Scholar]
- Brugnoli, A.; Giovannini, G. Arbusteti della fascia subalpina ed interventi per la fauna in Trentino. L’Italia Forestale e Montana 2009, 64, 15–24. [Google Scholar] [CrossRef]
- Saniga, M. Ecology of the capercaillie (Tetrao urogallus) and forest management in relation to its protection in the West Carpathians. J. For. Sci. 2003, 49, 229–239. [Google Scholar] [CrossRef]
- Sitzia, T.; Campagnaro, T.; Grigolato, S. Ecological risk and accessibility analysis to assess the impact of roads under Habitats Directive. J. Environ. Plan. Manag. 2016, 59, 2251–2271. [Google Scholar] [CrossRef]
- Grimm, V.; Storch, I. Minimum viable population size of capercaillie Tetrao urogallus: Results from a stochastic model. Wildl. Biol. 2000, 6, 219–225. [Google Scholar] [CrossRef]
- Graf, R.F.; Bollmann, K.; Sachot, S.; Suter, W.; Bugmann, H. On the generality of habitat distribution models: A case study of capercaillie in three Swiss regions. Ecography 2006, 29, 319–328. [Google Scholar] [CrossRef]
- Chirichella, R.; Mustoni, A.; Apollonio, M. Alpine landscape and canopy cover from 1973 to 2011: Are roe and red deer population dynamics linked? Wildl. Res. 2017, 44, 504–513. [Google Scholar] [CrossRef]
- Oja, R.; Pass, E.; Soe, E.; Ligi, K.; Anijalg, P.; Laurimaa, L.; Saarma, U.; Lõhmus, A.; Valdmann, H. Increased nest predation near protected capercaillie leks: A caveat against small reserves. Eur. J. Wildl. Res. 2018, 64, 6. [Google Scholar] [CrossRef]
- Jim-Lino, K.; Joy, C.; Simone, C.; Rudi, S.; Ilse, S. Range loss of a threatened grouse species is related to the relative abundance of a mesopredator. Ecosphere 2017, 8, e01934. [Google Scholar]

| Variable Description | Classes and Abbreviations |
|---|---|
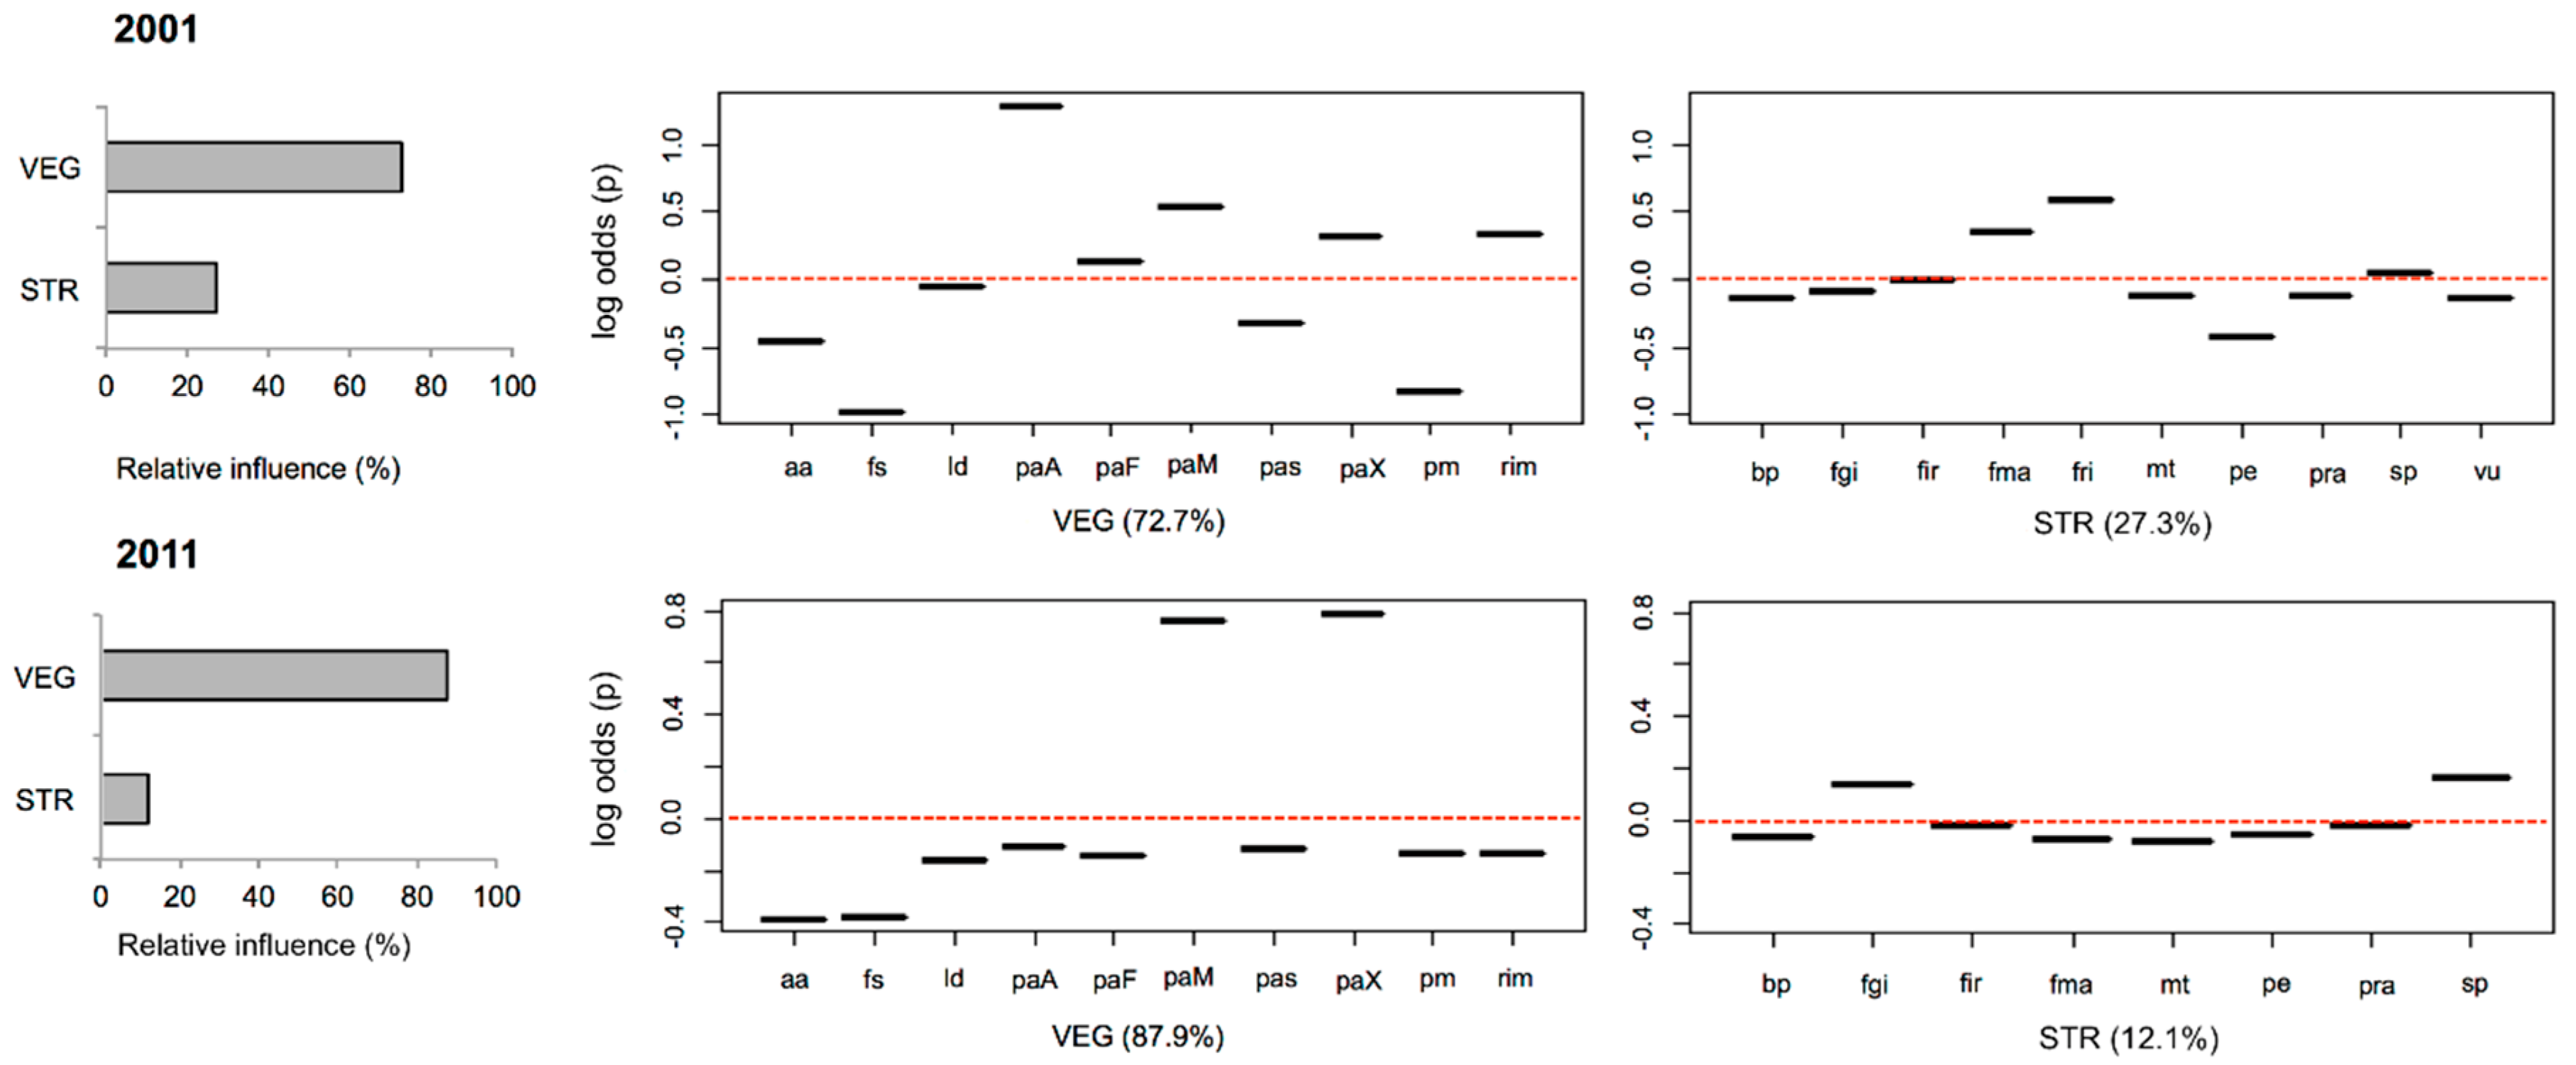
| Habitat type (canopy composition) (VEG) | (1) silver fir (aa); (2) beech (fs); (3) larch (ld); (4) spruce and fir (paA); (5) spruce and beech (paF); (6) spruce on moist soil (paM); (7) spruce on dry soil (paX); (8) pasture (pas); (9) mountain pine (pm); (10) tree plantation (rim) |
| Habitat structure (development stage) (STR) | (1) two-layered stand (bp); (2) adult stand (fad); (3) late pole stand (fgi); (4) irregular stand (fir); (5) mature stand (fma); (6) over-mature stand (fri); (7) multi-layered stand (mt); (8) young pole stand (pe); (9) wooded pasture (pra); (10) thicket stand (sp); (11) gap (vu) |
| Variable Description | Abbreviation | Unit |
|---|---|---|
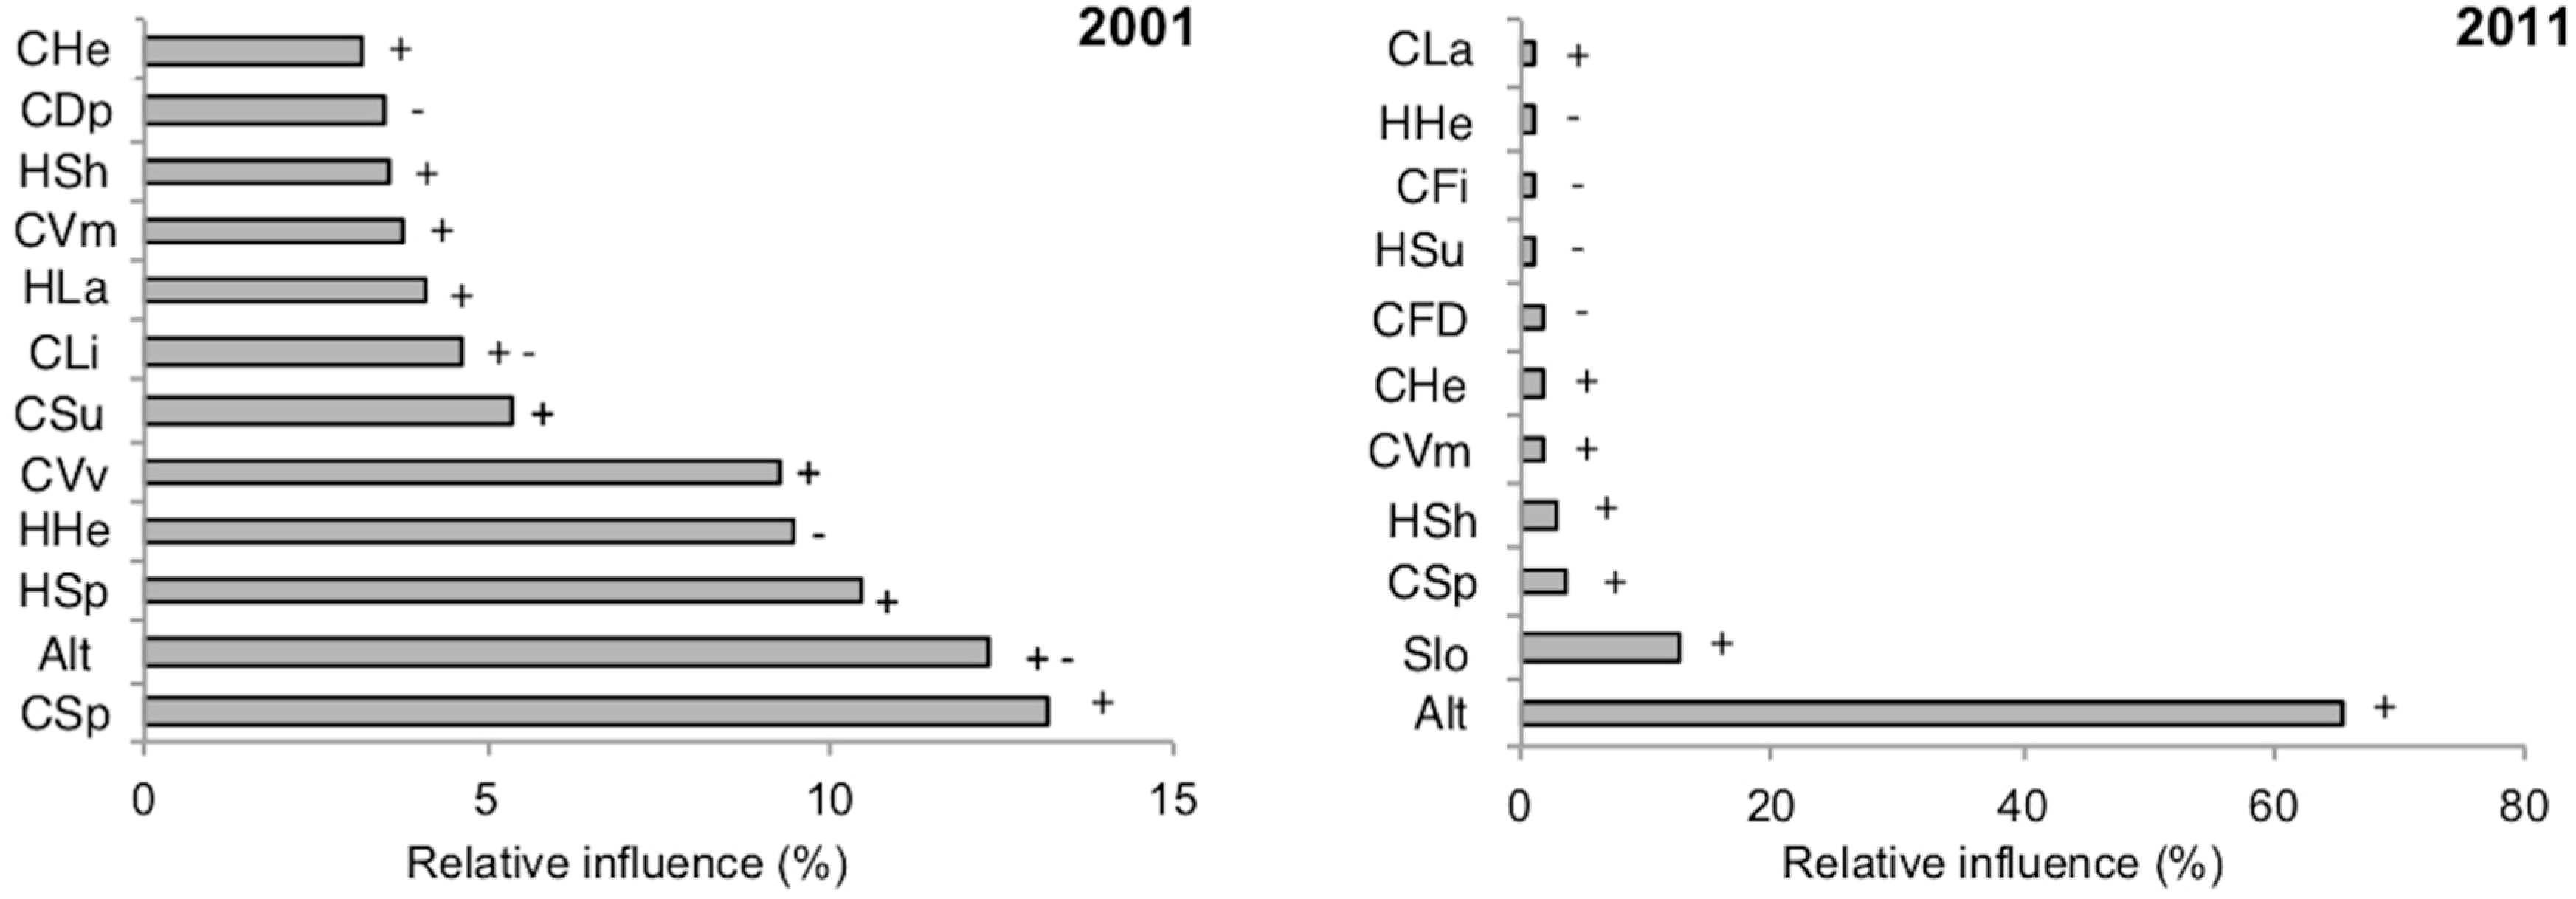
| Altitude | Alt | m a.s.l. |
| Aspect | Asp | cardinal orientations |
| Topographic position | Top | high slope, middle slope, valley, and ridge |
| Slope | Slo | % |
| Cover of beech | CBe | % |
| Cover of common juniper | CJu | |
| Cover of mountain pine | CDp | |
| Cover of silver fir | CFi | |
| Cover of herbaceous layer | CHe | |
| Cover of larch | CLa | |
| Cover of litter | CLi | |
| Cover of Rhododendron ferrugineum | CRf | |
| Cover of spruce | CSp | |
| Cover of dwarf shrubs | CSu | |
| Cover of Vaccinium myrtillus | CVm | |
| Cover of Vaccinium vitis-idea | CVv | |
| Cover of fine deadwood | CFD | |
| Height of trees | HTr | m |
| Height of shrubs | HSh | |
| Height of herbaceous layer | HHe | |
| Height of fir | HFi | |
| Height of larch | HLa | |
| Height of spruce | HSp | |
| Height of dwarf shrubs | HSu | |
| Presence of broadleaf species | PBr | Presence–absence |
| Evidence of silvicultural interventions | SIn | |
| Signs of grazing | SGr |
© 2019 by the authors. Licensee MDPI, Basel, Switzerland. This article is an open access article distributed under the terms and conditions of the Creative Commons Attribution (CC BY) license (http://creativecommons.org/licenses/by/4.0/).
Share and Cite
Sitzia, T.; Campagnaro, T.; Dainese, M.; Dallabrida, F.; Mattedi, S.M.; Portaccio, A. Altitudinal Shift of Tetrao urogallus in an Alpine Natura 2000 Site: Implications for Habitat Restoration. Appl. Sci. 2019, 9, 1164. https://doi.org/10.3390/app9061164
Sitzia T, Campagnaro T, Dainese M, Dallabrida F, Mattedi SM, Portaccio A. Altitudinal Shift of Tetrao urogallus in an Alpine Natura 2000 Site: Implications for Habitat Restoration. Applied Sciences. 2019; 9(6):1164. https://doi.org/10.3390/app9061164
Chicago/Turabian StyleSitzia, Tommaso, Thomas Campagnaro, Matteo Dainese, Francesco Dallabrida, Silvano Mario Mattedi, and Alessia Portaccio. 2019. "Altitudinal Shift of Tetrao urogallus in an Alpine Natura 2000 Site: Implications for Habitat Restoration" Applied Sciences 9, no. 6: 1164. https://doi.org/10.3390/app9061164
APA StyleSitzia, T., Campagnaro, T., Dainese, M., Dallabrida, F., Mattedi, S. M., & Portaccio, A. (2019). Altitudinal Shift of Tetrao urogallus in an Alpine Natura 2000 Site: Implications for Habitat Restoration. Applied Sciences, 9(6), 1164. https://doi.org/10.3390/app9061164